1
70
HypnoLab User Manual
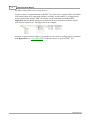
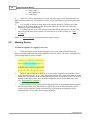
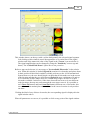
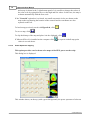
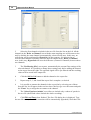
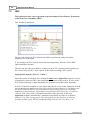
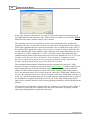
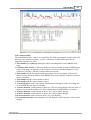
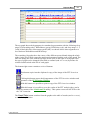
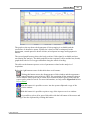
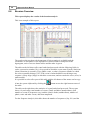
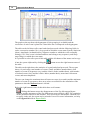
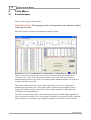
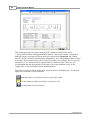
The graph on the top shows the hypnogram (if sleep staging is available) and the
occurrence of each event is plotted as a short blue line overimposed to the hypnogram.
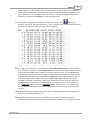
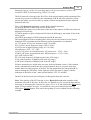
The table on the left shows all events loaded and processed with the following fields, in
order: consecutive number (No.), sleep epoch in which the event starts (Epoch), Start time
(Start), Amplitude (in channel units), Sequence number to which the event eventually
belongs ("iso" if the event is isolated and does not belong to any sequence), and Sleep
stage (Stage) in which the event starts.
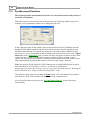
It is possible to select all or part of this table with the left button of the mouse and to copy
it into the system clipboard by clicking the
the table.
button next to the right bottom corner of
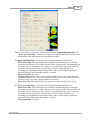
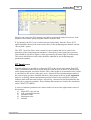
The table on the right shows the statistics of events loaded and processed. The top part
shows, for each stage, total number of events (Total) and Index (number/hour), total
number of events in sequences (seq.) and the relative Index (number/hour), total number
of isolated events (Isol.) and the relative Index (number/hour), mean interval between
events, and mean amplitude.
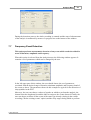
The user can change the maximum interval between events (in seconds) and the minimum
number of events in a sequence; these new values are utilized for the calculation of the
parameters when the Rescore button is clicked.
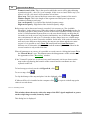
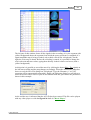
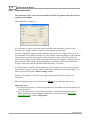
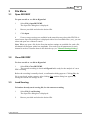
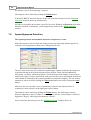
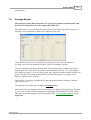
Below the right bottom corner of this table there are 4 buttons:
Clicking this button causes the disappearance of the Eye Movement Report
window and the appearance of the Eye Movement report which is a RTF file containing
all the parameters shown in this window. This report can be edited and a comment can
be typed. At the end, the report can be printed or saved. For more information, see help
on the HypnoLab built-in Report Editor.
© 2006 SWS Soft