1
80
HypnoLab User Manual
11
Additional Items
11.1
FFT Floating Window
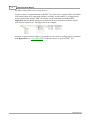
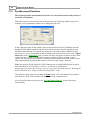
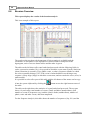
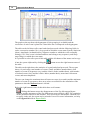
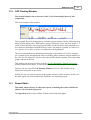
This window displays the results of the whole-night one-channel spectral analysis
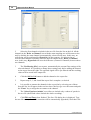
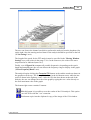
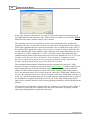
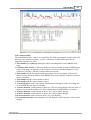
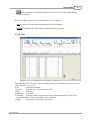
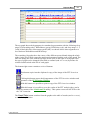
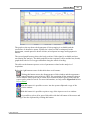
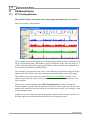
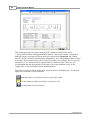
This is an example of this window.
The top graph shows the hypnogram in a standard representation with the following sleep
stages, in descending order: Wakefulness (green), REM sleep (red), and sleep stages 1, 2,
3 and 4 (black thin line). Movement epochs (MT) are shown as blue short segments at a
level between Wakefulness and REM sleep.
The remaining 10 graphs show the course of the different spectral bands along the whole
night. On the left, a label reports the main band parameters and the scale of the graph.
This window can be accessed only from the FFT Overview Window and has a very
similar aspect but much smaller; all the graphs are drawn with the last parameters set in
such a window.
The user can resize the height of the FFT Floating Window in order to include the
desired number of graphs; only the hypnogram is always shown, at the top. The user can
displace this window in any point on the screen and it can be useful, as an example, when
scoring manually sleep.
Finally, the user can click any point of the graphs contained in this window; in this case,
the main signal area will automatically display the corresponding epoch.
© 2006 SWS Soft