1
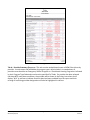
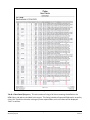
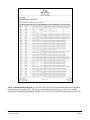
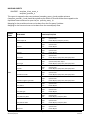
Diagram 5 Tab D – NEW Clients Quarterly Count (Diagram 5): This tab reports the NEW client and household data needed to complete Tab D of the Pulse reporting module, and is laid out to match the Tab D HDX input screen. Data to be transferred into the HDX reporting system is displayed on a white background. Cells that automatically calculated on the HDX input screen are shown on a gray background. Bowman Systems ART Gallery Report Page 7 of 19 0609 – Pulse New Clients version 5