1
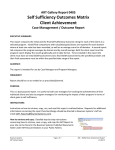
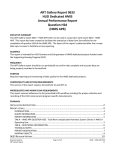
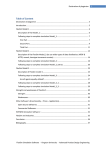
ART Gallery Report 0508
Distribution of Population Entry Scores by Domain
Population-based Self-Sufficiency Outcomes Matrix Report
EXECUTIVE SUMMARY:
This report shows how the self-sufficiency outcomes matrix scores are distributed across the entire
population of clients of a program. Instead of examining on a per-client basis, examining the entire
distribution and its characteristics can lend important insight into the population a program is serving.
Programming can then be tailored to emphasize the needs of the population in specific domains to
help clients on the road to self-sufficiency. The object is therefore to show in which domains of the
matrix clients, as a whole, need the most assistance.
AUDIENCE:
This report is intended for program and agency staff to better understand the needs of the population
they are serving. It is also intended to be shared externally with other agencies in the Continuum of
Care to coordinate with other programs and agencies to help serve the needs of the population. The
information contained within the report can also provide a quantitative picture of the population as
one part of a narrative description.
FREQUENCY:
This report should be run on a regular basis to determine if the addition of new clients changes the
overall needs of the population, but the regularity is dependent upon the rates at which clients enter
and leave the program. Programs with a higher turnover rate should run the report more frequently
than programs with a lower turnover rate. The report values will not change if no new clients are
added and no clients have left.
PURPOSE:
The purpose of the report is to clearly depict the distribution of client entry matrix values in each
domain of the self-sufficiency outcomes matrix (SSOM) through numeric, graphic, and statistical
representation. The report also provides data completeness information so that a program is able to
remedy missing data. A section of the report is devoted to understanding the measures provided so
that program staff may understand the results without prior statistical knowledge. Increased familiarity
with the SSOM population-based reports can also help to understand concepts in more advanced
research and statistics in a more intuitive way. The report can be run for different time periods, so that
programs can see the scores of the current population and compare to past populations to see if the
areas of greatest need are changing.
INSTRUCTIONS:
Bowman Systems
ART Gallery Report
Page 1 of 8
508 – Distribution of Population Entry Scores by Domain
v11.04.13
Instruction on how to retrieve, copy, run, and read this report is outlined below. Requests for
additional information concerning the report function/design should be directed to Bowman Systems’
staff via email ([email protected]).
How to retrieve and copy: Detailed step-by-step instructions concerning
how to retrieve, save a copy, and map this ART Report to your site can be
found in the Bowman Systems Published Documents folder under ART
Documentations in you Public Folders.
How to install: The original version of the report is a template and must be copied from the ART
Gallery Templates folder into another folder on your site and mapped to your data before it can be
used. Detailed instructions for installing report templates are provided in the Bowman Documentation
folder on your ART site.
Before running the report: Prior to running the report the user must determine the provider to be
included in the report and the date back to which assessments should be included.
How to run:
Upon opening the report, the User will be prompted (see Diagram 1) to specify parameters that control
the data returned by the report. Once the User has provided these parameters by responding to the
user prompts, a green check-mark will appear next to each field to indicate that a selection has been
made. The User should then single-click the “Run Query” button to generate the report.
Diagram 1
The three user prompts contained in this report are:
1. Enter Provider for Report: Click the “refresh list” icon and wait for the left window to refresh.
Now select the provider to include by highlighting it in the left window and moving it into the
right window using the right selection arrow.
Bowman Systems
ART Gallery Report
Page 2 of 8
508 – Distribution of Population Entry Scores by Domain
v11.04.13
2. First Assessment Date: The user should enter (or select from the calendar) the date back to
the earliest assessments the user wants to include. Assessments will be included from this date
to the last assessment date. The value selected is retained as the default for the next time the
report is run.
3. Last Assessment Date plus one day: The user should enter (or select from the calendar) the
day after the date of to the latest assessments the user wants to include. Example: If the last
date of the assessments to be included is 9/30/09, the user should enter 10/01/09 at the
prompt. Assessments will be included from the first assessment date to the day before the date
entered. The value selected is retained as the default for the next time the report is run.
How to read: The report contains 4 Tabs. Each Tab is a separate sub-report containing three sections:
•
•
•
Report Header: The header contains the title of the report, and specifies any date parameters.
When running the report in “modify” view, the report header is only visible in print/page layout
mode.
Report Footer: The report footer contains the title of the report, the name of the sub-report,
the page number, the version number, and the date/time the report was run /printed. Like the
header, the footer is only visible in print mode when the report is run in modify view.
Report Body: The Report Body is the main section of the report located between the header
and the footer where the reports data is displayed in a variety of different chart and graph
formats. The data contained in each of the Tabs in this report is displayed and described below:
Bowman Systems
ART Gallery Report
Page 3 of 8
508 – Distribution of Population Entry Scores by Domain
v11.04.13
Diagram 2
Tab A – Frequencies, histogram and statistics (Diagram 2): This tab contains a snapshot of the
distribution of entry scores for each domain. Each domain has its own section, headed by the name of
the domain, in which the information is contained. This includes a numeric picture given by the
frequency of each entry value for clients, a graphic representation of the distribution by an histogram,
and a statistical representation of the distribution of each domain by several measures of central
tendency and dispersion (described below). This tab also includes the program for which the data are
displayed.
•
•
•
Frequencies: For a given domain, the “Frequencies” table shows how many people have an
entry score of 1, how many have an entry score of 2, etc. The number of clients who have a 6,
which is the “Other” category, is included, though those who have a 6 are not included in the
statistical calculations describing the distribution, since the label of 6 is not part of the ordinal
scale on which the other scores are based.
Histogram: A graphic representation of the “Frequencies” table, where the x (horizontal) axis
shows the score (1-6) and the y (vertical) axis shows how many people have an entry score of 1,
how many have an entry score of 2, etc. Again, the number of clients who have a 6, which is the
“Other” category, is included, though those who have a 6 are not included in the statistical
calculations describing the distribution, since the label of 6 is not part of the ordinal scale on
which the other scores are based.
Basic domain statistics: These measures provide a statistical means of describing the
distribution of each domain so that they can be more easily summarized and compared.
Measures of central tendency (e.g., mean, median and mode) describe the location of the
Bowman Systems
ART Gallery Report
Page 4 of 8
508 – Distribution of Population Entry Scores by Domain
v11.04.13
center of the distribution, while measures of dispersion (e.g., range, variance and standard
deviation) describe how the distribution is spread out.
Diagram 3
Tab B – Client-level data (Diagram 3): This tab contains: Each domain has its own section, headed by the
name of the domain, in which the information is contained. It shows how many clients have data for
the domain that are included in the statistics in Tab A, how many clients have values of 6 (Other) for
the domain, and how many clients have null data for the domain. This tab also includes the program
for which the data are displayed at the bottom of each domain’s section.
•
•
Client information: Gives the client identification number and the entry score of each client for
the domain. If the entry score is null for a particular client, the cell where the entry score would
be is colored red to draw attention to the missing data. At the bottom of the table is the
number of cases, or the number of clients that have data useable for calculation in the statistics
in Tab A.
Summary data statements: The first statement gives the number of clients out of the total
number of clients who have useable data in the domain for calculations of the statistics in Tab
A. The second statement gives the number of clients who have a value of 6 (Other) for that
domain. The third statement gives the number of clients who have null data for the domain.
Bowman Systems
ART Gallery Report
Page 5 of 8
508 – Distribution of Population Entry Scores by Domain
v11.04.13
Diagram 4
Tab C – Definitions (Diagram 4): This tab contains: A list of terms useful for understanding populationbased reports and an explanation of each term.
Diagram 5
Tab D – Additional Information (Diagram 5): This tab is provided as a reference to the user running the
report and lists the parameters specified in the user prompts, as well as the client count for the
provider.
TECHNICAL NOTES:
1. You must have ART version 2.4.2 or above to run this report, as the matrix universe is not available
in prior ART versions. The ART version number is available in the BusinessObjectsXI window as the
first of the bullet points once you log in to ART.
2. While all data from the matrix are included in the histograms, the data used to calculate the
statistics are limited to answer categories 1-5, omitting the “Other” or “N/A” category. While
technically coded as a “6,” this category has no substantive place in the domain order and is
therefore excluded. If one or more cases in the report are excluded from the calculation of the
statistics because the category is coded as a “6,” an alerter to that effect will appear under the
block that contains the “Number of cases (N)” statistic.
3. When considering null data, be aware that:
a. This report counts a client as null only if that client has an initial matrix where a particular
field is null. If a client has been served during the time period and should have an initial
matrix assessment, but does not, that client is not included in the report and therefore is
not included in the count of null data.
b. Only domains for which data are present will be displayed in the report.
4. In the picklist query, the Picklist List Name should be set to “ART Number Picklist” if you have db
build # 1222 or above. (The db build # is available at the bottom of the ServicePoint screen once
you log in.) This is an un-editable picklist that contains the integers 1-6, which are necessary to run
this report. If your db build # is below 1222, the “Picklist List Name” query filter will show “ART
Number Picklist” but you will not actually have the picklist and the report will not run correctly.
However, you can run the ART report by changing the Picklist List Name through manually selecting
Bowman Systems
ART Gallery Report
Page 6 of 8
508 – Distribution of Population Entry Scores by Domain
v11.04.13
a picklist that contains those integers. The picklist we recommend for these cases is “Grade Level.”
However, since these picklists can be modified, it is important to ensure the picklist contains the
correct integers prior to running the report.
REPORT MODIFICATION
Users with ad-hoc ART licenses may wish to modify/customize this report to better suit their needs and
purposes. When modifying an ART Gallery report such as this one, the user will need to make a copy of
the original report into a different folder. This copy can be created either by using the “save as”
feature or by clicking on the “organize” icon in folder view.
NOTE: The original un-modified version of this report is a template and is retained in ART Gallery
Templates folder structure. These template folders are read-only and any reports must be copied to a
location in the user’s site (Favorites or Public Folders) then mapped to the site’s data.
MAPPING OBJECTS
UNIVERSES: template_matrix_u, template_picklist_u
This report is mapped to the matrix universe (template_matrix_u) and the picklist universe
(picklist_matrix_u). The report should be copied to your Public or Favorite folder then mapped to the
equivalent matrix and picklist universes for your site (ex. yoursite_ matrix_u, yoursite_ picklist_u).
Mapping for the first two queries (data and data1) can be done from the first query (data). Mapping for
the third query (picklist query) must be done from that query.
QUERY NAME
FIELD NAME
Client Id
Matrix Answer Score
Matrix Question Name
data
Matrix Question Id
Matrix Record Id
Matrix Record Type
Matrix Record Provider
Matrix Record Date
Bowman Systems
ART Gallery Report
LOCATION/TYPE/USE
Location: Clients
Type:
System field
Use:
Result object
Location: Matrix Measurements
Type:
System field
Use:
Result object
Location: Matrix Measurements
Type:
System field
Use:
Result object
Location: Matrix Measurements
Type:
System field
Use:
Result object
Location: Matrix Records
Type:
System field
Use:
Result object
Location: Matrix Records
Type:
System field
Use:
Result object
Location: Matrix Records
Type:
System field
Use:
Result object
Location: Matrix Records
Type:
System field
Page 7 of 8
508 – Distribution of Population Entry Scores by Domain
v11.04.13
Matrix Answer Short Description
Client Id
data1
Matrix Record Provider
Matrix Record Date
Matrix Record Type
Picklist Value Name
picklist query
Picklist List Name
Bowman Systems
ART Gallery Report
Use:
Location:
Type:
Use:
Location:
Type:
Use:
Location:
Type:
Use:
Location:
Type:
Use:
Location:
Type:
Use:
Location:
Type:
Use:
Location:
Type:
Use:
Page 8 of 8
Result object
Matrix Measurements
System field
Result object
Clients
System field
Result object
Matrix Records
System field
Query filter
Matrix Records
System field
Query filter
Matrix Records
System field
Query filter
Picklists
System field
Result object
Picklists
System field
Query filter
508 – Distribution of Population Entry Scores by Domain
v11.04.13