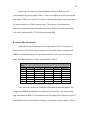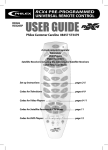
1
Distribution Agreement In presenting this thesis or dissertation as a partial fulfillment of the requirements for an advanced degree from Emory University, I hereby grant to Emory University and its agents the non-exclusive license to archive, make accessible, and display my thesis or dissertation in whole or in part in all forms of media, now or hereafter known, including display on the world wide web. I understand that I may select some access restrictions as part of the online submission of this thesis or dissertation. I retain all ownership rights to the copyright of the thesis or dissertation. I also retain the right to use in future works (such as articles or books) all or part of this thesis or dissertation. Signature: Grace E Lee ______________ Date Predicting Body Burden of Polybrominated Diphenyl Ethers in Children Aged 15 Months to 5 Years Using Household Dust and Handwipe Levels and Selected Demographic Variables By Grace Evelyn Lee MPH Environmental Health Dana Boyd Barr, Ph.D. Committee Chair __________________________________________________________ Paige Tolbert, Ph.D. Committee Member Predicting Body Burden of Polybrominated Diphenyl Ethers in Children Aged 15 Months to 5 Years Using Household Dust and Handwipe Levels and Selected Demographic Variables By Grace Evelyn Lee B.A. Kenyon College 2009 Thesis Committee Chair: Dana Boyd Barr, Ph.D. An abstract of A thesis submitted to the Faculty of the Rollins School of Public Health of Emory University in partial fulfillment of the requirements for the degree of Master of Public Health in Environmental Health 2013 Abstract Predicting Body Burden of Polybrominated Diphenyl Ethers in Children Aged 15 Months to 5 Years Using Household Dust and Handwipe Levels and Selected Demographic Variables By Grace Evelyn Lee Polybrominated diphenyl ethers (PBDEs) are a class of brominated flame retardants that are ubiquitous in the environment and in human biological samples. Despite bans on two of the three major commercial mixtures of PBDEs, the United States has the highest serum concentrations in the world due to historically high use. PBDEs are known endocrine modulators and have been linked to numerous neurodevelopmental and behavioral disabilities. Studies have suggested that children may be particularly sensitive to PBDE exposures. Simultaneously, they may have serum concentrations up to 10-fold higher than adults. Few studies have looked at individual child serum levels or attempted to correlate them with environmental matrices. The aim of this study was to determine child serum, handwipe and household dust levels of PBDEs for a group of demographically diverse children. Blood samples were obtained from 81 children enrolled at the Children’s Hospital of Atlanta (CHOA) while undergoing a routine surgery. At a later date, a subset of participants had household dust (n=15) and handwipes (n=13) collected. Serum, dust, and handwipes were extracted and the concentrations of six congeners (BDE-47, -85, -99, -100, -153, -154) and ΣPBDE determined in-house by GC/MSD analysis. BDE-47 and -99 were dominant congeners in all three matrices. In serum, significant associations were found between sex and BDE-47 and ΣPBDE, race and BDE-100, breastfeeding history and BDE-47, and BMI and BDE-153. Handwipe and serum were correlated for BDE-47 and ΣPBDE, suggesting that handwipes may be a good personal exposure measure for the Penta DBE mixture. To date, only one other study has investigated child serum, child handwipes, and household dust in the same individuals for PBDEs. Additionally, this is one of the largest and most diverse groups studied in this age demographic for PBDE exposures. Predicting Body Burden of Polybrominated Diphenyl Ethers in Children Aged 15 Months to 5 Years Using Household Dust and Handwipe Levels and Selected Demographic Variables By Grace Evelyn Lee B.A. Kenyon College 2009 Thesis Committee Chair: Dana Boyd Barr, Ph.D. A thesis submitted to the Faculty of the Rollins School of Public Health of Emory University in partial fulfillment of the requirements for the degree of Master of Public Health in Environmental Health 2013 Acknowledgements Many thanks to my advisor, Dr. Dana Boyd Barr. It was her engaging lectures that first introduced me to the fascinating world of exposure science. Without her knowledge, enthusiasm, and support, this project would not have been possible. I would also like to thank Dr. Lyndsey Darrow for allowing me to work on her BEAT project and her invaluable help with data processing. I am greatly indebted to the Barr/Ryan laboratory staff, especially Dr. Parinya Panuwet and Priya D’Souza. This thesis would not exist if it were not for them. They spent countless hours helping me process samples, troubleshoot problems, and lending their expertise. I am forever grateful that they gave their time to teach me some of their skills and knowledge. Table of Contents 1. INTRODUCTION ................................................................................................... 1 A. Background ................................................................................................................... 1 B. Health Effects ................................................................................................................. 2 Endocrine Modulation ............................................................................................................ 3 Neurotoxic Effects ................................................................................................................... 4 C. Human Exposure to PBDE ............................................................................................ 5 Global Exposure Trends ......................................................................................................... 5 Child Serum PBDE ................................................................................................................. 6 Exposure Routes and Potential Measurement Methods ......................................................... 7 D. Aims and Hypotheses ..................................................................................................... 9 2. METHODS AND MATERIALS ........................................................................... 10 A. Study Population and Enrollment ............................................................................... 10 B. Chemicals and Materials .............................................................................................. 11 C. Blood Samples .............................................................................................................. 12 Blood Sample Collection ...................................................................................................... 12 Serum PBDE Extraction and Quantification ........................................................................ 12 D. Household Dust Samples.............................................................................................. 14 Dust Sample Collection ........................................................................................................ 14 Dust PBDE Extraction .......................................................................................................... 14 E. Child Handwipe Samples ............................................................................................. 15 Handwipe Collection ............................................................................................................ 15 Handwipe Extraction ............................................................................................................ 15 F. Dust and Handwipe PBDE Quantification ................................................................... 16 G. Data Analysis ............................................................................................................... 16 3. RESULTS .............................................................................................................. 17 A. Demographic Data ....................................................................................................... 17 B. Serum PBDE Distributions .......................................................................................... 18 C. Serum PBDE Associations ........................................................................................... 21 Statistical Analysis ................................................................................................................ 21 Age and Serum PBDE Concentrations ................................................................................. 21 Sex and Serum PBDE Concentrations .................................................................................. 21 Race and Serum PBDE Concentrations ............................................................................... 22 Insurance Status and Serum PBDE Concentrations ............................................................. 22 Breastfeeding and Serum PBDE Concentrations ................................................................. 22 BMI and Serum PBDE Concentrations ................................................................................ 23 D. Dust PBDE Distributions ............................................................................................. 23 E. Handwipe PBDE Distributions .................................................................................... 25 F. Serum, Dust, Handwipe Correlations .......................................................................... 26 4. DISCUSSION ........................................................................................................ 27 A. Serum PBDE Study Design .......................................................................................... 27 B. Serum PBDE Distribution and Associations ................................................................ 28 C. Dust and Handwipe PBDE Study ................................................................................ 32 D. Limitations ................................................................................................................... 34 E. Future Studies .............................................................................................................. 35 F. Conclusions .................................................................................................................. 36 5. REFERENCES ...................................................................................................... 36 6. NON-PRINT SOURCES ....................................................................................... 39 7. TABLES & FIGURES ........................................................................................... 40 8. APPENDICES ....................................................................................................... 46 A. Standard Operating Procedure for BEAT Dust Collection ......................................... 46 B. PBDE GC/MSD Instrument Method Details ............................................................... 56 1 NTRODUCT TION 1. IN A. Ba ackground minated dipheenyl ethers (PBDEs) are a class of brrominated fllame Polybrom retard dants frequen ntly used in consumer prroducts suchh as electronnics and textiiles. PBDEs have a chemical structure s sim milar to polycchlorinated bbiphenyls (P PCBs), whichh were banneed in the Un nited States in n 1978. Likee PCBs, PBD DEs are perssistent organnic pollutantss that are a environm mentally perssistent, bioacccumulate, aand biomagnnify (Birnbauum and Hubaal 2006). 209 PBDE E congeners exist, differiing in structu ture by the nu number and llocation of brom mines around two aromatiic rings and are numbereed accordingg to the IUPA AC system (Birn nbaum and Hubal H 2006). The congen ners are dividded into 10 hhomologouss groups depen ndent on the total numbeer of bromin nes that they contain (moono- to decab bromodiphen nyl ethers). The T general structure is shown in Figgure 1. Figure F 1: PBD DE General Structure Three majjor commerccial mixturess of PBDEs have been uused in the U United Statess and in nternationallly: pentabrom modiphenylether (Pentaa), octabromoodiphenylethher (Octa), and decabromodi d iphenyletherr (Deca), so named n for thhe average nnumber of brromines preseent (Birnbaum m and Hubaal 2006; Kroll et al. 2012)). Penta-BDE E consists prrimarily of BDE-47 (tetrabro ominated) an nd BDE-99 (pentabromin ( nated) and iss applied maainly to polyu urethane foam m in furniturre. Octa-BD DE is compossed mainly oof BDE-153 2 (hexabrominated) and BDE-183 (octabrominated) and is used in office equipment and plastic housing. Deca-BDE consists mainly of BDE-209 (decabrominated) and is used primarily in electronics (Birnbaum and Hubal 2006; Frederiksen et al. 2009). PBDEs are additives mixed into polymers and are not chemically linked to the polymer; thus they can leach out and enter the environment (Talsness 2008). Because of rising concerns about their health effects, Octa- and Penta- mixtures were phased out by production companies in 2005 in the United States. The Deca- mixture is still currently in use in all states except Maine, with a nationwide voluntary phase out by 2013 (BSEF 2012). However, even if PBDEs are no longer being produced, there is the potential for exposure because of PBDEs’ previous widespread use, persistence in the environment, and continued use of pre-ban products. B. Health Effects The health effects of PBDEs in humans are not well defined as most of the research has been limited to animal models. While the toxicological mechanisms are not well understood, PBDE exposure has been linked to numerous health outcomes including liver toxicity, endocrine modulation, altered thyroid homeostasis, reproductive problems in women and men, and behavioral and neurodevelopmental alterations such as hyperactivity (Birnbaum and Hubal 2006; Chen et al. 2011; Branchi et al. 2003; Boas et al. 2009). The health effects of PBDEs may be congener-dependent. These differences in health effects are likely due to changes in biochemical properties associated with additional bromines. Lower molecular weight congeners (six bromines or fewer) are 3 almost completely absorbed, highly bio-accumulate, and have half-lives on the order of 2 to 12 years (Branchi et al. 2003; Trudel et al. 2011). Fully brominated deca-BDE congeners are poorly absorbed and are rapidly eliminated (Branchi, Capone et al. 2003). Endocrine Modulation PBDEs are endocrine modulators that cause disruption of thyroid hormone homeostasis (Talsness 2008; Boas et al. 2009). Proper development and regulation of body systems is dependent upon appropriate levels of thyroid hormones. Perturbations of thyroid hormone levels may be particularly harmful during critical development phases, such a neurodevelopment (Birnbaum 2004). Developing fetuses and infants are especially responsive to small changes in thyroid hormone and represent an extremely vulnerable subpopulation (Branchi et al. 2003). In rat studies, perinatal maternal and postnatal PBDE exposure reduced circulating thyroid hormones concentrations in fetuses. Similarly, studies in other species have consistently shown thyroxine (T4) and triiodothyronine (T3) reductions after exposure at dosage levels comparable to environmental human exposure (Boas et al. 2009). Potential mechanisms of PBDE-induced thyroid hormone dysregulation are increased metabolism of T4 by induction of hepatic enzymes, downregulation of thyroid hormone transport proteins, or competition for transthyretin (Birnbaum and Hubal 2006; Talsness 2008; Boas et al. 2009). Few human studies exist regarding PBDE and thyroid function. In a study of 308 adult male fishers, PBDE concentration was positively associated with T4 and negatively associated with T3 and thyroid-stimulating hormone (TSH). Hormone levels varied by 4 congener, suggesting that there are congener-specific mechanisms (Turyk et al. 2008). Similarly, other epidemiological studies found that BDE-47 was associated with decreased TSH (Hagmar et al. 2001) and occupationally exposed workers had slight T4 elevation over time (Julander et al. 2005). Studies of maternal PBDE levels found negative associations with TSH and individual and sum PBDE levels, but no association with neonatal TSH (Chevrier et al. 2011; Chevrier et al. 2010). The general trend revealed by these studies is not consistent with laboratory animal data that consistently saw T4 depression and no effect on TSH. It remains unclear why these differences exist. The current understanding of the effects of PBDEs on human thyroid hormone levels is very limited, with information on children sorely lacking despite their vulnerability. Neurotoxic Effects PBDE is a known developmental neurotoxicant in mice. Gestational and neonatal low doses of PBDE caused irreversible changes in adult mouse brain function; mice displayed hyperactivity as adults that worsened with age (Talsness 2008). BDE-99 in particular altered the cholinergic system and caused deficits in learning and memory in mice. Human studies investigating neurodevelopmental effects of PBDEs have observed adverse neurodevelopmental effects in 4-6 year olds prenatally exposed (Roze et al. 2009; Herbstman et al. 2010). Postnatal BDE-47 exposure was associated with higher risk of ADHD symptoms and decreased mental development (Gascon et al. 2012). Mechanisms underlying this neurotoxicity have not been fully elucidated, but there is evidence of thyroid hormone-mediated effect. Thyroid hormone is an integral 5 component of brain development, and alterations in normal hormone levels can cause distinct changes in neuro-behavioral development. Relatively small changes in maternal T4 negatively impact intelligence and psychomotor skills in children (Branchi et al. 2003). As discussed above, thyroid hormone regulation is a likely target of PBDE toxicity. There is a critical window of sensitivity to PBDE in mice that corresponds to the period of rapid brain growth (Talsness 2008). Fetal exposure and infant exposures via breastfeeding would occur during this developmental stage. Therefore protection of pregnant women and young children is a priority when dealing with PBDE, and there is a clear importance of minimizing childhood exposures. C. Human Exposure to PBDE Global Exposure Trends The total world-wide production of PBDEs in 2001 was approximately 67,400 metric tons/year, with the Americas consuming just over half of it (Birnbaum 2004). PBDE concentrations in humans have increased by approximately 100 times during the last 30 years, with North Americans having approximately 20 times more PBDE in serum compared to Europeans (Hites 2004). Differences in PBDE utilization and exposure levels are likely due to stringent flammability standards in the United States, and the European Union’s ban of Penta and Octa in 2003 (Whitehead et al. 2013). Recent studies in China have suggested that Chinese exposure levels may be elevated due to the import and recycling of other nations’ electronic waste (Frederiksen et al. 2009). 6 Within the U.S., there are wide variations in environmental and biological measures of PBDEs. In California, PBDE dust concentrations were 4-10 higher and serum 2-fold higher than other regions in the United States (Zota et al. 2008). These differences were likely attributable to California’s strict furniture flammability standards that resulted in widespread use of Deca and Penta (Whitehead et al. 2013; Zota et al. 2008). Child Serum PBDE Exposure studies have primarily used plasma, serum, or breast milk to measure PBDE body burden and have focused on adults (Frederiksen et al. 2009). Studies of PBDE levels in children have been extremely limited due to difficulties associated with collecting blood samples. However, the toxicological data suggests that children may be more sensitive to PBDE exposures. Simultaneously, children aged one to five years appear to be more 2- to 10-fold more exposed to PBDEs than adults (Lunder et al. 2010; Toms et al. 2009; Rose et al. 2010; Eskenazi et al. 2011). Peak concentrations of PBDEs in children occur around 2 to 3 years of age as a result of increased hand-to mouth behavior and dust exposure, discussed more below (Lunder et al. 2010; Toms et al. 2009). Infants (<1 years old) also have high PBDE exposure, but their exposure comes almost exclusively from breastmilk (JohnsonRestrepo and Kannan 2009). The results produced by child serum PBDE studies in the U.S. have been severely limited by sample size, pooled analyses, congener choice, and unrepresentative study populations. Only recently have studies moved away from using pooled serum samples 7 and started using individual samples. This is problematic because it has been well documented that serum PBDE concentrations may vary greatly, with 5% of the population having concentrations of PBDE at least 10 times the mean, and 1% as much as 50 times the mean (Birnbaum and Hubal 2006). Pooled serum samples therefore may not be a good representation of average exposures and cannot identify individuals with high body burdens. There were also problems with inconsistent congener choice; there is no consensus among researchers what congeners are important to report. The most commonly reported congeners were BDE-47, -99, -100, -153, and -154 (Birnbaum and Hubal 2006; Hites 2004). BDE-209 was often not measured due to difficulties in measurement methodology and lack of comparative data (Lorber 2008). The study populations looked at in child serum studies were often not generalizable to the American public. Lunder et al. (2010) investigated a primarily higher socioeconomic status (SES), white Caucasian population. Eskenazi et al. (2011) used the Center for Health Assessment of Mothers and Children of Salinas (CHAMACOS), a primarily low-income Hispanic population. Both of these studies were extremely homogenous in terms of socioeconomic status and ethnicity. Rose et al. (2009) studied children born in California, a state known to have high mean concentrations of PBDE compared to the rest of the United States. The limitations of these studies make it difficult to generalize their findings to the larger population of American children. Exposure Routes and Potential Measurement Methods In nations with low to moderate body burdens of PBDE, the dominant exposure is through foodstuffs, particularly dairy and meat products (Lorber 2008). In highly exposed 8 nations, dust is the primary pathway of exposure and can account for about 82% total PBDE intake (Trudel et al. 2011; Lorber 2008). In the United States, household dust levels have been found to be good estimators of exposure (Johnson et al. 2010; Wu et al. 2007; Stapleton et al. 2012; Watkins et al. 2011a, b). Dust sample collection is less invasive than biological sampling, making it an appealing alternative matrix. PBDEs volatilize from the product and adsorb onto dust. Dust can then enter the body via inhalation, inadvertent ingestion from hand-to-mouth contact, or direct absorption through the skin (Whitehead et al. 2013). Very little data currently exists about the relative importance of each of these routes to total exposure levels, but it is estimated that ingestion is responsible for ~80% and dermal 10-30% of total PBDE exposure (Frederiksen et al. 2009). For young children (approximately one to five years old), dust exposure is increased by hand-to-mouth behaviors and proximity to dust covered surfaces. Daily intakes of dust for small children (1-4 years) have been estimated to be 100-200 mg/d while adult intake is estimated around 50 mg/d (U.S. EPA 2011). Therefore, PBDE dust measurements may be of particular use in determining child exposure levels. Currently, only one study has attempted to link child serum PBDE levels and household dust levels. Stapleton et al. (2012) found that serum Penta levels were associated with house dust Penta levels in a study of 83 children 12 to 36 months of age. Several problems have been identified with dust sampling. Dust PBDE concentrations have been found to vary depending on the room selected for sampling, probably due to differences in the furniture and electronics present (Krol et al. 2012; Allen et al. 2008; Muenhor and Harrad 2012). Body levels of PBDE may be dependent 9 on the room the majority of time is spent in, and for adults this is complicated by the fact that many work non-residentially (Watkins et al. 2011a, b). Handwipes may be a more direct measure of personal exposure than dust measurements, particularly among children. To date, four studies have measured PBDEs in handwipes and have found good agreement with dust concentrations (Stapleton et al. 2012; Watkins et al. 2011a, b; Stapleton et al. 2008). Handwipe concentrations were found to be better predictors of serum Penta-BDE levels than dust (Stapleton et al. 2012; Watkins et al. 2011a, b). D. Aims and Hypotheses Aim 1: Provide needed reference values for total and congener-specific blood PBDE levels in children, particularly the range and variability of exposure levels. Define the levels of dust and handwipe PBDEs in a subset of the participants. Aim 2: Examine potential predictors of PBDE exposure levels including age, sex, race, SES assessed by insurance status (Medicaid vs. private), breastfeeding status, and BMI. Aim 3: Determine if dust or handwipe PBDE concentrations are good predictors of serum PBDEs levels in children. I hypothesize that lower SES, breastfeeding, and higher BMI will be associated with higher levels of serum PBDE. 10 I also predict that handwipe PBDE levels will be more strongly correlated with serum levels of PBDE than household dust levels. 2. METHODS AND MATERIALS A. Study Population and Enrollment Subjects between the ages of 15 months and 6 years were recruited to be in the Brominated Flame Retardant Exposure and Thyroid Function (BEAT) study. The study primary investigators were Lyndsey Darrow, PhD (Dept of Epidemiology) and Dana Boyd Barr, PhD (Dept of Environmental Health), and it was funded by NIH grant ID 5R21ES019697-02. The study age range was chosen because previous studies have shown high serum levels of PBDEs in this age group, which may represent a vulnerable subpopulation (Lunder et al. 2010; Toms et al. 2009) Eighty-seven children were recruited from Children’s Healthcare of Atlanta (CHOA) when they were admitted for a routine myringotomy, adenoidectomy, or tonsillectomy surgery. This population was chosen for ease of blood draw. Anxiety and discomfort associated with blood draws in this age group were avoided because of general anesthesia administered for the surgery. The study protocol was reviewed and approved by Emory’s Institutional Review Board. Criteria for exclusion from the study included undergoing any additional procedures not listed above, being outside the target age range, or having any preexisting condition that may affect PBDE or thyroid hormone levels. Enrolled children were also excluded from further participation if they were unable to provide a full 15 mL of blood during the blood draw. The total number of participants in the study was 81. 11 The BEAT study nurse, Christina Ryan, R.N. (CHOA), obtained parental consent and enrolled the children on the day of their surgery. Demographic and health information was gathered through a parental questionnaire and from the child’s health records while the child was undergoing surgery. The questionnaire included questions about child date of birth, sex, race, ethnicity, breastfeeding history, duration at current residence, parental occupation, household smoking, insurance status, child medications, height and weight, and family medical history of endocrine or autoimmune diagnosis. Approximately one-fourth of parents indicated that they were interested in being involved in home dust and child handwipe sampling at a later date. Families who resided within a 25-mile radius of Atlanta were considered for future sampling. A total of 15 households were sampled for dust, representing 17 child dust exposure measurements as some participants lived in the same household. In addition, 13 handwipes were collected at the time of dust sampling from the participating children. B. Chemicals and Materials Chemicals used for sample extraction and analysis are listed in Table 1. For serum extractions, internal standard (ISTD) solution was 10 ng/mL of 13C12 isotopically labeled BDE-47, -99, -100, -153, and -154 in methanol. For dust and handwipe extractions, ISTD solution was 20 ng/mL of 13C12 isotopically labeled BDE-47, -99, -100, -153, and -154 in hexane. Low (QCL) and high (QCH) concentration quality control solutions were 100 ng/mL and 300 ng/mL, respectively, of BDE-47, -85, -99, -100, -153, and -154 in hexane. ISOLUTE brand bulk silica sorbent (United Kingdom) and ISOLUTE 200 mg Silica 10 mL XL columns (United Kingdom) used during sample clean-up were purchased from 12 Biotage AB. Supelclean ENVI-Florisil 500mg/3mL SPE cartridges for handwipe extraction were purchased from Supelco (Bellefonte, PA). Ottawa sand, 20-30 mesh, for accelerated solvent extraction was purchased from Fisher Scientific (Fair Lawn, NJ). C. Blood Samples Blood Sample Collection While the child was still under general anesthesia after surgery, the nurse collected 15 mL of blood in two tiger-topped serum separator Vacutainer tubes. Blood samples were transported to the Barr/Ryan laboratory at the Rollins School of Public Health, Emory University on the day of collection and immediately processed. As described by Virginia (2012), serum was separated, aliquoted into freezer-safe storage vials, and stored at -20°C until analysis. Serum PBDE Extraction and Quantification PBDEs were extracted from serum using solid phase extraction (SPE) and a clean-up method to remove biological contaminants before analysis. 1 mL of each serum sample was spiked with 100 μL of ISTD (10 ng/mL) and 100 μL of formic acid and vortex mixed briefly. 5 mL of hexane was added to each sample and then vortex mixed at 2000 rpm for 10 minutes. An additional 5 mL of hexane was added, and samples were vortex mixed for an additional 5 minutes. Serum clean-up used acidified-silica columns prepared in-house. Pre-packed ISOLUTE 200 mg silica columns were used as the base. Acidified silica was produced by 13 combining 98% H2SO4 and ISOLUTE bulk silica (1:2). 1.8 g of acidified silica was layered on top of the premade silica columns, followed by 0.5 g of anhydrous Na2SO4. The columns were dried overnight at 100°C. Columns were conditioned with 5 mL of hexane before addition of samples. Samples were briefly vortex mixed and manually shaken prior to loading in the column. Samples tubes were rinsed with 1 mL of hexane, vortex mixed and shaken, and loaded into the column. The sample breakthrough was collected in clean 15 mL tubes. The eluates were evaporated at 30°C at 15 psi. The 15 mL collection tubes were replaced by clean tubes, and the columns eluted again with 10 mL of 1:19 dichloromethane (DCM)/hexane solution. The eluate was collected and combined with the sample breakthrough in the TurboVap, and the samples brought to total dryness at 30°C at 15 psi. Samples were reconstituted with 50 μL of toluene for analysis. GC-MS/MS instrument parameters for serum PBDEs were developed by Virginia (2012). As PBDEs are lipophilic, serum PBDE levels were lipid adjusted. Total lipid (TL) content of each sample was calculated using the formula TL= (2.27*TC) + TG + 62.3 mg/dL, where TC is total cholesterol and TG is total triglyceride (Bernert et al. 2007). Serum triglyceride content was measured using BioVision Triglyceride Quantification Assay Kit (BioVision Research Products; Mountain View, CA), and serum cholesterol content was measured using Cayman Cholesterol Assay Kit (Cayman Chemical Company; Ann Arbor, MI) according to manufacturer instructions. Serum PBDE levels are reported in ng of PBDE per gram of lipid (ng/g). 14 D. Household Dust Samples Dust Sample Collection 15 households agreed to allow a field technician enter their homes and vacuum to collect a dust sample. When arranging a sampling time, participants were asked to refrain from vacuuming so there would be enough dust volume to collect. Parents identified the room that the participant spent the most time in and this room was selected for sampling. Using a solvent-cleaned high volume small surface sampler (HVS3) vacuum (CS3 Inc.; Bend, OR) and solvent-cleaned Teflon® catch bottle, a 1 m3 square of floor was sampled according to a standard operating procedure (Appendix A). If available, dust from the household vacuum was also collected for future comparison. Samples were transported to the Barr/Ryan laboratory the same day they were collected and were processed within 7 days of sampling. Dust samples were sieved twice to a particle size of less than 250 μm and stored at room temperature in a solvent-cleaned amber jar until analysis. Dust PBDE Extraction PBDEs were extracted from dust using accelerated solvent extraction (ASE) and a clean-up method to remove contaminants before analysis. Dust was extracted in duplicate using the ASE 350 (Dionex; Sunnyvale, CA) system. The ASE was operated using the following parameters: 100°C, two 5 min static cycles, 5 min heat time, 60% rinse volume, 60 sec purge time, at approximately 1500 psi, using an extraction solution of 10% (v/v) DCM/n-hexane. Cells were packed with 50 mg of dust and 20-30 mesh Ottawa Sand (Fisher Scientific; Fair Lawn, NJ). All runs included a blank sample (sand only) and duplicate QCHs (100 μL of QCH spiked into a blank cell). The extract was blown to 15 dryness at 40°C using the TurboVap and reconstituted with 5 mL of 10% DCM/hexane solution. Acidified silica clean-up columns, prepared as described in serum extraction section, were preconditioned with 5 mL of hexane. The sample extracts were loaded into the columns and the breakthrough collected. The columns were eluted with 10 mL of hexane, and the eluate added to the breakthrough. Gentle negative pressure was applied to the columns to aid elution. 100 μL of ISTD was added and the samples were dried in the TurboVap. Samples were reconstituted in 50 μL of toluene. E. Child Handwipe Samples Handwipe Collection In the same visit as the dust collection, handwipe samples were collected if the child was present. A total of 13 samples were collected. The child’s hands were wiped with a sterile gauze pad that had been soaked in isopropyl alcohol, one pad per hand. The child’s hands were carefully wiped up to the wrist and the two gauze wipes combined and stored in a solvent-cleaned brown amber jar. The samples were transferred to the Barr/Ryan laboratory the same day and stored at room temperature until analysis. Handwipe Extraction Handwipes were extracted following a modified protocol from Stapleton et al. (Stapleton et al. 2008). QCL and QCH were prepared by spiking 100 μL of QCL or QCH standard solutions onto two pieces of gauze soaked with isopropanol. Sample and QC gauze pads were spiked with 100 μL of ISTD immediately prior to extraction. The 16 combined gauze (right and left hand) were submerged in 30 mL of DCM and sonicated for 20 minutes. This extraction was repeated two times, for a total extraction volume of 90 mL. The extract was dried at 40°C in the TurboVap. 500 mg/3 mL SupelClean ENVIFlorisil SPE cartridges were used to purify the handwipe extracts. The cartridges were preconditioned with 2 mL of hexane. The samples were reconstituted with 2 mL hexane and loaded onto conditioned cartridges. The breakthrough was caught and the cartridge was eluted with 6 mL hexane. The extract was dried in the TurboVap and reconstituted in 50 μL of toluene. F. Dust and Handwipe PBDE Quantification A calibration curve (0.1, 0.25, 0.5, 1.25, 2.5, 12.5, 35, and 37.5 ng) of BDE-47, 85, -99, -100, -153, and -154 mixture was prepared. The calibration curve and samples were analyzed for total PBDE (ΣPBDE) and six congeners (BDE-47, -85, -99, -100, -153, and -154) using gas chromatography/mass selective detection (GC/MSD) in house (5975 GC/MSD System; Agilent Technologies). GC parameters are show in Appendix B. The congeners were identified by mass and chromatographic retention time, as shown in Figure 2. The limits of detection, derived from the standard curve, were 0.10 ng for BDE47, -85, -99, and -100 and 0.25 ng for BDE-153 and -154. Dust PBDE concentrations were blank subtracted and duplicates were averaged for the final concentration. G. Data Analysis BMI measurements were calculated using “Children’s BMI Group Calculator” Excel system developed by the Centers for Disease Control and Prevention (CDC). The 17 calculator produces a BMI percentile that is adjusted by height, weight, sex, and age measurements (CDC 2012). Body fat composition varies by gender and age in children. The “age-adjusted BMI percentile” allows for comparison of children regardless of age and gender. BMI cannot be accurately calculated for children less than two years old, so those individuals were removed for BMI analysis. Statistical analyses were performed using Microsoft Excel 2011 Software (Version 14.3.2) and SAS Statistical Software (Version 9.3). Serum and handwipe measurements below the limit of detection (LOD) were computed by dividing the congener-specific LOD by the square root of two. All data were log10-transformed to correct for skewedness. Log-transformation produced more normal distributions for all congeners and ΣPBDE; therefore, all statistical tests were performed using the logtransformed serum data. One-way ANOVA tests, Student’s T-tests, and simple linear regression analyses were used to investigate associations between serum PBDE concentrations and covariates of interest. Correlation analyses were performed to determine associations between serum/dust, serum/handwipe, and dust/handwipe congener and total PBDE levels. 3. RESULTS A. Demographic Data The BEAT study had high enrollment with a refusal rate of only 6.3% for participation in the blood draw. The study recruited a total of 81 eligible participants that were all included in analysis. Subject demographic information is presented in Table 2. 18 Subject age was relatively evenly distributed with two to three year olds representing the largest age group (Table 2). There were slightly more male participants than females. There were a total of 33 African American participants, representing one of the largest numbers in a PBDE exposure study. The majority of participants was breastfed as infants and came from smoke-free homes. Almost half of the participants were in the highest quartile (75>100) for age-adjusted BMI. B. Serum PBDE Distributions Lipid-adjusted serum congener levels are presented in Table 3. Frequency of detection above LOD for the various congeners is reported in Table 4. Congener and ΣPBDE concentrations statistics are presented stratified by age, sex, race, insurance status, breastfeeding history, and age-adjusted BMI in Table 5. Table 3: Serum PBDE Congener and Summed Concentrations (ng/g lipid), n=81 BDE‐ 47 85 99 100 153 154 SUM Mean 54.01 1.09 15.03 9.43 10.40 1.65 91.61 Median 36.33 0.64 9.84 5.99 5.73 1.06 62.86 Std Dev 76.38 2.03 22.90 15.00 12.69 2.66 125.32 Min 0.07 0.31 0.31 0.24 1.65 0.51 5.74 Max 642.13 16.41 193.57 125.79 78.81 22.89 1079.61 There was wide variation in serum BDE concentrations between subjects. All congener and ΣPBDE distributions were right-skewed, caused by a few subjects with high concentrations. BDE-47 concentrations were the highest of all congeners (Figure 3), while BDE-85 and -154 both had low frequency of detection in serum samples (Table 4). 119 40.0 Median Concentration (ng/g lipid) 35.0 30.0 47 7 25.0 85 5 20.0 99 9 15.0 10 00 10.0 15 53 5.0 15 54 0.0 Congener Figure 3: Median M Conccentration off Serum Conngeners Due to itss high frequeency of detecction and its establishmeent in the liteerature as a sentin nel BDE, BD DE-47 was chosen c for fu urther examinnation. Its ddistribution w was rightskew wed with one individual having h an ex xtreme value of 642.13 nng/g lipid (Fiigure 4). 90% % of thee values werre between 6.07 6 and 141.61 ng/g lipiid and the m median value was 36.33 ng/g lipid. Particcipant who were w five yeaars old or unnder two yearrs old had thhe highest median BDE-47 serum conceentrations (F Figure 5). Thhose under tw wo years of aage also has the hiighest mediaan concentraations of BDE-99, -100, and -153. Figure F 4: Seerum BDE-47 Distributioon of Concenntrations 220 Median Concentration (ng/g lipid) 50 45 40 35 30 <2 yrs 25 2 yrs 20 3 yrs 15 4 yrs 10 5+ yrs 5 0 47 85 8 99 100 153 154 BDE‐ Figure F 5: Disstribution of Serum Conggeners by Age Group ΣPBDE serum concen ntrations folllowed a patttern similar tto BDE-47 aas the summ med value was driven mo ostly by BDE E-47. The ddata were rigght-skewed w with one extrem me high valu ue at 1079.6 61 ng/g lipid (Figure 6). T The median ΣPBDE conncentration was 62.86 6 ng/g liipid, with 90 0% of valuess falling betw ween 15.44 aand 236.91 nng/g lipid. Figure 6: SeerumPBDE E Distributioon of Concenntrations 21 C. Serum PBDE Associations Statistical Analysis Congener specific and ΣPBDE associations with age, sex, race, insurance status, breastfeeding status, and age-adjusted BMI were tested. Age and BMI were tested both as continuous and categorical variables. Age was categorized by years of age, and BMI data were divided into quartiles to produce categorical variables. Continuous variables, age and BMI, were tested for associations with serum PBDE concentrations using simple linear regression. One-way ANOVA tests were performed for categorical variables with more than two groups (age, BMI, and race). Student’s T-tests were used to test for associations between serum concentrations and sex, breastfeeding history, and insurance status. Age and Serum PBDE Concentrations Age (in months) was relatively normally distributed. Simple linear regression found that there was no association between age in months and individual congeners or ΣPBDE concentrations. Categorical age was also not associated with specific congener or ΣPBDE concentrations. Sex and Serum PBDE Concentrations Being a female was associated with higher levels of BDE-47 (t=-2.77, p=0.007) and ΣPBDE (t=-2.61, p=0.0109). Females had a mean BDE-47 concentration of 47.79 ng/g lipid compared to 23.16 ng/g lipid for males. Mean ΣPBDE concentrations were 22 82.30 ng/g lipid for females and 51.44 ng/g lipid for males. While not significant at the =0.05 level, BDE-99 and -100 approached significance, with females having higher mean concentrations. Race and Serum PBDE Concentrations Race was divided into four categories for statistical analysis: African American, Caucasian-White, Caucasian-Hispanic, and other. BDE-100 serum concentrations differed between the racial groups, with a F-value of 6.16 and p=0.0008. Mean BDE-100 values were 8.51, 3.16, 1.86, and 1.41 ng/g lipid for African American, Caucasian-White, Caucasian-Hispanic, and other, respectively. Insurance Status and Serum PBDE Concentrations Insurance status was not found to be associated with serum PBDE concentrations. Breastfeeding and Serum PBDE Concentrations Child history of breastfeeding was significantly associated with BDE-47 concentration. Non-breastfed children had higher mean BDE-47 concentrations than breastfed children (t=2.02, p=0.0465). Mean BDE-47 was 43.66 ng/g lipid for nonbreastfed children and 25.39 ng/g lipid for breastfed children. 23 BMI and Serum PBDE Concentrations Age-adjusted BMI percentile was normally distributed and did not need to be log adjusted. When tested as a continuous variable, there was a significant negative association between BDE-153 and BMI percentile at the =0.05 level. The R2 for the association was 0.0911, with a p-value of 0.0111. For every increase in BMI percentile, there is a 1.007 ng/g lipid decrease in BDE-153. A similar trend was observed when BMI was tested as a categorical variable. BDE-153 concentrations differed between BMI quartiles, with a F-value of 3.87 and a p-value of 0.0130. BDE-153 mean concentrations were 8.51, 11.75, 6.03, and 5.13 ng/g lipid for the 0>25, 25>50, 50>75, and 75>100 BMI groups, respectively. D. Dust PBDE Distributions A convenience sample of eligible children was selected for household dust and handwipe sampling. The desired sample size was 20, but there was difficulty in obtaining permission for home visits. To boost participation, all participants’ families within a 25 mile radius of Emory were contacted about home sampling. The final sample size for household dust was 15. Refusal for participation in the dust sampling portion of the study was extremely high, likely from difficulties in scheduling and the invasiveness of a home visit. All congeners were detectable in household dust (Table 4). All congeners and ΣPBDE were right-skewed, with a few extreme high values causing the tailing. There was wide variation in congener and total PBDE concentrations between samples (Figure 7). Table 6 presents the descriptive statistics for the concentration of individual congeners 224 and ΣPBDE Σ in du ust. BDE-99 and -47 werre the most pprevalent coongeners in ddust, accou unting for ap pproximately y 49% and 28% of total m measured PB BDE, respecctively. BDE E99 haad a median concentratio on of 579.20 ng/g of dus t, and BDE--47 was 405..26 ng/g. 25000 Concentration (ng/g) 20000 15000 BDE154 BDE153 BDE100 10000 BDE99 BDE85 5000 BDE47 2007‐095 2007‐082 2007 081 2007‐081 2007‐063 2007‐062 2007‐058 2007‐052 2007‐041 2007‐022 2007 019 2007‐019 2007‐013 2007‐012 2007‐006 2007‐005 2007‐004 2007‐003 2007‐002 0 Du ust Sample Figure 7: Congen ner and ΣPBD DE Concentrrations in Duust by Sampple Table 6: Dustt PBDE Conge ener and Sum mmed Concenntrations (ng/g), n=15 BDEMean Median Std Dev v Minim mum Max ximum 47 813.91 405.26 6 1469. 70 95.02 6012.43 85 123.44 39.48 8 217. 25 7.62 840.98 1397.19 99 579.20 0 2631. 46 1127.25 1 10701.50 248.55 100 101.35 5 457. 35 23.92 1862.65 170.91 153 60.77 7 343. 56 13.41 1393.50 115.16 154 40.93 3 213. 40 10.25 868.65 2869.16 Sum 1221.80 0 5323. 64 2293.00 2 21679.71 225 andwipe PB BDE Distrib butions E. Ha Handwipees were colleected at the same s time ass household dust sampling so wipe levels could c be corrrelated with h dust levels.. Only thirteeen handwipee samples handw were collected, because eitheer the protoco ol had not yeet been impllemented or some childrren were nott present at the t house at the time of tthe visit. Handwipee congener detection d waas good, withh 100% detecction rate for BDE-47, 99, an nd -100 and over 60% fo or all other congeners c (T Table 4). Hanndwipe PBD DE conceentrations were right-skeewed and vaaried widely by sample (Figure 8). D Descriptive statistics for the congeners c an nd ΣPBDE are a presentedd in Table 7. BDE-99 annd -47 were the most m prevalen nt congenerss in the hand dwipes, accouunting for appproximatelyy 43% and 39% of total meaasured PBDE E (Table 7). Concentration (ng/handwipe) 250 200 150 BDE154 BDE153 100 BDE100 BDE99 BDE85 50 BDE47 0 Handw wipe Sample Figure 8:: Congener and a ΣPBDE Concentratioons in Handdwipes by Saample 26 Table 7: Handwipe PBDE Congener and Summed Concentrations (ng/handwipe), n=13 BDEMean Median Std Dev Minimum Maximum 47 14.31 6.46 22.40 1.44 84.27 85 1.17 0.42 1.89 0.07 6.67 99 15.44 5.01 25.34 1.48 95.20 100 2.97 0.97 4.98 0.23 18.73 153 1.43 0.63 2.11 0.18 7.95 154 1.04 0.35 1.70 0.18 6.39 Sum 36.27 13.46 58.35 3.14 219.22 F. Serum, Dust, Handwipe Correlations All serum, dust, and handwipe PBDE data were non-normal. Therefore log10 transformed data were used for all correlation tests. While there were 15 dust samples, there were 17 children with dust PBDE data available for comparison because some children lived in same household. Serum and dust individual congeners and ΣPBDE were not correlated. Dust and handwipes PBDE levels were also not correlated at the =0.05 level. However, BDE-153 approaches significance (r=0.50, p=0.0818). Serum and handwipes were correlated for BDE-47 and ΣPBDE. For BDE-47, the Pearson’s correlation coefficient, r, is equal to 0.652 and p is 0.0158. For ΣPBDE, r=0.607 and p=0.0278. The correlation between handwipe and serum BDE-99 concentrations was significant at the =0.10 level (r=0.518, p=0.0640). 27 4. DISCUSSION A. Serum PBDE Study Design Only four studies investigating serum concentrations of PBDEs in young American children currently exist (Lunder et al. 2010; Rose et al. 2010; Eskenazi et al. 2011; Stapleton et al. 2012). Three of the studies were undertaken in study populations that are not representative of the general American public. Lunder et al. (2010) studied 20 mother-child pairs, the majority of whom were high SES, white Caucasians. Eskenazi et al. (2011) evaluated PBDEs in 7 year olds from a low-income, Mexican-American agricultural group as a part of the Center for Health Assessment in Mothers and Children of Salinas (CHAMACOS) study. Rose et al.’s (2009) study population was selected from the Childhood Autism Risks from Genetics and the Environment (CHARGE) study and included autism and developmental delay cases and matched controls from California. This study adds to the literature by providing a more diverse study population with a large sample size to test for potential predictors of exposure. 33 African American children were enrolled, representing the largest number to date. SES, as determined by insurance status, was mixed for this population with approximately 63% on Medicaid. In Lunder et al. (2010), all children were breastfed; in this current study 60% of the children were breastfed, allowing for analysis of PBDE concentrations by breastfeeding history. The results of this study can be more widely applied to the general population of young children than previous studies. Additionally, the current study utilized a novel blood draw technique that was well accepted by parents. By drawing blood while the child was under general anesthesia, complications associated with blood draws in young children, such as discomfort, were 28 avoided. There was no additional time burden on parents as children were already at the hospital, and participants were enrolled and sampled the same day. The subjects were undergoing routine surgeries unrelated to the health outcome of interest, and therefore represented a relatively health and demographically diverse subset of the general population. This enrollment and sampling technique has tremendous potential for use in future studies requiring blood samples from similar age groups. B. Serum PBDE Distribution and Associations Serum congener and ΣPBDE levels were highly varied between individuals (Table 3). BDE-47 ranged from 0.07 to 642.13 ng/g lipid, and ΣPBDE from 5.74 to 1079.61 ng/g lipid. Studies in adults have found there is approximately a 100-fold range in variability, and children have been noted to have greater variability in PBDE serum concentrations than adults (Birnbaum and Hubal 2006; Lunder et al. 2010). BDE-47 and 99 had the highest median concentrations and were the most frequently detected congeners, which is consistent with the literature (Rose et al. 2010; Stapleton et al. 2012). When compared to values found in the previous four studies, BDE-47 median concentration fell in the middle (Figure 9). Both the CHARGE and CHAMACOS groups had higher median concentrations of serum BDE-47 (Rose et al. 2010; Eskenazi et al. 2011). This is likely due to both study populations being located in California, where exposure tends to be higher because of strict fire regulations resulting in the high use of flame retardants (Zota et al. 2008). 229 Median Concentration (ng/g lipid) 80 70 60 50 40 30 20 10 0 Rose et al., 2009 Lunder et al.,, Eskenazi et aal., Stapleton et Current sttudy 2010 2011 al., 2012* Figu ure 9: Mediaan serum BD DE-47 concenntrations froom literature. *Stapleton * et al. (2012) was w reportedd as geometrric mean. Table 8: Significant Asso ociations betw ween Serum PBDE Concen ntrations and Covariatess of Interest Significantt Covariates Congener Association ‐47, ΣPBDE Sex Higher level s in females Race ‐100 Highest leveels in African A Americans Breastfeed ding History ‐47 Higher level s in non‐breaastfed Concentratioon decreasess with BMI; Highest BMI ‐153 levels in BM MI 25>50 A list of covariates c th hat were sign nificantly asssociated withh serum PBD DE levels aree d in Table 8. Age was no ot a significaant predictor of exposuree. Previous sttudies have listed reporrted mixed reesults with regard to agee. Toms et all. (2009) repported peak conceentrations at 2.6 to 3 yeaars of age correspondingg to increasedd toddling beehaviors. In Staplleton et al. (2 2012), ΣBDE E-47, -99, -1 100 (ΣBDE3) and BDE-1153 burdens increased with age, perhapss because off accumulatio on over timee of increased hand-to-m mouth 9) found no association a w with age. activiity, but Rosee et al. (2009 30 In the current study, being a female was associated with higher BDE-47 and ΣPBDE concentrations. Gender was not identified as a potential predictor of PBDE exposure in any of the other studies, although small sample size in the Lunder et al. (2010) and CHARGE studies may have limited the statistical power to detect such an association. It is unknown why female children would have higher body burdens of BDE47 and ΣPBDE, but could be attributable to specific gender activities. This is one of the first studies including a substantial African American subset, so no good comparison group exists. BDE-100 differed between racial groups, with African American children having the highest concentrations. Similarly, non-white children had higher ΣBDE3 compared to white children (Stapleton et al. 2012). Interestingly, Rose et al. (2009) found that Hispanic children had higher levels of lower brominated congeners but low levels of higher brominated congeners compared to non-Hispanic children. In our study, Hispanic children had the lowest concentrations for BDE-47, -99, -100, -153, and ΣPBDE of any racial group. Clearly, racial trends are not well defined and will need to be further elucidated by future studies. It was hypothesized that being breastfed would result in a child having higher PBDE body burden as a result of maternal transfer of PBDEs via breast milk. However, BDE-47 was negatively associated with breastfeeding. Breastfeeding status associations vary greatly in the literature. For CHARGE, BDE-47 and the sum of lower brominated congeners (ΣBDE-28-153) were significantly lower in breastfed children younger than 3.7 years of age, but significantly higher in children older than 3.7 years of age (Rose et al. 2010). Lunder et al. (2010) found that age of weaning and duration of exclusive breastfeeding were not associated with child serum levels. 31 Review of the literature suggests that child BDE-153 exposures differ from the rest of the Penta congeners (BDE-47, -99, -100) by pathway. Duration of breast-feeding was a strong predictor of BDE-153 but not sum BDE-47, -99, and -100 (Stapleton et al. 2012). In breastfed children, BDE-153 was positively associated with age; conversely, in non-breastfed children, BDE-153 was negatively associated with age (Rose et al. 2010). Also BDE-153 comprised a larger portion of ΣBDE-28-153 in breastfed children than non-breastfed children (Rose et al. 2010). BDE-153 is enriched in maternal adipose tissue compared to other Penta congeners, and is found in greater levels in breast milk despite only being 5-8% of the commercial mixture (La Guardia et al. 2006). Taken together, the data suggest that the primary exposure to BDE-153 in children is via breast milk and to BDE-47,-99, and -100 via some other pathway, likely dust. However, we did not observe any association between serum BDE-153 and breastfeeding history. It has been posited that low-income individuals may have greater PBDE exposure because they are more likely to have older furniture that was treated with Penta and Octa before the ban (Zota et al. 2008; Quiros-Alcala et al. 2011). Therefore we hypothesized that lower SES would be associated with higher PBDE body burdens. In our study, we used insurance status (private vs. Medicaid) as a proxy for SES and found no associations. However, higher paternal education level was strongly and inversely related to ΣBDE3 (Stapleton et al. 2012), while maternal education level is negatively associated with BDE-47, -66, -85, -99, 100, -153, -197, and -209 levels (Rose et al. 2010). If SES is truly associated with PBDE serum levels, insurance status may not be the appropriate proxy measurement. 32 PBDEs are lipophilic chemicals, and therefore we expected them to be elevated in higher BMI groups. The inverse was found with BDE-153, with concentration decreasing with increasing age-adjusted BMI. When tested as a categorical variable, the highest BDE-153 level was found in the 25>50 percentile group. PBDE concentrations were lipid-adjusted, likely obscuring the relationship between BMI and PBDE levels. In Rose et al. (2009), neither BMI nor weight-for-age were found to be important predictors. BMI is likely not an important covariate for predicting child serum PBDE levels. C. Dust and Handwipe PBDE Study Participation in the household dust sampling was very low, and we were unable to reach the desired subset sample size of 20. This was likely due to difficulties scheduling home visits, and the inherent invasiveness of having a stranger in your home. Anecdotally, participants were more willing to provide a used vacuum bag than having the technician vacuum. Participants were asked not to vacuum three days prior to the house visit, but not all complied, raising problems with standardization. Congener and total BDE levels in dust were extremely variable for different households. The cause of such wide variability is not know currently, although there are several studies attempting to correlate the number of PBDE-treated items with dust PBDE levels in homes. In household dust, BDE-47 and -99 had the highest concentrations of all congeners and accounted for approximately 77% of ΣPBDE. BDE47 and -99 have been routinely found to be major constituents of household dust. However, when measured, BDE-209 was also a major component of dust (Frederiksen et al. 2009; Allen et al. 2008). In the United States, reported median dust concentrations for 33 BDE-209 are at least 1 mg/g and 0.1 mg/g for BDE-47 and -99 (Whitehead et al. 2013). Therefore our dust measurements may greatly underestimate ΣPBDE without inclusion of BDE-209. During dust sample quantification, significant differences between duplicates were noted for two samples (2007-005 and 2007-006). Samples were reextracted, and a value between the two original values found, although closer to the higher value. These samples had large total sample volumes, and we suspect that the dust may not have been completely homogenous. The 50 mg of dust sampled was such a small proportion of the total volume that it may have resulted in a non-representative sample. Future study protocol should take this potential into account and ensure that samples are well mixed prior to extraction. In our study, dust was poorly correlated with serum levels. The majority of literature has found good correlations for residential dust and serum levels (Zota et al. 2008; Johnson et al. 2010; Stapleton et al. 2012). Problems may be from nonstandardized sampling; not all families complied with the non-vacuum request. Also it is well established that PBDE concentrations can vary by room, so we may not have sampled the room that accounts for the majority of child exposure (Watkins et al. 2011a, b; Allen et al. 2008; Muenhor and Harrad 2012). Handwipe collection was relatively easy and quick in comparison to dust collection. Overall, handwipes had good detection of congeners. BDE-99 and -47 were the congeners most frequently detected and had the highest median concentrations, in agreement with current literature (Stapleton et al. 2012; Watkins et al. 2011a, b; Stapleton et al. 2008). Again BDE-209 was not measured but it appears to be an important 34 contributor to handwipe PBDE levels (Stapleton et al. 2012; Watkins et al. 2011b; Stapleton et al. 2008). Handwipes were correlated with serum for BDE-47 and ΣPBDE and approached significance BDE-99. Likewise, the four existing handwipe studies found that handwipes were better at predicting serum levels than dust. Therefore it appears that handwipes may be a good surrogate measure for Penta exposure in children. Dust and handwipe levels were not correlated, which was not unexpected as the literature has shown only weak correlations. Handwipes are a more integrative measure of exposure as it represents all the locations a child has recently been, whereas dust only provides information about one particular microenvironment. However, a potential issue with handwipes is that handwashing immediately prior to sampling may reduce handwipe levels so they are no longer representative of body burden (Watkins et al. 2011b). It was noted that one child had washed his hands before sampling, and we are unsure what effect this had on his handwipe levels. Despite this problem, handwipe sampling has the advantage of being faster, easier, and easier to standardize than dust collection. D. Limitations While sample size for our study was much larger than those previously studied, power was still limited when the group was broken down into strata. Likewise, the sample size for the dust and handwipes was very small. We did not have appropriate statistical power, and we may have missed some correlations. Dust sample size was intended to be larger, but there was great difficulty gaining subject participation. It is unclear what can be done to boost participation in dust sampling. 35 Another major limitation of this study was that BDE-209 was not measured, despite evidence that it is an important contributor to ΣPBDE. As BDE-209 is the principle component of the Deca commercial mixture, we have no data on Deca exposure. Knowing Deca exposure is important because it is only PBDE still currently produced in the United States and there is increasing evidence that it may be more biologically relevant than first thought (Frederiksen et al. 2009). E. Future Studies Another branch of the BEAT study will be the investigation of serum thyroid hormone levels in the study population. We want to determine if there are any associations between serum PBDE and thyroid hormone levels, as that has been an experimentally determined health outcome for PBDE exposure. Due to time constraints, several proposed components of the current study were not completed. In the full study, dust and handwipe samples will be reanalyzed for BDE209. Also, technician collected dust samples will be compared to home vacuum dust samples to see if they are well correlated. If so, home vacuum bags could be an easy way to boost participation in the study. A potential future study is determination of the relative contributions direct absorption (dermal), inhalation, and ingestion to dust exposures, and if there are differences in congener composition between these three exposure scenarios. In the future, we may try to sieve particles into fractions that would represent inhalation, ingestion, and dermal exposures. 36 Beyond the scope of this study, little is known about the exposure potential of the flame retardants replacing Penta and Octa. Studies on exposure and toxicity to new flame retardants like Firemaster 550 and Chlorinated Tris must be undertaken as PBDE exposures begin to decline. F. Conclusions The data generated by BEAT project is intended for publication in peer-reviewed scientific journals. For young child serum PBDE levels, our study represents one of the largest and most diverse groups studies to date. Additionally, only one other study has investigated child serum, child handwipes, and household dust in the same individuals for PBDEs. This study represents a much need addition to the current scientific literature. The future aim of BEAT is to scale-up this pilot study in order to better identify trends and associations between serum, dust, handwipes, and thyroid hormone levels. In general, more studies are needed to test predictors of exposure as the current understanding is very limited. Likewise, handwipes appear to have potential as a new matrix, but more studies and validation are needed to fully determine the variability and factors that may affect results. 5. REFERENCES Birnbaum LS, Hubal EAC. 2006. Polybrominated diphenyl ethers: A case study for using biomonitoring data to address risk assessment questions. Environ Health Perspect 114(11): 17701775. Krol S, Zabiegala B, Namiesnik J. 2012. Determination of polybrominated diphenyl ethers in house dust using standard addition method and gas chromatography with electron capture and mass spectrometric detection. J Chromatogr A 1249: 201-214. 37 Frederiksen M, Vorkamp K, Thomsen M, Knudsen LE. 2009. Human internal and external exposure to PBDEs - A review of levels and sources. Int J Hyg Environ Health 212(2): 109-134. Talsness CE. 2008. Overview of toxicological aspects of polybrominated diphenyl ethers: A flame-retardant additive in several consumer products. Environ Res 108(2): 158-167. Chen AM, Chung E, DeFranco EA, Pinney SM, Dietrich KN. 2011. Serum PBDEs and age at menarche in adolescent girls: Analysis of the National Health and Nutrition Examination Survey 2003-2004. Environ Res 111(6): 831-837. Branchi I, Capone F, Alleva E, Costa LG. 2003. Polybrominated diphenyl ethers: Neurobehavioral effects following developmental exposure. Neurotoxicology 24(3): 449-462. Boas M, Main KM, Feldt-Rasmussen U. 2009. Environmental chemicals and thyroid function: an update. Curr Opin Endocrinol Diabetes Obes 16(5): 385-391. Trudel D, Scheringer M, von Goetz N, Hungerbuhler K. 2011. Total Consumer Exposure to Polybrominated Diphenyl Ethers in North America and Europe. Environmental Science & Technology 45(6): 2391-2397. Birnbaum LS, Staskal DE. 2004. Brominated flame retardants: cause for concern? Environ Health Perspect 112(1): 9-17. Turyk ME, Persky VW, Imm P, Knobeloch L, Chatterton R, Anderson HA. 2008. Hormone Disruption by PBDEs in Adult Male Sport Fish Consumers. Environ Health Perspect 116(12): 1635-1641. Hagmar L, Bjork J, Sjodin A, Bergman A, Erfurth EM. 2001. Plasma levels of persistent organohalogens and hormone levels in adult male humans. Arch Environ Health 56(2): 138-143. Julander A, Karlsson M, Hagstrom K, Ohlson CG, Engwall M, Bryngelsson IL, et al. 2005. Polybrominated diphenyl ethers - plasma levels and thyroid status of workers at an electronic recycling facility. Int Arch Occup Environ Health 78(7): 584-592. Chevrier J, Harley KG, Bradman A, Sjodin A, Eskenazi B. 2011. Prenatal Exposure to Polybrominated Diphenyl Ether Flame Retardants and Neonatal Thyroid-Stimulating Hormone Levels in the CHAMACOS Study. Am J Epidemiol 174(10): 1166-1174. Chevrier J, Harley KG, Bradman A, Gharbi M, Sjodin A, Eskenazi B. 2010. Polybrominated Diphenyl Ether (PBDE) Flame Retardants and Thyroid Hormone during Pregnancy. Environ Health Perspect 118(10): 1444-1449. Roze E, Meijer L, Bakker A, Van Braeckel K, Sauer PJJ, Bos AF. 2009. Prenatal Exposure to Organohalogens, Including Brominated Flame Retardants, Influences Motor, Cognitive, and Behavioral Performance at School Age. Environ Health Perspect 117(12): 1953-1958. Herbstman JB, Sjodin A, Kurzon M, Lederman SA, Jones RS, Rauh V, et al. 2010. Prenatal Exposure to PBDEs and Neurodevelopment. Environ Health Perspect 118(5): 712-719. 38 Gascon M, Fort M, Martinez D, Carsin AE, Forns J, Grimalt JO, et al. 2012. Polybrominated Diphenyl Ethers (PBDEs) in Breast Milk and Neuropsychological Development in Infants. Environ Health Perspect 120(12): 1760-1765. Hites RA. 2004. Polybrominated diphenyl ethers in the environment and in people: A metaanalysis of concentrations. Environmental Science & Technology 38(4): 945-956. Whitehead T, Metayer C, Buffler P, Rappaport SM. 2013. Estimating exposures to indoor contaminants using residential dust (vol 21, pg 549, 2011). J Expo Sci Environ Epidemiol 23(1): 110-110. Zota AR, Rudel RA, Morello-Frosch RA, Brody JG. 2008. Elevated House Dust and Serum Concentrations of PBDEs in California: Unintended Consequences of Furniture Flammability Standards? Environmental Science & Technology 42(21): 8158-8164. Lunder S, Hovander L, Athanassiadis I, Bergman A. 2010. Significantly Higher Polybrominated Diphenyl Ether Levels in Young US Children than in Their Mothers. Environmental Science & Technology 44(13): 5256-5262. Toms LML, Sjodin A, Harden F, Hobson P, Jones R, Edenfield E, et al. 2009. Serum Polybrominated Diphenyl Ether (PBDE) Levels Are Higher in Children (2-5 Years of Age) than in Infants and Adults. Environ Health Perspect 117(9): 1461-1465. Rose M, Bennett DH, Bergman A, Fangstrom B, Pessah IN, Hertz-Picciotto I. 2010. PBDEs in 25 Year-Old Children from California and Associations with Diet and Indoor Environment. Environmental Science & Technology 44(7): 2648-2653. Eskenazi B, Fenster L, Castorina R, Marks AR, Sjodin A, Rosas LG, et al. 2011. A Comparison of PBDE Serum Concentrations in Mexican and Mexican-American Children Living in California. Environ Health Perspect 119(10): 1442-1448. Johnson-Restrepo B, Kannan K. 2009. An assessment of sources and pathways of human exposure to polybrominated diphenyl ethers in the United States. Chemosphere 76(4): 542-548. Lorber M. 2008. Exposure of Americans to polybrominated diphenyl ethers. J Expo Sci Environ Epidemiol 18(1): 2-19. Johnson PI, Stapleton HM, Slodin A, Meeker JD. 2010. Relationships between Polybrominated Diphenyl Ether Concentrations in House Dust and Serum. Environmental Science & Technology 44(14): 5627-5632. Wu N, Herrmann T, Paepke O, Tickner J, Hale R, Harvey E, et al. 2007. Human exposure to PBDEs: Associations of PBDE body burdens with food consumption and house dust concentrations. Environmental Science & Technology 41(5): 1584-1589. Stapleton HM, Eagle S, Sjodin A, Webster TF. 2012. Serum PBDEs in a North Carolina Toddler Cohort: Associations with Handwipes, House Dust, and Socioeconomic Variables. Environ Health Perspect 120(7): 1049-1054. 39 Watkins DJ, McClean MD, Fraser AJ, Weinberg J, Stapleton HM, Sjödin A, et al. 2011a. Impact of Dust from Multiple Microenvironments and Diet on PentaBDE Body Burden. Environmental Science & Technology 46(2): 1192-1200. Watkins DJ, McClean MD, Fraser AJ, Weinberg J, Stapleton HM, Sjödin A, et al. 2011b. Exposure to PBDEs in the Office Environment: Evaluating the Relationships Between Dust, Handwipes, and Serum. Environ Health Perspect 119(9): 1247-1252. U.S. EPA (Environmental Protection Agency). 2011. Exposure Factors Handbook: 2011 edition (Final). EPA/600/R-09/052F. Washington, DC: U.S. Environmental Protection Agency. Allen JG, McClean MD, Stapleton HM, Webster TF. 2008. Critical factors in assessing exposure to PBDEs via house dust. Environ Int 34(8): 1085-1091. Muenhor D, Harrad S. 2012. Within-room and within-building temporal and spatial variations in concentrations of polybrominated diphenyl ethers (PBDEs) in indoor dust. Environ Int 47: 23-27. Stapleton HM, Kelly SM, Allen JG, McClean MD, Webster TF. 2008. Measurement of polyhrominated diphenyl ethers on hand wipes: Estimating exposure from hand-to-mouth contact. Environmental Science & Technology 42(9): 3329-3334. Virginia, EJ. 2012. Polybrominated Diphenyl Ether (PBDE) Serum Concentrations in Children Ages 15 Months to 5 Years [MPH thesis]. Atlanta, GA: Emory University, Rollins School of Public Health, Atlanta. Bernert JT, Turner WE, Patterson DG, Needham LL. 2007. Calculation of serum "total lipid" concentrations for the adjustment of persistent organohalogen toxicant measurements in human samples. Chemosphere 68(5): 824-831. La Guardia MJ, Hale RC, Harvey E. 2006. Detailed polybrominated diphenyl ether (PBDE) congener composition of the widely used penta-, octa-, and deca-PBDE technical flame-retardant mixtures. Environmental Science & Technology 40(20): 6247-6254. Quiros-Alcala L, Bradman A, Nishioka M, Harnly ME, Hubbard A, McKone TE, et al. 2011. Concentrations and loadings of polybrominated diphenyl ethers in dust from low-income households in California. Environ Int 37(3): 592-596. 6. NON-PRINT SOURCES BSEF (Bromine Science and Environmental Forum). 2012. Legislation on BFRs in North America. Available: http://www.bsef.com/regulation/north-america [accessed 15 April 2013]. CDC (Centers for Disease Control). 2012. Children's BMI Tool for Schools. Available: http://www.cdc.gov/healthyweight/assessing/bmi/childrens_bmi/tool_for_schools.html [accessed 2 February 2012]. 40 7. TABLES & FIGURES Table 1. Study Compounds, Sources and Grades Compound Grade/Purity Source Dichloromethane (DCM) HPLC Grade/>99.8% Sigma Aldrich® Hexane (Hex) 98.5% Sigma Aldrich® Sulfuric Acid 98.08% Macron Fine ChemicalsTM Anhydrous Sodium Sulfate >99.0% Sigma Aldrich® Toluene 92.14% Macron Fine ChemicalsTM Isopropyl Alcohol 99.5% EMD Chemicals Inc. Figure 2: GC/MSD PBDE Congener Chromatogam Profile by Acquisition Time BDE‐47 BDE‐100 BDE‐99 BDE‐85 BDE‐154 BDE‐153 41 Table 2: Subject Demographic Information n Percent Age (years) 81 >2 10 12.35 2‐3 26 32.1 3‐4 18 22.22 4‐5 13 16.05 5+ 14 17.28 Sex 81 Male 46 56.79 Female 35 43.21 Race 81 African American 33 40.74 Caucasian 39 48.15 Other 9 11.11 # of Surgical Procedures 81 1 36 44.44 2 30 37.04 3 15 18.52 Household Smoking 70 No 56 80 Yes 14 20 Insurance Status 81 Medicaid 51 62.96 Private 30 37.04 Breastfeeding Status 81 No 33 40.74 Yes 48 59.26 BMI Age‐Related Percentile 70* 0>25 16 22.86 25>50 9 12.86 50>75 13 18.57 75>100 32 45.71 * BMI measurements for children under 2 years of age cannot be reliably compared. Subjects with incomplete height and/or weight data or under 2 years were not included in BMI analyses. 42 Table 4: Congener Frequency of Detection in Different Matrices Sample Type BDE‐ Frequency (%) 47 89.77 85 11.11 99 98.77 Serum (n=81) 100 82.72 153 66.67 154 14.81 47 100 85 100 99 100 Dust (n=15) 100 100 153 100 154 100 47 100 85 86.67 99 100 Handwipes (n=13) 100 100 153 69.23 154 61.54 43 Table 5: Stratified Serum PBDE Congener and Summed Concentrations (ng/g lipid) N BDE‐ Mean Median Std Min Max Dev Age (years) <2 10 2‐3 26 3‐4 18 4‐5 13 5+ 14 Male 46 47 85 99 100 153 154 SUM 47 85 99 100 153 154 SUM 47 85 99 100 153 154 SUM 47 85 99 100 153 154 SUM 47 85 99 100 153 154 SUM 119.49 2.21 33.18 21.45 14.61 3.21 194.15 41.01 0.90 13.16 6.06 7.67 1.66 70.47 51.47 1.23 12.82 9.99 9.60 1.45 86.55 37.25 0.95 10.22 6.43 9.20 1.40 65.47 50.20 0.61 12.85 9.19 14.58 0.99 88.41 43.05 0.66 14.17 8.61 8.35 1.07 72.34 34.82 0.61 10.07 5.29 6.06 1.06 58.13 33.24 0.65 9.03 6.00 5.88 1.06 62.92 34.01 0.67 7.41 5.60 3.79 1.15 59.44 46.24 0.58 8.78 7.66 6.38 0.95 72.09 190.02 4.99 57.64 37.62 22.98 6.92 319.00 30.41 0.93 11.87 5.44 4.72 1.62 49.83 50.13 1.82 10.51 8.62 8.42 1.32 69.04 23.64 0.92 7.75 6.39 10.14 0.74 41.33 37.18 0.18 12.65 8.38 18.58 0.30 62.43 7.45 0.41 3.04 0.29 2.33 0.66 16.28 0.10 0.38 0.31 0.25 2.46 0.62 5.74 0.07 0.37 3.55 0.30 1.65 0.68 24.60 7.68 0.39 2.22 0.28 2.78 0.63 15.44 4.54 0.31 1.46 0.24 2.53 0.51 11.19 642.13 16.41 193.57 125.79 78.81 22.89 1079.61 141.61 4.16 55.37 24.82 18.28 8.16 251.99 193.85 8.06 36.05 29.21 28.15 6.22 275.40 75.76 3.95 24.43 17.88 36.54 3.55 126.03 149.36 1.01 52.13 26.27 69.37 1.64 237.33 47 85 99 100 153 154 SUM 38.36 0.80 12.03 6.71 9.36 1.40 68.67 29.11 0.63 8.00 5.01 4.89 1.06 57.58 32.61 0.70 11.94 6.69 11.56 1.20 54.22 0.07 0.38 0.31 0.24 1.65 0.63 5.74 149.36 3.95 55.37 24.82 69.37 8.16 251.99 Sex 44 Female 35 47 85 99 100 153 154 SUM 74.57 1.48 18.97 13.01 11.76 1.97 121.77 47.65 0.65 12.55 7.68 8.06 1.06 79.74 107.49 2.97 31.89 21.14 14.10 3.81 177.24 4.54 0.31 1.46 0.25 2.49 0.51 11.19 642.13 16.41 193.57 125.79 78.81 22.89 1079.61 African American 33 White Caucasian 30 Hispanic Caucasian 7 Other 9 47 85 99 100 153 154 SUM 47 85 99 100 153 154 SUM 47 85 99 100 153 154 SUM 47 85 99 100 153 154 SUM 52.96 1.18 15.46 11.16 10.90 1.75 93.41 61.74 10.01 16.68 1.28 1.87 11.84 103.42 34.83 5.04 8.76 0.57 1.34 4.78 55.33 39.49 0.67 9.50 3.31 8.90 0.93 62.81 41.54 0.65 12.44 9.25 9.69 1.15 79.74 40.07 4.97 7.92 0.66 1.10 4.82 61.15 26.33 2.17 6.20 0.60 1.05 3.34 37.16 32.56 0.61 8.78 2.75 6.67 0.95 61.51 41.61 1.54 11.55 7.49 8.46 1.67 61.20 115.00 22.76 34.78 2.93 4.00 18.24 191.79 35.39 7.12 7.20 0.18 0.79 2.69 52.01 22.77 0.29 5.24 3.48 8.16 0.13 33.82 0.07 0.38 3.60 0.29 2.49 0.62 26.68 0.10 0.24 0.31 0.31 0.51 2.33 5.74 4.54 0.28 1.46 0.37 0.63 2.78 11.19 15.56 0.42 3.55 0.25 1.65 0.68 24.60 193.85 8.06 55.37 29.21 37.47 8.16 275.40 642.13 125.79 193.57 16.41 22.89 78.81 1079.61 110.78 20.18 23.18 0.87 2.49 9.52 166.52 86.40 1.42 19.57 9.88 26.12 1.06 122.48 47 85 99 100 153 154 SUM 47 85 99 100 56.09 1.21 16.20 10.57 12.31 1.97 98.35 50.47 0.89 13.04 7.51 33.92 0.64 9.91 6.82 7.68 1.06 63.39 40.33 0.65 8.31 5.37 89.63 2.34 27.23 17.95 15.07 3.31 149.31 47.13 1.37 12.71 7.71 0.07 0.37 1.46 0.25 1.65 0.63 11.19 0.10 0.31 0.31 0.24 642.13 16.41 193.57 125.79 78.81 22.89 1079.61 193.85 8.06 52.13 29.21 Race Insurance Medicaid 51 Private 30 45 153 154 SUM 7.14 1.10 80.15 4.82 1.08 62.18 5.95 0.35 68.33 2.33 0.51 5.74 26.12 1.97 275.40 47 85 99 100 153 154 SUM 47 85 99 100 153 154 SUM 74.28 1.43 19.18 12.18 9.60 1.95 118.63 40.07 0.86 12.18 7.55 10.94 1.44 73.04 47.55 0.64 11.18 6.81 5.73 1.07 69.95 32.32 0.64 8.58 5.98 6.18 1.06 60.18 111.75 3.02 33.06 21.97 13.28 3.89 184.79 30.67 0.83 11.31 6.74 12.38 1.27 51.14 7.68 0.31 2.22 0.25 2.49 0.51 15.44 0.07 0.38 0.31 0.24 1.65 0.63 5.74 642.13 16.41 193.57 125.79 78.81 22.89 1079.61 149.36 4.16 55.37 26.27 69.37 8.16 251.99 42.28 0.78 11.23 9.78 16.02 1.48 81.57 71.04 0.94 17.79 12.70 14.85 1.25 118.58 43.26 1.18 13.74 5.51 7.45 1.92 73.06 39.75 0.92 11.17 6.23 6.24 1.26 65.57 27.07 0.65 8.58 7.62 10.26 1.06 68.57 61.60 0.57 18.06 11.72 12.49 1.07 119.33 28.64 0.64 6.89 3.80 5.69 1.07 46.20 38.19 0.65 8.60 5.85 4.09 1.06 62.01 38.38 0.61 10.10 8.89 17.89 1.36 60.84 54.66 1.13 11.09 9.06 10.27 0.60 73.86 39.03 1.26 15.06 6.93 5.12 2.19 65.10 26.15 1.34 9.32 5.01 4.54 0.68 40.14 0.07 0.39 0.31 0.31 2.49 0.63 5.74 8.53 0.37 2.98 0.26 2.53 0.72 24.20 5.47 0.41 1.87 0.25 1.65 0.66 12.60 4.54 0.31 1.46 0.24 2.46 0.51 11.19 129.09 3.00 32.85 26.27 69.37 6.22 211.61 193.85 3.95 36.05 29.21 36.54 2.49 275.40 141.61 4.16 55.37 24.82 18.28 8.16 251.99 149.36 8.06 52.13 23.54 22.19 3.55 237.33 Breastfeeding Status No 33 Yes 48 BMI (Age Adjusted Percentile) 0>25 16 25>50 9 50>75 13 75>100 32 47 85 99 100 153 154 SUM 47 85 99 100 153 154 SUM 47 85 99 100 153 154 SUM 47 85 99 100 153 154 SUM 46 8. APPENDICES A. Standard Operating Procedure for BEAT Dust Collection 1. Title of Standard Operating Procedure Emory University/RSPH Standard Operating Procedures: F01 BEAT STUDY Collection of House Dust Samples for Pesticide Analysis, Rev. 1.0. 2. Overview and Purpose This standard operating procedure reviews the procedures for house dust field collection for the BEAT (Body Burden) Study. The collection method uses a high volume small surface sampler (HVS3) for dust collection from bare and carpeted floors. 3. Discussion The HVS3 built by CS3 of Bend, Oregon, has a sampling train made from aluminum. For sampling pesticides, Teflon gaskets and tube connections are used. The HVS3 may be connected to normal household outlets. House dust more than 5 μm in diameter will be collected. Particles larger than 150 μm in diameter will be sieved out in the laboratory before analysis, as larger particles are less likely to adhere to skin or to be ingested inadvertently by the age group studied. Pesticides will be measured in units of ng/g. In addition, the area sampled will be recorded, so loadings can also be expressed as mass per square meter. 4. Personnel Responsibilities Sampler Preparation and Maintenance Teflon catch bottles and all metal parts of the HVS3 will be cleaned at RSPH according to SOP “L01 Trace cleaning Vacuum and collection bottle rev. 01.” Sampler preparation is the responsibility of the field technicians. The field technicians are also responsible for preparing Field Packets and equipment box. Sample Collection The field technicians are responsible for all aspects of sample collection. Also responsible for contacting and setting appointments. Storage Immediate storage of the sample upon return to RSPH is the responsibility of the field technicians. Custody will be turned over to the lab technician(s) for extraction and/or long-term storage. Sieving and Division The field technicians are responsible for sieving and division of samples prior to extraction (see SOP L02 Beat Sieving and Division of Dust Samples rev. 1). 5. Required Equipment and Reagents 47 RSPH Laboratory (before field sampling) 2 catch bottles (1 for samples + 1 extra): trace-cleaned Teflon FEP wide mouth bottles, 8 oz./250 mL capacity, pre-weighed, with weight recorded on House Dust Sampling – Field Log (attached) lab tape plastic bags, sealable, 1-quart (about 6" x 10", to hold catch bottle) Field Sampling tape measure, approximately 25 feet long (8 m), Craftsman 1" wide recommended easy peel-off laboratory tape (lab tape) 1 high volume small surface samplers (HVS3) (metal and Teflon parts of sampling train trace cleaned; nozzle covered in acetonitrile-rinsed aluminum foil; 1 tracecleaned HVS3’s will be used at each house) HVS3 maintenance record (kept with sampler) heavy duty extension cord, at least 25 feet long 3-prong outlet adaptor tools: screwdriver, wrench wipes, Kimwipe or equivalent plastic bottle of ethanol (for wiping HVS3 wheels prior to sampling) spare filter bag for HVS3 Teflon catch bottles with caps, trace-cleaned, in Ziploc bags disposable powder-free gloves, in Ziploc bags two sheets of aluminum foil (for covering Teflon catch bottles to keep out light after sampling) plastic box for toting supplies RSPH Laboratory (after field sampling) freezer materials and supplies for trace-cleaning metal and Teflon HVS3 parts Sample Tracking and Paperwork Field Packet for household: field log/floor plan, chain-of-custody form Field Manual (SOPs) clipboard pens, ballpoint, 2 black or blue for field log/floor plan 6. Procedure 6.1 Preparation for Collection 6.1.1 Assembly, Calibration, and Maintenance of HVS3 The field technicians are responsible for assembly, calibration, and maintenance of the HVS3. They will record assembly, calibration, and filter bag changes on the maintenance record sheet that is kept for each HVS3. 48 Assembly: The HVS3 will be assembled and tested no more than 2 weeks prior to the beginning of study sampling. For assembly instructions, see section 3.4 of the HVS3 Manual. Calibration: A full flow calibration will be conducted no more than two weeks prior to the beginning of study sampling. For directions, see the HVS3 Manual, section 3.3. Zero the gauge in the position in which it will be used. Filter bag: Bags will be changed immediately prior to beginning of study sampling and the changed logged in the maintenance records (attached). Later in the study, if the flow rate cannot be adjusted for sampling, change the bag and record the change on the maintenance record. 6.1.2 Reminder to Respondent The field technicians will contact the subject and remind her/him about the sampling appointment at least 3 days ahead of the appointment. Include instructions that respondent refrain from vacuuming for at least three days prior to sampling. 6.1.3 Identification Labels The field technicians will: Hand write ID labels for each sample to be collected from a particular house that day. For each sample to be collected, record ID on the floor plan sheet. Assemble the Field Packet for the household. The Field Packet should include one floor plan sheet for each sample to be collected and this SOP. Weigh the trace-cleaned, empty Teflon catch bottle with the lid screwed on to the nearest 0.1 gram. Record the weight in the box marked, “Before sampling (empty)” on the House Dust Sampling – Field Log. If the weights of the 3 empty Teflon bottles going to the same house differ by more than 1 gram, then put a piece of lab tap marking each bottle 1, 2 or 3 and record the bottle number on the field log. 6.1.4 Daily Maintenance of HVS3 – for each vacuum used: At RSPH, after sampling, the field technicians will: Place any unused catch bottles in a designated storage area to be relabeled. Feel the filter bag. If it feels almost full, change it and record the change on the maintenance record. Decontaminate nozzles and tubing, following SOP L02: Trace Cleaning of 49 vaccum and parts. 6.1.5 Teflon Catch Bottle – for each sample collected: Weigh the dust-filled Teflon catch bottle with its lid on to the nearest 0.1 gram. Record the weight in the box marked, “After sampling (full)” on the House Dust Sampling – Field Log. Enter the full bottle weight again on the “House Dust and Soil – Sieving Log” and complete sieving tasks. Decontaminate catch bottle following SOP L02: Trace Cleaning of vaccum and parts. If there are clean bottles that were taken to the field but not used, remove the labels and treat them like new clean bottles. 6.2 Selection of Sampling Locations One floor dust sample will be collected from the room the child spends most of their time in. 6.2.1 Dust sampling The field technician will ask the caregiver which room the child spends the most time in. For each room sampled, the technician will: Remove her shoes prior to entering the room to be sampled; store shoes outside the room. Choose a sampling area in the room that: - is in the main footpath or play area - is accessible by the HVS3 apparatus - is at least 1 meter from an outside door - does not require moving furniture Areas with carpet or rug are preferred. On the floor plan form for that room, sketch a floor plan with measurements. (It does not have to be exactly to scale; see example.) Note all significant features, but especially the location of windows, doors, and the area sampled. The location of the sampling area should be measured with the meter tape and documented on the floor plan form. Choose the area to be sampled and measure the distances from two walls. On the floor plan, sketch the location of the area and record the sampling location and type(s) of floor covering. 50 6.3 Sample Collection Procedure 6.3.1 General – for each room to be sampled: Enter the HVS3 number, your initials and date onto the House Dust Sampling – Field Log Place the template on the area to be sampled and secure it with tape. Note the type of surface and/or type of rug (if relevant) on the floor plan. Ask the caregiver what date that area was last vacuumed or swept and enter the information on the floor plan. Put on a clean pair of gloves. 6.3.2 Pre-Sampling Checks 6.3.2aLeak Check (section 4.2 of HVS3 Manual) Seal the inlet tubing by placing the back of the clipboard across the end. Turn on the HVS3 with the switch at the top of the handle. The flow Magnehelic gauge should read between 0-0.02 inches of water. If the gauge reads more than 0.02 inches of water, check that all connections of gauge tubing are correct and sealed tightly. If all tubing is connected properly and the flow through the system still exceeds 0.02 inches of water, check all gaskets and tightness of clamps, catch bottle, and the plug sealing the inlet tubing. If the flow gauge continues to read more than 0.02 inches of water, note the gauge reading in the “Technician comments” section of the floor plan. 6.3.2b Setting Nozzle Pressure Drop [section 5.2 of HVS3 manual] Clean the plastic wheels with a Kimwipe and alcohol. Make sure the wheels are dry before beginning sampling. Remove the foil from the nozzle and place the HVS3 in the lower left corner of the sampling area. Adjust the flow rate and pressure drop according to the surface (wood or carpet). The two factors that affect the efficiency of a sampling system are the flow rate and the pressure drop at the nozzle. The pressure drop at the nozzle is a function of the flow rate and the distance between the surface and the nozzle flange. Pressure drops and flows will change as you vacuum. Try to keep the average values at least equal to those in Table 1. Slightly higher is better than slightly lower. 51 Table 1 -- Target HVS3 Flow Rate and Nozzle Pressure Drop During Sampling (cfm = cubic feet per minute) Surface Flow Rate Nozzle Pressure Drop (inches of water) cfm inches of water Carpet, level loop 16 5 10 Carpet, other (plush, multilevel, shag) 20 8 9 Hard (wood, tile, etc.) 20 8 9 To regulate the nozzle position, use the height control knob on the back of the HVS3 and the nozzle level adjustment knob on the front of the nozzle. (See Figure 5-3 on page 15 of the HVS3 manual.) To regulate the flow rate, use the butterfly valve on the control tube on the downstream side of the cyclone. The flow is measured by the pressure drop across the cyclone. The higher the flow, the higher the pressure drop. On level loop carpet: - Adjust the height of the nozzle until the bubble level is centered. If the HVS3 is close to the position required but the nozzle bubble is not centered, use the leveling knob on the nozzle. - Once it is leveled, set the flow rate with the butterfly valve. Check the flow rate on the flow gauge (marked Q). - Tip the HVS3 forward for a few seconds so that the carpet will seal to the nozzle. Set the flow so that the flow gauge reads 5". - Read the pressure drop across the nozzle. It should be approximately 10". If it is not, recheck the flow and/or check that the nozzle is still level. - If the pressure drop still does not read 10”, note the gauge reading in the “Technician comments” section of the floor plan. On other carpet (plush, multilevel, shag): - Read the pressure drop across the nozzle. Set the pressure drop at approximately 9" on the nozzle gauge by using the height adjustment knob and the level knob to keep the nozzle level. - Check the flow rate. Use the butterfly valve to set it at about 8". - Check the pressure drop across the nozzle again. It will have changed from 9" because of the increased flow rate, which increased the pressure 52 drop across the nozzle and vice versa. - Set the nozzle pressure drop to 9" again, using the height adjustment. - You will probably need to make a few small adjustments three or four times until it is set right. It need not be exact. The flow rate should be between 8" and 9", and the nozzle pressure drop should be between 9" and 9.5". - If the pressure drop still does not read 9-9.5”, note the gauge reading in the “Technician comments” section of the floor plan. If the carpet is thin and the vacuum sucks it up, open the butterfly valve and readjust. If the flow rate cannot be adjusted for sampling, change the filter bag. Record the change on the maintenance record sheet. Check that the lever at the bottom is in the notch next to the lowest, so that the handle is at a 45º angle with the floor. With the handle at this angle and a firm downward pressure, the HVS3 is much less likely to nosedive. 6.3.3 Sample Collection Begin sampling by moving the nozzle forward and back along the left edge of the area marked by the template, covering an area 7.5 cm (3") wide and 1 m long. Vacuum this area 8 times (4 back-and-forth passes). Move the sampler at about 0.5 m per second, so it should take 2 seconds to travel 1 m. Move in a straight line between the numbers on the tape. After 4 back-and-forth passes on the first strip, gradually angle over to the next 7.5 cm wide strip and repeat 4 back-and-forth passes. Repeat until you have sampled about half the area of the template. Take care not to step inside the template on areas that you have not yet sampled; it is OK to step on places you have already vacuumed. When you have sampled 1 square meter, turn the vacuum off and check the amount of collected material in the catch bottle. (Don't count hair and fluff.) If it appears that at least 6 mm (1/4 inch) of material has been obtained, stop vacuuming. Calculate the area sampled by noting the width of the cleaned area on the measuring tapes. An area 1 m by 1 m is 1 m2. Record the area on the logsheet. After vacuuming 1 m2, if less than 6 mm has been obtained, mark off another 1m2 area next to the first and vacuum it. When enough material is collected, record the area on the logsheet. If the bottle is more than 25% full, or if material in the bottle swirls near the top of the bottle when the vacuum is on, take the bottle off and cap it with its own 53 cap from the plastic storage bag. Secure the bottle cap with lab tape. Place the bottle in its plastic storage bag and place it in the cooler with cold packs. Record the number of bottles used on the logsheet. Install a new bottle and continue sampling. When you have enough dust, turn off the HVS3. Tap on the U-tube and cyclone vigorously to dislodge any particles trapped in the sampling train. Unscrew the catch bottle. Holding the catch bottle under the cyclone, gently tap the threads on the cyclone to be sure any particles trapped in the threads are dislodged into the catch bottle. Gently tap the catch bottle a few times to allow particles to settle and cap it with its own cap from the plastic storage bag. Screw the cap on tightly and secure it with lab tape. Wrap the bottle tightly with foil to protect it from light. Place the bottle in its plastic Ziploc and place it in the cooler with cold packs. Remove the gloves and discard them in the trash bag. Finish the floor plan sketch if necessary and fill in any missing information on the floor plan form. Tell the caregiver you are finished sampling that room and thank her/him for her/his help. 6.4 Decontamination and Reassembly – at RSPH Unfasten the clamps and disassemble each HVS3 from the nozzle to the control valve tube (see Figure 3-1 of HVS3 manual). You do not need to clean the control valve tube or anything between it and the vacuum bag. You do not need to trace clean the metal clamps. Wipe each wheel with a Kimwipe to remove any dirt or dust. Separate the Teflon joints from the metal parts and the gaskets from their corresponding parts. Rinse all the loose parts under the faucet to remove the dirt. Scrub each part (including the flexible joints and gaskets) with a plastic test tube brush in a warm water-Liquinox solution. Clean each part separately, rotating it so that each internal surface is washed and brushed. Rinse off the Liquinox then rinse each part 3 times with tap water, 3 times with DI water and then one final time with MilliQ water. Inspect each part to be sure that there is no visible trace of dust. If any dust is visible, wash the part again. Let the parts dry in the fume hood on acetonitrile-rinsed aluminum foil. 54 When parts are dry, rinse all sampling surfaces with acetonitrile using a Teflon squirt bottle. Be sure that all surfaces that will come into contact with the sample are rinsed with acetonitrile. Let the acetonitrile evaporate under the fume hood; when parts are dry, the vacuums can be reassembled. 6.5 Reassembly – at RSPH Put on a clean pair of nitrile gloves. Secure a piece of trace clean aluminum foil over the mouth of the cyclone where the catch bottle attaches. Use a rubber band or lab tape to be sure the foil stays on tight even when the HVS3 is being loaded/unloaded into the car. Secure a piece of trace clean aluminum foil over the nozzle. Use a rubber band or lab tape to be sure the foil stays on tight even when the HVS3 is being loaded/unloaded into the car. Wrap the other trace-clean parts in acetonitrile-rinsed foil (OK to use the foil from the floor of the fume hood as long as it is try), and bring them to the HVS3 assembly area. Put the HVS3 back together using Figure 3-1 of the HVS3 user manual as a guide. Be sure the trace-clean parts do not touch the floor or any other contaminated surface while you are reassembling each HVS3. Assemble only one HVS3 at a time, taking care to keep the parts trace clean while not using them. 6.6 Storage Prior to Sieving Dust samples should be sieved in the laboratory within a week of collecting. They can be stored, tightly sealed, in a draw before processing. If a dust sample cannot be sieved on the same day it is collected, the field technician may transfer the sample to a traceclean amber glass jar for temporary storage: Wipe the balance area clean with a paper towel, and water if necessary. Use the camel’s hair brush to clean the balance pan and inside the balance. Bring the filled Teflon catch bottle, a trace-clean 120 mL amber glass jar, a piece of acetonitritile-rinsed foil, a pen, and the House Dust and Soil – Sieving Log over to the balance area. Enter the sample ID, UID, cycle, and sampling day on the Sieving Log. Weigh the sample-filled catch bottle with lid to the nearest 0.1 g and record the weight on the sieving log in the row labeled, “Mass of full Teflon bottle w/lid 55 (g).” Put on a clean pair of nitrile gloves. Place a sample ID label on the amber glass jar, and an identical label on the lid (a handwritten label on lab tape is OK, just be sure the ID number is correct). Zero the balance. Weigh the empty amber glass jar with its lid on to the nearest 0.1 g and record the weight on the sieving log in the row labeled, “Mass of empty amber glass jar w/lid (g).” Remove the lid from the amber glass jar and set it aside on the foil, taking care to not get any lab dust or dirt on it. Gently tap the dust from the catch bottle into the amber glass jar making sure you get as much sample as possible into the jar. Some residue will remain on the walls of the catch bottle. That is OK. Screw the lid tightly back on the amber glass jar, weigh it to the nearest 0.1 g, and record the weight on the sieving log in the row labeled, “Mass of full amber glass jar w/lid (g).” Write is the Sample was stored before sieving. Trace clean the Teflon catch bottle and lid following the procedures outlined in Section 6.4. Put the Sieving Log back into the binder labeled, “BEAT STUDY” 6.7 Sample Tracking The ID number will allow tracking of each sample. A data base management system will ensure knowledge of the status and location of any sample at any time including retrospectively. The chain-of-custody form will accompany samples through all transactions. Anyone who receives, transfers, or ships samples will sign and date the form, and keep a photocopy. It must clearly contain all necessary information so that the custody of the sample can be determined at any time. 7. Quality Assurance Procedures 7.1 Field and Laboratory Blanks Field blanks will be prepared by using 10ml of Hexane in the Dust collection bottle. The dust residue left in the bottle will be removed with the hexane and stored in a amber jar with the regular dust samples. Solvent blanks will also be analyzed with every analytical batch. 7.2 Tolerance Limits, Detection Limits, and Sensitivity Limits 56 The tolerance limits, detection limits, and sensitivity limits for the method will be determined through analysis of catch bottle rinse blank, solvent blanks and internal standards of analyte. 8. References CS3, Inc. High Volume Small Surface Sampler (HVS3) Operation Manual. CS3, Inc: Bend, OR. 2001-2004 [Available:www.cs-3.com/HVS3.htm, accessed 20 April 2008]. Harvard University/Emory University/Johns Hopkins University Standard Operating Procedures for the National Human Exposure Assessment Study – Maryland (NHEXASMD), F04 Dust Sampling, September 1995. Emory University/RSPH Standard Operating Procedures: F03 Collection of House Dust Samples for Pesticide Analysis, CEEP Study, Rev. 1.0. B. PBDE GC/MSD Instrument Method Details The method used for analysis of BDE-47, -85, -99, -100, -153, and -154 was developed in-house in the Barr/Ryan laboratory. Chromatographic separation was performed by Agilent 5975 Series Gas Chromatography (GC)/Mass Selective Detector (MSD) system (Agilent Technologies; Waldbronn, Germany). The GC consisted of a temperature-stable column compartment, The GC/MSD was programmed and controlled using MSD ChemStation Software version E.02.02.1431 (Agilent Technologies; Waldbronn, Germany). PBDEs were analyzed by GC/MSD (EI, -10eV). Analyses were carried out using a 7890A GC coupled to a 5975C MSD (Agilent Technologies; Waldbronn, Germany). The system was fitted with a deactivated silca guard column (0.250 mm internal diameter (ID)) (Agilent Technologies; Waldbronn, Germany) connected to a HP-5MS analytical column (15 m x 0.250 ID x 0.25 m film thickness, Agilent Technologies; Santa Clara, CA). It was operated in splitless mode (7.1442 psi, 0.38703 min) with an injector temperature of 250°C.Theheliumcarriergasflowratewas1.5mL/minandthe oventemperatureprogramwasasfollows:100°C(1min),250°C(45°C/min),275°C (5°C/min),and315°C(45°C/min)heldfor8min.Theinterface,source,andquadropole temperaturesweresetto100°C230°C,and150°C,respectively.Selectiveionmonitoring (SIM)wasusedduringthemassspectrometricanalysisofthetargetcompounds.The selectedSIMaresummarizedinTable9. Table 9: Congener‐specific GC/MSD parameters Selective Ion Monitoring Congener RT MW m/z BDE‐47 5.47 485.8 497.7 483.7 485.7 487.7 BDE‐85 7.14 564.69 577.7 563.6 565.6 BDE‐99 6.55 564.7 577.7 563.6 565.6 BDE‐100 6.28 564.69 577.7 563.6 565.6 BDE‐153 8.02 643.62 655.5 643.6 645.5 BDE‐154 7.45 643.59 655.5 643.6 645.5