1
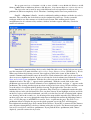
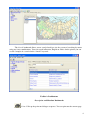
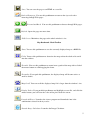
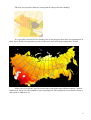
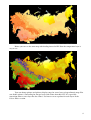
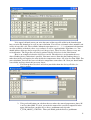
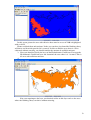
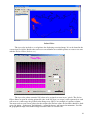
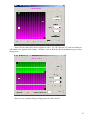
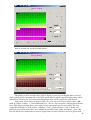
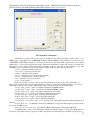
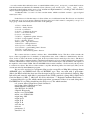
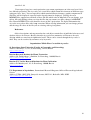
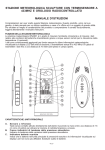
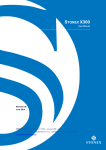
The Agroatlas’s User’s Manual
DVD-Version.
1. Introduction
2. Using the Agroatlas
2.1 System Requirements
2.2 Beginner’s Level - Using the Agroatlas as a source of reference
2.3 Experienced User’s Level - Additional layers’ downloads
2.4 Professional Level - Using the Agroatlas for professional research
2.4.1 The MapAlgebra and Reclassification data block
2.4.2 The Palette Editor
2.4.3 The Agroatlas’s structure
3. Reference
4. List of organizations and individuals who took part in the Agroatlas’s compilation
Introduction
The Atlas of Agrobiological Resources of Russia and Neighbouring Countries (hereunder the
Agroatlas) contains descriptive and cartographic information about agroecological conditions, main
cultivated crops and their wild congeners, diseases, pests and weeds of the territory of the former
USSR. The readers of the Agroatlas belong to the following target groups: research workers, experts
on agriculture, administrative officials, students and others who might be interested in this kind of
information. The Agrotlas has been produced in two languages – Russian and English; therefore it is
accessible for scholars and specialists of the whole world. It consists of several divisions.
1. The Agroecological Division contains climate, soil and vegetation maps.
2. The Cultivated Crops Division contains information on 100 main cultivated crops.
3. The Cultivated Crops’ Wild Congeners Division contains information on 540 wild
congeners which are important or promising for crops breeding arranged by botanical
families.
4. The Cultivated Crops’ Diseases Division contains information on 193 main diseases
arranged by crops’ names.
5. The Cultivated Crops’ Pests Division contains information on 256 pests arranged by
crops’ and crops groups’ names.
6. The Weeds Division contains information on 187 weeds arranged by groups.
The data in the Agroatlas amount to something more than general information on agroecological
conditions, main crops, their wild congeners, diseases, pests and weeds summarized by Russia’s leading
experts. The Agroatlas is a combination of traditional research with GIS-technologies and contains such tools
for GIS-analysis that permit to use it for a wide range of academic and administrative purposes in the fields of
agricultural science and agricultural production.
Using the Agroatlas
In order to facilitate the Agroatlas’s usage we have created a special program shell. It can be
installed on User’s PC from the CD. The Agroatlas’s software tools include: the Agroatlas
(Aatlas.exe), the viewer program (Aaviewer.exe), the raster algebra calculator (ImageCalc.exe), and
the Palette Editor (Palette.exe). The Agroatlas program is the main program of this computergenerated atlas.
System Requirements
Minimum system requirements are: an IBM-compatible PC, Pentium MMX 200, 32 Mb RAM, 20 Mb
of free space on the hard disk, a DVD-ROM-drive, O/S Windows 95 OSR-2, Windows 98 SE, Internet
Explorer 4.0.
1
The program runs best on: Pentium 3-4 1Gh or faster, 256 Mb or more RAM, O/S Windows 98 SE,
Windows 2000, Windows Millenium, Windows XP, Windows Vista, Internet Explorer versions 4.0 or above.
The Agroatlas can be used by users with different levels of experience in order to solve
problems of different complexity levels. Therefore 3 working modes have been provided for.
Level 1 - «Beginner’s Level», - involves traditional working techniques with the Agroatlas’s
materials. The search for the desired object can be conducted in two ways: via the systematic
catalogue with its tree-like structure or via the Search System. This working mode is quite
straightforward as it is often used by students, scholars and other experts while they search for
sources of reference.
Immediately upon launching, the Agroatlas looks like this screen. On the left you can see the
tree-like structure of its main divisions: Agroecology, Crops, Diseases, Pests, Wild Relatives, Weeds.
When you click on the division you need, there appears a table in the center of the window. It
contains Common and Scientific names of the objects. Each column of the table can be sorted out in
direct or reverse alphabetical order. In order to sort our the desired column you click on the Common
Name or Scientific Name pushbutton. With the first click you sort out the desired column in direct
alphabetical order. The sign “^” appears on the pushbutton. With the second click on the same
pushbutton you sort out the desired column in reverse alphabetical order, and sign “v” appears on the
pushbutton. The viewing window opens up when an object has been selected. In this window you can
view the object’s description with its photo or drawing. To the right of the Tree there are five
bookmarks: Browse, Search, Description, Metadata, Map. The Browse bookmark contains the table
with the objects in the sub-division of the Tree you have chosen. If you highlight an object and click
on the Description or Metadata bookmark, you will see in the first case the description with a photo
or a drawing, and in the second case - the drawing of the map with the metadata text. When you are
on these pages you can access through the main menu or through the toolbar the following features:
Save - to save the page as an HTML or a text file, Print - to print out the page. The Full Screen
pushbutton allows to display the page on the whole program screen (the Tree will disappear).
Description and metadata pages may contain Web references. If your PC is connected to the Internet
you can browse through these references without exiting the Agroatlas. For Internet navigation you
can use Forward, Back, and Home pushbuttons. If you push the Home pushbutton (with a house
depicted), you will return to the Agroatlas.
2
The Map page has a window you can use to view computer-generated maps. It shows the
layers of the object superimposed on the topographical base. The map yields to various
manipulations. The layer list with available files appears between the Tree and the map. Next to it
there is a bookmark with the legend. The layers are arranged in the same order as in their list. You
can move upward or downward the highlighted layer. You can disable it in order not to view it or
remove it from the memory completely (except for the layers of the topographical base). The
pushbuttons of the main toolbar have the following features: you can fit the whole map into the
window, you can zoom in on a selected image-patch, zoom out on it, scroll through the map in the
window or switch over to the selected pixel values’ mapping mode for raster files.
3
The Search bookmark allows you to search for objects via the system of searching by names
using any letter combinations. You can search in Russian, English or Latin. On the picture you can
see the example of a search for the “foxtail” keyword.
Toolbar’s Pushbuttons
Description and Metadata Bookmarks
- Print. Calls up the print-out dialogue sequence. You can print out the current page.
4
- Save. You can save the page as an HTML or a text file.
- Back to Homepage. You use this pushbutton to return to the Agroatlas after
browsing through Web-pages.
- Forward and Back. You use this pushbutton to browse through Web-pages.
- Refresh. Opens the page one more time.
- Full Screen. Maximizes the page to the whole window’s size.
Map Bookmark. Main Toolbar
- Save. You use this pushbutton to save the currently displayed map as a BMP file.
- Fit-In. You use this pushbutton to downsize the map so that the whole of it can fit
into the window.
- Zoom-In. You use this pushbutton to zoom in on a patch of the map with a click of
the mouse button or with dragging the frame.
- Zoom-Out. If you push this pushbutton, the displayed map will become twice as
small as before.
- Map-Scroll. You can scroll the displayed map if it is larger than the window’s size.
- Display Values. If you push this pushbutton and highlight a raster file, and click the
mouse button, you will view the value of the pixel under the cursor.
- Launch AAViewer. Launches the viewer-program and downloads into it the
combination selected in the Agroatlas.
- Launch Image Calculator. Launches the Image Calculator.
5
- Launch Palette Editor. Launches the Palette Editor.
- Refresh. Refreshes the map.
- Full Screen. Enlarges the map to the whole screen width.
Map Bookmark. Auxiliary Toolbar.
- Add Layer. Adds a new vector (MID/MIF, VCT/VDC) or raster (RST/RDC) layer to
the map.
- Add Combination. Adds a new combination (AAC) to the map.
- Freeze Layers. If you push in this pushbutton and select other objects, the previously
selected objects will remain on the map.
- Layer Up. Moves upward the map layer selected in the list.
- Layer Down. Moves downward the map layer selected in the list..
- Remove Layer. Completely removes from memory the selected layer. You can make
a layer invisible without removing it from memory ticking it off. You cannot remove
from memory the layers of the topographical base but you can make them invisible.
- Layer Properties. If you select a layer in the list, you push this pushbutton to change
the way it is displayed. (You can change lines’ and fills’ color, add shading to vector
layers. You can also change the palette and display properties for raster layers.)
Search Bookmark
- Search. Launches the search by the keyword you print in.
Level 2 – «Experienced User’s Level» is designed for those who have some basic experience
in geographical information technologies. On this level users can compile their own customized maps
from individual layers. E.g. you can first download the atmospheric precipitates layer and then
6
superimpose the natural habitat layer of a species. In this way you can see where there is enough
moisture for the given species. Or you can download the cultivation area for a given crops variety and
superimpose pests’ natural habitat layers in order to see where the pests can cause damage to the
crops and to what extent.
In order to download simultaneously to the map two or more objects you should use the
Freeze Layer pushbutton. If this pushbutton is pushed in, you can download the next object without
removing the previous objects. You can download more objects using the catalogue system, the
search system or manually - downloading a combination file (*.aac), or individual layers - vector
files in the export MapInfo format (with MID/MIF extensions) or raster Idrisi layers (RST/RDC). If
you superimpose numerous layers, they will be arranged one over the other and despite their semiopacity may complicate the reading of the map. The most recent Agroatlas’s version has a feature
which allows you not only to enable and disable layers and to change their order but also to change
the display mode of each vector layer. This can be done through the Object Style window which
allows you to specify the properties of the polygon boundaries, the fill color, the degree of fill
opacity, the shading, its color and style. Using shading you can make a multi-layer map easier to
read. E.g. the first screen picture shows a patch of a 4-layer map with color fill.
7
The next screen picture shows the same patch of a map with color shadings.
It is especially convenient to use shadings for vector polygons when they are superimposed in
raster layers. In this screen picture you can see the raster layer of average temperatures in June.
In the next screen picture you can see the same patch of the map with house mouse’s natural
habitat layer and its area of harmfulness layer superimposed. The temperature layer which is located
under them is difficult to see.
8
Below you can see the same map with shading instead of fill. Now the temperature layer is
easy to see.
You can change palettes and palettes display range for raster layers of agroclimatic maps You
can disable palette’s autoscaling for integer layers with values from 0 to 255. It is especially
convenient when a raster layer has few values. See how to create a palette for such layers in the
Palette Editor section.
9
The most recent Agroatlas version allows to use legends stored in RDC files in order to work
with raster layers. If the current layer has a legend, this layer’s value according to its legend is
displayed alongside the numeric value.
The viewer-program Aaviewer.exe can also be used by experienced users separately from the
Agroatlas’s shell. It has all the GIS-features of the main Agroatlas program but it works with
individual layers without the catalogue or the search system.
Level 3 – «Professional Level» allows to work with the GIS layers contained in the Agroatlas
with professional GIS-tools (such as MapInfo, ArcInfo, IDRISI, etc.). In order to do it you should
copy to your hard drive the cartographic layers you need. They have open GIS formats MapInfo
(MID/MIF) and Idrisi (RDC/RST). In the Agroatlas’s Structure section you will learn about location
of information about the objects.
MapAlgebra and Reclassification Data Block
The purpose of the MapAlgebra and Reclassification data block is to carry out raster layer
calculations. It allows to carry arithmetical, trigonomtrical, and logical operations with raster layers.
When the MapAlgebra module is called for, the specialized Calculator is displayed.
10
In its upper left hand corner you write the name of the target file while in the formula input
box you write the formula to be used in your calculation. You can use as formula values numbers and
values of raster file cells. The available arithmetic operations are (+, -, /, *); trigonometrical functions
are also available (with their values set as radians) as well as exponentiation, logarithms, etc. You
should indicate data type for he target file (real, integer, byte). The Calculator allows to carry our
reclassification. The target files can also be produced by the Calculator in the Idrisi format.
Here is an example of what the Calculator can do. The objective is to determine the area
where Nanking cherry cultivation is possible. Literature sources show that the Nanking cherry is
rather heat-loving and requires the sum of effective temperatures above 10° of no less than 2200°. For
your calculation you need the layers of effective temperature sums above 10°. Now you should make
a new folder and copy into it the necessary layers.
1. You start up the Calculator and select your folder from the Settings/Folders for
images menu.
2. Using reclassification you calculate the area where the sum of temperatures above 10°
is no less than 2200°. To do it, you write the name of the sumt2200 output file in the
upper left hand box, push the Insert Image pushbutton and select the
T_SUM_ABOVE_10.RST file. Then you should push the ReClass pushbutton.
11
Set «Assign a new value of» =0 «To all values from» = -100 «To just less then» = 2200 in the
first line. It means that in the layer you are making all the values from –100 to 2200 will be
set to 0. This is the area with insufficient heat for Nanking cherry cultivation. In the second
line you set: «Assign a new value of» =1 «To all values from» = 2200 «To just less then» =
7000. 2200 – is the least sum of effective temperatures above 10° sufficient for Nanking
cherry cultivation. You select the extreme values –100 and 7000 on the basis of the data from
the Minimum data value and Maximum data value boxes, treating these values rather liberally.
Now raster cells with values over 2200 will assume the value of 1.
Now you push the Proceed and close pushbutton. The sumt2200 file will be created in the
folder you are working with. Open it with the Aaviewer. For your convenience we
recommend you load the boundaries of the USSR.
12
In this screen picture the area with effective heat sums in excess of 2200 is highlighted
with a red fill.
Plants need both heat and moisture. In the area you have just found the Nanking cherry
will thrive and bear fruit provided it is watered. In order to find the area where it can be
cultivated without watering, you should consider the amount of available moisture.
3. Now you should reclassify the layer of the Hydrothermic Coefficient. You open the
Hydrothermic Coefficient layer and determine the area where it is 1 or more. This is
the area with sufficient moisture.
4.
Now you superimpose the layer you obtained earlier on this layer and see the areas
where the Nanking cherry can thrive without watering.
13
Palette Editor
The Agroatlas includes a set of palettes for displaying rasterized maps. It is to be found in the
common\palette folder. Besides that each user can customize an available palette or create a new one
with the Palette Editor (Palette.exe).
The Agroatlas palette contains 256 colors to be assigned to raster layers’ pixels. The Palette
Editor allows to open an existing palette file (the *AAP file type), to assign a color separately to each
cell or to set a color range for gradual color change-over. Here is an example of a palette creation..
You may need to create a new palette for the terrain relief. Palette colors for lowlands should be darkgreen, for plains – light-green, for highlands – yellowish-brown, and brown for mountains. Just like
on geographical maps. You should assign desirable colors to certain cells.
14
Now relevant colors have been assigned to cells 1, 94, 145, 199 and 255, and you should set
cell numbers for gradual color change – initially 1 and 94. Push the Blend pushbutton to get a color
change-over.
Now you set a gradual change of light-green to yellow 94-145.
15
And so on until you get the desirable palette.
The palette we have created can be used to display a raster layer of heights above sea-level.
Such a palette will be automatically scaled. This means that the whole range of height values will be
divided into 256 intervals, and a corresponding palette color will be assigned to each interval.
Some raster layers have few integer values. E.g. you can create a layer with 4 values: 100 mask, 0 - bodies of water, 1 - areas without forest, 2 - forests. You can create a simple palette for this
layer. This palette will only have a few colors in strict correspondence to raster values. We will
assign blue to Palette’s Cell 0, yellow - to Palette’s Cell 1, green to Palette’s Cell 2. In this case
bodies of water will become blue, areas without forest will become yellow and forests - green. The
last cell and the last cell but one are used to assign colors to values which are lesser or greater than
16
the displayed range. In our map the mask with its value - 100 will be black. In order to use such a
palette correctly you should disable autoscaling in Raster Layer’s Properties.
The Agroatlas’s Structure
Information on each object in the Agrotlas includes its biological description with a photo as an
HTML-page, cartographic layers in MID/MIF exchange format (MapInfo export format) for vector layers and
in RDC/RST format (Idrisi format) for raster layers and layers’ metadata with a general view of a natural
habitat map or of an agroecological factor map. The whole information on the CD is freely accessible and
unzipped; it can be easily found and copied for further work by your O/S or file managers’ tools The
information is stored in the Agroatlas folder which contains folders for the following divisions:
common – general information division,
agroecology – agroecological division,
cultural – cultivated crops division,
related – cultivated crops’ wild congeners division,
diseases – cultivated crops’ diseases division,
pests - cultivated crops’ pests division,
weeds – weeds division.
Each of the 6 folders (except common) contains information on objects. For each object there is a
Latin_name folder. (In the diseases folder the names of objects’ folders have a different format – see below).
This folder contains a series of files. Their names are also derivates of the objects’ Latin names.
1. Latin_name_ru.htm – object’s description in Russian in HTML format.
2. Latin_name_en.htm - object’s description in English in HTML format.
3. Latin_name_ru.txt - object’s description in Russian in text format.
4. Latin_name_en. txt - object’s description in English in text format.
5. Latin_name.jpg – object’s photo or drawing in its description.
6. Meta_Latin_name_ru.htm – object’s metadata in Russian.
7. Meta_Latin_name_en.htm - object’s metadata in English.
8. Latin_name_en.gif, Latin_name_ru.gif – general view of the map from the metadata in English and
Russian.
9. Latin_name.aac – a combination file with a combination of layers and their display properties in the
Agroatlas and GIS-Viewer.
10. legend_en.txt, legend_ru.txt – legend files which contain legends in English and Russian.
11. Matched files *.mid *.mif with names which reveal their contents – vector files which make up
the object’s map. Files may be polygonal or with a dot pattern. For cultivated crops and their congeners 1poly_
17
- as a rule contains their cultivation areas or natural habitats while point1_ and point2_ contain their locations
from the literature and herbaria. For harmful objects (diseases, pests, weeds) 1poly_ , 2poly_, 3poly_, 4poly_
contain the natural habitat and the areas of low, medium and high harmfulness, accordingly. This information
may be found in legend files or in the *.aac file.
12. Matched files *.rst and *.rdc have random names which reveal their contents – agroecological
raster layers’ files.
In the Diseases folder the names of object folders are of a different format. The diseases are classified
by cultivated crops or crops groups. Therefore the first place in a folder’s name is occupied by a crops’ or a
crops group’s name followed by the Latin name of the pathogen.
1. Tritici – wheat diseases
2. Hordei – barley diseases
3. Secalis - rye diseases
4. Avenae – common oat diseases
5. Zeae – corn, maize diseases
6. Oryzae - rice diseases
7. Fabacee – leguminous plants’ diseases
8. Faba2 – forage legumes’ diseases
9. Olee – oilplants’ diseases
10. Beta_alba – sugar beet diseases
11. Brassicae - cabbage diseases
12. Lycopersici – tomato diseases
13. Cucurbitae – gourd family plants’ diseases
14. Solani – potato diseases
15. Pomae – fruit and berry plants’ diseases
The common division contains 3 folders: Base, CLASSIFIER, Palette. The Base folder contains the
layers of the topographic base: boundaries of independent states, units of Russia’s administrative division,
rivers, bodies of water, the frame, and the grid. It also has folders Russia and Independent States. The Russia
folder contains all the constituent entities of the Russian Federation as layers of their administrative boundaries
and their administrative centers. The Independent States folder contains layers with boundaries and capitals of
the republics of the former USSR. The CLASSIFIER folder contains auxiliary *.kl files used by the Agroatlas
to search for its objects. The Palette folder contains *.aap files which are palettes for raster layers. They can be
viewed and edited by the Palette.exe program.
The Agroatlas and Aaviewer programs allow to view vector files of Map Info exchange format
(MID/MIF type) and IDRISI faster files of RST/RDC type. They can work with 2 projections:
Alber's for Russia which has been used for the maps in the Agroatlas and cylindrical (lat/long). Map
Info will work correctly with Alber’s projection for the USSR, provided a string Alber's Equal Area
Conic for Russia, 9, 1001, 7, 100, 0, 44, 68, 0, 0 is added into "--- Regional Conformal Projections --" section of Mapinfow.prj file which contains projections’ parameners if there is no such string there.
For IDRISI the Georef folder should have the Alberrus.ref. file which contains:
ref. system: Alber's Equal Area Conic for Russia
projection: Alber's Equal Area Conic
datum: Pulkovo 1942 (S42)
delta WGS84: 28-130-95
ellipsoid: Krasovsky
major s-ax: 6378245.000
minor s-ax: 6356863.019
origin long: 100
origin lat: 0
origin X: 0
origin Y: 0
scale fac: na
units: m
parameters: 2
stand ln 1 : 44
18
stand ln 2 : 68
If you open a layer in a certain projection, you cannot superimpose on it the next layer if it is
in a different projection. The Agroatlas uses vector files which cannot mix elements of different types
(polygons, lines, dots). You can open files which contain different elements; graphic components of
such files will be displayed correctly but the legend cannot be displayed. Viewing of vector
MID/MIF files supports not all kinds of lines and fills which exist in Map Info. You can change type
of line, fills and shadings when you view the files but you cannot save these changes in MID/MIF
files. Raster RST/RDC files also should be in one of the 2 projections. To display information the
Agroatlas uses palette files with *.aap extension. When viewing information you can change palettes
and the range of values of the file you are viewing with a given palette.
References
Object descriptions and map metadata for each object contain lists of published references and
of other sources of reference. Besides them the Agroatlas has summaries of references for each
division which are sorted out in alphabetical order. These can be viewed through the Agroatlas’s
shell. They can be searched by surnames or by keywords.
Organizations Which Have Created the Agroatlas
St. Petersburg State University, Faculty of Geography and Geoecology
Address: 10th liniya, 33, VO, St. Petersburg, 199178, Russia
http://www.spbu.ru
Russian Research Institute for Plants’ Protection
Address: Sh. Podbelskogo, 3, Pushkin, St. Petersburg, 196600, Russia
http://www.vizrspb.chat.ru
Russian N.I. Vavilov Research Institute for Plant Cultivation
Address: B. Morskaya ul., 42, St. Petersburg, 190000, Russia
http://vir.nw.ru
U.S. Department of Agriculture, International Research Programs Office of Research Agricultural
Service
Address: USDA, ARS, 5601 Sunnyside Avenue, MS 5141; Beltsville, MD, 20705
http://www.nps.ars.usda.gov
19