1
Tocbmicol R.gort Doculmtatioo Page
2. G o w r m m t Accession No.
1. R m r t No.
3. Roeipimt's Cotoloq No.
UMTRI-87-15
5. Rqort Dote
4. Title ad Subtitle
March 1987
Who Are the Potential Users of a CAD System?
6. Pnfominq O r ~ i x a t i o ncode
389276 subacct. of 389266
6. Pwferminq Organization Report No.
7. Auitlod.)
UMTRI-87- 15
P a u l Green and Susan Adams
10. Wok Unit No.
9. P u k m i n q O r q m i a ~ o nN m e m d Addrefs
The University of M~ch~gan
Transportation Research I n s t i t u t e
2901 Baxter Road
A n n Arbor, MI 48109-2150 U.S.A.
12. $ansoring A
N-
~ W W ~
11. bntroct or Grant NO.
DRDA 86-2379-P1
13.
Chrysl e r Motors Corporation
R&D Programs Admini stration
12000 Chrysler Drive
Hiqhland Park, MI 48288-1115
15. h i - t a r y
TIP.
of pert and Puiod carered
Interim
Sept. 1986
a d Address
-
14. Sponsoring A~~~~
Feb. 1987
Cade
Chrysler Acct. #ZOO0531
Nohs
Supported by the Chrysler Challenge Fund
11. A b l n ~ t
This report describes a survey of the potential users of a computer-aided
surfacing system. That system, t o run on Evans and Sutherland PS 300
workstations, will be used t o develop the body and interior surfaces for
future vehicles.
The 7-page, 24-question survey was distributed t o a l l employees o f the
Chrysler Motors Product Design Office in Highland Park, Michigan. From the
240 people in the o f f i c e , 122 completed surveys were obtained. The key
finding was that while the respondents had considerable j o b experience
(average of 17 years), and were reasonably we1 1 educated (almost a1 1 had
a t least a high school education), they had l i t t l e experience with
computers. For example, 61% do n o t currently use a computer on the j o b and
37.5% had never used a computer.
Other useful pieces of information included candidate users' occupations
(36%artists/sculptors, 25% engineering, 15% fine a r t s ) ; typing abil i ty
(only 24% can touch type); and vision (almost half wear glasses, almost
25% wear bifocals) .
17. Key Words
User interfaces, human
factors, ergonomics, CAD,
usability, usability engineering,
ease-of-use, novice users
19. kovriv C l a s i f . (of chis w)
Unclassified
m.
16. Distributiom St*-t
S.cwiiy Classif. (04 c(lis p-1
Unclassified
21. No. of Poges
43
2 2 Price
TABLE OF CONTENTS
1
PREFACE
INTRODUCTION
What Are the Key Human Factors Principles?
Where Do These Principles Fit into the Development
Process?
What Do Developers Need to Know About Users?
2
3
4
5
TEST PLAN
Survey Respondents
Survey Contents
Data Collection Procedure
RESULTS AND DISCUSSION
How Well Do Users See?
How Much Education Do Users Have?
What Do Users Do On The Job?
How Well Do Users Type?
What Computer Hardware and Software Are Users
Familiar With?
6
6
6
10
14
14
CONCLUSIONS
19
REFERENCES
21
APPENDICES
23
APPENDIX A:
SURVEY FORM
24
APPENDIX B:
SUMMARY STATISTICS
31
PREFACE
This report, the first in a series, describes the overall plan
for developing a user interface to a CAD system and describes the
candidate user population for one such system in great detail. This
work is part of a larger project (originally titled "User Interface
for Robot Programming") directed by Klaus-Peter Beier of the
University of Michigan Department of Naval Architecture and Marine
Engineering. This project was supported by the Chrysler Challenge
Fund.
The authors would like to thank several individuals from Chrysler
for their help with this work. In particular,
Mike Holmes, Manager of CAD/CAM in the Chrysler Product
Design Office,
Bob Antworth, Supervisor for Distributed Graphics
Development in the Engineering Office, and
Chris Wood of the Product Design Office staff.
INTRODUCTION
This report describes research being conducted at the University
of Michigan Transportation Research Institute for the Chrysler
Corporation Design Office. Specifically, the University is helping
Chrysler develop a user interface to a new Computer-Aided Surfacing
(CAS) system, a special purpose Computer-Aided Design (CAD) system.
The CAS system will be used to design body and interior surfaces for
future vehicles. This software will run on Evans and Sutherland PS
300 workstations.
This project came about because Chrysler recognized that the CAS
software should be easy to use if their designers were to take full
advantage of it. In addition, Chrysler has shown great interest in
learning about how to apply human factors methods and principles to
the design of user interfaces. Those principles and their application
in the development process are described below.
What Are the Key Human Factors Principles?
The principles involved in designing a user-friendly interface
have long been assumed to be obvious, so obvious that they were often
not discussed. That's changing, especially for computer systems.
Gould and Lewis (1983; 1984; 1985) have been instrumental in causing
that change. To develop easy-to-use systems they recommend: "early
and continual focus on users; empirical measurement of usage; and
iterative design whereby the system is modified, tested, modified
(Gould and Lewis,
again, tested again, and the cycle is repeated
1985, p. 300). What do these principles mean?
...
..."
By "early focus on users" Gould and Lewis mean that interface
developers should identify and understand all of the human
characteristics, in particular behavioral factors, that may affect how
users interact with the system being developed. This information can
be obtained through user surveys and by making direct contact with
users through interviews. The information should be obtained prior to
the design phase. To encourage direct contact Gould and Lewis suggest
one or two users should be included on the development team.
In addition, they also urge developers to study proposed users at
work. Data worth collecting include detailed descriptions of the
tasks performed, and task frequencies, durations, importance, and so
forth. These data may be obtained from casual observations of users,
online logging of user behavior, or conventional time studies or
activity samples.
The second major principle is that of "empirical measurement of
usage." Objective user performance data, such as the time and errors
made when carrying out benchmark tasks, and subjective measures, such
as ratings of difficulty of various activities, should be collected.
These data should be analyzed for both prototype and working versions
of the software. Whenever possible, decisions about interface design
should be based upon quantitative information obtained from users. To
collect these data, prototypes are needed early in the development
process.
The third major principle is that of "iterative design." That
is, after each user test, designers should modify the system according
to the test results. Many believe this is just fine tuning; however,
experience suggests it is unlikely that a user interface will be
designed correctly the first time. Therefore the development schedule
must allow for several iterations so that a user-friendly interface
can be developed.
While these principles might seem obvious, the evidence suggests
otherwise. For example, Gould and Lewis asked 447 IBM computer system
developers to identify the key steps in developing and evaluating a
system for end users. While 62% said something about users, only 40%
said anything about empirical measurement, and only 20% referred to
iterative design. It is clear from these data that their principles
are not obvious.
Where Do These Principles Fit into the Development Process?
A computer system will be easy to use only if there is a
deliberate effort to make it easy to use. Such an effort requires
money to support usability analyses and tests, professionals trained
in human factors, and usability milestones in the schedule. Details
of the design process have been described elsewhere (e.g., Mantei,
1986) and are presented here in a modified form for convenience.
1. Identify the purpose of the system. For this project,
Chrysler has already defined the purpose of the CAS system. This
information, along with a detailed description of the system
functions, appears in the CAS system specifications (Chrysler Motors
Corporation and Evans and Sutherland Computer Corporation, 1986).
2. Identify the users. This step, what Gould and Lewis call
"early focus on users," is a topic covered in this report. Quite
simply, it is not possible to develop a system that is well matched to
the users without a detailed description of who they are. When this
information is not provided, programmers tend to view the users as
being just like themselves and assume users know and can do what they
can. This is rarely true.
These data can be used for making empiric predictions about user
performance, such as the time to type a command, and can be used to
evaluate design alternatives. However, their greatest value is in
situations where specific research is lacking and calculations are not
possible.
3. Translate the system functions into user activites. This is
the second half of the Gould and Lewis "focus on users" principle.
User activities might include loading files, deleting lines in a text
file, rotating screen images in particular planes, and so forth. This
step will be covered in the next report.
4. Develop usability criteria. Depending on the organization,
usability criteria may be used as either quality assurance levels or
as design goals. In terms of the design process, these criteria are
used for evaluating system prototypes, and also for determining
whether the final version is ready for release. In line with Gould
and Lewis' call for empiric measurement, these criteria should take
the form of mean times and errors for benchmark tasks, though
subjective measures of user satisfaction may be included as well. In
developing the criteria, specifications are required for test sample
sizes, conditions, and so forth. Bennett (1984), Gilb (1985), and
Good, Spine, Whiteside, and George (1986) all discuss this subject in
detail.
5. Develop alternative task methods. It is at this stage that
most consider the real design work to begin. Issues that arise
address the selection of input devices, the interaction structure and
sequencing, and so forth. Phase 1 of this program (what is funded so
far), assumes this is the last step to be completed.
6. Analyze the alternative methods. At one time this could only
be accomplished by carrying out experiments, though sometimes the
human factors literature was helpful. Commonly expert judgement was
also sought.
The approach now in favor is to use human performance
models (e.g., Card, Moran, and Newell, 1983) to predict the
performance of users. These analyses can be used to eliminate the
weaker candidate designs.
7. Prototype, test, and modify. This step is the heart of Gould
and Lewis' "iterative design" principle and critical to its success
are prototyping tools. System prototypes can be developed on personal
computers using tools such as Dan Bricklin's Demo Program (Bricklin,
1985) or using the Wizard of Oz program being developed at the
University of Michigan (Green and Wei-Haas, 1985) to name some
examples. These prototypes should be formally tested by a small
sample of users. Based upon the empiric test data, the design should
be modified. This process should be repeated again and again until
the user performance criteria are met. After the prototyping phase is
complete, the same cycle of tests and modifications should be carried
out on versions of the working system.
What Do Developers Need to Know About Users?
As noted previously, this report identifies the potential users
of the CAS system. The information was collected using a survey.
Particular issues addressed include:
How well do users see?
How well do users type?
How much education do users have?
What do users do on the job?
What computer hardware and software are users
familiar with?
TEST PLAN
Survey Respondents
The survey was distributed to all employees of the Chrysler
Motors Product Design Office in Highland Park, Michigan. That
department is responsible for styling Chrysler cars and trucks. Of
the approximately 240 people in the Department, 132 responded.
Participation was voluntary. Of those responding, the data from 10
people were omitted from the sample. Based on their job titles (e.g.,
secretary, operations analyst), it was felt they would never use the
new CAS system.
Survey Contents
The survey was 7 pages long. (A copy of the complete survey is
included in Appendix A . ) The survey consisted of a cover page with an
introduction and instructions, and 6 pages of questions. The 24
questions concerned basic biographical information and respondents'
education, occupation, and computer experience. At the request of the
Product Design Office, age and sex data were not collected. Typical
questions were:
What is your visual acuity? (e.g. 20/20)
What is the highest level of formal education you
have completed?
What tasks do you perform on your job?
Do you usually look at the keyboard when you
type?
How long have you been using computers?
Which pointing devices have you used?
Data Collection Procedure
Surveys were distributed to design staff employees by their
immediate supervisors. Supervisors instructed their employees that
the information being requested would be used in designing the user
interface to new software. Also, employees were told that all
potential users of the new software were being asked to participate in
the survey. Finally, supervisors instructed their employees to return
completed surveys to the CAD/CAM manager (Mike Holmes). The
introduction section (on the cover page) contained similar
instructions. In addition, it asked participants to take their time
and answer the questions as completely as possible. (For the complete
instructions see Appendix A . ) Surveys were completed during working
hours.
RESULTS AND DISCUSSION
In many cases percentages have been used to summarize the data.
Where tables are discussed, percentages have been rounded off to
facilitate discussion. Also, questions may be discussed in a
different order than they appeared in the survey. (Appendix B
contains all the response data in the same order as the survey
questions.)
How Well Do Users See?
Of those responding, 47.5% wear glasses, 10.7% wear contacts, and
23.8% wear bifocals. Visual acuity ranged from 20/10 to 20/60 with a
mean of 20/24; 57 of the respondents reported having 20/20 vision.
Although most people reported they could see fairly well, it is
important to note that 49 of the 122 respondents did not know their
visual acuity. In addition, the question was worded so that it was
not clear whether participants should report corrected or uncorrected
visual acuity.
Designing computer displays for those that wear bifocals is
particularly difficult, especially for large screen systems such as
the PS 300. Bifocals are most useful when the material to be read is
close, low in the visual field, and of a relatively small area.
Problems with bifocals can be reduced by minimizing the number of
vertical eye movements, by placing instructions and menus at the
bottom of the screen, and by providing users with special reading
glasses.
How Much Education Do Users Have?
From educational data one can make inferences about the usersf
reading level and vocabulary (which influence how help files, error
messages, and documentation are written), and about the concepts with
which users will be familiar. Often, explanations are built around
analogies ("This device works just like a '
when you . . . " ) . Those
explanations will be meaningful only if the analogies are familiar.
In this case, 9.8% of the respondents indicated that they had
only completed high school, 9.8% attended technical/vocational school,
35.2% completed some college, 37.7% had graduated from college, and
7.4% had attended graduate school. Since well over 90% of those
responding have completed high school and over 2/3 some college, it is
safe to assume users will understand material written at a 12th grade
reading level. Even more notable than the minimum level of education
is the range in the levels of education, from high school all the way
to graduate school.
Participants also reported what they studied in school. (See
Table 1.) The most popular areas of study were design (38%) and
engineering (29%), mostly mechanical engineering. When developing
software, programmers tend to think of the users as being like
themselves. That is clearly not true here.
TABLE 1.
Area of Study
AREAS OF STUDY
First*
Second**
Third
Engineering
Mechanical Engrg.
Civil Engrg.
Electrical Engrg.
Materials Engrg.
Automotive Engrg.
Packaging Engrg.
Architecture
Business
Management
Marketing
Industrial Mgmt.
Advertising
Real Estate
Fine Arts
Graphics
Sculpture
Design
Industrial Design
Automotive Design
BIW Design
0
35 (35.4%)
3 (3.0%)
0
0
7 (21.9%)
2 (6.3%)
0
1
(9.1%)
Other Technical
Drafting
5
(5.1%)
4 (12.5%)
1
(9.1%)
Other
3
(3.0%)
1 . (3.1%)
1
(9.1%)
Sample =
missing =
*
**
First is the primary area of study, their major.
Second is their second area of study, a minor.
Table 2 shows how much formal education respondents have as a
function of their discipline. Noteworthy are the data for those who
studied mechanical engineering; 21 of those 22 do not have a college
degree. However, 26 of the 35 who concentrated in industrial design
have graduated from college.
TABLE 2.
AREA OF STUDY VS. FORMAL EDUCATION
Level of Formal Education
Area
of Study
High
School
Tech
School
-
-
-
Other
-
1
TOTAL
2
8
Some
College
College
Grad
School
TOTAL
Engineering
Mechanical
Civil
Automotive
Packaging
Business
Management
Marketing
Ind. Mgmt.
Fine Arts
Graphics
Sculpture
Design
Industrial
Automotive
Other Tech.
Drafting
Sample = 99, missing = 23
Only 3 7 . 9 % of the respondents have recently attended any short
courses or seminars. The general subject matter of seminars attended
is shown in Table 3 , with the most frequent listing being
communication type seminars. Very few participants ( 3 of 1 1 5 ) have
attended any type of computer course.
TABLE 3.
SEMINARS ATTENDED
[ s e e note below]
Seminar Type
First
Management
Communications
Design
Computers
Other
4 (3.5%) (9.3%)
10 (8.7%) (23.3%)
3 (2.6%) (7.0%)
2 (1.7%) (4.7%)
24 (20.9%) (55.8%)
# who responded
# not a t t i n d i n g
43
72 (62.6%) ----100.0% 100.0%
Sample =
missing =
Second
1
1
1
1
5
(1.2%) (11.1%)
(1.2%) (11.1%)
(1.2%) (11.1%)
(1.2%) (11.1%)
(6.2%) (55.6%)
9
72 (88.9%) ----100.0% 100.0%
115
7
[The 4 people who attended a management seminar represent 3 . 5 % of the smaple (115) who
responded t o question # 6 . (One person who answered " y e s " did not list a seminar t y p e . )
They represent 9 . 3 % of the 43 people who responded t o t h i s q u e s t i o n . ]
To put these numbers in context, shown in Table 4 are the
employment figures for the big three automakers in '85 (1986 figures
are not yet available) and the number of people attending engineering
short courses at the University of Michigan in '86. Those courses
cover topics of interest to automotive engineers and designers, and
many concern computers. The data shown are fairly typical of the
1979-1986 time period. Relative to the other manufacturers, the
number of people sent by Chrysler is quite low. It may be that as a
consequence they have less exposure to new technology, such as
computers, than their competitors.
TABLE 4. SHORT COURSE ATTENDANCE
1985
Employment
Company
Employee
Category
Chrysler
Total
Hourly
Ford
Total
Hourly
184,700
116,900
GM
Total
Hourly
564,685
431,199
Total
-
1986 Short Course
Attendance
105
All Companies
Sources: The employment figures were compiled by Dave Andrea of the UMTRI
staff from corporation annual and public reports (Andrea, 1987). The short
course data came from Joe Taylor of the University of Michigan Chrysler Center
for Continuing Engineering Education (Taylor. 1987).
What Do Users Do On The Job?
Table 5 shows the reported occupations of the survey respondents.
Most of them are either designers (25%), artists/sculptors (36%), or
studio engineers (19%). Noteworthy is the category "studio engineer,"
a title that does not neatly map into one academic discipline and is
not necessarily a title with which software developers would be
familiar.
TABLE 5.
OCCUPATION
Designer
Technician
Artist/sculptor
Mechanical engineer
Electrical/computer engineer
Studio engineer
Other engineer
Other
Table 6 shows the amount of education completed by people in each
occupational category. Most of the designers completed college (25 of
the 31), but few of the artists/sculptors have (9 out of 44).
Surprisingly few of the engineers (only 8 of the 32) have college
degrees. This does not fit the stereotype of an engineer.
TABLE 6. OCCUPATION VS. EDUCATION
Occupation
Level of Formal Education
High
School
Designer
Technician
Artist/
Sculptor
Mechanical
Engineer
Elec./Computer
Engineer
Studio
Engineer
Other Engr.
Other
Sample
= 122,
Some
College
College
Grad
School,
TOTAL
1
-
8
-
1
-
2
12
TOTAL
Tech
School
12
missing = 0
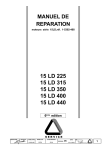
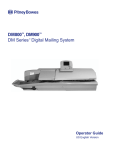
Respondents said they have been working in their current
occupation anywhere from 1 year or less to 38 years, with an average
of 17 years. (See Figure 1.) Thus, many of the staff received their
formal academic training in the pre-computer era.
RANGE
( years
# IN RANGE
(each X = l person)
XXXXX
XXXXXXXXXXXXXXXXXXXXX
XXXXXXXX
xxxx
xxxx
X
XX
XXXXXX
xxxx
XXXXXXXXX
XXXXXXXXX
XXXXXXXXXXXXXXXXXX
xxxx
XX
XXXXXX
XXXXXXXXX
xxxx
xxxx
X
FIGURE 1.
DURATION OF EMPLOYMENT IN CURRENT FIELD
Table 7 shows the job tasks that participants perform both with a
computer and manually. Of particular significance is that 61% of the
respondents do not currently use a computer on the job! Of the
categories for which a computer is used, the most common task is
digitizing, one which follows a rather fixed routine. Interestingly,
word processing, the most common task in offices, is performed quite
infrequently. Clearly, many of the potential users of the CAD system
are novices in the truest sense of the term. One therefore cannot
expect users to be able to rely upon insights from other systems to
solve interaction problems.
TABLE 7 .
JOB TASKS
Using a Computer
Don't use a computer on my job
Word processing
Prepare spreadsheets
Digitizing
Data entry
Statistics
Calculations
Data base management
Programming
Prepare business graphics
Mechanical drawing/design
Artistic drawing/design/rendering
Other
73
6
4
29
15
5
13
5
4
4
16
5
2
(61.3%)
(5.0%)
(3.4%)
(24.4%)
(12.6%)
(4.2%)
(10.9%)
(4.2%)
(3.4%)
(3.4%)
(13.4%)
(4.2%)
(1.7%)
Manually
Make clay models
Mechanical drawing/design
Artistic drawing/design/rendering
Use a typewriter
Use a calculator/adding machine
Other
46 ( 3 8 . 7 % )
43 ( 3 6 . 1 % )
3 1 (26.1%)
6 (5.0%)
32 (26.9%)
12 (10.1%)
Related data collected in 1986 from a survey about the America:
auto industry addresses the issue of computer use (D. Andrea, 1 9 8 7 ) .
Executives were asked what percentage of their company's
product/design engineers operate from a microprocessor-based
workstation; the median response was 40%. When asked what percentage
of product design in their company's engineering unit was performed
with the aid of a computer, the median response was 50%.
Based upon confidential data. (Office for the' Study of Automotive Transportation, (1986). DELPHI IV
Forecast and Analysis of the U.S. Automotive Industry Through 1995. Ann Arbor. Michigan: The University
of Michigan, University of Michigan Transportation Research Institute.)
How Well Do Users Type?
Most people in the Product Design Office are not proficient
typists. Of those responding, 12% reportedly cannot type, 16% type
with one finger, 19% use two fingers, 29% can type with more than 2
but less than 10 fingers, and 24% type with all 10 fingers. Most of
the participants (60%) look at the keyboard when they type, 19% look
sometimes for numbers and letters, 7% look sometimes for numbers but
not for letters, and 5% do not look at the keyboard. When asked
whether they could type fast enough to be a secretary, 7% said yes and
81% said no. Thus, when using the Keystroke Model (Card, Moran, and
Newell, 1983) to predict the times for interaction tasks, such as the
time to type commands, interkeystroke intervals (values for K) in the
.75 to 1.20 second range are appropriate.
What Computer Hardware and Software Are Users Familiar With?
While most respondents have not used computers at work many,
specifically 37.5%, have never used computers. Of those who have used
computers, the average amount of experience is 3.9 years, with a low
of 1 year or less and a high of 16 years. Home computers are used by
14.7% of the participants (23.9% of the computer users).
Table 8 shows the types of hardware computer users are familiar
with. The machines used most frequently were the Control DataTektronix and the IBM PC (or compatible). Half of the computer users
(28 of 56) have been exposed to the Tektronix hardware and one fourth
(14 of 56) use it at least once per week. The IBM PC (or compatible)
is used once per week by 7 of the 56 computer users while 19 have used
it at least once.
TABLE 8.
HARDWARE EXPERIENCE
[ s e e n o t e below]
Hardware
use at least
once per week
have used
19 (18.8%) (33.9%)
IBM PC (compat.)
(1.8%)
1 (1.0%)
Apollo
4 (4.0%) (7.1%)
LISP/AI machine
28 (27.7%) (50.0%)
Ctrl. Data - Tek.
Ctrl. Data - E & S 13 (12.9%) (23.2%)
7 (6.9%) (12.5%)
1 (1.0%) (1.8%)
2 (2.0%) (3.6%)
14 (13.9%) (25.0%)
6 (5.9%) (10.7%)
(3.0%) (5.4%)
(10.9%) (19.6%)
(5.9%) (10.7%)
(10.9%) (19.6%)
(4.0%) (7.1%)
1 (1.0%) (1.8%)
0
2 (2.0%) (3.6%)
0
2 (2.0%) (3.6%)
Sun
Apple I1
Macintosh
Commodore 64
Cyber 205
3
11
6
11
4
Cray
VAX/MicroVAX
IBM Mainframe
IBM Series 36/38
other( s )
(1.0%) (1.8%)
(3.6%)
(2.0%)
(6.9%) (12.5%)
(8.9%)
5 (5.0%)
(28.6%)
16 (15.8%)
# who responded
# who have not
56
used computers
Sample =
missing =
1
2
7
1
1
2
2
4
(1.0%)
(1.0%)
(2.0%)
(2.0%)
(4.0%)
(1.8%)
(1.8%)
(3.6%)
(3.6%)
(7.1%)
45 (44.6%)
101
21
[The 19 p e o p l e who have used an IBM PC represent 1 8 . 8 % o f t h e sample ( 1 0 1 ) t h a t
responded t o q u e s t i o n #14 (19 p e o p l e who responded t o q u e s t i o n #14 d i d not respond t o
t h i s q u e s t i o n ) . They r e p r e s e n t 3 3 . 9 % o f t h e 56 people who responded t o t h i s q u e s t i o n .
S i n c e more than one c h o i c e was a v a i l a b l e , percentages w i l l not t o t a l l o o % . ]
Table 9 shows which operating systems participants have used.
The PC-DOS/MS-DOS operating system has been used by more participants
than any other; however, the number of missing responses (53) may
indicate that most of the computer users do not know the names of the
operating systems they have used. Nonetheless, it appears that users
of the system being developed will have little exposure to the concept
of an operating system, concepts they will have to learn.
TABLE 9.
OPERATING SYSTEMS EXPERIENCE
[ s e e n o t e below]
Op. Systems
PC DOS/MS DOS
PRO DOS
UNIX
VM
CTOS
once per week
have used
17 (24.6%) (70.8%)
1 (1.4%) (4.2%)
1 (1.4%) (4.2%)
2 (2.9%) (8.3%)
1 (1.4%) (4.2%)
1
6
(8.7%) (25.0%)
(1.4%) (4.2%)
0
2
1
(2.9%)
(1.4%)
(8.3%)
(4.2%)
Macintosh
NOS/BE
MTS
MULTICS
other
# who responded
# who have not
used computers
Sample =
missing =
24
45 ( 6 5 . 2 % )
69
53
[The 17 people who have used PC DOS/MS DOS r e p r e s e n t 24.6% of t h e sample ( 6 9 ) who
responded t o q u e s t i o n t 1 4 .
( 5 1 of t h e people who resonded t o q u e s t i o n #14 did not
respond t o t h i s q u e s t i o n . ) They r e p r e s e n t 70.8% of t h e 24 people who responded t o t h i s
q u e s t i o n . Since more than one choice was a v a i l a b l e . percentages w i l l not t o t a l 1 0 0 % . ]
Participants were also asked to specify the computer applications
they have used. (See Table 1 0 . ) Chrysler CAD/CAM, word
processing, and games were the applications most often cited.
TABLE 10.
APPLICATIONS EXPERIENCE
[ s e e n o t e below]
Applications
have used
(45.6%)
(15.8%)
(12.3%)
(21.5%)
(8.8%)
(12.3%)
(19.3%)
Word Processing
Business Graphics
Spreadsheets
Artwork
Statistics
Data Base Mgmt.
Programming
26 ( 2 5 . 5 % )
9 (8.8%)
7 (6.9%)
12 (11.8%)
5 (4.9%)
7 (6.9%)
11 ( 1 0 . 8 % )
Chrysler CADCAM
Other CAD/CAM
Games
Other
3 1 (30.4%) (54.4%)
7 ( 6 . 9 % ) (12.3%)
20 ( 1 9 . 6 % ) ( 3 5 . 1 % )
2 (2.0%) (3.55)
# who responded
# who have not
used computers
57
45 ( 4 4 . 1 % )
Sample =
missing =
102
20
[The 26 people who have done word processing r e p r e s e n t
responded t o q u e s t i o n #14. (18 people who responded t o
t h i s q u e s t i o n . ) They r e p r e s e n t 45.6% of t h e 57 people
Since more than one choice was a v a i l a b l e . percentages w i
once per week
7
2
4
5
2
2
5
(6.9%) (12.3%)
(2.0%) (3.5%)
(3.9%) (7.0%)
(4.9%) (8.8%)
(2.0%) (3.5%)
(2.0%) (3.5%)
(4.9%) ( 8 . 8 5 )
13 (12.7%) (22.8%)
(1.8%)
1 (1.0%)
4 (3.9%) (7.0%)
1 (1.0%) (1.8%)
25.5% of t h e sample (102) t h a t
q u e s t i o n #14 d i d not respond t o
who responded t o t h i s q u e s t i o n .
l l not t o t a l loo%.]
Participants were also asked which pointing devices they had
used. Their responses are shown in Table 11. Most common were cursor
keys followed by the mouse and digitizer. Data on the number of
buttons on the mouse were not obtained.
TABLE 11.
POINTING DEVICE EXPERIENCE
Devices
Mouse
Joystick
Cursor Keys
Touchscreen
Tablet
Digitizer
Trackball/Bowling Ball
Dial/Knob
Thumb Wheel
Light Pen
# of responses
73
# who have not used a computer 45 (38.1%)
Sample =
missing =
[The 39 people who have used a mouse represent 33.1% of the sample (118)
who responded to question #14.
(Two of the people who responded to
question #14 did not respond to this question. ) They represent 53.4% of
the 73 people who responded to this question. Since more than one choice
was available, percentages will not total loo%.]
Eighteen of 48 respondents said they were most comfortable using
a mouse as a pointing device. Cursor keys were the next favorite (7
of 48). Thus, if a single cursor control device must be chosen, user
preference would indicate a mouse as the best choice. Performance
data in the human factors literature suggest it is often a best choice
as well (Card, English, and Burr, 1978). However, if a mouse is
selected, most users will need training on how to use it.
When asked which hand they preferred to use with a pointing
device, 58 responded right hand, 4 left hand, 9 either hand. These
responses are in line with an earlier question about handedness. In
that question, to which the full sample responded, 82.8% said they
were right-handed, 10.7% left-handed, and 6.6% ambidextrous. These
figures correlate closely with the handedness of the general
population. Given the fair number of lefties, users should be able to
locate input devices such as mice and dials on either side of the
keyboard. However, if that is not possible, then input devices should
be located on the right.
Finally, only 17 computer users have had any experience with a
windowing screen format, and only 2 have ever used systems with speech
input.
CONCLUSIONS
While one could label this group of potential users as "naive"
and leave it at that, a more detailed description of the users is
necessary. Just as one needs specifics about the power supplied, the
operating temperature of the equipment, and so forth, one also needs
specific information about the users. Trying to design a computer
system for "users" is like trying to design a computer when all one
knows is that it will be powered by electricity. (Is it AC or DC?
What voltage? How much current?) Narrowing the choice, for example,
by saying it is for "novices" is like saying the computer will run on
alternating current. (But is it 110 or 220? Square wave or sine
wave? Is the source reliable or is a backup power supply needed?
etc. )
Without this specific information, there is a strong tendency for
system developers to view users as being like those they know best,
namely themselves. It is unlikely a system developed with that
perspective will be easy for novices to use. Therefore, it is
imperative that detailed information concerning the user population be
collected and made available to system developers.
The survey discussed in this report addressed five key questions
about candidate users.
How well do users see? About one quarter of potential CAS users
wear bifocals. As discussed previously, this will affect their
ability to read the screen comfortably. Therefore, text to be read
should be located low in the visual field and be confined to a
relatively small area. Another alternative would be to provide
special reading glasses.
How much education do users have? The overwhelming majority of
users have at least a high school education. Therefore, material to
be read (instructions, documentation, commands, etc.) should be
written at a 12th grade reading level or below. Although the range in
education level in the survey sample is substantial, it can be assumed
that nearly all users will be able to read at this level.
How well do users type? The data collected indicate that this
group of potential users has relatively limited typing abilities.
This would indicate that in order to maintain efficiency, users should
do as little typing as possible. Other means of interacting with the
system should be provided. Also, it may be appropriate to improve the
typing skills of those who cannot touch type.
What do users do on the job? While these users have many job
specific skills, computer expertise is not one of them. Well over
half do not now use a computer on the job. Thus, these users are
truly novices. However, it should be remembered that there are a few
potential users who use computers extensively.
What computer hardware and software are users familiar with?
Very few of those surveyed currently use a computer with any degree of
regularity. This has numerous implications. First of all, most
potential users will not be familiar with the terminology and concepts
commonly used. Thus, users will need training both in the specifics
of the system being developed, and in basic concepts (e.g. what a file
is, what opening a file means, what an operating system is, etc.).
Secondly, although the favorite input device among computer users
was a mouse, most of those surveyed have never used a mouse. This
implies that some training in its use may be needed.
The results of this survey describe the Chrysler Design Office
employees as moderately educated, experienced at their current job,
relatively poor typists, and for the most part unfamiliar with
computers and application software. What makes this report useful is
not that summary statement, but the statistics that support it. To a
large degree the significance of this report will only become apparent
when detailed design of the interface is underway. It is at this
stage that alternative input devices, screen formats, etc. must be
analyzed. The data collected by this survey, which describe user
capabilites and experience, will assist in deciding among these
alternatives.
REFERENCES
Andrea, D., (1987). personal communication.
Bennett, J.L., (1984). "Managing to Meet Usability Requirements,"
in Bennett, J., Case, D., Sandelin, J., and Smith, M. (eds.),
Visual Display Terminals: Usability and Health Concerns, Englewood
Cliffs, NJ, 161-184.
Bricklin, D., (1985). "Dan BricklintsDemo Program User Manual,"
West Newton, MA.
Card, S.K., English, W.K. and Burr, B.J., (1978). "Evaluation of
Mouse, Rate-Controlled Isometric Joystick, Step Keys, and Text Keys
21(8), 601-613.
for Text Selection on a CRT," Ergonomics, Chrysler Motors Corporation and Evans and Sutherland Computer
Corporation (1986). "Chrysler Motors Corporation/Evans and
Sutherland Computer Corporation Corporate Research and Development
Agreement" (confidential document), November 1, 1986.
Gilb, T., (1985). "The Impact Analysis Table Applied to Human
Factors Design," in Shackel, B. (ed.), Human-Computer Interaction
- INTERACTT84,Amsterdam, Netherlands: North-Holland, 655-659.
-
Good, M., Spine, T.M., Whiteside, J., and George, P., ( 1986).
"User-Derived Impact Analysis As a Tool for Usability Engineering,"
Human Factors in Computing Systems -- CHIt86 Proceedings, April,
241-246.
Gould, J.D. and Lewis, C., (1983). "Designing for Usability: Key
Principles and What Designers Think," CH1183 Proceedings: Human
Factors in Computing Systems, New York: Association for Computing
Machinery, 50-53.
Gould, J.D. and Lewis, C., (1984). "Designing for Usability -- Key
Principles and What Designers Think," IBM technical report RC
10317, Yorktown Heights, New York.
Gould, J.D. and Lewis, C., (1985). "Designing for Usability: Key
Principles and What Designers Think," Communications of the ACM,
28(3), 300-310.
Green, P., (1984). "Preliminary Design of the Ford TM-3
Tripcomputer," The University of Michigan Transportation Research
Institute technical report UMTRI-84-6, Ann Arbor, Michigan, March.
Mantei, M., (1986). "Techniques for Incorporating Human Factors in
the Software Lifecycle," Proceedings of the Structured Techniques
Association Third Annual Conference, 177-203.
Norman, D.A. (1981). "The Trouble with UNIX," Datamation, November,
139-150.
Poor, A., (1986). "Screen Test Software for the Image Makers,"
Magazine, December 23, 5(22), 199-220.
Taylor, J., (1987). personal communication.
PC
APPENDICES
-
APPENDIX
A:
SURVEY FORM
HUMAN FACTORS DIVISION
Ms. Susan Adams and Dr. Paul Green
(313) 764 - 4158
INTRODUCTION
This survey is being conducted by the University of Michigan
Transportation Research Institute for the Chrysler Corporation.
Chrysler is planning to implement a new Computer-Aided Surfacing
(CAS) system which will be used to design interior and exterior
car surfaces. The University is helping to develop the user
interface for this system.
The purpose of this survey is to determine the background of
potential users of this new system so that a "user friendly"
interface can be developed. Since you are a potential user we
would like to customize the system to fit your background. This
survey will NOT be used to select the users of the CAS system.
Chrysler will be given only the combined data from those
surveyed, not individual responses.
Take your time and answer the following questions as
completely as you can. If you have any questions concerning this
survey, please contact Susan Adams or Paul Green at the above
phone number, or call Mike Holmes at 956-2106. Please see that
this survey is returned to Mike Holmes.
We appreciate your cooperation in this effort.
BIOGRAPHICAL INFORMATION
1.
Are you:
(check one)
right-handed
left-handed
ambidextrous
2.
Do you wear:
(check a l l t h a t a p p l y )
glasses
contacts
bifocals
3.
What is your visual acuity?
(e.g. 20/20)
EDUCATIONAL INFORMATION
4.
What is the highest level of formal education you have
completed? (check one)
high school
technical/vocational school
some college
college
graduate school
5.
Indicate special areas of study. (e.g. mechanical
engineering, industrial design, graphic a r t s )
6.
Have you recently attended any workshops/seminars/short
courses?
No
Yes
-->
What?
OCCUPATIONAL INFORMATION
7. What is your occupation? (check one)
draftsperson
designer
technician
technical illustrator
human cannonball
mechanical engineer
electrical/computer engineer
other engineer --> what type?
(not electrical/computer or mechanical)
other:
8. What is your job title?
9. How long have you been working in your current field?
10. What tasks do you perform on your job? (check all that
apply )
using a computer
don't use a computer on my job
word processing
prepare spreadsheets
digitizing
data entry
statistics
calculations
data base management
programming
prepare business graphics (e.g. pie charts, histograms)
mechanical drawing/design
artistic drawing/design/rendering
manually
make clay models
mechanical drawing/design
artistic drawing/design/rendering
use a typewriter
use a calculator/adding machine
other( s ) :
11.
HOW
do you type? (check one)
can't type (go to question #16)
one finger
two finaers
more than two fingers but less than ten fingers
all ten fingers
12.
Do you usually look at the keyboard when you type? (check
one )
Yes
sometimes for numbers and letters
sometimes for numbers but not for letters
no
13. Do you type fast enough to be a secretary?
Yes
No
COMPUTER SYSTEMS EXPERIENCE
14. Have you ever used a computer?
Yes
No --> do not answer questions 15-24
15.
How long have you been using computers?
16.
Do you use a computer at home?
Yes
(years)
17. Below is a list of computer hardware. In the left column
check all those that you have used, either at work or at
home. In the right column check all those that you use at
least once per week.
have
used
once
per week
IBM PC or compatible
Apollo
LISP/AI machine
~ont=olData - Tektronix
Control Data - Evans & Sutherland
-
-
~
-
Sun
Apple I1
Macintosh
Commodore 64
Cyber 205
Cray
VAX/MicroVAX
IBM (or similar) Mainframe
IBM Series 36/38
18.
Below is a list of operating systems. In the left'column
check all those that you have used, either at work or at
home. In the right column check all those that you use at
least once per week.
have
used
once
per week
PC DOS/MS DOS
PRO DOS
UNIX
VM
CTOS
Macintosh User Interface
NOS/BE
MTS
MULTICS
other(s) :
19. Below is a list of computer applications. In the left
column check all those that you have used, either at work or
at home. In the right column check all those that you use
at least once per week.
have
used
once
per week
word processing
business graphics ( e . g . pie charts,
histograms)
spreadsheets
artwork (e.g. MacPaint)
statistics
data base management
programming
Chrysler CADCAM
other CAD/CAM programs (not Chrysler)
games
other(s) :
20.
Which pointing devices have you used? (check a l l t h a t a p p l y )
mouse
joystick
cursor keys
touchscreen
tablet
digitizer
track ball/bowling ball
dial/knob
thumb wheel
light pen
other(s):
21.
Which pointing device are you most comfortable with?
22.
Which hand do you prefer to use with a pointing device?
(check one)
right hand
left hand
either hand
23.
Do you have any experience with "windowing" as a type of
screen display format (as used on the A p p l e Macintosh)?
Yes
24.
Do you have any experience with computer systems that use
speech as a method of input?
Yes
THANK YOU FOR YOlJR T I M E ! !
APPENDIX B:
SUMMARY STATISTICS
HUMAN FACTORS DIVISION
Ms. Susan Adams and Dr. Paul Green
(313) 764
-
4158
INTRODUCTION
This survey is being conducted by the University of Michigan
Transportation Research Institute for the Chrysler Corporation.
Chrysler is planning to implement a new Computer-Aided Surfacing
(CAS) system which will be used to design interior and exterior
car surfaces. The University is helping to develop the user
interface for this system.
The purpose of this survey is to determine the background of
potential users of this new system so that a "user friendly"
interface can be developed. Since you are a potential user we
would like to customize the system to fit your background. This
survey will NOT be used to select the users of the CAS system.
Chrysler will be given only the combined data from those
surveyed, not individual responses.
Take your time and answer the following questions as
completely as you can. If you have any questions concerning this
survey, please contact Susan Adams or Paul Green at the above
phone number, or call Mike Holmes at 956-2106. Please see that
this survey is returned to Mike Holmes.
appreciate your cooperation in this effort.
122 people participated in this survey
Sample = 122 - # of missing responses
first value = # of responses to specific choice
second value (inparentheses) = % of sample responding to
specific choice
third value (in parentheses) = % of responses to specific choice
For questions where more than one choice is available,
percentages will not total 100%.
BIOGRAPHICAL INFORMATION
1.
Are you:
(check one)
right-handed
left-handed
ambidextrous
2.
Do you wear:
(check all that apply)
58 (47.5%) glasses
13 (10.7%) contacts
29 (23.8%) bifocals
Sample=122, missing=O
3.
What is your visual acuity? ( e . g . 20/20) mean: 20/24
min: 20/10, max: 20/60, std dev: 8.9, Sample=73, missing=49
EDUCATIONAL INFORMATION
4.
What is the highest level of formal education you have
completed? (check one)
12 (9.8%) high school
12 (9.8%) technical/vocational school
43 (35.2%) some colleae
"
46 (37.7%) college
9 (7.4%) graduate school
Sample=122, missing=O
5.
Indicate special areas of study. (e.g. mechanical
engineering, industrial design, graphic a r t s )
AREA OF STUDY
engineering
mechanical engrg.
civil engrg.
electrical engrg.
materials engrg.
automotive engrg.
packaging engrg.
architecture
business
management
marketing
industrial Mgmt.
advertising
real estate
fine arts
graphics
sculpture
design
industrial design
automotive design
BIW design
other technical
drafting
other
Sample =
missing =
FIRST
SECOND
THIRD
6.
Have you recently attended any workshops/seminars/short
courses?
44 (37.9%) Yes -->
What?
Sample=116, missing=6
SEMINAR TYPE
FIRST
SECOND
[ s e e n o t e below]
[ s e e n o t e be.low]
management
communications
design
computers
other
4 (3.5%)
10 (8.7%)
3 (2.6%)
2 (1.7%)
24 (20.9%)
# who responded
# not attending
43
72 (62.6%) ----100.0% 100.0%
Sample =
missing =
(9.3%)
(23.3%)
(7.0%)
(4.7%)
(55.8%)
1
1
1
1
5
(1.2%)
(1.2%)
(1.2%)
(1.2%)
(6.2%)
(11.1%)
(11.1%)
(11.1%)
(11.1%)
(55.6%)
9
72 (88.9%) ----100.0% 100.0%
115
7
[The 4 p e o p l e who a t t e n d e d a management seminar r e p r e s e n t 3 . 5 % o f t h e smaple (115) who
(One p e r s o n who answered " y e s " d i d n o t l i s t a seminar t y p e . )
responded t o q u e s t i o n # 6 .
They r e p r e s e n t 9 . 3 % o f t h e 43 p e o p l e who responded t o t h i s q u e s t i o n . ]
OCCUPATIONAL INFORMATION
7.
What is your occupation? (check one)
0
draftsperson
31 (25.4%) designer
1 (0.8%) technician
0
technical illustrator
44 (36.1%) artist/sculptor
human cannonball
mechanical engineer
electrical/computer engineer
other engineer --> what type?
studio engineer
other:
missing=O
What is your job title?
JOB TITLE
tech. manager
non-tech. manager
other manager
engineer
designer
sculptor
other
Sample =
missing =
2
15
5
30
23
45
2
(1.6%)
(12.3%)
(4.1%)
(24.6%)
(18.9%)
(36.9%)
(1.6%)
122
0
How long have you been working in your current field?
mean: 16.7 (years) min: 1, max: 38, std dev: 10.8,
Sample=122, missing=O
What tasks do you perform on your job? (check all that
apply)
using a computer
73 (61.3%) don't use a computer on my job
word processing
prepare spreadsheets
digitizing
data entry
statistics
calculations
data base management
programming
prepare business graphics
mechanical drawing/design
artistic drawing/design/rendering
other(s):
manually
make clay models
mechanical drawing/design
artistic drawing/design/rendering
use a typewriter
use a calculator/adding machine
other(s):
missing=3
11. How do you type? (check one)
14 (11.7%) can't type (go to question #16)
19 (15.8%) one finger
23 (19.2%) two fingers
35 (29.2%) more than two fingers but less than ten fingers
29 (24.2%) all ten fingers
Sampl e=120, missing=2
12. Do you usually look at the keyboard when you type? (check
one )
RESPONSES
[ s e e n o t e below]
Yes
sometimes for numbers and letters
sometimes for numbers but not letters
no
70 (57.9%) (65.4%)
23 (19.0%) (21.5%)
8 (6.6%) (7.5%)
6 (5.0%) (5.6%)
# who responded
# who can 't type
Sample =
missing =
[The 70 p e o p l e who l o o k a t t h e keyboard r e p r e s e n t 57.9% o f the'sample ( 1 2 1 ) who responded
t o question # l l .
(One p e r s o n who d i d n o t respond t o q u e s t i o n #11 d i d respond t o t h i s
q u e s t i o n . ) They r e p r e s e n t 65.4% o f t h e 107 who responded t o t h i s q u e s t i o n . ]
13.
Do you type fast enough to be a secretary?
RESPONSES
[ s e e n o t e below]
Yes
No
# who responded
# who can ' t type
Sample =
missing =
[The 9 p e o p l e who t y p e f a s t enough t o be a s e c r e t a r y r e p r e s e n t 7.4% of t h e sample ( 1 2 2 )
who responded t o q u e s t i o n # l l .
(Two p e o p l e who d i d n o t respond t o q u e s t i o n #11 d i d
respond t o t h i s q u e s t i o n . )
They r e p r e s e n t 8.3% of t h e 108 who responded t o t h i s
question. I
COMPUTER SYSTEMS EXPERIENCE
14. Have you ever used a computer?
75 (62.5%) Yes
45 (37.5%) No --> do not answer questions 15-24
Sample=120, missing=2
15. How long have you been using computers?
(years)
for the sample: mean=2.1 yrs., min=O, max=16, sample=100,
missing=22 [see note below]
for computer users:
mean=3.8 yrs., min=l, max=16,
std dev=3.9, .SaTllple=55 [see note below]
[20 people who responded "yes" to question #14 did not respond to this question.]
16.
Do you use a computer at home?
RESPONSES
[see note below]
Yes
No
# who responded
# who have not used computers
71
45 (38.8%)
----100.0%
100.0%
Sample =
missing =
[The 17 people who do use a computer at home represent 14.7% of the sample (116) who
responded to question #14. (4 of the people who responded to question #14 did not respond
to this question.) They represent 23.9% of the 71 people who responded to this question.]
17.
Below i s a l i s t of computer hardware.
I n t h e l e f t column
check a l l t h o s e t h a t you have used, e i t h e r a t work o r a t
home.
I n t h e r i g h t column check a l l t h o s e t h a t you use a t
l e a s t once per week.
have used
Hardware
once per week
[ s e e note below]
[ s e e note below]
7 (6.9%) (12.5%)
1 (1.0%) (1.8%)
2 (2.0%) (3.6%)
14 (13.9%) (25.0%)
6 (5.9%) (10.7%)
IBM PC ( compat. )
Apollo
LISP/AI machine
C t r l . Data
Tek.
C t r l . Data
E & S
19
1
4
28
13
(18.8%)
(1.0%)
(4.0%)
(27.7%)
(12.9%)
(33.9%)
(1.8%)
(7.1%)
(50.0%)
(23.2%)
Sun
Apple I1
Macintosh
Commodore 64
Cyber 205
3 (3.0%)
11 ( 1 0 . 9 % )
6 (5.9%)
11 ( 1 0 . 9 % )
4 (4.0%)
(5.4%)
(19.6%)
(10.7%)
(19.6%)
(7.1%)
1 (1.0%)
0
2 (2.0%)
0
2 (2.0%)
(1.8%)
Cray
VAX/MicroVAX
IBM Mainframe
IBM S e r i e s 36/38
other( s)
(1.0%)
(2.0%)
(6.9%)
5 (5.0%)
16 (15.8%)
(1.8%)
(3.6%)
(12.5%)
(8.9%)
(28.6%)
1
1
(1.0%)
(1.0%)
(2.0%)
(2.0%)
(4.0%)
(1.8%)
(1.8%)
(3.6%)
(3.6%)
(7.1%)
# who responded
# who have not
used computers
56
-
Sample =
missing =
1
2
7
2
2
4
(3.6%)
(3.6%)
45 ( 4 4 . 6 % )
101
21
[The 19 people who have used an IBM PC represent 1 8 . 8 %of the sample ( 1 0 1 ) that responded
t o question #14 (19 people who responded t o question #14 did not respond t o t h i s
q u e s t i o n . ) They represent 33.9% of the 56 people who responded t o t h i s question. Since
more than one c h o i c e was a v a i l a b l e . percentages w i l l not t o t a l l o o % . ]
18.
Below is a list of operating systems. In the left column
check a l l those that you have used, either at work or at
home. In the right column check a l l those that you u s e at
l e a s t once per week.
Op. Systems
have used
once per week
[ s e e n o t e below]
PC DOS/MS DOS
PRO DOS
UNIX
VM
CTOS
17
1
1
2
1
(24.6%) (70.8%)
(1.4%) (4.2%)
(1.4%) (4.2%)
(2.9%) (8.3%)
(1.4%) (4.2%)
[ s e e note below]
6
1
0
2
1
(8.7%) (25.0%)
(1.4%) (4.2%)
(2.9%)
(1.4%)
(8.3%)
(4.2%)
Macintosh
NOS/BE
MTS
MULTICS
other
# who responded
# who have not
used computers
Sample =
missing =
24
45 ( 6 5 . 2 % )
69
53
[The 17 people who have used PC DOS/MS DOS r e p r e s e n t 24.6% of t h e sample ( 6 9 ) who
responded t o question #14. (51 of t h e people who resonded t o question #14 d i d not respond
t o t h i s q u e s t i o n . ) They r e p r e s e n t 70.8% of t h e 24 people who responded t o t h i s q u e s t i o n .
Since more than one choice was a v a i l a b e . percentages w i l l not t o t a l LOO%.]
19.
Below is a list of computer applications. In the left
column check all those that you have used, either at work or
at home. In the right column check all those that you use
at least once per week.
Applications
have used
once per week
[ s e e message below]
[ s e e message below]
word processing
26 (25.5%) (45.6%)
9 (8.8%) (15.8%)
business graphics
7 (6.9%) (12.3%)
spreadsheets
12 (11.8%) (21.5%)
artwork
5 (4.9%) (8.8%)
statistics
7 (6.9%) (12.3%)
data base mgmt.
11 (10.8%) (19.3%)
programming
Chrysler CADCAM
other CAD/CAM
games
other
31 (30.4%) (54.4%)
7 (6.9%) (12.3%)
20 (19.6%) (35.1%)
2 (2.0%) (3.55)
# who responded
# who have not
used computers
57
45 (44.1%)
Sample =
missing =
102
20
[The 26 people who have done word processing r e p r e s e n t
responded t o question 1114. (18 people who resonded t o
t h i s question.)
They r e p r e s e n t 4 5 . 6 % of t h e 57 people
Since more than one choice was a v a i l a b l e . percentages w i l
7
2
4
5
2
2
5
(6.9%)
(2.0%)
(3.9%)
(4.9%)
(2.0%)
(2.0%)
(4.9%)
(12.3%)
(3.5%)
(7.0%)
(8.8%)
(3.5%)
(3.5%)
(8.85)
13 (12.7%) (22.8%)
1 (1.0%) (1.8%)
4 (3.9%) (7.0%)
1 (1.0%) (1.8%)
2 5 . 5 % of t h e sample (102) t h a t
question #14 d i d not respond t o
who responded t o t h i s question.
l not t o t a l l o o % . ]
20.
Which pointing devices have you used? (check a l l that a p p l y )
Devices
[ s e e n o t e below]
mouse
joystick
cursor keys
touchscreen
tablet
digitizer
trackball/bowling ball
dial/knob
thumb wheel
light pen
other
# of responses
# who have not used a computer
Sample =
missing =
[The 39 p e o p l e who have used a mouse r e p r e s e n t 33.1% o f t h e sample ( 1 1 8 ) who responded t o
(Two of t h e p e o p l e who responded t o q u e s t i o n #14 d i d n o t respond t o t h i s
q u e s t i o n #14.
q u e s t i o n . ) They r e p r e s e n t 53.4% of t h e 73 p e o p l e who responded t o t h i s q u e s t i o n . S i n c e
more t h a n one c h o i c e was a v a i l a b l e . p e r c e n t a g e s w i l l n o t t o t a l loo%.]
21.
Which pointing device are you most comfortable with?
Devices
[ s e e n o t e below]
mouse
joystick
cursor keys
touchscreen
tablet
digitizer
trackball/bowling ball
dial/knob
thumb wheel
light pen
other
# of responses
# who have not used a computer
Sample =
missing =
[The 1 8 p e o p l e who p r e f e r a mouse r e p r e s e n t 19.4% o f t h e sample ( 9 3 ) who responded t o
q u e s t i o n #14.
question.)
22.
( 2 7 o f t h e p e o p l e who responded t o q u e s t i o n #14 d i d n o t respond t o t h i s
They r e p r e s e n t 37.5% o f t h e 48 p e o p l e who responded t o t h i s q u e s t i o n . ]
Which hand do you prefer to use with a pointing device?
(check one)
HAND
[ s e e n o t e below]
right hand
left hand
either hand
# who responded
# who have not used a computer
71
45 (38.8%)
100.0%
----100.0%
Sample =
missing =
[The 58 p e o p l e who p r e f e r
responded t o q u e s t i o n #14.
t o t h i s question.)
their right
hand r e p r e s e n t
50.0% of
t h e sample
( 1 1 6 ) who
( 4 o f t h e p e o p l e who responded t o q u e s t i o n #14 d i d n o t respond
They r e p r e s e n t 81.7% o f t h e 71 p e o p l e who responded t o t h i s q u e s t i o n . ]
23.
Do you have any experience with "windowing" as a type of
screen display format (as used on the Apple Macintosh)?
RESPONSES
[see note below]
Yes
No
# who responded
# who have not used a computer
69
45 (39.5%)
----100.0%
100.0%
Sample =
missing =
[The 17 people who have experience with windowing represent 14.9% of the sample (114) who
responded to question #14. (6 of the people who responded to question #14 did not respond
to this question.) They represent 24.6% of the 69 people who responded to this question.]
24.
Do you have any experience with computer systems that use
speech as a method of input?
RESPONSES
[see note below]
Yes
No
# who responded
# who have not used a computer
70
45 (39.1%) ----100.0%
100.0%
Sample =
missing =
[The 2 people who have experience with speech input represent 1.7% of the sample (115) who
responded to question #14.
(5 people who responded to question #14 did not respond to
this question.) They represent 2.9% of the 70 people who responded to this question.]
THANK YOU FOR YOUR T I M E ! !