1
P a g e | 34
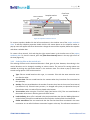
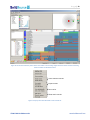
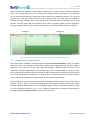
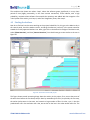
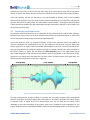
The evolution view shows two salient ‘steps’, where the software grows significantly in a very short
period of time (highly presumably, in the same commit transaction). These indicate, with a high
probability, moments when software from outside the repository was added. We also recognize a first
‘silent’ phase of the activity, until step 1, and a final ‘stagnation’ phase, after step 2.
4.2 Finding the Authors
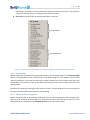
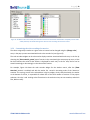
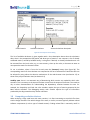
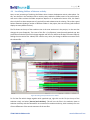
Now let us find out how the team working on the project looked like. For this, go to the Metrics tab in
the control panel, check the Authors metric, and drag the observer (red icon) in the preset controller
towards the newly appeared Authors icon. Next, right click on the Authors list-widget in the Metrics tab,
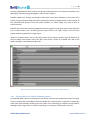
select [Show #versions], and then [Sort on #versions]. You should now get a view similar to the one in
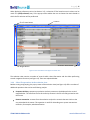
Figure 25.
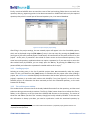
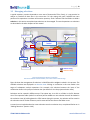
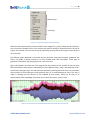
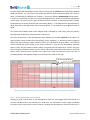
Figure 25: The authors of the mCRL project
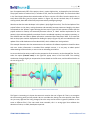
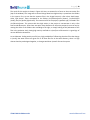
This figure shows several interesting things about the activity in this project. First, we see that most of
the work done before the first abrupt step is done by mweerden (pink color). At precisely the first step,
the author jwulp comes in the team, and commits a large number of files. His color, cyan, is also the
predominant one in the evolution view. Also, we see him as the last in the value-sorted metric list. The
© 2007-2010 SolidSource BV
www.SolidSourceIT.com