1
the mean standardized test score at age 14 for different ethnic groups but take into account
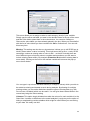
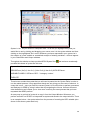
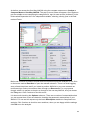
the margin of error (error bar) for each group mean. Use Graphs > Legacy Dialogs > Error
Bar and select the default Simple and Summaries for groups of cases option to open the
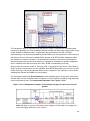
following menu:
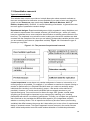
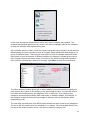
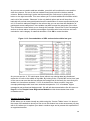
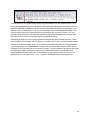
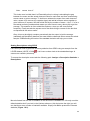
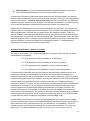
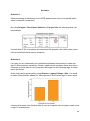
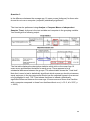
We will move age 14 test score (ks3score) into the Variable box and ethnic onto the
Category Axis. Note the section titled Bars Represent which allows you to define the
confidence interval – the default of 95% is the most commonly used, so we‟ll stick to that, but
it is useful to know it can be altered to match the context. Click OK when you are happy with
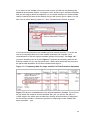
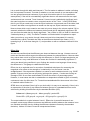
the settings and Figure 1.9.5 should appear.
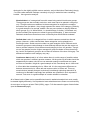
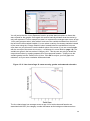
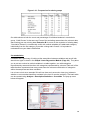
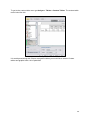
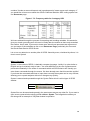
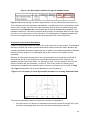
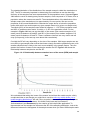
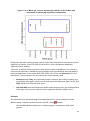
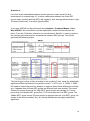
Figure 1.9.5: Mean age 14 score by ethnicity with 95% Confidence intervals
The circle in the middle of each line represents the mean score for that ethnic group. The
extension of the line represents the range in which we are 95% confident that the „true‟ mean
lies for the group (+/- 2 SE). Note how the confidence interval for White British students is
comparatively narrower than the intervals for the other ethnic groups. This is because the
sample size for this group is much larger than for the other groups (see Figure 1.5.1, Page
1.5). Everything else being equal the larger the sample the more likely it is to represent the
population and the more precisely we can estimate the „true‟ population mean.
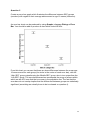
We can see from these error bars that, even though there are differences in the mean
scores of the Pakistani, Bangledeshi, Black African and Black Caribbean groups, their
confidence intervals overlap, meaning that there is insufficient evidence to suggest that the
52