1
The last two numbers define the x- (horizontal) and y- (vertical) offset distance (in graph pixels)
of the origin from the bottom-left corner of the page. Note that these values are related to the
size of the (landscape A4 sized) page area, which is equal to 29702100 graph pixels.
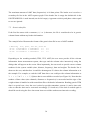
The 3.rd line defines some real valued (floating point) parameters. The first defines the relative
length of the x axes of the TEM (voltage 0.5 & app. resistivity 0.575), DC (0.575) and AMT
(0.575) graphs and the maximum height (0.85) of the y axis (in all graphs). These values are
relative to the size of the width and height of the plot area (eg. 0.5= 50 % of the width or height)
without the offsets of the origin. The sixth parameter defines the relative vertical position (from
the top of the graph) of the model information text next to the graph. The last parameter defines
the value used to change the aspect ratio of widescreen displays. Note that workstations with two
display screens make DISLIN to compute the horizontal width of the.
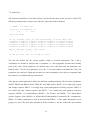
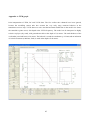
The 4.th line defines x and y axis ranges for the TEM graphs. The six parameters are the limiting
values of the logarithmic time axis (in milliseconds), the limiting values of the logarithmic
voltage axis (micro-volts) and the limiting values of the logarithmic apparent resistivity axis
(ohm-meter).
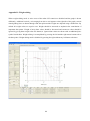
The 5.th line defines x and y axis ranges for the DC graphs. The six parameters are the limiting
values of the logarithmic distance axis (in metres), the limiting values of the logarithmic
apparent resistivity axis (ohm-meter), and the limiting values of the linear apparent chargeability
axis (%).
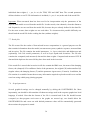
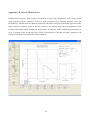
The 6.th line defines x and y axis ranges for the AMT graphs. The six parameters are the
minimum and maximum value of the logarithmic distance axis (in metres), the minimum and
maximum value of the logarithmic apparent resistivity axis (ohm-meter).
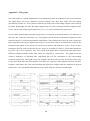
The 7.th line defines x and y axis values for the model view graph. The four parameters are the
limiting values of the logarithmic resistivity axis (ohm-meter), the step and the maximum value
of the linear or logarithmic depth axis (ohm-meter). The minimum depth is always zero if the
depth axis is linear and automatically computed if the depth axis is logarithmic.
Note that DISLIN graphics uses ISO Latin-1 character codes and control characters that allow
displaying Greek alphabets as well as sub- and superscripts. For example, character string
"({M2}W{M1}m) " will create text "(m)" in the graphs. See DISLIN documentation for further
information.
38