1
YACC — User Manual
Page 16 of 17
File fuel.dat with data
for gnuplot program.
44.09
41.63
43.12
37.36
43.58
43.46
Σf
1.9 · 108
161959814
153856441
155367922
138954037
159957383
159408461
Gnuplot commands.
f(x)=a*x
fit f(x) "fuel.dat" via a
plot [37:45] "fuel.dat", f(x)
Results with thick
errors were excluded from calculations.
1
1.8 · 108
1.7 · 108
y = 3 669 000 · x
2
1.6 · 108
8
7
5
4
1.5 · 108
1.4 · 108
1.3 · 108
6
3
37
38
l
39
40
41
42
43
44
45
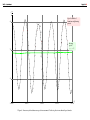
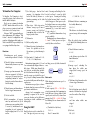
Figure 9: Calculation of fuel consumption calibration coefficient cf uel by fitting a straight line y = cf uel · x to recorded data with least square method. Gnuplot
program was used.