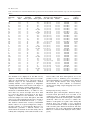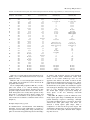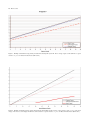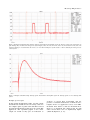
1
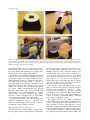
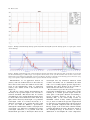
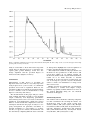
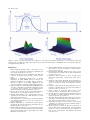
Journal of Cosmetic and Laser Therapy
2007, 1–13, iFirst article
INDUSTRY REPORT
Measuring key parameters of intense pulsed light (IPL) devices
GODFREY TOWN1, CAERWYN ASH2, EWAN EADIE3 & HARRY MOSELEY3
1
Independent Laser Protection Adviser, Haywards Heath, West Sussex, UK, 2School of Physical Sciences, University of Wales
Swansea, Swansea, Wales, UK, and 3The Photobiology Unit, University of Dundee, Dundee, Scotland, UK
Abstract
Background: Unlike medical lasers, intense pulsed light (IPL) devices are largely unregulated and unclassified as to degree of
safety hazard. With the exception of most of the USA, the United Kingdom and parts of Europe, the Far East and Australia,
the sale of IPLs is generally unrestricted, with the majority being sold into the beauty therapy and spa markets. Standards
are only imposed on manufacturers for technical performance data and operating tolerances determined by CE-compliance
under electrical safety standards or the EU Medical Device Directive. Currently, there is no requirement for measurement
of key IPL performance characteristics. Objective: To identify the key IPL parameters, emphasize their importance in terms
of safe and effective treatment and provide examples of preliminary measurement methods. These measurements can
highlight changes in an IPL device’s performance, improving patient safety and treatment efficacy. Methods: Five key
parameters were identified as having an important role to play in the way light interacts with the skin, and therefore an
important role in patient safety and effective treatment. Simple methods were devised to measure the parameters, which
include fluence, pulse duration, pulse profile, spectral output and time-resolved spectral output. Results: The measurement
methods permitted consistent and comparable measurements to be made by two of the authors at working clinic locations
on 18 popular IPL devices and allowed assessment of output variations. Results showed discrepancies between the
measured IPL device outputs and those values displayed on the system or claimed by the manufacturers. The importance of
these discrepancies and their impact is discussed. Conclusions: This study, of 18 popular devices in regular daily use in
England and Wales, provides example methods for measuring key IPL device parameters and highlights the need for regular
measurement of at least those five key parameters measured in this study. These methods can help service technicians to
check performance and eliminate device malfunction.
Key words: Energy density, fluence, optical hazard, spectral output, square pulse
Introduction
In Europe, medical lasers are governed by strict
safety standards (1,2). The European Standard EN
60825 is designed to protect individuals from laser
radiation in the wavelength range 180 nm to 1 mm
by indicating safe working levels of laser radiation
and introducing a system of classification of lasers
according to their degree of hazard. The Standard
requires both user and manufacturer to establish
procedures and supply information so that proper
precautions can be adopted. Medical lasers intended
for irradiation of the human body require internal
controls to measure radiation emission levels with an
error in measurement of no more than ¡20% given
in SI units and instructions specifying a procedure
and schedule for calibration of the measurement
system (1). No such requirement exists for intense
pulsed light (IPL) devices whether or not they
comply with the European Medical Device
Directive. Technical Report IEC TR60825-9 confirms risk factors and measurement practices applied
by specialists in the optical radiation field. It
identifies retinal thermal hazard and blue light
photochemical hazard as relevant in considering
the safe use of incoherent light sources. However, at
the time of submission of this study, standards,
which will deal specifically with IPL sources are still
only at draft stage (3).
This means that there is no incentive to perform
measurement, and no standard procedures in place
to help manufacturers. IPL devices are being used
widely with limited accurate knowledge of their
performance characteristics. Measurement of certain
key parameters could help reduce the risk of underor over-treatment or burn injury to patients. The
Correspondence: Godfrey Town, 88 Noah’s Ark Lane, Lindfield, West Sussex RH16 2LT, UK. Tel: 44 1444 484295. Fax: 44 1444 484357. E-mail:
[email protected]
(Received 26 April 2007; accepted 3 May 2007)
ISSN 1476-4172 print/ISSN 1476-4180 online # 2007 Taylor & Francis
DOI: 10.1080/14764170701435297
G. Town et al.
absence of any published standards for IPL safety
eyewear, used by the patient and the operator,
increases the risk of eye injury (4).
The issue of IPL safety was raised by experts at the
ASLMS Joint International Laser Meeting in
Edinburgh, Scotland (21–23 September 2003),
when Hode of the Swedish Laser Medical Society
considered the hazards of IPL sources (5).
Clarkson has also documented the hazards of noncoherent light sources within the framework of IEC
TR-60825-9 (6).
In England and Wales, the Care Standards Act
2000, as amended by the Health and Social Care Act
2001, treats establishments using IPL devices in a
similar way to users of Class 4 medical lasers. The
statutory definition of an IPL states ‘an intense light,
being broadband non-coherent light which is filtered
to produce a specified range of wavelengths; such
filtered radiation being delivered to the body with
the aim of causing thermal, mechanical or chemical
damage to structures such as hair follicles and skin
blemishes while sparing surrounding tissues’ (7).
It is therefore clear that such high-power devices
can cause tissue damage in a similar way to medical
lasers and should be subject to equivalent standards
to those provided for Class 4 medical lasers.
The purpose of this study is to identify the key IPL
parameters that impact on safety and treatment
efficacy, providing results from preliminary measurements carried out on 18 IPL devices. Clarkson (8,9)
describes methods for measuring pulse duration and
pulse profile; in a similar manner the methods
described in this paper can be used as a simple
guide for service technicians to follow. It is acknowledged that these methods will not provide absolute
values in terms of traceability to national standards;
however, they will serve as a useful diagnostic tool
enabling performance to be checked regularly during
device lifetime.
The primary purpose of IPL devices is to destroy
target structures through controlled thermal absorption in specific skin chromophores such as melanin
and haemoglobin, resulting in the long-term reduction of unwanted hair or the removal of benign
vascular and pigmented lesions (10–17). IPLs may
also be used to produce a photochemical effect alone
or in conjunction with topically applied photosensitive drugs such as 5-ALA (18–20), which is used to
stimulate the production of naturally occurring
porphyrins to destroy bacteria. IPLs may also
provide penetrating wavelengths of light to directly
stimulate tissue regeneration through a wound
healing response (photobiomodulation or low level
laser therapy) at the mitochondrial level (21,22).
It is therefore increasingly important that the user
can be assured of accurately measured and correctly
distributed energy at the skin surface. The pulse
duration of delivered light and the associated
spectrum of light produced also play a key role in
correct targeting of key structures. There is little
objective evidence provided by manufacturers even
in user and service manuals to validate claims for
pulse features or stability of spectrum characteristics.
The authors identified the following five key
parameters to measure:
1.
2.
3.
4.
5.
energy density (fluence) for various popularly
used pulse patterns over the claimed lifetime of
the lamp and filter assembly to establish
whether there is any significant deviation or
deterioration compared with established standards for medical lasers. Clearly, excessive
energy density above stated values may result
in burns to patients’ skin and low-energy
density may result in under-treatment and
patient dissatisfaction.
pulse duration (or durations of sub-pulses in a
pulse train) of the intense light emitted from the
xenon flashlamps. The pulse duration can be
critical in the efficacy of the type of treatment,
particularly where the pulse duration is to be
matched to the thermal relaxation time of the
target. Overstated pulse duration may result in a
more aggressive treatment than was intended by
the operator with concomitant side effects.
electrical discharge pulse shape, recorded as an
oscilloscope trace, entering the lamp versus
manufacturers’ claims, to determine whether
the discharge to the xenon lamp is constant
(‘square pulse’) or variable (‘free discharge’).
The input pulse energy pattern to the lamp is
pivotal in determining the efficiency of the
spectral output and determines output intensity.
the average spectral output of the IPL to
identify undesirable wavelengths, as there is
increased risk of retinal, corneal and epidermal
damage from IPL systems that deliver wavelengths below 500 nm. Accuracy and effectiveness of cut-off filters and the distribution of light
energy at different wavelengths could also
influence certain treatment outcomes.
the time-resolved spectral output of the IPL
across the entire pulse width to determine the
extent of spectral shift and confirm that the
optical output reflects the profile of the electrical discharge claimed by the manufacturer.
The time-resolved spectrum defines the effective pulse duration during which the desired
wavelengths are delivered in the optimum
intensity.
Materials and methods
The 18 devices and 36 applicators tested included
IPLs manufactured in the USA, UK, Israel, Sweden,
Switzerland and Italy (markings on IPL ‘F’ suggested that it was originally manufactured in China).
Measuring IPL parameters
All of the data were gathered over a 6-month
period by two of the authors. All measurements were
made on site in the IPL treatment rooms where the
equipment was in daily use between scheduled
patient appointments. Where available, the following
general information was recorded:
N
N
N
N
device identity (name, model, manufacturer,
serial number, manufacturing date withheld)
and coded for the study
maximum stated pulse energy and/or maximum
stated fluence
CE classification (e.g. medical device or not) /
labelling detailsa
number of shots claimed in the company literature, web site, user manual or system software.
The following parameters were measured on up to
18 devices and 36 applicators in common use in UK
clinics:
N
N
N
N
N
a
fluence (energy density) for a range of popular
programs and energy settings including maximum
fluence; this was compared with the claimed
maximum fluence
accurate pulse durations for different treatment
types / settings
electrical discharge across the xenon lamp (oscilloscope trace)
spectral output
dimensions of glass transmission block.
CE mark for medical devices – explanatory note
The CE mark is a visible declaration by the
manufacturer (or his representative, importer, etc)
that the equipment which is marked conforms to the
required regulatory standards for safety and environmental protection legislation under all of the
applicable European Union (EU) directives. The
letters ‘CE’ are initials for the French phrase
‘Conformité Européene’ (‘European Conformity’).
IPL devices are normally classified as Class IIa/b
electro-medical devices with medium risk. Medical
Class 3B and IV lasers must comply with the
Essential Requirements of the European Medical
Device Directive, which requires a device-specific
CE mark certificate from a Notified Body.
Manufacturers who register IPL devices under
this scheme issue a Declaration of Conformity to
standards, maintain a Quality Assurance monitoring
system under ISO9000 and are obliged to report any
accidents to the authorities. A medical CE mark can
be identified easily by the four-digit number next to
the official CE mark on the device identification
label, which denotes that the Notified Body that has
independently evaluated the device.
Medical authorities in several non-European
countries (including South Africa and Australia)
recognize the medical CE mark as a requirement for
electro-medical equipment.
Energy density measurement
IPL energy density (fluence) is the amount of light
energy delivered per unit area and is measured in
Joules per centimetre squared. For treatments
utilizing ‘selective photothermolysis’, the light energy
is absorbed by chromophores in the skin, such as
melanin and oxyhaemoglobin, and converted into heat
energy. As energy is absorbed the temperature of the
chromophore increases and tissue goes through
biological changes. The ideal fluence will raise the
temperature of the chromophore to a level that causes
damage to the target but does not lead to adverse side
effects such as burns or blisters. Even the most
restrictive IPL devices will at least allow the user some
control over energy density, which makes reproducible
measurement very important to ensure consistent
output and prevent under- or over-treatment.
An isopropyl alcohol wipe and an optical cloth
were used to thoroughly clean the IPL light guide
and head aperture of the energy meter (Ophir
LaserStar Power Energy Monitor, Ophir L40 (150)
A-DB-SH-NS Absorber Head: Ophir Optronics
Ltd, Jerusalem 91450, Israel). The slightest fragment of dirt or a thin layer of dried ultrasound gel
residue can make a significant difference to the
passage of light from the handset applicator to the
energy meter absorber head. Clear optical coupling
ultrasound gel (Henleys Medical, Hertfordshire AL7
1AN, UK) was applied to the top of the energy
meter IPL absorber unit glass without any air
bubbles in the gel (Figure 1A). A 2 mm thick white
poly-tetra-fluoro-ethylene (PTFE) plastic mask/
spacer with a 4.84 cm2 (2.262.2 cm) aperture was
used to prevent burning of the surface paint around
the energy absorber head and to fix the depth of gel
between the absorber glass lens surface and the
applicator glass coupling block (0.1 mm). The
applicator handset was placed in a horizontal
position above the absorber head using a laboratory
retort clamp and stand (Figure 1B). The applicator
handset glass transmission block was in direct
contact with the PTFE white spacer on the energy
meter absorber unit and perfectly flat and horizontal
on the absorber head glass aperture with no lateral
tilting. The angle of the handset applicator position
is critical as the slightest movement can result in an
8–10% difference in energy readings. As the whole
of the output from the transmission block usually
cannot be measured owing to the size limitation of
the absorber head aperture, the IPL glass transmission block was centred over the aperture to ensure
that maximum output energy was measured from
the centre of the lamp plasma phase (Figure 1C).
Firm downward pressure was applied to eliminate
air bubbles, which will impede light passage by light
scattering, in the gel between the glass block and the
energy meter absorber head (Figure 1D). Sufficient
time was left between each lamp discharge to again
prevent excess heat creating small bubbles in the
G. Town et al.
Figure 1. (A) Mask the absorber head with a white PTFE sheet with aperture exposed for energy collection; (B) fix the applicator in place
on the absorber head energy collection aperture using a laboratory retort clamp and stand; (C) take fluence measurements with the
applicator transmission block flat and central on the absorber head energy collection aperture; (D) apply firm downward pressure to
eliminate air bubbles and tighten clamp fixing.
ultrasound gel. An average of 10 shots was measured
and divided by the area of the head aperture to give
the energy density. Measurements were taken for the
most popular and the highest IPL settings.
For assurance of continuing reliability of the lamp
and filter it is useful if these measurements can be
repeated throughout the lamp’s lifetime. If output
drifts significantly from the results recorded with a
new lamp then procedures should be in place to
replace the lamp or treatment head. Detailed records
should also be kept so that consistency between new
lamps can be checked. The described method used
for energy density measurements was devised
following discussions with several leading UK
manufacturers (see acknowledgements) of IPL
devices and is therefore similar to the quality
assurance testing performed prior to despatching
new or refurbished applicators to IPL users.
The skin contact surface area of the quartz glass or
sapphire transmission block of each IPL was
measured in mm using a Vernier gauge in order to
calculate the energy density accurately.
Lamp discharge duration measurement
The measurement of lamp discharge duration (also
known as pulse width or pulse duration) is important
because, according to Anderson and Parrish (10),
the optimum pulse width should be close to the
thermal relaxation time. Previous studies have
confirmed this, proving that higher clearance rates
occur when the pulse duration is close to or higher
than the thermal relaxation time (23). However, if
pulse duration is too long the heat diffuses to
surrounding tissue, increasing the risk of adverse
side effects. Risk is also increased if the pulse
duration is short and the fluence high.
The duration of the discharged pulse or subpulses of intense white light was measured using a
reversed biased photodiode, acting as a lightdependant switch (Figure 2). The pulse duration
was captured as an oscilloscope image using a Fluke
196 Scopemeter and its counterpart FlukeView
version 4 software (Optimum Energy Products
Ltd., Calgary T2-Z4M3, Canada).
The pulse duration can differ considerably
between IPL systems from different manufacturers:
some use true single pulses but most utilize two or
more sub-pulses to extend pulse duration to allow
intra-pulse epidermal thermal relaxation and to help
extend flashlamp lifespan. Ideally, the pulse durations should be adjustable as various chromophores
have differing thermal relaxation times (TRT) and
Measuring IPL parameters
Figure 2. Test apparatus for pulse duration measurement using a
reversed biased photodiode acting as a light-dependent switch.
therefore the IPL should match such times to target
the correct chromophore.
Lamp discharge profile measurement
A constant current through the xenon flashlamp may
be critically important in the treatment of skin
conditions. The spectrum of a flashlamp whose
energy is supplied from a free discharge capacitor
will change as the current follows a standard
distribution curve (24).
The current discharge profile through the xenon
flashlamp, which should produce a balanced spectrum of light to achieve the desired photo-therapeutic effect, can be measured by two methods. The
current can be measured by inserting a 0.01V
resistor in series with the flashlamp inside the
applicator handpiece. The current flowing through
the electrodes is measured across the 0.01V resistor
using a digital oscilloscope and plotted against time
to give a graphical representation of the current
ionizing the xenon gas. Alternatively, the current
waveform can be measured by the induced current
through a hand-turned cable of thin enamelled
copper wire wound around the electrode wire and
a ferrite core. This method can be used when the
applicator can be opened easily by a technician but
cannot be physically altered in any way without the
manufacturer’s permission.
Spectral output measurement
The chromophores in the skin, which are important
for many IPL treatments, have individual absorption
spectra. This means that depending on the target
chromophore, certain wavelengths will be more
effective at treating certain conditions than others.
Therefore, each treatment will be best suited to a
particular wavelength range. The range used should
take into account the absorption spectra of all
chromophores because heating a non-target
chromophore can damage the skin. Knowing the
spectral output will also provide information on any
unwanted wavelengths, such as ultraviolet and
infrared radiation, which can present immediate
and long-term health risks.
The photo-spectrometer apparatus was arranged
to produce accurate results with minimal experimental error. The applicator of the IPL system was
used to direct the optical discharge energy into an
HR2000+ spectrometer (Ocean Optics, Dunedin,
FL 34698, USA) at a distance from the spectrometer
probe of approximately 150 cm to avoid saturation
of the apparatus. The spectrometer probe was held
with a retort clamp fixed to a laboratory stand to
ensure no movement of the probe. The spectral
output was saved digitally and presented in a
Microsoft Excel graph for later analysis.
Time-resolved spectral output measurement
It has been noted earlier that a free discharge
capacitor will exhibit changes in current, which will
in turn affect the emitted spectrum. We can test this
assumption with time-resolved spectral output measurements.
The time-resolved spectrum was produced using
an Ocean Optics HR2000+ spectrometer and its
counterpart Spectra Suite software. This software
has the capability of sampling the spectrum of light
with a minimum integration time of 1 ms. This test
is intended to demonstrate the stability and degree of
efficiency of spectral output for free discharge versus
square pulse systems in delivering their stored energy
to the chromophore targets within the patient’s skin.
Results and Discussion
General information
Example test measurements on 18 IPL devices
(including 36 applicators with different cut-off
filters) were made as described and data were
collected using the above methods. The data and
measurements were recorded and are summarized in
Tables I and II.
The authors gathered the general information
from the manufacturer’s user manual, web site and/
or current literature. In most cases, manufacturers
accurately quoted the size of the treatment area.
Only device ‘N2’ claimed the treatment area to be
15% larger and device ‘J’ claimed the treatment area
to be 5% larger than was measured by the authors
with a vernier mm scale.
Eight devices carried the medical CE mark and 10
had only the standard CE mark.
Example energy density measurement
Fluence results were plotted on graphs for the
example 18 devices against the systems’ displayed
fluence (or manufacturers’ claimed fluence in the
G. Town et al.
Table I. Information recorded from manufacturer’s specification in the user manual and measurements of spot size and range/maximum
fluence.
IPL study
ref.
A
A1
A2
B
B1
C
C1
D
D1
E
F
F1
G
G1
G2
H
H1
I
I1
I2
J
K
L
L1
M
M1
N
N1
N2
O
O1
O2
P
P1
Q
Q1
Cut-on
filter
Claimed
maximum
fluence (J/cm2)
600
600
555
450
450
535
610
650
540
530
560
690
420
530
600
560
695
645
695
755
600
600
650
585
610
530
400
430
400
560
695
515
590
640
540
650
21
22
8
22
22
25
25
20
20
20
50
37
30
17.6
18
45
45
35
35
28
23.1
50
34
34
45
51
10
7
10
32
32
32
38
38
20
20
Measured
maximum
Actual spot size Claimed shot
fluence (J/cm2) (cm2: mm6mm)
lifetime
20.8
24.5
9.2
11.1
13.0
14.5
No data
16.3
No data
20.4
22.2
12.4
19.6
13.5
16.7
44.4
51.0
41.8
No data
No data
21.1
50.0
39.7
38.4
34.6
No data
11.6
10.7
5.8
37.3
36
36
13.7
No data
20.2
14.9
user manual if not displayed on the IPL screen)
(Figures 3 and 4). By measuring devices in routine
daily use, measurements were effectively taken at
different stages in the manufacturers’ claimed
warranty lifetime of the applicator or lamp/filter
assembly, which allowed observation of the degree of
deterioration in fluence against claimed values.
Using this test method, 30 IPL applicators were
measured at maximum fluence, of which 11 were
more than 20% below and eight were more than
10% above the fluence levels given on the device
display or claimed in user manuals, even where
brand new lamps were tested. Altogether, nine IPL
devices out of 18 had applicators that were outside of
the standard for medical Class 4 lasers (w ¡20%).
The authors considered the accuracy of maximum
fluence values to be of greatest importance owing to
the risk of under- or over-treatment. However, if a
manufacturer performs a different fluence test
method than the method used in this study, then it
is likely that comparing our measured results to the
4.8
4.8
4.8
7.5
7.5
7.5
7.5
6.4
6.4
8.9
2.69
2.69
7.7
7.7
7.7
2.72
2.72
2.72
2.72
2.72
5.0
2.0
5.0
5.0
5.0
5.0
12.1
12.1
3.6
6.75
6.75
6.75
5.25
12.5
6.4
6.4
(48610)
(48610)
(48610)
(50615)
(50615)
(50615)
(50615)
(40616)
(40616)
(33627)
(3467.9)
(3467.9)
(52614.9)
(52614.9)
(52614.9)
(3468)
(3468)
(3468)
(3468)
(3468)
(50610)
(10620)
(50610)
(50610)
(50610)
(50610)
(55622)
(55622)
(33.6610.9)
(15645)
(15645)
(15645)
(35615)
(50625)
(40616)
(40616)
30 000
30 000
30 000
100 000
100 000
200 000
200 000
30 000
30 000
10 000
10 000
10 000
50 000
50 000
50 000
12 000
12 000
12 000
12 000
12 000
50 000
10 000
20 000
20 000
10 000
10 000
2500
2500
2500
300 000
300 000
300 000
12 000
12 000
30 000
30 000
CE class
Free or partial
(square)
discharge
Med CE
Med CE
Med CE
Non-Med
Non-Med
Non-Med
Non-Med
Non-Med
Non-Med
Med CE
Non-Med
Non-Med
Non-Med
Non-Med
Non-Med
Med CE
Med CE
Med CE
Med CE
Med CE
Non-Med
Non-Med
Med CE
Med CE
Med CE
Med CE
Non-Med
Non-Med
Non-Med
Med CE
Med CE
Med CE
Non-Med
Non-Med
Non-Med
Non-Med
Free
Free
Free
Free
Free
Free
Free
Free
Free
Partial
Free
Free
Partial
Partial
Partial
Free
Free
Free
Free
Free
Free
Free
Free
Free
Free
Free
Free
Free
Free
Free
Free
Free
Free
Free
Free
Free
stated values will show discrepancies. It is not
possible for us to definitely prove traceability to
national standards so no conclusion can be drawn on
the correct absolute fluence. The energy density
measurements are more valuable as consistency
checks prevent lamp output dropping below tolerance levels.
Example lamp discharge duration
Measured pulse and sub-pulse durations using a
reversed biased photodiode were recorded as an
oscilloscope trace to permit measurement of pulse
and sub-pulse durations and intra-pulse delay times
(Table II). This test also served to validate the
number of sub-pulses in a pulse train. Using this
method, there was generally a poor correlation
between manufacturers’ claims or system-displayed
values and the pulse durations measured. The data
measured for six of the eight medical CE-marked
IPLs were consistent with displayed values (where
given).
Measuring IPL parameters
Table II. User manual indicated pulse data and measured pulse durations showing an approximately 3% deviation from specification.
Study ref.
A
A1
B
C
D
E
F
G
H
I
J
K
L
M
N
O
P
Q
Cut-off filter
600
555
600
450
450
535
610
650
540
530
560
690
420
530
600
560
695
645
695
755
600
600
650
585
610
530
400
430
400
560
695
515
590
640
540
650
% deviation of cut-off
filter
% UV
(below 400 nm)
Stated pulse
duration (ms)
Measured pulse
duration (ms)
1.8%
8.5%
?%
8.4%
8.4%
31%
52%
13.4%
5.4%
2.1%
8.5%
45.1%
0.3%
0.1%
0%
1.6%
16.8%
4.6%
15.7%
21.8%
21.6%
19.6%
–
5.1%
17.1%
No data
2.1%
No data
0.3%
No data
2.5%
7.4%
3.4%
No data
No data
No data
No data
0.4%
0.5%
0%
1.5%
1.5%
1.6%
1.6%
2.2%
0.2%
0%
0.2%
0%
0%
0%
No data
0%
0%
0%
0%
0%
0.1%
0%
–
0%
0%
0.7%
No data
0.1%
3.6%
0.1%
0.2%
0.2%
1.4%
No data
No data
No data
No data
30 (3 sub-pulses)
14 (1)
262.5 ms515
5
5
5
5
50
10–15
10–50
20–150
20–151
10
20
20
5.5/5.5/5.5
–
short:5.5/5.5 (2)
med:3.6/3.6/3.6 (3)
long:3.6/3.6/3.6 (3)
40
34.8
123
15 black
15 blonde
3
5
35
35
10
40
–
–
Not given
Not given
30/40/50
30/40/50
18 (3 sub-pulses)
14.5 (1)
263 ms515.5
15–17
15–17
15–17
15–17
51
No data
10–51 ms
Missing pulses
Missing pulses
6
6.6
8.7
5.4/6.4/7.0
–
5.5/5.5 (2)
4.0/4.0/4.0 (3)
4.5/4.5/4.5 (3)
40
37
121
2.2
5
3
5
132
132
24
42
–
–
No data
No data
30/40/50
30/40/50
Only 14 of 31 pulse duration measurements were
within ¡20% of the manufacturers stated or systemdisplayed values.
IPLs ‘B’ and ‘C’ stated single-pulse durations of
5 ms, which were measured at 15–17 ms across all
programs and settings.
In one example IPL program for IPL ‘F’, one subpulse was found to be entirely missing which
correlated with the low fluence measured for that
program compared with others on the same device.
Such discrepancies are clearly unacceptable as they
may lead to selecting incorrect fluence values and
under- or over-treatment of the patient leading to
either ineffective treatment or unwanted side effects
(Figure 5).
Example lamp discharge profile
In manufacturers’ advertisements and marketing
materials, it has become fashionable to promote a
non-typical xenon lamp pulse shape (meaning the
pulse of electrical energy discharged across the lamp)
as ‘unique’ and ‘desirable’ and it is often described
using colourful artist’s illustrations rather than
shown as an actual oscilloscope trace. It was
apparent that almost all claims recorded in this
study made in manufacturers’ literature for a ‘square
pulse’ were not reflected in our example oscilloscope
measurements as the pulses were usually the typical
xenon (krypton) discharge slope (increasing/decreasing) of a free discharge system. Note: most of
the useful light output is generated during the
decay phase of the free discharge waveform
(Figure 6).
Only IPLs ‘E’ (Figure 7) and ‘G’ exhibited a true
single square pulse shape confirming that they used
partial discharge capacitor technology, although
close pulse-stacking in devices ‘A’ and ‘O’ effectively
achieved the same pulse shape and device ‘D’
showed a nearly square pulse shape. Only a
comparison of time-resolved spectral output will
demonstrate whether there is any spectral deterioration across the entire pulse duration when comparing these devices.
G. Town et al.
Figure 3. Example standardized energy density measurement showing IPL system ‘E’ whose energy output is well within the accepted
tolerance of ¡20% for Class 4 medical lasers (EN 60825).
Figure 4. Example standardized energy density measurement showing IPL system ‘F’ whose output energy is only ca. 25% of the stated
energy on the device screen display and which is well outside the accepted tolerance of ¡20% for Class 4 medical lasers (EN 60825).
Measuring IPL parameters
Figure 5. Example standardized lamp discharge duration measurements showing IPL system ‘F’ which is a triple pulse system with one
pulse missing; thus, one-third of the energy is lost. System display values: T1 3 ms, T2 20 ms, T3 4.5 ms, T4 30 ms, T5 4.5 ms (T3 4.5 ms
sub-pulse missing). It is assumed that this is due to an error when writing the system software or when calibrating the microprocessor
control system.
Figure 6. Example standardized lamp discharge profile measurement showing IPL system ‘B’ discharge profile of a free-discharge IPL
system.
Example spectral output
In this initial measurement study, spectral output
measurements included both an average value for
the complete pulse or pulse train and time-resolved
spectral measurements produced by the tested IPL
applicators. The spectrum graphs of the entire
output are useful as they give an indication of
accuracy of cut-off filter wavelengths and the
presence of unwanted ultraviolet or infrared wavelengths. Of the 30 applicators tested, seven IPLs
measured more than 1% and two measured more
than 2% of unwanted UV output below 400 nm
when cut-off filters were set significantly higher
(Table II, Figures 8, 9, 10).
G. Town et al.
Figure 7. Example standardized lamp discharge profile measurement showing IPL system ‘E’ discharge profile of a ‘square pulse’ constant
current discharge.
Figure 8. Example standardized spectral output measurement showing (left) IPL ‘F’ with applicators with cut-off filters at 560 nm and
690 nm demonstrating poor (shallow slope) cut-off profiles and inaccurate cut-off (620 nm red rather than 690 nm as stated in the
manufacturer’s user manual) and (right) IPL ‘I’ with cut-off filters at 645 nm, 695 nm and 755 nm showing good but inaccurate (steep
slope) cut-off profiles compared with manufacturer’s operators manual: intensity is irrelevant.
Measurements on 29 applicators showed 19
(65.5%) with cut-off filters that were inaccurate by
more than 20 nm versus the claimed cut-off value
given by the manufacturer. Only 10 applicators
(34.5%) were within 20 nm of the stated cut-off
(Figure 8).
As with the energy density measurements, the
intensity of the spectral output is not traceable to
national standards. This means that an accurate
determination of the retinal thermal hazard cannot
be made. Most monochromators suffer from stray
light, which effectively means light of a particular
wavelength could be recorded incorrectly at a
different wavelength. It is possible that this could
be the case with the HR2000+ spectrometer,
although the manufacturer claims a stray light level
of less than 0.1%. Therefore, assuming an accurate
wavelength calibration, it is possible from this
measurement procedure to identify the filter cut-off
wavelength and any unwanted radiation. Until
accurate traceability can be established, the main
value is in recording regular spectral output measurements that allow changes in the spectrum or
deterioration in the filter to be detected.
Recent studies report the theoretical consequential benefits resulting from a ‘square pulse’ profile
resulting in a constant spectral output across the
entire pulse or sub-pulse duration and leading to
greater treatment efficiency (25,26). In a freedischarge IPL, as the xenon lamp reaches its
maximum current density within approximately
200 ms, there is a shift in the spectral output shown
by output decay, particularly in the yellow/red region
of the spectrum compared with the blue/green.
Energy output at the atomic lines remains virtually
constant throughout the pulse. Therefore, much of
the discharged energy is wasted due to uneven
distribution of wavelengths. In a later comparative
Measuring IPL parameters
Figure 9. Example standardized spectral output measurement showing IPL ‘E’ with a sharp cut-off at 530 nm and typical xenon lamp
spectral profile: intensity is irrelevant.
study it is intended to show time-resolved spectral
output data for different devices to investigate the
‘square pulse’ partial discharge versus ‘free discharge’ argument and the potential impact on
clinical outcomes (Figures 9 and 10).
Conclusions
Measurement of IPL devices is becoming an
important issue but is still at a very early stage after
being neglected for years because of commercial
pressures and a lack of regulation. However, the
popularity of IPL as a treatment is growing and there
is now a definite need for measurement to help
improve both safety and efficacy.
The measurements in this paper will give technicians working with IPLs a useful tool for checking
output consistency and diagnosing performance
issues. Discrepancies can be seen between measured
parameters and manufacturer claims but caution
must be exercised with this comparison because the
techniques described in the paper are subject to ongoing development. In particular, traceability to
national standards is a pre-requisite to accurate
absolute, as opposed to relative, measurements. On
the other hand, comparing different devices is useful
as discrepancies highlight the need for legislation to
produce standard measurement procedures.
This study has determined easily reproducible test
methods for key parameters of IPL devices and
tested their validity on 18 example systems. As
mentioned, further work is required if measurement
results are to be made traceable to national
standards. It is also hoped that a homogeneity test
can be developed to provide objective measurable
values to ensure even distribution of energy across
skin contact areas.
Further research is required and a second trial is
now underway to evaluate and compare a larger
number of popularly available IPL devices in use in
the United Kingdom using the test methods
described in this paper.
Acknowledgements
The authors wish to thank the following companies
for their contribution in reviewing the fluence test
methodology used in this study: Cyden Ltd,
Swansea, Wales, UK (www.cyden.co.uk); Energist
Ltd, Swansea, Wales, UK (www.energist-international.com); Instinctive Technologies Ltd, Bedford,
UK (www.instinctiveuk.com); and Lynton Lasers
Ltd, Cheshire, UK (www.lynton.co.uk).
G. Town et al.
Figure 10. (Above) Schematic illustration of the difference in the spatial and temporal characteristics of a free discharge and partial
discharge pulse to an IPL xenon lamp and (below) time-resolved spectral measurements of example IPL devices: free discharge (IPL ‘C’)
and partial discharge (IPL ‘E’).
References
1. British Standards BS EN 60825-1: 1994 Safety of laser
products – Part 1: Equipment classification, requirements and
user’s guide; BS EN 60601-2-22: 1993.
2. International Electrotechnical Commission PD IEC TR
60825-14: 2004 Safety of laser products – Part 14: A user’s
guide.
3. Subchapter J, Radiological Health Code of Federal
Regulations. In: FDA CDRH (Center for Devices and
Radiological Health) Food & Drugs, Title 21, Volume 8,
Revised as of April 1, 2005. CITE: 21CFR1040.10 and
1040.11 (Performance standards for light-emitting products).
4. International Electrotechnical Commission IEC TR60825-9
1999, Part 9: Compilation of maximum permissible exposure
to incoherent optical radiation. 1st ed. Edition Geneva:
International Electrotechnical Commission; 1999–10.
5. Hode L. Are lasers more dangerous than IPL instruments?
Lasers Med Sci. 2003;18(suppl 1): Abstract no. 0189.
6. Clarkson DM. Hazards of non coherent light sources as
determined by the framework of IEC TR-60825-9. J Med
Eng Technol. 2004;28:125–31.
7. Care Standards Act 2000: The Private and Voluntary Health
Care (England) Regulations 2001:3(1)(b). Prescribed techniques or technology.
8. Clarkson DM. The role of measurement of pulse duration
and pulse profile for lasers and intense pulsed light sources. J
Med Eng Technol. 2004;28:132–6.
9. Clarkson DM. Determination of eye safety filter protection
factors associated with retinal thermal hazard and blue light
photochemical hazard for intense pulsed light sources. Phys
Med Biol. 2006;51:N59–64.
10. Anderson RR, Parrish JA. Selective photothermolysis: Precise
microsurgery by selective absorption of pulsed radiation.
Science. 1983;220:524–7.
11. Haedersdal M, Wulf HC. Evidence-based review of hair
removal using lasers and light sources. J Eur Acad Dermatol
Venerol. 2006;20:9–20.
12. Angermeier MC. Treatment of facial vascular lesions
with intense pulsed light. J Cutan Laser Ther. 1999;1:
95–100.
13. Raulin C, Schroeter CA, Weiss RA, Keiner M, Werner S.
Treatment of port-wine stains with a noncoherent pulsed light
source: A retrospective study. Arch Dermatol. 1999;135:
679–83.
14. Bjerring P, Christiansen K. Intense pulsed light source for
treatment of small melanocytic nevi and solar lentigines. J
Cutan Laser Ther. 2000;2:177–81.
15. Brazil J, Owens P. Long-term clinical results of IPL
photorejuvenation. J Cosmet Laser Ther. 2003;5:168–74.
16. Chan H. The use of lasers and intense pulsed light sources for
the treatment of acquired pigmentary lesions in Asians. J
Cosmet Laser Ther. 2003;5:198–200.
17. Weiss RA, Weiss MA, Beasley KL. Rejuvenation of photoaged skin: 5 years results with intense pulsed light of the face,
neck, and chest. Dermatol Surg. 2002;28:1115–19.
18. Gilbert DJ. Treatment of actinic keratoses with sequential
combination of 5-fluorouracil and photodynamic therapy. J
Drugs Dermatol. 2005;4:161–3.
19. Clark C, Bryden A, Dawe R, Moseley H, Ferguson J,
Ibbotson SH. Topical 5-aminolaevulinic acid photodynamic
therapy for cutaneous lesions: Outcome and comparison of
light sources. Photodermatol Photoimmunol Photomed.
2003;19:134–41.
Measuring IPL parameters
20. Dover JS, Bhatia AC, Stewart B, Arndt KA. Topical 5aminolevulinic acid combined with intense pulsed light in
the treatment of photoaging. Arch Dermatol. 2005;141:
1247–52.
21. Eells JT, Wong-Riley MTT, VerHoeve J, Henry M,
Buchman EV, Kane MP, et al. Mitochondrial signal
transduction in accelerated wound and retinal healing by
near-infrared light therapy. Mitochondrion. 2004;4:559–67.
22. Hawkins DH, Abrahamse H. The role of laser fluence in cell
viability, proliferation, and membrane integrity of wounded
human skin fibroblasts following helium-neon laser irradiation. Lasers Surg Med. 2006;38:74–83.
23. Cameron H, Ibbotson SH, Ferguson J, Dawe RS, Moseley H.
A randomised blinded controlled study of the clinical
relevance of matching pulse duration to thermal relaxation
time when treating facial telangiectasia. Lasers Med Sci.
2005;20:117–21.
24. Vaynberg B, Panfil S, Epshtein V. Spectrum controlled IPL.
Proc Photonic Therapeutics Diagnostics. 2005;SPIE
5686:119–25.
25. Clement M, Daniel G, Trelles M. Optimising the design of a
broad-band light source for the treatment of skin. J Cosmet
Laser Ther. 2005;7:177–89.
26. Clement M, Kiernan M, Ross Martin GD, Town G.
Preliminary clinical outcomes using iPulseTM intense flash
lamp technology and the relevance of constant spectral output
with large spot size on tissue. Australas J Cosmet Surg.
2006;2:54–9.