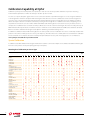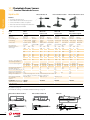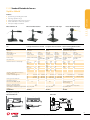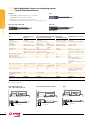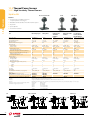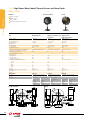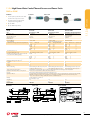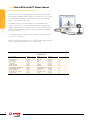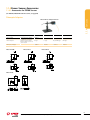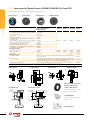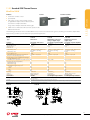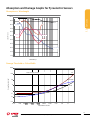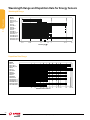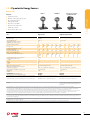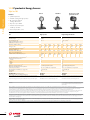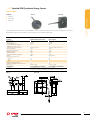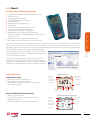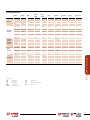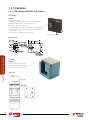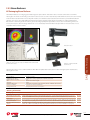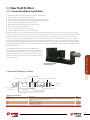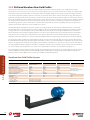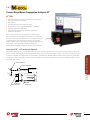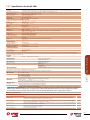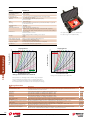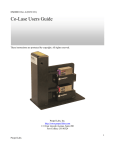
1
Laser Power & Energy Measurement Laser Beam Analysis 2013 Ophir®, now part of the Newport® Corporation Family of Brands Ophir Photonics Group For Every Laser Measurement United to Lead the Industry For over 35 years Ophir has met the challenge to consistently provide accurate and reliable laser power and energy measurement devices. Spiricon and Photon, during that time, have established themselves as the leader in beam profiling. Our first-class teams of scientists and engineers set the standard for innovation in the face of increasing demands for durability and precision. The Ophir Photonics group leads the industry in all aspects of laser beam measurement. Continual Improvement Improvements in material science continually extend the operational limits of our increasingly damage resistant laser measurement devices. This not only ensures our undisputed position at the forefront of laser measurement technology, but also confirms our commitment to you in providing the most accurate and durable products in the market. Constant attention to improved calibration methods further solidifies our leadership position in reliable and accurate instrumentation. As an ISO 9001:2008 company, we subject our products and systems to constant quality assurance monitoring. We are also proud to hold a number of patents for our creative products that clearly demonstrate our superior expertise in physics, electronics, optics, software and mechanics. Total Commitment Ophir - Spiricon - Photon products play an essential role in a variety of fields - medical, military industrial and research - where accuracy, reliability and robustness are vital prerequisites. We affirm our unswerving commitment to remain world leaders in the research and development of laser technology instrumentation, continually striving for improvement and innovation. Table of contents Page About Ophir Optronics Ophir Power and Energy Meters - Versatility for Every Application Calibration Capability at Ophir 3 5 6 1.1 Power Sensors 1.1.5.1 1.1.5.2 Power Sensors - Introduction Absorption and Damage Graphs for Thermal Sensors Photodiode Power Sensors Standard Photodiode Sensors 10pW-3W Round Photodiode Sensors 20pW-3W Special Photodiode Sensors and Integrating Spheres 50pW-3W and 20mLux-200kLux Thermal Power Sensors High Sensitivity Thermal Sensors 30µW - 12W Low Power Thermal Sensors 20mW-150W Low - Medium Power Thermal Sensors - Apertures 17mm - 35mm, 30mW-150W Medium Power Large Aperture Thermal Sensors - Apertures 50mm-65mm, 100mW-300W Medium - High Power Fan Cooled Thermal Sensors 50mW-500W High Power Water Cooled Thermal Sensors and Power Pucks 1W-10kW StarLink Direct to PC Power Sensors Power Sensor Accessories Accessories for PD300 Sensors Accessories for Thermal Sensors, PD300R, PD300-IRG, 3A-IS, FPS-1 High Power Water Cooled and Fan Cooled Laser Beam Dumps- up to 10kW OEM Thermal Sensors Thermal OEM Sensors - Introduction Standard OEM Thermal Sensors 20mW-300W Examples of Custom OEM Power Sensor Solutions 1.2 BeamTrack Power/Position/Size Sensors Introduction 1.2.1 1.2.2 1.2.3 1.2.4 BeamTrack Power/Position/Size Sensors 100µW-10W BeamTrack Power/Position/Size Sensors 40mW-150W BeamTrack Power/Position/Size Sensors 150mW-250W BeamTrack Power/Position/Size Sensors- Device Software Support 1.3 Energy Sensors Energy Sensors - Introduction Absorption and Damage Graphs for Pyroelectric Sensors Wavelength Range and Repetition Rate for Energy Sensors Photodiode Energy Sensors 10pJ- 20µJ Pyroelectric Energy Sensors 0.2µJ-10J High Energy Pyroelectric Sensors 20µJ-40J RP Sensors 100mW to 1500W StarLink Direct to PC Energy Sensors Energy Sensors Accessories Accessories for pyroelectric sensors Fast Photodetector Model FPS-1 OEM Energy Sensors Standart Pyroelectric OEM Sensors- Introduction Standart OEM Pyroelectric Energy Sensors 2µJ-10J Examples of Custom OEM Energy Sensor Solutions 1.1.1 1.1.1.1 1.1.1.2 1.1.1.3 1.1.2 1.1.2.1 1.1.2.2 1.1.2.3 1.1.2.4 1.1.2.5 1.1.2.6 1.1.3 1.1.4 1.1.4.1 1.1.4.2 1.1.4.3 1.1.5 1.3.1 1.3.2 1.3.3 1.3.4 1.3.5 1.3.6 1.3.6.1 1.3.6.2 1.3.7 1.3.7.1 1.3.7.2 2.0 Power Meters Power Meter Finder Power Meters and PC Interfaces 2.1 Power Meters 2.1.1 2.1.2 2.1.3 2.1.4 2.1.5 2.1.6 Vega Nova II LaserStar Nova StarLite Accessories PC Connectivity Options for Power/Energy Measurement 7 8 13 15 17 18 21 22 22 25 26 28 28 30 32 34 36 38 42 43 43 44 45 46 47 49 54 55 56 57 58 59 61 62 63 64 65 66 69 73 75 76 76 78 79 80 81 84 1.0 Sensors Laser Power and Energy Sensors Table of Contents Sensor Finder Program General Introduction 2.0 Power Meters Sensors 3.0 Beam Analysis 1.0 85 86 88 89 89 91 93 95 97 99 100 1 For latest updates please visit our website: www.ophiropt.com/photonics 01.08.2013 1.0 Sensors 2.2 PC Interfaces 2.2.1 2.2.2 2.2.3 Compact Juno USB Interface Pulsar Multichannel and Triggered USB Interfaces Quasar Wireless Bluetooth Interface Summary of Computer Options for Ophir Meters and Interfaces 2.3 Software Solutions 2.3.1 2.3.2 2.3.3 StarLab StarCom LabVIEW Solutions 2.4 OEM Power Meter Solutions 2.4.1 Examples of Custom OEM Power/Energy Meter Solutions 101 101 102 103 104 105 105 107 109 110 110 Laser Beam Analysis 111 3.0 Beam Analysis 2.0 Power Meters 3.0 3.1 Choosing a Beam Profiler 3.1.1 3.1.2 3.1.3 3.1.4 Four Basic Questions One More Question User Guide for Choosing the Optimum Beam Profiling System Benefits of Beam Profiling 3.2 Introduction to Camera-Based Profilers 3.2.1 3.2.1.1 3.2.1.2 3.2.1.3 3.2.1.4 3.2.2 3.2.3 3.2.3.1 3.2.3.2 3.2.3.2 3.2.3.4 3.2.3.4 3.2.4 3.2.4.1 BeamGage BeamGage - Standard BeamGage - Professional BeamGage - Enterprise Software Comparision Chart BeamMicTM- Basic Laser Beam Analyser System Cameras 190-1100nm USB Silicon CCD Cameras 190-1100nm Firewire Silicon CCD Cameras 190-1100nm Gig-E Silicon CCD Cameras 3.3 Introduction to Scanning-Slit Profilers 3.3.1 NanoScanTM 3.4 Accessories for Beam Profiling 3.4.1 3.4.2 3.4.3 3.4.4 3.4.5 3.4.6 3.4.7 Neutral Density Attenuators / Filters Beam Splitter + Neutral Density Filters Combo Beam Splitter Beam Expanders Microscope Objectives Beam Reducers CCTV lens for front imaging through glass or reflected surface Imaging UV lasers 3.5 Near Field Profilers 3.5.1 3.5.2 Camera Based Near-Field Profiler Slit-Based NanoScan Near-Field Profiler 3.6 What is M2? 3.6.1 3.6.1.1 3.6.1.2 3.6.2 M2-200s Camera Based Beam Propagation Analyzer: M2 Specifications for the M2-200s Model 1780 Slit-Based Beam Propagation Analyzer M2 3.7 Integrated Laser Performance Measurements 3.7.1 Beam Cube 3.8 High-Power Applications 3.8.1 3.8.2 3.8.3 3.8.4 3.8.5 3.8.5.1 High-Power NanoScan High Power - Laser Profiler Kits for Nd: YAG High Power - Laser Profiler Kits for CO2 High Power - ModeCheck - A New Method to Assure the Performance of High Power CO2 Lasers High Power - In-Line Industrial Beam Monitoring II-VI-CO2 Series 3.9 Goniometric Radiometers 112 112 113 114 116 117 118 118 126 126 127 135 140 140 142 143 144 147 148 155 157 158 168 168 172 175 177 179 180 181 183 183 184 186 187 189 190 192 195 195 199 199 201 202 203 205 205 206 Product Index Part Number Index Distributors list 211 220 222 1440-1605nm Phosphor Coated CCD Cameras For NIR Response 900-1700nm - InGaAs NIR Cameras 13-355nm and 1.06-3000µm - Pyroelectric Array Camera YAG Focal Spot Analyzer 2 01.08.2013 For latest updates please visit our website: www.ophiropt.com/photonics About Ophir Optronics Ophir Optronics, a Newport corporation brand was founded in 1976, as an optical coating company that has grown and diversified into other areas. Ophir employs a highly-qualified staff of over 570 engineers, technicians and skilled workers. Our company products are sold worldwide through a distribution network that includes four fully certified calibration facilities and repair centers. The majority of Ophir’s laser measuring instrumentation line is exported and marketed by sales representatives in more than 35 countries around the world, the largest markets being the USA, Europe and Japan. About Newport Newport® was established 45 years ago to create and manufacture solutions to support a newly formed laser industry and quickly became the leader in vibration control, motion control and photonic tools. Our passion is photonics, our vision is to continually advance the industry by integrating leading expertise and photonics tools to create the solutions that will enable research and manufacturing to advance and create new possibilities in the markets we serve. To empower this advancement Newport has become home to a comprehensive family of leading brands including: New Focus™ with 20 years of leadership in developing, manufacturing and delivering innovative, high-performance, quality, and easy-to-use photonics. Oriel® Instruments, for 40 years, has been a pioneer in solutions for making and measuring light. Richardson Gratings™, for over 60 years, has been the gratings leader; delivering custom gratings and the largest breadth of off-the-shelf gratings. Spectra-Physics®, established 50 years ago, was a catalyst to a new industry as the first commercial laser company and today continues to lead laser innovation. And our newest addition, Ophir® founded in 1976, is a global leader in precision IR optics, laser measurement instrumentation and 3D non-contact measurement equipment. Our Facilities Sited in an impressive 10,400 sq.m. (112,500 sq.ft.) building in Jerusalem, Israel, Ophir’s main manufacturing and R&D facility is fully equipped for both the production and testing of laser measuring instrumentation, optical components and coatings. In addition, Ophir’s modern facilities have in-house capability for diamond turning, aspheric optics and electronic equipment assembly. Our laser beam profiling activities are now centered at the Spiricon facility in Logan Utah and Photon.Inc facility in San Jose California, USA with complete design, manufacturing, testing and service facilities. Ophir’s wide-ranging activities include: ֺֺ Production of the most complete variety of laser measurement instrumentation in existence, both off-the shelf and OEM. Production of very high precision infrared and visible optical components: lenses, mirrors, metallic optics (spherical, aspherical and diffractive), windows, domes and prisms, suitable for military (FLIR) and industrial (CO2) applications. Ophir, a qualified manufacturer for some of the world's leading suppliers of night vision equipment, is renowned for having developed some of the highest performing and most costeffective optical systems in the world. ֺֺ ֺֺ Design and production of optical assemblies. Thin film optical coatings. Non-contact optical equipment for distance measurement and three-dimensional mapping of objects developed by Optimet, a company in which Ophir has a majority share. These devices are based on patented technology called Conoscopic Holography. Application include dentistry microelectronics, robotics, quality control and mechanical shops. Laser Development The history of laser development has been characterized by ever-increasing laser powers and energies and increasingly concentrated laser beams. Medical, industrial and scientific applications of these high power and energy density lasers require reliable and accurate measurement of power and energy. Meters for relatively high powers and energies generally operate by measuring the heat deposited onto an absorbing element. The key to accurate and reliable measurement is the makeup of this absorbing surface. It must stand up to repeated use without degradation or change in calibration. Laser sources are constantly growing in power, energy and beam concentration. Ophir has an ongoing program of development of durable absorbing surfaces that will continue to stand up to the most punishing laser sources as they grow in intensity and Ophir has some of the highest damage threshold absorbers in the industry. Ophir - Spiricon - Photon brings the same leading edge innovation to laser beam profile measurement with its famous Pyrocam, its in house designed SP and Nanoscan cameras and BeamGage software. Ophir’s Laser Measurement Group products are used in three highly competitive and sophisticated fields: medical, industrial and research. Each of these areas is further divided into end users and OEMs. Medical Ophir is the largest producer of laser power and energy measurement equipment for the medical market, where Ophir's power measurement devices are incorporated into laserbased instrumentation. Our products are vital to medical laser manufacturers and to the hospitals and doctors who are end-user laser purchasers. Medical lasers cover the entire spectrum of wavelengths from the 193 nm excimer laser to the 10.6 micron CO2 laser where the main laser wavelengths are 193, 248, 532, 694, 755, 1064, 2100, 2940 and 10600 nm. These lasers are used for general surgery, eye surgery, gynecology, ORL, dermatology and other applications. They have 3 For latest updates please visit our website: www.ophiropt.com/photonics 01.08.2013 outputs which start at mW and mJ on the low end going up to tens of joules and hundreds of watts at the high end. The trend in medical lasers is to progress to more powerful systems, especially in the dermatology field, and to introduce diode lasers and intense pulsed light (IPL) sources instead of the traditional gas or solid state lasers. Ophir has developed special equipment that can for the first time measure the output of IPL sources. Regulating bodies such as the FDA in the USA require the manufacturers to have at least one channel of power or energy monitoring in each laser. Ophir’s high-quality OEM products provide an extraordinarily efficient answer to this requirement. Industrial Industrial laser customers include both laser manufacturers and laser users in job shops and factories. Ophir answers the needs of this market by providing measurement systems that have a high damage threshold and the ability to measure high repetition rates with high accuracy. There are two main types of laser for industrial and material processing applications: the CO2 laser at 10.6 microns and the Nd YAG laser at 1.064 micron. These lasers are used for cutting, welding, trimming, marking and other functions on many types of material such as metal, wood, plastic, etc. They are characterized by their high power output, which ranges from 100W to 30kW, depending on the application. With its capabilities in power, energy and profile measurement, Ophir has developed many products for this market including an integrated Laser Beam Analyzer for industrial YAG lasers which measures beam profile, temporal profile, power and energy, all in one unit. A subset of the industrial market is the microelectronics industry, which uses excimer lasers for exposing the photoresist in the photolithography process. This process uses lasers with a short wavelength of 193 to 345 nm that operate at high repetition rate and high energy. The main factor influencing the component density possible on the microchip is the wavelength of the laser already used in the process, and therefore the trend is to progress to shorter wavelengths. Ophir has a range of unique products specified for the photolithography market, including off-the-shelf and OEM products. RoHS Almost all Ophir and Spiricon Laser measurement products are now RoHS compliant. The few products that are not RoHS are specified as such in the ordering information. 4 01.08.2013 For latest updates please visit our website: www.ophiropt.com/photonics Ophir Power and Energy Meters – Versatility for Every Application Ophir sensor, power meter and computer interface system means that virtually any sensor can work “plug and play” with any power meter or computer interface. Ophir has the widest range of sensors on the market with the highest performance so almost any measurement need can be accommodated. The measurement results can also be used in many ways - on the power meter screen, stored on board, sent to PC with results presented in many ways and on several platforms. Thermal Sensors Powers mW to kW and single shot energy Pyroelectric Sensors Energies pJ to Joules Rep rates to 25kHz Photodiode Sensors Powers pW to Watts Computer Interfaces with USB / Bluetooth USB Interface basic Quasar wireless Power Meters with USB/RS232 Pulsar channels 4 ,2 ,1 Vega color Juno compact Nova compact Nova ll general Laser Star 2 channel Software Solutions StarLab, LabVIEW, StarCom COM Object 5 For latest updates please visit our website: www.ophiropt.com/photonics 01.08.2013 Calibration Capability at Ophir Calibration is perhaps the most important of our products. In order to insure the best possible calibration of your laser measuring instrumentation, Ophir takes a number of extra steps not taken by other vendors. As can be seen by the absorption graphs in the sensor section, laser absorbers vary with wavelength, so it is not enough to calibrate at 1 wavelength. If the variation in absorption with wavelength is small, then the sensors are calibrated at several laser wavelengths and each laser covers a range of wavelengths. If the absorption variation with wavelength is considerable, the sensor software is provided with an absorption correction curve that is activated by selecting the wavelength of use. In addition to the above, only Ophir goes one step further and checks the curve at a number of NIST and PTB traceable wavelengths and corrects it if necessary. To do this, we have a complete line of calibration lasers so that we can always calibrate at or near the customer’s wavelength. These lasers include powers up to 400W and both CW and pulsed lasers. In addition, we have a number of sensors calibrated at NIST and PTB used as calibration standards. Below is a list of the calibration wavelengths used at Ophir in calibrating our standard catalog sensors. In addition to calibration variation with wavelength, there are other possible sources of calibration error such as nonlinearity variation with position on the surface and for pyroelectric sensors, pulse frequency. All of these factors are carefully taken into consideration in calibration and accounted for. For a complete discussion and analysis of Ophir calibration accuracy and error budget, please see our website at: www.ophiropt.com/calibration-procedure/tutorial Special Calibration In addition to standard calibration wavelengths shown below customers can have their Ophir sensor calibrated at additional wavelengths for more accuracy. Please consult your Ophir agent for special requests. Wavelengths of Calibration per Sensor Type Pulsed/Continuous 193 248 254 355 365 436 532 577 633 694 755 808 820 905 980 1014 1064 1310 1550 1600 2100 2940 10600 Spectral P P C P C C P,C C C P C C P Photodiode sensors PD300 PD300-UV PD300-IR PD300-3W PD300-IRG 3A-IS Thermal sensors Standard Broadband<1500W Standard Broadband>=1500W LP1 type Comet 10K Comet 1K P type PF type PF with diffuser HE type HE with diffuser EX type SV type Pyroelectric sensors PD10-C, PD10-pJ-C PD10-IR-pJ-C PE9-C PE10-C BF type BF with diffuser Metallic (standard) PE50-DIF-ER-C PE50-DIF-C PE100BF-DIF-C 6 01.08.2013 For latest updates please visit our website: www.ophiropt.com/photonics C C P,C C P,C C P P C curve Sensors 7 For latest updates please visit our website: www.ophiropt.com/photonics 01.08.2013 Sensors Table of Contents Power sensors Photodiode Power Sensors 1.0 Sensors Standard photodiode sensors - 10pW - 3W Sensor PD300 PD300-1W PD300-3W PD300-TP PD300-UV PD300-IR PD300-IRG Features Automatic background subtraction Automatic background subtraction High power Very thin profile (4mm only) Wide spectral range and low noise Infrared Very low noise 300 femto watts Aperture 10x10mm 10x10mm 10x10mm 10x10mm 10x10mm Ø5mm Ø5mm (max) Spectral Range 350-1100nm 350-1100nm 350-1100nm 350-1100nm 200-1100nm 700-1800nm 800-1700nm Power Range 500pW-300mW 500pW-1W 5nW-3W 50pW-1W 20pW-300mW 5nW-300mW 10pW-150mW Page 22 22 22 22 23 23 23 Aperture Ø10mm Ø10mm Ø10mm Ø5mm Spectral Range 350-1100nm 350-1100nm 200-1100nm 700-1800nm Power Range 500pW-300mW 5nW-3W 20pW-300mW 5nW-300mW Page 25 25 25 25 Round photodiode sensors - 20pW - 3W Sensor PD300R PD300R-3W PD300R-UV PD300R-IR Features Same as PD300, circular for easy centering Same as PD300-3W, circular geometry Same as PD300-UV, circular geometry Same as PD300-IR, circular geometry Special photodiode sensors and integrating spheres - 50pW - 3W and 20mLux - 200kLux Sensor Features Special photodiode sensors PD300-BB Flat spectral response from 430 to 1000nm PD300-BB-50mW For broadband light sources to 50mW PD300-CIE Measurement in units of Lux or foot candles BC20 Meter for scanned beams at up to 30,000 inch/s Special sensors - integrating spheres 3A-IS Integrating sphere for divergent beams to 3W 3A-IS-IRG Integrating sphere for divergent beams to 3W for near IR Aperture Spectral Range Power Range Page 10x10mm 10x10mm 2.4x2.8mm 10x10mm 430-1000nm 430-1100nm 400-700nm 633, 650, 675nm 50pW-4mW 50pW-50mW 20mLux-200kLux 100μW-20mW 26 26 26 26 Ø12mm Ø12mm 420-1100nm 800-1700nm 1μW-3W 1μW-3W 27 27 Thermal Power Sensors High sensitivity thermal sensors - 30µW - 12W Sensor 3A 3A-P 3A-P-THz 3A-FS 3A-P-FS-12 12A 12A-P Features Very low powers Low powers and energies 3A-P sensor calibrated for Terahertz wavelengths Lowest powers, Fused Silica window For divergent beams, window blocks infrared Wide dynamic range to 12W Short pulse lasers to 12W Aperture Ø9.5mm Ø12mm Ø12mm Ø9.5mm Ø12mm Ø16mm Ø16mm Spectral Range 0.19-20μm 0.15-8μm 0.3-10THz 0.19-20μm 0.22 - 2.1μm 0.19-20μm 0.15-8μm Power Range 60μW-3W 60μW-3W 50μW-3W 30μW-3W 60µW - 3W 2mW-12W 2mW-12W Energy Range 20μJ-2J 20μJ-2J 20μJ-2J 15μJ-2J 20µJ-2J 1mJ-30J 1mJ-30J Page 28 28 28 28 28 29 29 Aperture Ø16mm Ø17.5mm Ø26mm Ø26mm Ø16mm Ø17mm Ø17.5mm Ø17.5mm Ø17.5mm Spectral Range 0.19-20μm 0.19-20μm 0.15-20μm 0.19-20μm 0.15-8μm 0.15-8μm 0.24 - 2.2μm 0.24 - 2.2μm 0.532, 1.064μm Power Range 20mW-10W 20mW-30W 80mW-30W 40mW-150W 40mW-10W 60mW-30W 140mW-50W 140mW-50W 60mW-30W Energy Range 6mJ-2J 6mJ-30J 20mJ-60J 20mJ-100J 10mJ-10J 40mJ-30J 60mJ-200J 60mJ-200J 30mJ-200J Page 30 30 30 30 31 31 31 31 31 Power Range 30mW-150W 30mW-150W 100mW-150W Energy Range 20mJ-100J 20mJ-300J 40mJ-300J Page 32 32 32 Low power thermal sensors - 20mW - 50W Sensor 10A 30A-BB-18 L30A-10MM 50(150)A-BB-26 10A-P 30A-P-17 50A-PF-DIF-18 15(50)A-PF-DIF-18 30A-N-18 Features General purpose to 10W General purpose to 30W Thin Profile to 30W General purpose to 50W, 150W intermittent Pulsed lasers up to 10W Short pulse lasers to 30W High energy density pulsed beams As above, compact for intermittent use High power density pulsed YAG Low-medium power thermal sensors - apertures 17mm to 35mm, 30mW - 150W Sensor 30(150)A-BB-18 30(150)A-LP1-18 L50(150)A-BB-35 Features CW to 30W, intermittent to 150W As above, high damage threshold for long pulses and CW CW to 50W, intermittent to 150W Aperture Ø17.5mm Ø17.5mm Ø35mm Spectral Range 0.19-20μm 0.25-2.2μm 0.19-20μm 8 01.08.2013 For latest updates please visit our website: www.ophiropt.com/photonics Aperture Ø35mm Spectral Range 0.25-2.2μm Power Range 100mW-150W Energy Range 40mJ-300J Page 32 Ø35mm Ø17mm 0.15-20μm 0.19-12μm 100mW-150W 100mW-150W 50mJ-300J 50mJ-300J 32 33 Ø17mm 60mJ-200J 33 30(150)A-HE-DIF-17 For highly concentrated Q switched pulses to 30W, intermittent to 150W Ø17mm 0.19-0.625μm, 50mW-150W 1.064μm, 2.1μm, 2.94μm 0.19-3μm except for 50mW-150W 625-900nm 60mJ-200J 33 1.0 Sensors Sensor Features L50(150)A-LP1-35 CW to 50W, intermittent to 150W high damage threshold for long pulses L50(150)A-PF-35 CW to 50W, intermittent to 150W for short pulse lasers 30(150)A-SV-17 Very high damage threshold, 30W continuous 150W intermittent 30(150)A-HE-17 High energy and average power YAGs and harmonics 30W continuous 150W intermittent Medium power thermal sensors - apertures 50 to 65mm, 100mW - 300W Sensor L40(150)A L40(150)A-LP1 L40(150)A-EX L50(150)A L50(300)A L50(300)A-LP1 L50(300)A-PF-65 L50(300)A-IPL Features CW to 35W, intermittent to 150W, large aperture As above, high damage threshold for long pulses As above for excimer lasers CW to 50W, intermittent to 150W CW to 50W, intermittent to 300W, very large aperture As above, high damage threshold for CW and long pulses CW to 50W, intermittent to 300W, large beam short pulses For gel coupled IPL sources Aperture Ø50mm Ø50mm Ø50mm Ø50mm Ø65mm Ø65mm Ø65mm Ø65mm Spectral Range 0.19-20μm 0.25-2.2μm, 2.94μm 0.15-0.7μm, 10.6μm 0.19-20μm 0.19-20μm 0.25-2.2μm 0.15-20μm 0.5-1.1μm Power Range 100mW-150W 100mW-150W 100mW-150W 100mW-150W 400mW-300W 400mW-300W 400mW-300W 400mW-300W Energy Range 100mJ-200J 100mJ-300J 100mJ-200J 100mJ-300J 200mJ-300J 200mJ-300J 200mJ-300J 120mJ-300J Page 34 34 34 34 35 35 35 35 Aperture Ø17.5mm Ø33mm Ø26mm Ø35mm Ø35mm Ø33mm Spectral Range 0.24-2.2μm 0.24-2.2μm 0.19-20μm 0.19-20μm 0.25-2.2μm 0.4-3μm Power Range 50mW-100W 50mW-100W 50mW-150W 150mW-250W 150mW-250W 400mW-250W Energy Range 60mJ-200J 60mJ-200J 20mJ-100J 50mJ-300J 50mJ-300J 400mJ-600J Page 36 36 36 36 36 36 Ø50mm Ø50mm Ø50mm Ø65mm Ø65mm 0.19-20μm 0.19-20μm 0.4-1.5μm, 10.6μm 0.19-20μm 0.25-2.2μm 150mW-250W 300mW-400W 300mW-400W 500mW-500W 500mW-500W 80mJ-300J 75mJ-600J 75mJ -600J 100mJ-600J 100mJ-600J 37 37 37 37 37 Medium-high power fan cooled thermal sensors – 50mW – 500W Sensor F100A-PF-DIF-18 F100A-PF-DIF-33 F150A-BB-26 FL250A-BB-35 FL250A-LP1-35 FL250A-LP1-DIF-33 FL250A-BB-50 FL400A-BB-50 FL400A-LP-50 FL500A FL500A-LP1 Features High average power short pulse lasers As above aperture 33mm Fan cooled to 150W Fan cooled to 250W As above, high damage threshold for long pulses and CW Fan cooled to 250W with diffuser for high power and energy density Fan cooled to 250W, large aperture Fan cooled to 400W Fan cooled to 400W, high power densities and long pulses Fan cooled to 500W, very large aperture Fan cooled to 500W, high power densities and long pulses High power water cooled thermal sensors and power pucks - 1W – 10kW Sensor L250W L300W-LP 1000W 1000W-LP L1500W L1500W-LP 5000W 5000W-LP 10K-W Comet 1K Comet 10K Comet 10K-HD Features Thin profile, 20mm thick, water cooled to 250W Thin profile, 20mm thick, water cooled to 300W Water cooled to 1000W Water cooled to 1000W, high power densities and long pulses Water cooled to 1500W As above, high power densities and long pulses Water cooled to 5000W As above, high power densities and long pulses Water cooled to 10,000W, highest power densities Portable low-cost power probe for low powers Portable low-cost power probe for high powers Portable low-cost power probe with high damage threshold Aperture Ø50mm Ø50mm Ø34mm Ø34mm Ø50mm Ø50mm Ø50mm Ø50mm Ø45mm Ø50mm Ø100mm Ø55mm Spectral Range 0.19-20μm 0.4-1.5μm, 10.6μm 0.19-20μm 0.4-1.5μm, 10.6μm 0.19-20μm 0.4-1.5μm, 10.6μm 0.19-20μm 0.4-1.5μm, 10.6μm 0.8-2μm, 10.6μm 0.2-20μm 1.06μm and 10.6μm 1.06μm and 10.6μm Power Range 1W-250W 4W-300W 5W-1000W 5W-1000W 15W-1500W 15W-1500W 20W-5000W 20W-5000W 100W-10,000W 20W-1000W 200W-10,000W 200W-10,000W Energy Range 120mJ-200J 200mJ-300J 300mJ-300J 300mJ-300J 500mJ-200J 500mJ-200J N.A. N.A. N.A. N.A. N.A. N.A. Page 38 38 39 39 39 39 40 40 40 41 41 41 Features Photodiode general purpose to 300mW Very low powers to 3W Power & position, very low powers to 3W Low powers and energies Lowest powers to 3W, Fused Silica window General purpose to 10W Power, position & size to 10W General purpose to 30W Power, position & size to 50W, 150W intermittent Aperture 10x10mm Ø9.5mm Ø9.5mm Ø12mm Ø9.5mm Ø16mm Ø16mm Ø17.5mm Ø26mm Spectral Range 350-1100nm 0.19-20µm 0.19-20µm 0.15-8µm 0.19-20µm 0.19-20µm 0.19-20µm 0.19-20µm 0.19-20µm Power Range 500pW-300mW 60µW-3W 100µW-3W 60µW-3W 30µW-3W 20mW-10W 20mW-10W 20mW-30W 40mW-150W Energy Range N.A. 20µJ-2J 20µJ-2J 20µJ-2J 15µJ-2J 6mJ-2J 6mJ-2J 6mJ-30J 20mJ-100J Page 42 42 42 42 42 42 42 42 42 CW to 30W, intermittent to 150W Ø17.5mm 0.19-20µm 30mW-150W 20mJ-100J 42 CW to 50W, intermittent to 150W, large aperture Power, position & size to 250W, large aperture Ø50mm Ø50mm 0.19-20µm 0.19-20µm 100mW-150W 150mW-250W 100mJ-300J 80mJ-300J 42 42 Water cooled to 1000W Ø34mm 0.19-20µm 5W-1000W 300mJ-300J 42 StarLink Direct to PC Power Sensors Sensor PD300-StarLink 3A-StarLink 3A-QUAD-StarLink 3A-P-StarLink 3A-FS-StarLink 10A-StarLink 10A-PPS-StarLink 30A-BB-18-StarLink 50(150)A-BB26-PPS-StarLink 30(150)A-BB18-StarLink L50(150)A-StarLink FL250A-BB-50-PPSStarLink 1000W-StarLink 9 For latest updates please visit our website: www.ophiropt.com/photonics 01.08.2013 Power Sensor Accessories Accessories for PD300 sensors 1.0 Sensors Fiberoptic adapters Accessory PD300 F.O. adapters Accessories Accessory PD300-CDRH Description Adapters for mounting fibers to PD300 sensors (ST, FC, SMA, SC) Page 43 Description φ7mm aperture adapter for CDRH measurements Page 43 Accessories for thermal sensors Fiberoptic adapters Accessory Thermal F.O. adapters Description Adapters for mounting fibers to thermal sensors (ST, FC, SMA, SC) Page 44 Accessories for PD300R, PD300-IRG, 3A-IS and FPS-1 Fiberoptic adapters Accessory F.O. Adapters Description Adapters for mounting fibers to PD300R, PD300-IRG, 3A-IS and FPS-1 spectrum analyzer (ST, FC, SMA, SC) Page 44 General Accessories Accessories Accessory SH to BNC Adapter IR Phosphor Card Description Allows connection of sensor to voltage measuring device for measurement of raw voltage output. Glass slide (75x25mm) with phosphor coating (25x50mm) that visualizes spectral region 810-860nm, 900-1100nm and 1500-1600nm. Stands up to 1kW/cm² and 0.5J/cm². Self actuating, does not need charging from light source. Page 44 44 High power water cooled and fan cooled laser beam dumps Accessories Accessory BDFL500A-BB-50 BD5000W-BB-50 BD10K-W Description Fan cooled to 500W, general purpose high power beam dump Water cooled to 5000W, general purpose high power beam dump Water cooled to 10000W, general purpose high power beam dump Page 45 45 45 OEM Thermal Sensors Standard OEM thermal sensors - 20mW - 250W Sensor 20C-SH 20C-A 20C-UAU L30C-SH L30C-UA L30C-UAU 100C-SH 100C-UA 100C-UAU 150C-SH 150C-UA 150C-UAU 150W-UA 150W-UAU L150C-UA L150C-UAU L250W-UA L250W-UAU Features Compact smart sensor Compact, built-in amplifier (analog) Compact, external amplifier (USB connection) Medium aperture, smart sensor Medium aperture, built-in amplifier (RS232 connection) Medium aperture, built-in amplifier (USB connection) Low profile, smart sensor Low profile, separate amplifier (RS232 connection) Low profile, separate amplifier (USB connection) High power, smart sensor High power, built-in amplifier (RS232 connection) High power, built-in amplifier (USB connection) High power, built-in amplifier, water cooled (RS232 connection) High power, built-in amplifier, water cooled (USB connection) Large aperture, built-in amplifier (RS232 connection) Large aperture, built-in amplifier (USB connection) Large aperture, built-in amplifier, water cooled (RS232 connection) Large aperture, built-in amplifier, water cooled (USB connection) Aperture Ø12mm Ø12mm Ø12mm Ø26mm Ø26mm Ø26mm Ø18mm Ø18mm Ø18mm Ø18mm Ø18mm Ø18mm Ø18mm Spectral Range 0.19-20μm 0.19-20μm 0.19-20μm 0.19-20μm 0.19-20μm 0.19-20μm 0.19-20μm 0.19-20μm 0.19-20μm 0.19-20μm 0.19-20μm 0.19-20μm 0.19-20μm Power Range (a) 20mW-20W 200mW-20W 20mW-20W 80mW-50W 80mW-50W 80mW-50W 60mW-100W 60mW-100W 60mW-100W 60mW-60W 60mW-60W 60mW-60W 100mW-150W Size 38x38x14mm 38x38x34mm 38x38x14mm 60x60x38mm 60x60x38mm 60x60x38mm 48x48x14.5mm 48x48x14.5mm 48x48x14.5mm 50.8x50.8x33mm 50x50x38mm 50x50x38mm 50x50x38mm Page 49 49 49 50 50 50 51 51 51 52 52 52 52 Ø18mm 0.19-20μm 100mW-150W 50x50x38mm 52 Ø50mm Ø50mm Ø50mm 0.19-20μm 0.19-20μm 0.19-20μm 0.2W-150W 0.2W-150W 0.3W-250W 80x80x45mm 80x80x45mm 80x80x58mm 53 53 53 Ø50mm 0.19-20μm 0.3W-250W 80x80x58mm 53 10 01.08.2013 For latest updates please visit our website: www.ophiropt.com/photonics Standard OEM thermal sensors - 0.5W - 300W Features Aperture Spectral Range Power Range (a) Size Large aperture, built-in amplifier, water cooled Ø50mm 0.19-20μm 0.5W-300W 80x80x58mm (RS232 connection) Large aperture, built-in amplifier, water cooled Ø50mm 0.19-20μm 0.5W-300W 80x80x58mm (USB connection) Ophir offers many other OEM sensors. For your OEM solution please fill the questionnaire on our website: www.ophiropt.com/photonics or contact us: USA: [email protected] Other: [email protected] [email protected] L300W-UAU Other Sensors Page 53 53 54 1.0 Sensors Sensor L300W-UA Note: (a) Effective Dynamic Range for a given sensor is ~ 30:1 BeamTrack – Power / Position / Size Sensors Sensor 3A-QUAD 3A-P-QUAD 10-PPS 50(150)A-BB-26-PPS F150A-BB-26-PPS FL250A-BB-50-PPS Features Power & position, very low powers up to 3W As above for short pulse lasers Power, position & size to 10W Power, position & size to 50W, 150W intermittent Power, position & size to 150W Power, position & size to 250W, large aperture Aperture Ø9.5mm Ø12mm Ø16mm Ø26mm Ø26mm Ø50mm Spectral Range 0.19-20μm 0.15-8μm 0.19-20μm 0.19-20μm 0.19-20μm 0.19-20μm Power Range 100µW-3W 160µW-3W 20mW-10W 40mW-150W 50mW-150W 150mW-250W Energy Range 20µJ-2J 30µJ-2J 6µJ-2J 20mJ-100J 20mJ-100J 80mJ-300J Page 56 56 56 57 57 58 Energy sensors Photodiode and Pyroelectric Energy Sensors Photodiode energy sensors - 10pJ - 20μJ Sensor PD10-C PD10-pJ-C PD10-IR-pJ-C Features Very low energies down to nJ, Silicon photodiode Lowest energies down to pJ, Silicon photodiode Lowest energies down to pJ, Germanium photodiode Aperture Φ10mm Φ10mm Φ5mm Spectral Range 0.19-1.1μm 0.2-1.1μm 0.7-1.8μm Energy Range 1nJ-20μJ 10pJ-200nJ 30pJ-20nJ Maximum Frequency 20,000Hz 20,000Hz 10,000Hz Page 65 65 65 Aperture Φ8mm Ø12mm Ø12mm Ø24mm Ø24mm Ø46mm Ø46mm Spectral Range 0.15-12μm 0.15-12μm 0.15-3μm, 10.6μm 0.15-3μm 0.15-3μm, 10.6μm 0.15-3μm 0.15-3μm, 10.6μm Energy Range 0.2μJ-1mJ 1μJ-10mJ 7μJ-10mJ 8μJ-10J 60μJ-10J 10μJ-10J 120μJ-10J Maximum Frequency 25,0000Hz 25,000Hz 250Hz 10,000Hz 250Hz 10,000Hz 250Hz Page 66 66 66 67 67 68 68 Aperture Ø35mm Spectral Range 0.19-3μm Energy Range 20μJ-10J Maximum Frequency Page 10,000Hz 69 Ø20mm 0.19-2.2μm 100μJ-10J 250Hz 69 Ø35mm 0.19-2.2μm, 2.94μm 200μJ-10J 250Hz 70 Φ35mm 0.19-2.2μm, 200μJ-10J 2.94μm 0.19-20μm, 0.4100μJ-40J 2.5μm with diffuser 250Hz 70 40Hz 70 0.19-3μm, 0.4-3μm 10μJ-30J with diffuser 10,000Hz 72 0.15-3μm, 0.4400μJ-40J 2.5μm with diffuser 200Hz 72 Spectral Range 0.19-6μm 0.6-1.1μm Maximum Frequency Page 15,000Hz 73 15,000Hz 73 Pyroelectric energy sensors - 0.2μJ - 10J Sensor PE9-C PE10-C PE10BF-C PE25-C PE25BF-C PE50-C PE50BF-C Features Pyroelectric for very low energies Pyroelectric for low energies As above, high damage threshold Medium aperture pyroelectric As above, high damage threshold Large aperture pyroelectric As above, high damage threshold High energy pyroelectric sensors - 10μJ - 40J Sensor PE50-DIF-C PE25BF-DIF-C PE50BF-DIF-C PE50BF-DIFH-C PE50BB-DIF-C Features Pyroelectric with diffuser, high repetition rate. Complete calibration curve Pyroelectric with diffuser for high damage threshold. Complete calibration curve Pyroelectric with diffuser for highest damage threshold. Complete calibration curve Similar to PE50BF-DIF-C but with higher damage threshold Pyroelectric with removable diffuser. Wide spectral range w/o diffuser PE50-DIF-ER-C Pyroelectric with removable diffuser. Especially for Erbium laser PE100BF-DIF-C Largest aperture pyroelectric with removable diffuser Φ46mm Φ33mm with diffuser Φ46mm Φ33mm with diffuser Φ96mm Φ85mm with diffuser RP sensors - 200mW - 1500W Sensor Features FL250A-RP Long pulse lasers to 250W L1500W-LP1-RP High power pulsed lasers Aperture Ø50mm Ø50mm Power Range 200mW-250W 10W-1500W 11 For latest updates please visit our website: www.ophiropt.com/photonics 01.08.2013 StarLink Direct to PC Energy Sensors 1.0 Sensors Sensor PE10-C-StarLink PE25-C-StarLink PE25BF-C-StarLink PE50-C-StarLink PE50BF-C-StarLink PE50-DIF-CStarLink PE50BF-DIF-CStarLink Features Pyroelectric for low energies Medium aperture pyroelectric As above, high damage threshold Large aperture pyroelectric As above, high damage threshold Pyroelectric with diffuser, high repetition rate. Complete calibration curve Pyroelectric with diffuser for highest damage threshold. Complete calibration curve Aperture Ø12mm Ø24mm Ø24mm Ø46mm Ø46mm Ø35mm Spectral Range 0.15-12μm 0.15-3μm 0.15-3μm, 10.6μm 0.15-3μm 0.15-3μm, 10.6μm 0.19-3µm Energy Range 1μJ-10mJ 8μJ-10J 60μJ-10J 10μJ-10J 120μJ-10J 20μJ-10J Maximum Frequency 25,000Hz 10,000Hz 250Hz 10,000Hz 250Hz 10,000Hz Page 75 75 75 75 75 75 Ø35mm 0.19-2.2µm, 2.94µm 200μJ-10J 250Hz 75 Energy Sensor Accessories Accessories for pyroelectric sensors Fiberoptic adapters Accessory Pyroelectric F.O. Adapters Accessories Accessory Removable Heat Sink Scope Adapter Beam Splitter Assembly Shock Absorbing Mounting Post Nova PE-C Adapter Damage Threshold Test Plates PE-C to PE Size Adapter IR Phosphor Card Description Adapters for mounting fibers to pyroelectric sensors (ST, FC, SMA, SC) Page 76 Description Heat sink that is fastened to rear of PE-C sensors. Allows average power ~50-70% higher than without heat sink Page 76 Plugs in between the PE sensor and power meter. Provides BNC output to scope to see every pulse up to the maximum 76 frequency of the sensor. Beam Splitter Assembly to measure pulsed laser sources too energetic for direct measurement. Use with the Beam 76 Splitter can be calibrated by setting the laser to a lower energy that will not damage the sensor and swiveling between position A and B and then taking the ratio of A and B Mounting post same size as standard but with rubber shock absorber to insulate PE sensor from vibrations 77 77 The adapter plugs between the Nova D15 socket and the smart plug of the PE-C sensor to allow the Nova to operate with PE-C series sensors. See PE-C spec sheet for details. Test plates with same absorber coating as the sensor. For testing that laser beam is not above damage threshold (1 such plate is included with sensor package). There are test plates of the following types: Metallic and BF. The newer PE-C series sensors have a φ62mm diameter. The older PE series sensors have a φ85mm diameter. This 77 adapter allows using the PE-C type sensors in jigs and setups that were originally designed for PE sensors. Glass slide (75x25mm) with phosphor coating (25x50mm) that visualizes spectral region 810-860nm, 900-1100nm and 77 1500-1600nm. Stands up to 1KW/cm² and 0.5J/cm². Self actuating, does not need charging from light source. Fast photodetector model FPS-1 Accessory Description FPS-1 Fast Photodetector Connect to oscilloscope to measure temporal beam profile. 1.5ns response time. Page 78 OEM Energy Sensors Standard OEM pyroelectric energy sensors - 2μJ - 10J Sensor Features Aperture PE10-S PE10-S-Q PE25-S PE25BB-S PE25BB-S-DIF Slim profile, sensitive, no amplifier Very compact, no amplifier Slim profile, med. aperture, no amplifier As above, broadband coating As above, with diffuser for high damage threshold Compact, high power, built-in electronics PE25-A-DIFXXX-YYY (a) PE50-S PE50BB-S Other Sensors Energy Range 2μJ-20mJ 2μJ-20mJ 0.1mJ-10J 1mJ-10J 3mJ-10J Max. Ave. Power 2W 2W 10W 10W 30W Max. Freq. Size Page Ø12mm Ø8mm 24x24mm 24x24mm Ø20mm Spectral Range 0.19-3μm 0.19-3μm 0.19-3μm 0.19-20μm 0.4-3μm 400Hz 100Hz 40Hz 20Hz 20Hz Ø50.8x14mm 30x40x14mm Ø50.8x14mm Ø50.8x14mm Ø50.8x18mm 81 81 82 82 82 Ø24mm 0.4-3μm 0.1mJ-10J 50W 1000Hz Ø50.8x28mm 82 Slim profile, large aperture, no amplifier Ø46mm 0.19-3μm 1mJ-10J 20W 10Hz As above, broadband coating Ø46mm 0.19-20μm 10mJ-10J 15W 10Hz Ophir offers many other OEM sensors. For your OEM solution please fill the questionnaire on our website: www.ophiropt.com/photonics or contact us: USA: [email protected] Other: [email protected] [email protected] Note: (a) XXX denotes the calibration wavelength in μm and the YYY denotes the calibrated sensitivity in V/J. 12 01.08.2013 For latest updates please visit our website: www.ophiropt.com/photonics Ø75x14mm Ø75x14mm 83 83 84 Sensor Finder Program 1.0 Sensors Finding the proper sensor(s) to meet your measurement needs has never been easier. With our sensor finder program just enter your laser parameters and the proper measuring sensors for your application will be displayed on the screen. The program calculates the power and energy density capabilities of each absorber, based on the laser wavelength, pulse length, repetition rate and other relevant parameters. It also compares all the other requirements such as maximum and minimum power, energy, beam size, etc. In addition to finding the right sensor for your application, the Sensor Finder Program offers the following features: ֺֺ ֺֺ Report printing. How close the recommended sensors are to the specified damage threshold. Order of Selection The sensors are selected in terms of cost effectiveness and ease of use, i.e. photodiode sensors and thermopiles are selected first and then pyroelectric and RP sensors. If you want to measure only power, pyro and RP sensors will not be selected even if they could operate within all other given laser parameters. If you select a repetition rate consistent with single shot energy (<=0.2Hz), RP sensors will not be selected even if they could operate within all other given laser parameters. Aperture Since it is not practical to allow the beam to fill the entire aperture, the sensors are selected so that the sensor aperture is always at least 2mm or 10% larger than the beam. If the beam is rectangular its corners can touch the aperture. Using the Sensor Finder Program The Sensor Finder Program is available for use online at: www.ophiropt.com/sensor-finder It can also be downloaded for use on your own PC at: www.ophiropt.com/sensor-finder-download Sensor Finder Input Screen 1. When the program is started, the above screen appears: In Step 1, Select the laser type [CW or pulsed], the beam type [circular or rectangular] and whether you wish to measure both power and energy or just laser power. 2. In Step 2, Enter the required laser parameters: beam diameter, wavelength, max/min power or max/min energy, rep rate and pulse width. If minimum power is not entered, then the program assumes the minimum is ½ the maximum. If desired, enter these optional criteria: exposure time – the maximum time the sensor measures at a time. If you only plan to measure the laser power for short periods at a time, Ophir offers more compact sensors for intermittent use. Sensor size – only sensors smaller than the specified dimensions will be selected. 13 For latest updates please visit our website: www.ophiropt.com/photonics 01.08.2013 3. In Step 3 click “Find Sensor”. 4. The sensors that meet specified criteria will be listed in the output screen shown below. The sensor type and how close to the damage threshold are listed for each result. The input parameters are listed on top. 1.0 Sensors 5. In order to find compatible displays, click “Meter Finder”. In order to find compatible PC interfaces click “PC Interfaces”. 6. To save the results, click “Save”. To print the results, click “Print”. Sensor Finder Output Screen Another Search? Results For: Energy Range 1mJ to 10 mJ | Diameter 35 mm | Rep Rate 10 Hz | Wavelength 1064 nm | Pulse Width 7 ns # Name % of Damage Threshold 1 PE50 <10% 2 PE50BF <10% 3 PE50-DIF-ER (dif out) <10% 4 PE50+beam splitter <10% 5 PE50BF+beam splitter <10% Save PDF Print To download offline Sensor Finder version please click here To find a meter that connects to the sensor, please click: Meter Finder. To find PC Interfaces that connects to the sensor, please click: PC Interfaces. For further assistance, contact us. If sensor finder does not work properly please consult with your IT manager to reset the browser setting eg. allow javascript. Damage Threshold Some sensors are closer to the laser damage threshold than others. Since the damage threshold can vary somewhat from case to case and also is cumulative, the Sensor Finder Program mentions how close a particular sensor is to the damage threshold. The displayed percent of damage threshold is the highest of either the power or the energy threshold. It is recommended to select a sensor that is less than 50% of the damage threshold. Power/Energy Meters In order to find power/energy meters or PC interfaces that are compatible with various sensors, click "Meter Finder" or "PC Interfaces". Note that some of the newer sensors, such as the Pyro-C line sensors are only compatible with the newer meters and PC interfaces. 14 01.08.2013 For latest updates please visit our website: www.ophiropt.com/photonics General Introduction Types of Power/Energy Sensors 1.0 Sensors Power and Single Shot Energy Sensors Ophir provides two types of power sensors: Photodiode sensors and Thermal sensors. Photodiode sensors are used for low powers from picowatts up to hundreds of milliwatts and as high as 3W. Thermal sensors are for use from fractions of a milliwatt up to thousands of watts. Thermal sensors can also measure single shot energy at pulse rates not exceeding one pulse every ~5s. Repetitive Pulse Energy Sensors For higher pulse rates, Ophir has pyroelectric energy sensors able to measure pulse rates up to tens of kHz. These are described in the energy sensor section, section 1.3. Thermal Sensors The thermopile sensor has a series of bimetallic junctions. A temperature difference between any two junctions causes a voltage to be formed between the two junctions. Since the junctions are in series and the «hot» junctions are always on the inner, hotter side, and the «cold» junctions are on the outer, cooler side, radial heat flow on the disc causes a voltage proportional to the power input. Laser power impinges on the center of the thermopile sensor disc (on the reverse side of the thermopile), flows radically and is cooled on the periphery. The array of thermocouples measures the temperature gradient, which is proportional to the incident or absorbed power. In principle, the reading is not dependent on the ambient temperature since only the temperature difference affects the voltage generated and the voltage difference depends only on the heat flow, not on the ambient temperature. Since all the heat absorbed flows through the thermocouples (as long as the laser beam is inside the inner circle of hot junctions), the response of the detector is almost independent of beam size and position. If the beam is close to the edge of the inner circle, some thermocouples become hotter than others but since the sum of all of them is measured, the reading remains the same. Generally, Ophir specifies ±2% uniformity of reading over the surface or better. Laser impinges here Hot junction Cold junction Output BeamTrack Power / Position / Size sensors Ophir now has the new BeamTrack thermal sensor that can measure beam position and beam size as well as power. This innovative device provides an additional wealth of information on your laser beam – centering, beam position and wander, beam size as well as power and single shot energy. The BeamTrack sensor is illustrated schematically here and works as follows: the signal coming from the sensor is now divided into 4 quadrants so by measuring and comparing the output from the 4 sections we can determine the position of the center of the beam to a high degree of accuracy. In addition to the 4 quadrants, there is now a special proprietary beam size detector. After processing outputs from these various detectors, the user is presented with the beam position as well as beam size. Note that the beam size is calibrated only for a Gaussian beam of >3mm but for other beams it will give relative size information and will indicate if the beam is changing size. For more information on the BeamTrack sensors, please see section 1.2. 2nd Quad 1st Quad Beam size detector 4th Quad Total output Using Power Sensors to Measure Single Shot Energy Although Ophir thermal power sensors are used primarily to measure power, they can measure single shot energy as well where they integrate the power over time flowing through the disc and thus measure energy. Since the typical time it takes for the disc to heat up and cool down is several seconds, these thermal sensors can only measure one pulse every several seconds at most. Thus they are suitable for what is called “single shot” measurement. Although the response time of the sensor discs is slow, there is no limit to how short the pulses measured are since the measurement is of the heat flowing through the disc after the pulse. 15 For latest updates please visit our website: www.ophiropt.com/photonics 01.08.2013 Pyroelectric Sensors 1.0 Sensors Pyroelectric type sensors are useful for measuring the energy of repetitively pulsed lasers at up to 25,000Hz and are sensitive to low energies. They are less durable than thermal types and therefore should not be used whenever it is not necessary to measure the energy of each pulse and average power measurement is sufficient. Pyroelectric sensors use a pyroelectric crystal that generates an electric charge proportional to the heat absorbed. Since the two surfaces of the crystal are metalized, the total charge generated is collected and therefore the response is not dependent on beam size or position. This charge then charges a capacitor in parallel with the crystal and the voltage difference thus generated is proportional to the pulse energy. After the energy is read by the electronic circuit, the charge on the crystal is discharged to be ready for the next pulse. Heat sink disc Pyroelectric crystal thickness < 1mm Electrical leads Photodiode Sensors for Lower Powers In addition to the thermal sensors described above, Photodiode sensors are used for low powers from picowatts up to hundreds of milliwatts and as high as 3W. A photodiode sensor is a semiconductor device that produces a current proportional to light intensity and has a high degree of linearity over a large range of light power levels - from fractions of a nanowatt to about 2mW. Above that light level, corresponding to a current of about 1mA, the electron density in the photodiode becomes too great and its efficiency is reduced causing saturation and a lower reading. Most Ophir PD sensors have a built-in filter that reduces the light level on the detector and allows measurement up to 3W without saturation. Laser 16 01.08.2013 For latest updates please visit our website: www.ophiropt.com/photonics Optical filter Photodiode Output 1.1 Sensors Power sensors 17 For latest updates please visit our website: www.ophiropt.com/photonics 01.08.2013 1.1 Power Sensors Thermal Sensors 1.1 Sensors As described in the general introduction, the thermopile sensor has a series of bimetallic Laser impinges junctions. A temperature difference between any two junctions causes a voltage to here be formed between the two junctions. Since the junctions are in series and the «hot» junctions are always on the inner, hotter side, and the «cold» junctions are on the outer, cooler side, radial heat flow on the disc causes a voltage proportional to the Hot junction power input. Laser power impinges on the center of the thermopile sensor disc (on the reverse side of the thermopile), flows radially and is cooled on the periphery. The array Cold of thermocouples measures the temperature gradient, which is proportional to the junction incident or absorbed power. In principle, the reading is not dependent on the ambient temperature since only the temperature difference affects the voltage generated and Output the voltage difference depends only on the heat flow, not on the ambient temperature. Since all the heat absorbed flows through the thermocouples (as long as the laser beam is inside the inner circle of hot junctions), the response of the detector is almost independent of beam size and position. If the beam is close to the edge of the inner circle, some thermocouples become hotter than others but since the sum of all of them is measured, the reading remains the same. Generally, Ophir specifies ±2% uniformity of reading over the surface or better. Using Power Sensors to Measure Single Shot Energy Although Ophir thermal power sensors are used primarily to measure power, they can measure single shot energy as well, where they integrate the power flowing through the disc over time and thus measure energy. Since the typical time it takes for the disc to heat up and cool down is several seconds, these thermal sensors can only measure one pulse every several seconds at most. Thus they are suitable for what is called “single shot” measurement. Although the response time of the sensor discs is slow, there is no limit to how short the pulses measured are since the measurement is of the heat flowing through the disc after the pulse. BeamTrack Power / Position / Size sensors Ophir now has the new BeamTrack thermal sensor that can measure beam position and beam size as well as power. This innovative device provides an additional wealth of information on your laser beam – centering, beam position and wander, beam size as well as power and single shot energy. The BeamTrack sensor is illustrated schematically here and works as follows: the signal coming from the sensor is now divided into 4 quadrants so by measuring and comparing the output from the 4 sections we can determine the position of the center of the beam to a high degree of accuracy. In addition to the 4 quadrants, there is now a special proprietary beam size detector. After processing outputs from these various detectors, the user is presented with the beam position as well as beam size. Note that the beam size is calibrated only for a Gaussian beam of >3mm but for other beams it will give relative size information and will indicate if the beam is changing size. For more information on the BeamTrack sensors, please see section 1.2. 2nd Quad 1st Quad Beam size detector 4th Quad Total output Types of Thermopile Discs There is no single absorber which meets the needs of all applications. Ophir has developed several types for different applications, such as long pulses (0.1-10ms), short pulses (<1µs) and continuous radiation. Absorbers optimized for long pulses and CW are characterized by thin, refractory materials, since the heat can flow through the coating and into the disc during the pulse. On the other hand, heat cannot flow during short pulses, and all the energy is deposited in a thin (typically 0.1µm) layer near the surface. This causes vaporization of the surface which ruins the absorber. Instead, a volume absorber that is partially transparent and absorbs over a distance of 50μm -3mm is used. This spreads the heat over a larger volume allowing much higher energies. Ophir thermopiles can measure from tens of microwatts to Kilowatts. Nevertheless, the thermal range of operation of the discs is limited. If the difference between the hot and cold junction temperature exceeds tens of degrees, the constant heating/cooling of the junctions can cause premature failure in the junctions. In order to accommodate different power ranges, discs of different thicknesses and sizes are used, thick ones for high powers and thin ones for low powers. The response time of the discs is dependent on their size and shape: larger diameters and thicker discs are slower than thin small diameter ones. The response time is in general dependent on the mass of material which has to heat up in the thin absorber region of the disc vs. 18 01.08.2013 For latest updates please visit our website: www.ophiropt.com/photonics the speed the heat flows out of the same region. The response time is approximately proportional to the aperture, i.e. a 50mm aperture disc is three times as slow as an 18mm aperture disc. Thermal Surface Absorbing Heads 1.1 Sensors A surface absorber typically consists of an optically absorbing refractory material deposited on a heat conducting substrate of copper or aluminum. When a long pulse of several hundred µs or a continuous laser beam falls on such a surface absorber, the light is absorbed in a very thin layer of the surface – typically 0.1 – 1µm thickness (see illustration A). Although the light is absorbed in a thin layer and there converted into heat, the pulse is long enough so that while energy is being deposited into the surface layer, heat is also flowing out into the heat conducting substrate and therefore the surface does not heat up excessively. Ophir standard surface absorbers can stand up to 10 Joules/cm2 for 2ms pulses and up to 28kW/cm2 for low power continuous lasers. Surface Absorbers for High Power Lasers and Long Pulses The traditional surface absorbers have a much lower damage threshold at > 1000W, where they can damage at 2-3 kW/cm2. Ophir has developed coatings that improve the damage threshold for high power lasers. These coatings are denser and have higher heat conductivity than previous coatings. These LP and LP1 coatings also have a much higher damage threshold for long pulses reaching power damage thresholds of up to 100kW/cm² and 250J/cm² for 10ms pulses. Surface absorbers are suitable for pulses longer than ~100µs. Surface vs. Volume Absorbers When measuring a laser with short pulses of tens of µs or less, the heat is deposited in a short time and cannot flow during the pulse (see illustration B below). Therefore a surface absorber which absorbs the energy in a thin surface layer is not suitable. All the energy is deposited in a thin layer and that layer is vaporized. In this case, volume absorbers are used. These have traditionally consisted of a neutral density glass thermally bonded to a heat-conducting metallic substrate. The ND glass absorbs the light over a depth of 1-3 mm instead of fractions of a micrometer. Consequently, even with short pulses where there is no heat flow, the light and heat are deposited into a considerable depth of material and therefore the power/energy meter with aa volume absorber is able to withstand much higher energy densities – up to 10 Joules/cm2 (see illustration C). These ND glasses form the basis of the Ophir P type absorbers. In addition to the P absorbers, Ophir has PF and SV absorbers that can stand up to higher average powers and power densities as well as EX absorbers for the UV. Long laser pulse (>100µs) or continuous (A) Surface absorber Heat conducting copper Short laser pulse <10µs (B) Surface absorber (C) Volume absorber Laser pulse Laser pulse or aluminum substrate Laser pulse Depth of light penetration ~0.1-1µm Heat flows into substrate during laser pulse Depth of light penetration ~0.1-1µm. Light and heat concentrated same thin layer. Heat does not have a chance to flow during the short laser pulse duration. Light is absorbed gradually over thick partially transmitting layer. Heat is therefore generated over large volume even during short pulse with no heat flow. Surface absorbers work best when measuring power or energy for long laser pulses (A). Volume absorbers can measure pulses with much higher energies than surface absorbers (B), (C) can measure. Calibration Method and Estimated Accuracy for Ophir High Power Sensors Ophir models 5000W, 10K-W and Comet 10K are calibrated using relatively low power lasers ~ 150 - 300W. Using such low power lasers to calibrate the instrument vs. the high power at which the sensors are used raises the question of calibration accuracy. The following explanation clearly demonstrates that the 5000W, 10K-W and Comet 10K are indeed accurate to ±5% over their measurement range. The 5000W and 10K-W sensors work on the thermopile principle, where the radial heat flow in the absorber disk causes a temperature difference between the hot and cold junctions of the thermopile which in turn causes a voltage difference across the thermopile. Since the instrument is a thermopile voltage generating device, it must be linear at low values of output. Therefore, if it is shown to be linear at powers which are a significant fraction of the maximum power, it will necessarily 19 For latest updates please visit our website: www.ophiropt.com/photonics 01.08.2013 1.1 Sensors be linear at very low powers and if the calibration is correct at low powers, it will remain correct at high powers as well. On the other hand, although the output may be linear at low powers, there may be a zero offset that, due to the relatively low output at low powers, will cause an error in calibration. For example, if calibration is performed at 200W and the output of the sensor is 10μV/W (a typical value) and there is a zero offset of only 1μV, this will cause a calibration error of 10%. Ophir’s calibration method always measures the difference between the reading with power applied and without power applied, thus eliminating error due to zero offset. This measurement is taken several times to insure accuracy. The above measurement method assures that the calibration inaccuracy due to measurement errors is less than 1%, comparable to the expected errors in our lower powered sensors. In order to verify this, models L1500W, 5000W and 10K-W sensors have been measured by various standards laboratories. These measurements have shown Ophir sensors to be well within the claimed limits of linearity. The Comet 10K series measures the heat rise of the absorbing puck when irradiated by the laser for 10s. In order to calibrate the Comet 10K, we simply irradiate with a lower power laser for longer e.g. 150W for 60s. Thus the heating effect is similar to that of a higher power laser. Tests of the Comet calibrated by this method vs. NIST traceable high power sensors has shown that it is accurate and reproducible. For more information on calibration please see our website at: www.ophiropt.com/calibration-procedure/tutorial Photodiode Sensors A photodiode sensor is a semiconductor device that produces a current proportional to light intensity and has a high degree of linearity over a large range of light power levels - from fractions of a nanowatt to about 2 mW. Above that light level, corresponding to a current of about 1mA, the electron density in the photodiode becomes too great and its efficiency is reduced causing saturation and a lower reading. Most Ophir PD sensors have a built-in filter that reduces the light level on the detector and allows measurement up to 30mW without saturation. Most sensors have an additional removable filter allowing measurement to 300mW or 3 Watts depending on the model. Principle of Operation When a photon source, such as a laser, is directed at a photodiode detector, a current proportional to the light intensity and dependent on the wavelength is created. Since many low power lasers have powers on the order of 5 to 30mW, and most photodiode detectors saturate at about 2mW, the PD300 sensor has been constructed with a built-in filter so the basic sensor can measure up to 30mW without saturation. With the removable extra filter, the PD300 sensors series can measure up to 300mW or 3W depending on the model. The Ophir power meter unit amplifies this signal and indicates the power level received by the sensor. Due to the superior circuitry of the Ophir power meters, the noise level is very low and the PD300 series sensors with Ophir power meter have a large dynamic range from picowatts to watts. The PD300 is shown schematically below. The PD300 and PD300-3W have the exclusive patented dual detectors connected back to back which eliminate any signal illuminating both detectors equally (background light). Laser hits # 1 Removable filter Built-in filter Photodiode # 1 Photodiode # 2 Calibration and Accuracy The sensitivity of various photodiode sensors varies from one sensor to another as well as with wavelength. Therefore, each PD300 sensor is individually calibrated against a NIST standard, which has been calibrated at several nm intervals over the entire spectral range. The calibration is done over the entire spectral range against the NIST standard using a computer-controlled monochromator. Since the instruments are calibrated against NIST standards, the accuracy is generally ±3% over the wavelength range the calibration has been performed. The linearity of the photodiode detector is extremely high and errors due to this factor can be ignored, as long as saturation intensity is not approached. For more information on calibration accuracy please see our website at: www.ophiropt.com/calibration-procedure/tutorial 20 01.08.2013 For latest updates please visit our website: www.ophiropt.com/photonics Absorption and Damage Graphs for Thermal Sensors Absorption vs. Wavelength 100 HE LP BB Absorption % _ LP HE, SV 90 EX P PF Thermal BB LP1 80 1.1 Sensors P PF PF-DIF SV 70 LP1 60 PF-DIF 50 0.1 1 10 Wavelength µm 100 Damage Threshold vs. Pulse Width Note: The CW power damage threshold in W/cm2 is found on the right hand side of the table at the 1s pulse width value. 100000 SV LP1 BB thermal <300W 10000 Pulsed Laser Damage Threshold LP BB thermal >1500W PF HE / HE1 100 P PF 1 0.3 0.1 HE PF 1.5 SV BB LP LP1 0.01 1E-10 1E-09 1E-08 1E-07 0.000001 0.00001 0.0001 0.001 0.01 0.1 Power Density in W/cm² P 10 Power Density in W/cm2 Energy Density in J/cm2 Energy Density in J/cm² 1000 1 Pulse Width in Seconds Pulse Width in Seconds 21 For latest updates please visit our website: www.ophiropt.com/photonics 01.08.2013 1.1.1 Photodiode Power Sensors 1.1.1.1 Standard Photodiode Sensors 50pW to 3W PD300 with filter off PD300 with filter installed PD300-TP Mounted on stand 1.1.1 Sensors Features ֺֺ Very large dynamic range ֺֺ Swivel mount for hard to measure places ֺֺ Comes with filter in / filter out options ֺֺ Patented automatic background subtraction ֺֺ Fiber optic adapters available Model PD300 PD300-1W PD300-3W PD300-TP Use Detector Type Aperture Filter mode Spectral Range nm Power Range General silicon 10x10mm Filter out Filter in 350-1100 430-1100 30mW to 500pW 300mW to 200µW 30mW to 30nW 300mW to and dBm 30mW and dBm 0.01 NA nm mW mW Powers to 1W silicon 10x10mm Filter out Filter in 350-1100 430-1100 30mW to 1W to 200 µW 500pW 30mW to 30nW 1W to 30mW and dBm and dBm 0.01 NA nm mW mW Powers to 3W silicon 10x10mm Filter out Filter in 350-1100 430-1100 100mW to 5nW 3W to 200µW Thin profile for tight fit silicon 10x10mm Filter out Filter in 350-1100 400-1100 3mW to 50pW 1W to 20µW 100mW to 300nW and dBm 0.1 nm mW 3W to 30mW and dBm NA mW 3mW to 3nW and dBm 0.001 nm mW 1W to 3mW and dBm 1 mW <488 30 300 <488 30 1000 <488 100 3000 3 NA 633 20 300 633 20 1000 633 100 3000 3 1000 670 790 904 13 10 10 200 100 100 670 790 904 13 10 10 1000 600 700 670 790 904 100 100 100 2000 1200 1200 2.5 2 1.5 1000 500 300 1064 25 250 1064 25 1000 1064 100 2200 350400 400500 600 700 800950 1064 3 500 Power Scales Resolution nW Maximum Power vs. Wavelength Accuracy (including errors due to temp. variations) % error vs Wavelength nm ±10 360-400 NA ±10 360-400 NA ±3 400-950 ±5430-950 ±3 400-950 ±5430-950 ±5950-1100 ±7950-1100 ±5950-1100 ±7950-1100 Damage Threshold W/cm2 10 50 10 10 (a) Max Pulse Energy µJ 2 20 2 100 Noise Level for filter out pW 20 20 Response Time with Meter s 0.2 0.2 Beam Position Dependence ±2% ±2% Background Subtraction 95-98% of background is cancelled automatically under normal room conditions, even when changing continuously Fiber Adapters Available SMA, FC, ST, SC SMA, FC, ST, SC (see page 43) Version Part Number: Standard Sensor 7Z02410 7Z02411A StarLink Sensor: Direct USB 787100 link to PC (p. 42) ±10 360-400 NA ±3 400-950 ±5430-950 ±5950-1100 ±7950-1100 10 100 20 500 200 0.2 ±2% ±3% NA ±7 350-400 ±3 400-950 ±5950-1100 10 1 ±2 0.2 ±2% NA SMA, FC, ST, SC NA V1 7Z02426 7Z02424 Note: (a) Maximum power density For graphs see page 24 For PD300-3W drawing see PD300-UV/PD300-IR drawing in page 23 PD300 PD300/ PD300-1W filter installed PD300 11 Front View 11 Front View 40.5 65 10 Bottom View 10 Bottom View 11 Front View Front View PD300 with filter PD300 installed with filter installed with filter installed PD300 with filterPD300 installed 10 65 10 Bottom View Bottom View Bottom View Bottom View 9.5 9.5 65 118 10 10 10 10 10 PD300-TP 118 17.8 17.8 11 11 11 11 Bottom View 42 Bottom View 42 40.5 65 65 10 10 12.5 12.5 42 119.5 65 17.8 17.8 11 21.4 21.4 42 119.5 118 40.5 65 118 40.5 1065 119.5 21.4 21.4 12.5 12.5 119.5 PD300 PD300 PD300/ PD300-1W filter off 9.5 Front View 9.5 Front View Front View Front View PD300 with filter PD300 off with filter off PD300 with filterPD300 off with filter off 22 REV. 01.08.2013 1 NAME SIGN. T.M. DRAWN DATE REV. 1 12.09 DRAWN REV. APPR. NAME SIGN. DATE 12.09 T.M. For latest updates please visit our website: www.ophiropt.com/photonics APPR. REV. 1 A.R. NAME DRAWN T.M. APPR. A.R. SIGN. DATE 1A.R.NAME DRAWN T.M. APPR. A.R. 12.09 SIGN. DATE 12.09 NA ±5400-950 ±7950-1100 50 100 1.1.1.1 Standard Photodiode Sensors 10pW to 300mW PD300 with filter off PD300 with filter installed PD300-IRG with no fiber input Model PD300-UV Use Lowest powers from 200-1100nm PD300-IR 1.1.1.1 Sensors Features ֺֺ Spectral range including UV and IR ֺֺ Very large dynamic range ֺֺ Swivel mount for hard to measure places ֺֺ Comes with filter in / filter out options ֺֺ Fiber optic adapters available PD300-IRG with fiber input PD300-IRG Low powers from 700-1800nm Telecom wavelength fiber and free space measurements silicon germanium InGaAs 10x10mm φ5mm φ5mm for free space beams Filter out Filter in Filter out Filter in Filter out Filter in 200 -1100 220 -1100 700-1800 700-1800 800 - 1700 950 - 1700 3mW to 20pW 300mW to 30mW to 5nW 300mW to 800µW to 10pW 150mW to 20µW 2µW 200µW 3mW to 3nW and dBm 300mW to 30mW to 30nW 300mW to 800 µW to 800pW 300mW to 3mW 300µW and dBm and dBm 30mW and dBm and dBm and dBm 0.001 100 0.01 NA 0.0001 1 nm mW mW nm mW mW nm mW mW 250 - 350 3 300 800 12 120 <1000 0.8 100 400 3 300 1000- 30 300 1100 0.8 30 1300 600 3 300 1400 30 250 1200 0.8 50 800 - 950 2.5 150 1500 25 80 >1300 0.8 150 1064 3 30 1600 30 100 1800 30 300 Detector Type Aperture Filter mode Spectral Range nm Power Range Power Scales Resolution nW Maximum Power vs. Wavelength Accuracy (including errors due to temp. variations) % error vs Wavelength nm ±6 ±3 ±5 10 0.4 Damage Threshold W/cm2 Max Pulse Energy µJ Noise Level for filter out pW ±1 200-270 ±10 220-400 270-950 ±5 400-950 950-1100 ±7 9 50-1100 50 15 Response Time with Meter s 0.2 Beam Position Dependence ±2% Fiber Adapters Available (see page 43&44) SC, ST, FC, SMA Version Part Number 7Z02413 ±5 ±4 ±7 10 0.3 700-900 ±7 9 00-1700 ±6 1700-1800 ±9 50 3 200 0.2 ±2% SC, ST, FC, SMA 7Z02412 700-900 ±3 1000-1650 ±6 1000-1650 9 00-1700 ±5 <1000 & >1650 ±8 <1000 & >1650 1700-1800 5 50 1 100 ±300fW at 1550 nm and 1s average 0.2 ±1% over 80% of aperture FC, FC/APC, SMA V1 7Z02402 For graphs see page 24 PD300-UV/IR PD300-UV/PD300-IR PD300-UV/IR 40.5 65 40.5 Bottom View Front View Front View with filter installed PD300-UV/IR with filter installed PD300-UV/IR with filter installed 11 17.8 11 17.8 11 21.4 21.4 11 10 Bottom View Bottom View Bottom View 42 42 65 65 10 10 10 10 118 10 65 12.5 12.5 PD300-IRG 118 119.5 119.5 9.5 9.5 Front View Front View with filterPD300-UV/IR off with filter off PD300-UV/IR with filter off REV. REV. 1 NAME DRAWN T.M. NAME 1 APPR. SIGN. A.R. SIGN. DATE T.M. APPR. A.R. 23 12.09 DATE For latest updates please visit our website: www.ophiropt.com/photonics DRAWN 12.09 01.08.2013 PD300 Angle Dependence Temperature Coefficient of Sensitivity 1.4 1 PD300-IR PD300/PD300UV/PD300-3W PD300-IRG 1.2 Percent change per degC 0.8 0.8 relative reading 1.1.1.1 Sensors 0.9 1 0.6 0.4 0.2 PD300/PD300UV/PD300-3W PD300-IRG 0 -0.2 0.7 0.6 0.5 0.4 PD300-IR 0 10 20 -0.4 300 400 500 600 700 800 900 1000 1100 1200 1300 1400 1500 1600 1700 30 40 50 60 Angle, degrees 1800 Wavelength, nm PD300-CIE spectral response vs. CIE curve Dependence of Sensitivity on Numerical Aperture (PD300 - IRG) 1.2 1.1 1.0 relative responce relative sensitivity 1 0.9 Filter out Filter in SMF 0.8 0.7 0.6 0.8 CIE Ophir 0.6 0.4 0.2 0.5 0 0.1 0.2 0.3 0.4 0.5 numerical aperture 300 400 500 Note: 1. Graph assumes equal intensity into all angles up to maximum N.A. 2. Calibration is done with SMF, N.A. 0.13 450 500 550 600 650 700 750 800 850 900 relative sensitivity, % relative responce, % 800 Relative Spectral Response of BC20 Filter out Filter in 400 700 Wavelength, nm Typical Sensitivity Curve of PD300-BB Sensors 120 110 100 90 80 70 60 50 40 30 20 10 0 600 950 1000 1050 110 100 90 80 70 60 50 40 30 20 10 0 340 Wavelength, nm 440 540 640 740 840 940 1040 1140 Wavelength, nm Graph of the approximate relative spectral response of the BC20 for purpose of interpolation, if the instrument is to be used at a wavelength other than the ones that are factory calibrated 24 01.08.2013 For latest updates please visit our website: www.ophiropt.com/photonics 1.1.1.2 Round Photodiode Sensors 20pW to 3W PD300R Filter Off PD300R Filter installed Model PD300R PD300R-3W Use General Powers to 3W Detector Type Aperture Filter mode Spectral Range nm Power Range silicon φ10mm Filter out 350-1100 30mW to 500pW 30mW to 30nW and dBm 0.01 nm mW <488 30 633 20 Filter in 430-1100 300mW to 200µW 300mW to 30mW and dBm NA mW 300 300 silicon φ10mm Filter out 350-1100 100mW to 5nW 100mW to 300nW and dBm 0.1 nm mW <488 100 633 100 Lowest powers from 200-1100nm silicon φ10mm Filter in Filter out Filter in 430-1100 200 -1100 220 -1100 3W to 200µW 3mW to 20pW 300mW to 2µW 3W to 30mW 3mW to 3nW 300mW to and dBm and dBm 300µW and dBm NA 0.001 100 mW nm mW mW 3000 250 - 350 3 300 3000 400 3 300 670 790 904 1064 200 100 100 250 670 790 904 1064 2000 1200 1200 2200 600 3 800 - 950 2.5 1064 3 300 150 30 NA ±5430-950 ±7950-1100 50 20 ±10 360-400 ±3 400-950 ±5950-1100 10 20 200 0.2 ±2% NA ±5430-950 ±7950-1100 100 500 ±6 200-270 ±3 270-950 ±5950-1100 10 0.4 ±1 0.2 ±2% ±10220-400 ±5400-950 ±7950-1100 50 15 Power Scales Resolution nW Maximum Power vs. Wavelength 13 10 10 25 Accuracy (including errors due to temp. variations) % error vs Wavelength nm ±10 360-400 ±3 400-950 ±5950-1100 Damage Threshold W/cm2 10 Max Pulse Energy µJ 2 Noise Level for filter out pW 20 Response Time with Meter s 0.2 Beam Position Dependence ±2% Fiber Adapters Available (see page 44) Version Part Number 100 100 100 100 PD300R-UV ±3% 1.1.1.2 Sensors Features ֺֺ Round geometry for easy centering ֺֺ Threaded to fit standard SM1 bench equipment ֺֺ Same performance as standard PD300 sensors ֺֺ Comes with removable filter as standard ֺֺ Fiber optic adapters available PD300R-IR IR wavelengths 700-1800nm germanium φ5mm Filter out Filter in 700-1800 700-1800 30mW to 5nW 300mW to 200µW 30mW to 30nW 300mW to and dBm 30mW and dBm 0.01 NA nm mW mW 800 12 120 100030 300 1300 1400 30 250 1500 25 80 1600 30 100 1800 30 300 ±5 700-900 ±4 900-1700 ±71700-1800 10 0.3 200 0.2 ±2% FC, ST, SC, SMA FC, ST, SC, SMA SC, ST, FC, SMA SC, ST, FC, SMA 7Z02436 7Z02437 7Z02438 7Z02439 ±7700-900 ±6900-1700 ±91700-1800 50 3 For graphs see page 24 PD300R-IR PD300R 24.2 10 35 4 15 ADJUSTABLE 76-125 100 1.035"-40 (SM1) REV. 100 1 with filter off NAME T.M. APPR. A.R. SIGN. 1.035"-40 (SM1) ADJUSTABLE 76-125 75 with filter installed DRAWN 4 4 1.035"-40 (SM1) 35 1.035"-40 (SM1) 24.2 15 5 35 35 ° ° 4 with filter off 4 PD300R-IR 19.2 32 4 19.2 32 PD300R/ PD300R-3W/ PD300R-UV DATE 12.09 75 with filter installed REV. 1 NAME DRAWN T.M. APPR. A.R. SIGN. DATE 03.10 25 For latest updates please visit our website: www.ophiropt.com/photonics 01.08.2013 1.1.1.3 Sensors 1.1.1.3 Special photodiode sensors and integrating spheres 1.1.1.3.1 Special Photodiode Sensors Features ֺֺ PD300-BB for broadband light sources - radiometry (PD300-BB-50mW option up to 50mW) ֺֺ PD300-CIE for eye adjusted Lux measurements ֺֺ BC20 for measuring scanned beams such as bar code light sources BC20 PD300-BB/ / PD300-BB-50mW PD300-CIE Model PD300-BB Use Radiometry-broad spectrum Silicon with special filter 10x10mm 430 - 1000 (see graph) PD300-BB-50mW PD300-CIE (b) BC20 (b) Eye adjusted measurement in Lux Silicon with special filter Active area 2.4 x 2.8mm 400 - 700 (see graph) Scanned beams e.g. bar code 200kLux to 20 mLux 200kLux to 200 mLux 20mW to 100µW 20mW to 2mW 1 mLux (see graph) 0.001 ±3% for >10% of full scale. Deviation from calibration -3% at 30,000 inch/s scan rate on sensor. 50 NA 5µW Two modes of operation: Hold: holds highest reading for 5s then updates. No Hold: updates reading 3 times per second. ±2% Same as PD300-BB with removable attenuator for use to 50mW Detector Type Silicon with special filter Aperture 10x10mm Spectral Range nm 430 - 1000 (see graph) Filter Mode Filter out Filter in Power Range 4mW to 50pW 4mW to 50pW 50mW to 1nW Power Scales 4mW to 8nW and dBm 4mW to 8nW and 50mW to 80nW dBm and dBm Resolution nW 0.001 0.001 0.01 Accuracy Maximum deviation from Maximum deviation from flat flat spectrum (see graph) spectrum (see graph) ±10% ±10% ±12% 2 Damage Threshold W/cm 10 10 100 Max Pulse Energy µJ 1 1 10 Noise Level pW 2 2 30 Response Time with Meter s 0.2 0.2 0.2 10 1 ±1mLux 0.2 Beam Position Dependence ±2% for broadband light sources NA – source overfills detector Background Subtraction NA ±2% for broadband ±3% for light sources broadband light sources NA NA Fiber Adapters Available (see page 43) Version Part Number NA SC, ST, FC, SMA NA 7Z02405 7Z02440 7Z02406 Notes: NA Silicon with peak and hold circuit 10x10mm 633, 650, 675 (others available) Background is automatically subtracted from both scanned and static beams. NA 7Z02422A(a) (a) Swivel stand for BC20 sensor P/N 1Z09004 (b) The PD300-CIE and BC20 sensors are not fully supported by Ophir PC Interfaces (Juno, USBI, Pulsar and Quasar) or by StarLite Meter. For graphs see page 24 PD300BC20 PD300 PD300-UV/IR PD300-BB-CIE / PD300-BB PD300-BB-50mW with filter installed PD300-UV/IR / PD300-BB-50mW with filter off 119.5 119.5 10 Bottom View 9.5 11 1111 Front View Front View Front View PD300 with filter installed PD300 with filter installed PD300-UV/IR with filter installed REV. 1 NAME DRAWN T.M. APPR. A.R. SIGN. 40.5118 40.5 118 118 65 6565 1010 10 Bottom View Bottom View Bottom View Bottom View Bottom View 42 View 42Bottom 21.4 21.4 11 Front View PD300-UV/IR with filter off 01.08.2013 1010 17.8 17.8 11 21.4 42 26 40.5 10 10 10 10 65 10 10 12.5 65 6565 11 11 40.5 65 12.5 12.5 119.5 17.8 17.8 118 9.5 9.59.5 Front View Front View Front View PD300 with filter PD300 with filter offoff PD300-UV/IR with filter off DATE REV. 12.09 DRAWN T.M. APPR. A.R. For latest updates please visit our website: www.ophiropt.com/photonics 1 NAME 1 NAME SIGN.SIGN. DATEDATE REV. NAME REV. SIGN. 1 DATE 12.09 T.M. DRAWN 12.09 T.M. DRAWN 12.09 A.R. APPR. A.R. APPR. 1.1.1.3.2 Special Sensors - Integrating Spheres 1µW to 3W 3A-IS 3A-IS-IRG Model 3A-IS 3A-IS-IRG Use Divergent beams to 3W for visible NIR Integrating sphere with Si detector 0.42 - 1.1 φ 12mm ±40 degrees ±2% Divergent beams to 3W for IR Absorber Type Spectral Range µm Aperture mm Maximum Beam Divergence Sensitivity to beam size and angle Power Mode Power Range Power Scales Power Noise Level Maximum Average Power Density kW/cm2 Response Time with Meter (0-95%) typ. s Power Accuracy +/-% Linearity with Power +/-% Energy Mode Energy Range Energy Scales Minimum Energy mJ Maximum Energy Maximum Energy Density J/cm2 (b) <100ns 0.5ms 2ms 10ms Cooling Fiber Adapters Available (see page 44) Weight kg Version Part number Notes: 1.1.1.3.2 Sensors Features ֺֺ Integrating sphere for divergent beams ֺֺ φ12mm aperture ֺֺ For fiber or free space input Integrating sphere with InGaAs detector 0.8 - 1.7 φ 12mm ±40 degrees ±2% 1µW - 3W 1µW - 3W 3W to 3µW and dBm 3W to 3µW and dBm 20nW 20nW 0.2 on integrating sphere surface 0.2 0.2 5 at 420-1000nm, 5 10 at 1000-1100nm 1 1 NA NA NA 5mJ NA NA NA 5mJ 0.5 6 12 25 convection SC, ST, FC, SMA (a) 0.6 V1 7Z02404 0.5 6 12 25 convection SC, ST, FC, SMA (a) 0.6 7Z02403 (a) One fiber output port available with output = 2E-4 of input power/mm2 of fiber area. (b) On integrating sphere surface. 3A-IS/ 3A-IS-IRG 27 For latest updates please visit our website: www.ophiropt.com/photonics 01.08.2013 1.1.2 Thermal Power Sensors 1.1.2.1 High Sensitivity Thermal Sensors 30µW to 3W 3A / 3A-P / 3A-P-THz 3A-FS 3A-P-FS-12 1.1.2 1.3 Sensors Features ֺֺ Very low noise and drift to measure very low powers and energies ֺֺ Broadband and P absorbers for CW and short pulses ֺֺ Up to 3W ֺֺ Spectrally flat ֺֺ Version for Terahertz Model 3A 3A-P 3A-P-THz 3A-FS 3A-P-FS-12 Use General purpose Short pulses With removable window Absorber Type Broadband P type Calibrated for Terahertz radiation P type For divergent beams, window blocks infrared P type + F.S. window Spectral Range µm Aperture mm Maximum Beam Divergence Power Mode Power Range Power Scales Power Noise Level Thermal Drift (30min) (a) Maximum Average Power Density kW/cm2 Response Time with Meter (0-95%) typ. s Power Accuracy +/-% Linearity with Power +/-% Energy Mode Energy Range Energy Scales Minimum Energy Maximum Energy Density J/cm2 (e) <100ns 0.5ms 2ms 10ms Cooling Weight kg Fiber Adapters Available (see page 44) Version Part number: Standard Sensor BeamTrack Sensor: Beam, Posivtion & Size (p. 56) StarLink Sensor: Direct USB link to PC (p. 42) 0.19 - 20 φ 9.5mm NA 0.15 - 8 φ 12mm NA 60µW - 3W 3W to 300µW 2µW 5 - 20µW 1 1.8 3 1.5 Note: (a) Note: (b) Note: (c) Note: (d) Note: (e) For P type and shorter wavelengths derate maximum energy density as follows: 3A 0.3 - 10THz φ 12mm NA Broadband + F.S. window 0.19 - 20 (b) φ 9.5mm NA 0.22 - 2.1 φ 12mm ±40 degrees 60µW - 3W 3W to 300µW 4µW 5 - 30µW 0.05 2.5 3 1.5 50µW - 3W 3W to 300µW 4µW(d) 5 - 30µW 0.05 2.5 15 (c) 1.5 30µW - 3W 3W to 300µW 2µW 2 - 10µW 1 1.8 3 1.5 60µW - 3W 3W to 300µW 6µW 20 - 40µW 0.05 2.5 3 1.5 20µJ - 2J 2J to 200µJ 20µJ 20µJ - 2J 2J to 200µJ 20µJ 20µJ - 2J 2J to 200µJ 20µJ 15µJ - 2J 2J to 200µJ 15µJ 20µJ - 2J 2J to 200µJ 20µJ 0.3 1 2 4 convection 0.2 ST, FC, SMA, SC 1 1 1 1 convection 0.2 ST, FC, SMA, SC V1 7Z02622 7Z07935 787001 0.1 1 1 1 convection 0.2 ST, FC, SMA, SC 0.3 1 2 4 convection 0.2 ST, FC, SMA, SC 1 1 1 1 convection 0.15 NA 7Z02742 7Z02628 7Z02687 7Z02621 7Z07934 787000 3A-P / 3A-P-THz 3A-FS 28 01.08.2013 787002 Depending on room airflow and temperature variations Remove window for measurement beyond 2.2µm 2 sigma standard lab traceable for >0.6THz. For 0.5THz and below add 5% to error Back reflections from meter can sometimes cause interference effects with source. Unit should be tilted ~10o in this case. Wavelength Derate to value 1064nm Not derated 532nm Not derated 355nm 40% of stated value 266nm 10% of stated value 193nm 10% of stated value For latest updates please visit our website: www.ophiropt.com/photonics 3A-P-FS-12 1.1.2.1 High Sensitivity Thermal Sensors 2mW to 12W 12A/ 12A-P Model 12A 12A-P Use Absorber Type Spectral Range µm Aperture mm Power Mode Power Range Power Scales Power Noise Level Thermal Drift (30min) (a) Maximum Average Power Density kW/cm2 Response Time with Meter (0-95%) typ. s Power Accuracy +/-% Linearity with Power +/-% Energy Mode Energy Range Energy Scales (b) Minimum Energy mJ Maximum Energy Density J/cm2 (c) Pulse rate: <100ns 0.5ms 2ms 10ms Cooling Fiber Adapters Available (see page 44) Weight kg Version Part number General purpose Broadband 0.19 - 20 φ 16mm Short pulses P type 0.15 - 8 φ 16mm 2mW - 12W 12W to 20mW 50µW 40 - 150µW 25 2.5 3 1.5 2mW - 12W 12W to 20mW 50µW 40 - 150µW 0.05 3.5 3 1.5 1mJ - 30J 30J to 30mJ 1 1mJ - 30J 30J to 30mJ 1 Notes: (a) Notes: (b) Note: (c) For P type and shorter wavelengths derate maximum energy density as follows: 12A/ 12A-P 68 38 0.3 5 10 30 convection ST, FC, SMA, SC 0.35 V1 7Z02638 Single 10 10 10 10 convection ST, FC, SMA, SC 0.35 1.1.2.1 Sensors Features ֺֺ Very low noise and drift to measure very low powers and energies ֺֺ Broadband and P absorbers for CW and short pulses ֺֺ Up to 12W ֺֺ Spectrally flat 10 - 30Hz 1 1 1 1 7Z02624 Depending on room airflow and temperature variations For the 30mJ energy scale measurements it is recommended to use the screw on barrel supplied with the sensor to protect from direct air flow Wavelength Derate to value 1064nm Not derated 532nm Not derated 355nm 40% of stated value 266nm 10% of stated value 193nm 10% of stated value 16 80 25 7 REMOVABLE PART M20x1 x 4 deep 19 ADJUSTABLE 107-150 75 45 ° 100 29 For latest updates please visit our website: www.ophiropt.com/photonics 01.08.2013 1.1.2.2 Low Power Thermal Sensors 20mW to 150W 10A 30A-BB-18 50(150)A-BB-26 L30A-10MM 1.1.2.2 Sensors Features ֺֺ Convection air cooled ֺֺ Broadband absorber ֺֺ φ16mm to φ26mm apertures ֺֺ Fast response time Model 10A 30A-BB-18 L30A-10MM 50(150)A-BB-26 Use Absorber Type Spectral Range µm Aperture mm Power Mode Power Range Maximum Power Low power Broadband 0.19 - 20 φ 16mm General purpose Broadband 0.19 - 20 φ 17.5mm Thin profile Broadband 0.15 - 20 φ 26mm General purpose Broadband 0.19 - 20 φ 26mm 20mW - 10W 20mW - 30W 10W / 5W / 0.5W 1mW 28 0.8 3 1 30W / 5W 1mW 20 at 30W 28 at 10W 0.8 3 1 80mW - 30W 8W free standing, 30W heat sinked 30W / 3W 4mW 20 at 30W 28 at 10W 1.5 3 1 40mW - 150W 150W for 1.5min, 100W for 2.2min, 50W continuous 150W / 50W / 5W 2mW 12 at 150W 17 at 50W 1.5 3 1.5 6mJ - 2J 2J / 200mJ 6 6mJ - 30J 30J / 3J / 300mJ 6 20mJ - 60J 60J / 20J /2J / 200mJ 20 20mJ - 100J 100J / 30J / 3J / 300mJ 20 0.3 2 2 2 convection ST, FC, SMA, SC 0.2 V1.1 7Z02637 7Z07904 787004 0.3 2 2 2 convection ST, FC, SMA, SC 0.3 0.3 5 10 30 convection / conduction NA 0.1 0.3 5 10 30 convection ST, FC, SMA, SC 0.3 7Z02692 7Z02273 7Z02696 7Z07900 Power Scales Power Noise Level Maximum Average Power Density kW/cm2 Response Time with Meter (0-95%) typ. s Power Accuracy +/-% Linearity with Power +/-% Energy Mode Energy Range Energy Scales Minimum Energy mJ Maximum Energy Density J/cm2 <100ns 0.5ms 2ms 10ms Cooling Fiber Adapters Available (see page 44) Weight kg Version Part number: Standard Sensor BeamTrack Sensor: Beam, Position & Size (p. 56) StarLink Sensor: Direct USB link to PC (p. 42) 10A 10A-V1.1 65 33.5 787006 64 30A-BB-18 49 30A-BB-18 22 16 64 27 17.5 25 75 ° Removable Part (2x) M3 x 4 deep M20x1 x 4 deep ADJUSTABLE 92-127 ADJUSTABLE 95-140 14.5 75 100 50(150)A-BB-26 75 64 100 L30A-10MM 64 22 64 19 10 13 34 10 75 26 26 64 (2x) M3x4 deep 55° 13 8 ADJUSTABLE 100-145 ADJUSTABLE 95-140 14.5 75 100 30 01.08.2013 For latest updates please visit our website: www.ophiropt.com/photonics 100 75 1.1.2.2 Low Power Thermal Sensors 40mW to 50W 10A-P 30A-P-17 15(50)A-PF-DIF-18 50A-PF-DIF-18 30A-N-18 Model 10A-P 30A-P-17 Use Short pulse to 10W Short pulse to 30W Absorber Type Spectral Range µm Aperture mm Power Mode Power Range Maximum Intermittent Power W P type 0.15 - 8 φ 16mm P type 0.15 - 8 φ 17mm 40mW - 10W NA 60mW - 30W NA 10W / 2W / 200mW and dBm 2mW 0.05 3.5 3 1.5 60mW - 30W NA 30W / 3W 3mW 0.05 2.5 3 1.5 140mW - 50W (for 15(50)A-PF-DIF-18 only) 50W for 5min, 15W continuous 50W / 5W 7mW 0.5 2 5 1.5 10mJ - 10J 10J / 2J / 200mJ 10 40mJ - 30J 30J / 3J 40 60mJ - 200J 200J / 30J / 3J 60 30mJ - 200J 200J / 30J / 3J 30 Single 10 - 30Hz 10 1 10 1 10 1 convection ST, FC, SMA, SC 0.2 V3 7Z02649 Single 10 - 30Hz 10 1 10 1 10 1 convection ST, FC, SMA, SC 0.3 10 - 50Hz 4 15 50 convection NA 0.35 10 - 50Hz 1 20 >100 convection ST, FC, SMA, SC 0.3 7Z02693 7Z02740/ 7Z02738 Wavelength 1064nm 532nm 355nm 266nm 193nm Derate to value Not derated Not derated 40% of stated value 10% of stated value 10% of stated value 10A-P Wavelength 1064nm 532nm 355nm 266nm 193nm M20x1 x4 deep 16 60 21 15(50)A-PF-DIF-18 48 33 64 17 75 30A-N-18 22 49 64 27 17.5 18 13 19 64 100 75 64 24 ADJUSTABLE 95-140 26 100 75 47 47 49 19 ° 75 100 33 12 24 (2x) M3 x 3 deep ADJUSTABLE 95-140 13.5 50A-PF-DIF-18 64 18 64 75 64 12 12 ADJUSTABLE 90-130 15 7Z02695 Derate to value Not derated 80% of stated value 60% of stated value 40% of stated value NA 30A-P-17 37 30W / 3W 3mW 5 2 3 1 64 Note: (a) For shorter wavelengths derate maximum energy density as follows: 30A-N-18 High power density pulsed YAG N type 0.532, 1.064 φ 17.5mm 8 Power Scales Power Noise Level Maximum Average Power Density kW/cm2 Response Time with Meter (0-95%) typ. s Power Accuracy +/-% Linearity with Power +/-% Energy Mode Energy Range Energy Scales Minimum Energy mJ Maximum Energy Density J/cm2 (a) Pulse rate: <1µs 0.5ms 5ms Cooling Fiber Adapters Available (see page 44) Weight kg Version Part number 15(50)A-PF-DIF-18/ 50A-PF-DIF-18 High energy density pulsed beams PF type + diffuser 0.24 - 2.2 φ 17.5mm 1.1.2.2 Sensors Features ֺֺ Convection air cooled ֺֺ P, PF and N type absorbers for short pulses ֺֺ φ16mm to 17.5mm apertures 8 26 ADJUSTABLE 95-140 75 100 (2x) M3 x 4 deep ADJUSTABLE 95-140 14.5 75 For latest updates please visit our website: www.ophiropt.com/photonics 100 31 01.08.2013 1.1.2.3 Low - Medium Power Thermal Sensors - Apertures to 35mm 30mW to 150W 1.1.2.3 Sensors Features ֺֺ Convection air cooled ֺֺ CW to 30W or 50W, intermittent to 150W ֺֺ φ17.5mm and φ35mm apertures 30(150)A-BB-18 30(150)A-LP1-18 L50(150)A-BB-35 L50(150)A-LP1-35 L50(150)A-PF-35 Model 30(150)A-BB-18 30(150)A-LP1-18 L50(150)A-BB-35 L50(150)A-LP1-35 L50(150)A-PF-35 Use General purpose General purpose Broadband 0.19 - 20 φ 17.5mm High power density and long pulse lasers LP1 0.25 - 2.2 φ 35mm Short pulse lasers Absorber Type Spectral Range µm Aperture mm Power Mode Power Range Maximum Intermittent Power W High power density and long pulse lasers LP1 0.25 - 2.2 φ 17.5mm Power Scales Power Noise Level Maximum Average Power Density kW/cm2 Response Time with Meter (0-95%) typ. s Power Accuracy +/-% Linearity with Power +/-% Energy Mode Energy Range Energy Scales Minimum Energy mJ Maximum Energy Density J/cm2 <100ns 0.5ms 2ms 10ms Cooling Fiber Adapters Available (see page 44) Weight kg Version Part number: Standard Sensor StarLink Sensor: Direct USB link to PC (p. 42) Note: Broadband 0.19 - 20 φ 35mm 30mW - 150W 30mW - 150W 150W for 1.5min, 100W for 2.2min, 30W continuous 150W / 30W / 3W 150W / 30W / 3W 2mW 2mW 12 at 150W 20 at 30W 38 at 150W 97 at 30W 1.2 1.2 3 3 (a) 1 1 150W / 50W / 5W 4mW 12 at 150W 17 at 50W 2 3 1 150W / 50W / 5W 4mW 38 at 150W 75 at 50W 2 3 (a) 1 20mJ - 100J 100J / 30J / 3J 20 20mJ - 300J 300J / 30J / 3J 20 40mJ - 300J 300J / 30J / 3J 40 40mJ - 300J 300J / 30J / 3J 40 7Z02699 787007 7Z02721S 7Z02730 7Z02726S 100mW - 150W 100mW - 150W 100mW - 150W 150W for 1.5min, 100W for 2.5min, 50W continuous L50(150)A-BB-35 / L50(150)A-LP1-35 / L50(150)A-PF-35 30(150)A-BB-18 / 30(150)A-LP1-18 64 27 49 24 66 64 42 35 64 17.5 64 13 15 8 (2x) M3x4.5 deep 19 (2x) M3 x 4 deep ADJUSTABLE 95-140 14.5 75 100 ADJUSTABLE 95-140 17 75 32 01.08.2013 150W / 50W /5W 4mW 3 2 4 1 50mJ - 300J 300J / 30J / 3J 50 Singel (b) 18-50Hz (b) 0.3 0.05 0.3 0.05 3 (c) 1.5 5 20 5 20 7 7 10 50 10 50 15 15 30 250 30 250 40 40 convection / ballistic convection / ballistic convection / ballistic convection / ballistic convection / ballistic ST, FC, SMA, SC ST, FC, SMA, SC ST, FC, SMA, SC ST, FC, SMA, SC ST, FC, SMA, SC 0.3 0.3 0.35 0.35 0.35 (a) LP1 sensors have relatively large spectral variation in absorption and have a calibrated spectral curve at all wavelengths in their spectral range to the above specified accuracy. Nova and Orion meters do not support this feature and when used with those meters, accuracy will be ±3% for 532nm, 808nm, 1064nm and 2100nm and ±6% for other wavelengths in the spectral range 400 – 1100nm. 22 PF 0.15-20 φ 35mm For latest updates please visit our website: www.ophiropt.com/photonics 100 7Z02737 (b) For 10-50Hz, derate as follows: Wavelength Derate to value 1064nm Not derated 532n Not derated 355n 70% of stated value 266nm 15% of stated value 193nm 10% of stated value (c) Damage threshold 1.5J/cm² for wavelengths <500nm 1.1.2.3 Low - Medium Power Thermal Sensors - Apertures to 35mm 30(150)A-SV-17 / 30(150)A-HE-17 Features ֺֺ Special purpose SV and HE absorbers ֺֺ For concentrated beams and pulses ֺֺ Convection air cooled ֺֺ CW to 30W, intermittent to 150W ֺֺ φ17mm aperture 30(150)A-HE-DIF-17 Diffuser installed Diffuser off Model 30(150)A-SV-17 30(150)A-HE-17 30(150)A-HE-DIF-17 Use High power and energy density Absorber Type Spectral Range µm Aperture mm Power Mode Power Range Maximum Intermittent Power W Power Scales Power Noise Level Maximum Average Power Density kW/cm2 Response Time with Meter (0-95%) typ. s Power Accuracy +/-% Linearity with Power +/-% Energy Mode Energy Range Energy Scales Minimum Energy mJ Damage Threshold J/cm2 SV 0.19 - 12 φ 17mm High energy and average power pulsed lasers HE 0.19 - 0.625, 1.064, 2.1, 2.94 φ 17mm Concentrated beam pulsed lasers - has removable diffuser HE 0.19 - 3 except for 0.625 - 0.9 (b) φ 17mm 100mW - 150W (a) <100ns 1 0.5ms 20 2ms 50 convection / ballistic ST, FC, SMA, SC 0.3 Cooling Fiber Adapters Available (see page 44) Weight kg Version Part number 50mW - 150W 50mW - 150W 150W for 1.5min, 100W for 2.2min, 30W continuous 150W / 30W / 3W 150W / 30W / 3W 3mW 3mW 0.5 0.5 3.8 3.8 3 5 (b) 1.5 1.5 150W / 30W / 3W 5mW 60 at 150W 1.7 3 1 50mJ - 300J 300J / 30J / 3J 50 Pulse width Single 10-50Hz 1 20 50 60mJ - 200J 200J / 30J / 3J 60 Pulse width Single 10-50Hz (a) <100ns 5 0.5ms 100 2ms 150 convection / ballistic ST, FC, SMA, SC 0.3 7Z02724 Notes: 2 25 40 7Z02722 30(150)A-SV-17 / 30(150)A-HE-17 30(150)A-HE-DIF-17 82 64 3.8 75 64 17 64 REMOVABLE DIFFUSER ASSEMBLY ADJUSTABLE 95-140 17.5 100 48 25 49 (2x) M3 x 3 deep ADJUSTABLE 95-140 13.5 21 16 19 64 17 12 (b) With diffuser in, sensor is only calibrated for 1064, 532 and 355nm wavelengths. 19 21 60mJ - 200J 200J / 30J / 3J 60 Pulse width <100ns, 10 - 50Hz Wavelength DIF IN DIF OUT 1064nm 5 2 532nm 4 2 355nm 1.5 1 convection / ballistic NA 0.4 7Z02729 (a) At 1064nm. For shorter wavelengths derate maximum energy density to: 355nm 50% of above values 266nm 50% of above values 193nm 10% of above values 48 1.1.2.3 Sensors 50mW to 150W 75 100 33 For latest updates please visit our website: www.ophiropt.com/photonics 01.08.2013 1.1.2.4 Medium Power Large Aperture Thermal Sensors - Apertures 50mm 100mW to 150W 1.1.2.4 Sensors Features ֺֺ Thin profile ֺֺ CW to 35W or 50W, intermittent to 150W ֺֺ 50mm aperture ֺֺ For continuous, long pulse and excimer lasers L40(150)A / L40(150)A -LP1 L40(150)A -EX L50(150)A Model L40(150)A L40(150)A-LP1 L40(150)A-EX L50(150)A Use Absorber Type Spectral Range µm Aperture mm Power Mode Power Range Maximum Intermittent Power General purpose Broadband 0.19 - 20 φ 50mm Long pulse lasers LP1 0.25 - 2.2, 2.94 φ 50mm Excimer lasers EX 0.15 - 0.7, 10.6 φ 50mm General purpose Broadband 0.19 - 20 φ 50mm Power Scales Power Noise Level Maximum Average Power Density kW/cm2 Response Time with Meter (0-95%) typ. s Power Accuracy +/-% Linearity with Power +/-% Energy Mode Energy Range Energy Scales Minimum Energy mJ Maximum Energy Density J/cm2 <100ns 1µs 0.5ms 2ms 10ms Cooling Fiber Adapters Available (see page 44) Weight kg Version Part number: Standard Sensor StarLink Sensor: Direct USB link to PC (p. 42) 100mW - 150W 100mW - 150W 100mW - 150W 150W for 3min, 80W for 5.5min, 35W continuous 150W / 20W 5mW 12 at 150W 20 at 35W 2.5 3 1 150W / 20W 10mW 38 at 150W 90 at 35W 2.5 3 (a) 1 150W / 20W 5mW 2 2.5 3 1 100mW - 150W 150W for 4min, 100W for 6min, 50W continuous 150W / 20W 5mW 12 at 150W 17 at 50W 2.5 3 1 100mJ - 200J 200J / 30J / 3J 100 100mJ - 300J 300J / 30J / 3J 100 100mJ - 200J 200J / 30J / 3J 100 100mJ - 300J 300J / 30J / 3J 100 0.3 0.5 5 10 30 convection / ballistic ST, FC, SMA, SC 0.6 V2 7Z02626 0.05 0.3 20 50 250 convection / ballistic ST, FC, SMA, SC 0.6 V2 7Z02685S 0.5 0.6 6 12 25 convection / ballistic NA 0.6 V1 7Z02614 0.3 0.5 5 10 30 convection / ballistic ST, FC, SMA, SC 0.6 7Z02633 787003 Notes: (a) LP1 sensors have relatively large spectral variation in absorption and have a calibrated spectral curve at all wavelengths in their spectral range to the above specified accuracy. Nova and Orion meters do not support this feature and when used with those meters, accuracy will be ±3% for 532nm, 808nm, 1064nm and 2940nm and ±6% for other wavelengths in the spectral range 400 – 1100nm. L40(150)A / L40(150)A -LP1 / L40(150)A -EX L50(150)A 34 01.08.2013 For latest updates please visit our website: www.ophiropt.com/photonics 1.1.2.4 Medium Power Large Aperture Thermal Sensors - Apertures 65mm 400mW to 300W L50(300)A / L50(300)A-LP1 / L50(300)A-PF-65 L50(300)A-IPL Model L50(300)A L50(300)A-LP1 L50(300)A-PF-65 L50(300)A-IPL Use General purpose Long pulse lasers Absorber Type Spectral Range µm Aperture mm Power Mode Power Range Maximum Intermittent Power Power Scales Power Noise Level Maximum Average Power Density kW/cm2 Response Time with Meter (0-95%) typ. s Power Accuracy +/-% Broadband 0.19 - 20 φ 65mm LP1 0.25 - 2.2 φ 65mm Large beam short pulsed lasers PF type 0.15 - 20 φ 65mm Intense pulsed light sources LP1 + coated window (b) 0.5 - 1.1 φ 65mm 400mW - 300W 300W / 30W 20mW 9 at 300W 17 at 50W 3 3 400mW - 300W 400mW - 300W 300W for 2min, 150W for 4.5min, 50W continuous 300W / 30W 300W / 30W 20mW 20mW 23 at 300W 75 at 50W 3 3 3 3 (a) 3 Linearity with Power +/-% Energy Mode Energy Range Energy Scales Minimum Energy mJ Maximum Energy Density J/cm2 <100ns 1µs 0.5ms 2ms 10ms Cooling Weight kg Version Part number 1 1 1 200mJ - 300J 300J / 60J / 6J 200 200mJ - 300J 300J / 60J / 6J 200 120mJ - 300J 300J / 60J / 6J 120 0.3 0.5 5 10 30 convection / ballistic 0.9 0.05 0.3 20 40 100 convection / ballistic 0.9 V1 7Z02641S 200mJ - 300J 300J / 60J / 6J 200 Single (C)10-50Hz (C) 3 (d)1.5 3 (d)1.5 7 7 15 15 40 40 convection / ballistic 0.9 7Z02743 7Z02651 (c) For 10-50Hz, derate as follows: Wavelength Derate to value 1064nm Not derated 532nm Not derated 70% of stated value 355nm 266nm 15% of stated value 193nm 10% of stated value (d) Damage threshold 1.5J/cm2 for wavelengths <500nm (b) Sensor has a window for gel coupled IPL sources where IPL source is coupled to window with gel or water for measurement. Can also measure air coupled IPLs Notes: 7Z02658 (a) LP1 sensors have relatively large spectral variation in absorption and have a calibrated spectral curve at all wavelengths in their spectral range to the above specified accuracy. Nova and Orion meters do not support this feature and when used with those meters, accuracy will be ±3% for 532nm, 808nm, 1064nm and 2100nm and ±6% for other wavelengths in the spectral range 400 – 1100nm. 1.1.2.4 Sensors Features ֺֺ Thin profile, very large aperture ֺֺ CW to 50W, intermittent to 300W ֺֺ φ65mm aperture ֺֺ IPL version for IPL medical light sources 400mW - 300W 300W / 30W 20mW 20 3 6 for most gel or air coupled IPL sources 1 0.05 0.3 20 40 100 convection / ballistic 1.0 L50(300)A / L50(300)A-LP1 / L50(300)A-PF-65 / L50(300)A-IPL 35 For latest updates please visit our website: www.ophiropt.com/photonics 01.08.2013 1.1.2.5 Medium-High Power Fan Cooled Thermal Sensors 50mW to 250W F100A-PF-DIF-18 F150A-BB-26 FL250A-LP1-DIF-33 FL250A-BB-35 / FL250A-LP1-35 1.1.2.5 Sensors Features ֺֺ General purpose and high damage threshold ֺֺ Fan cooled ֺֺ Up to 250W ֺֺ φ17.5mm to φ35mm apertures Model Use Absorber Type Spectral Range µm Aperture mm Power Mode Power Range (d) Power Scales Power Noise Level (d) Maximum Average Power Density kW/cm2 Response Time with Meter (0-95%) typ. s Power Accuracy +/-% Linearity with Power +/-% Energy Mode Energy Range Energy Scales Minimum Energy mJ (d) Maximum Energy Density J/cm2 <100ns 0.5ms 2ms 10ms Cooling Fiber Adapters Available (see page 44) Weight kg Version Part number: Standard Sensor BeamTrack Sensor: Beam, Position & Size (p.57/58) Notes: (a) For shorter wavelengths derate maximum energy density as follows: F100A-PF-DIF-18 / F100A-PF-DIF-33 Short pulse lasers F150A-BB-26 FL250A-BB-35 FL250A-LP1-35 FL250A-LP1-DIF-33 General purpose General purpose PF type + diffuser 0.24-2.2 φ 17.5mm / φ 33mm Broadband 0.19 - 20 φ 26mm Broadband 0.19 - 20 φ 35mm High power density and long pulse lasers LP1 0.25 - 2.2 φ 35mm Diffuser for highest energy densities LP1 + diffuser 0.4 - 3 φ 33mm 50mW - 100W 100W / 30W / 3W 6mW 0.5 2 / 2.5 5 1.5 50mW - 150W 150W / 30W / 3W 3mW 12 at 150W 17 at 50W 1.5 3 1 150mW - 250W 250W / 30W 15mW 10 at 250W 12 at 150W 2 3 1 150mW - 250W 250W / 30W 15mW 27 at 250W 39 at 150W 2 3 (c) 1 400mW - 250W 250W / 30W 20mW(e) 2 2.5 3 (b) 1.5 60mJ - 200J 200J / 30J / 3J 60 20mJ - 100J 50mJ - 300J 100J / 30J / 3J / 300mJ 300J / 30J / 3J 20 50 50mJ - 300J 300J / 30J / 3J 50 400mJ - 600J 600J / 60J 400 4(a) 15(a) 35(a) 50(a) fan NA 0.4 / 0.8 0.3 5 10 30 fan ST, FC, SMA, SC 0.35 0.3 5 10 30 fan ST, FC, SMA, SC 0.4 0.05 20 50 250 fan ST, FC, SMA, SC 0.4 0.5 200 400 1000 fan NA 0.45 7Z02741 / 7Z02744 7Z02727 7Z07901 7Z02728 7Z02731S 7Z02733 Wavelength Derate to value Notes: (b) at calibrated wavelengths 755nm, 1064nm not derated 1064nm and 532nm only 532nm 80% of stated value 355nm 60% of stated value Notes: (e) When sensor 266nm 40% of stated value is hot, there can be large 193nm NA zero offset up to 300mW Notes: (c) LP1 sensors have relatively large spectral variation in absorption and have a calibrated spectral curve at all wavelengths in their spectral range to the above specified accuracy. Nova and Orion meters do not support this feature and when used with those meters, accuracy will be ±3% for 532nm, 808nm, 1064nm and 2100nm and ±6% for other wavelengths in the spectral range 400 – 1100nm. Notes: (d) For lower powers up to 30W it is recommended to work with the fan off and then the noise level is ~3 times lower. It is also recommended to measure energy with the fan off. F100A-PF-DIF-33 111 9 F100A-PF-DIF-18 F150A-BB-26 F150A-BB-26 104 90 35 80 93 33 12 64 34 62 64 33 26 18 64 64 47 24 6 ADJUSTABLE 108-153 26 100 100 FL250A-BB-35 / FL250A-LP1-35 64 REV. 1 18 APPR. A.R. SIGN. DATE 09.11 6 17 50 22 DRAWN E.K. REV. 1 NAME DRAWN E.K. APPR. A.R. ADJUSTABLE 95-140 SIGN. DATE 11.10 (2x) M3x4.5 deep 01.08.2013 75 18 NAME SIGN. DATE 12.09 T.M. A.R. 23 14.5 19 7 75 100 REV. 1 DRAWN APPR. NAME U.P. A.R. SIGN. DATE 12.09 For latest updates please visit our website: www.ophiropt.com/photonics 18.5 ADJUSTABLE 107-153 13.5 DC Power Supply Socket 36 106 90 33 8 NAME APPR. 73 4 35 18 DRAWN 106 FL250A-LP1-DIF-33 64 42 15 REV. 1 100 75 80 95 DC POWER Supply Socket 64 75 (2x) M3 x 4 deep ADJUSTABLE 95-140 14.5 ADJUSTABLE 95-140 90 23 18 8 8 19 13 22 90 47 18 24 DC Power Supply Socket 100 REV. 1 NAME DRAWN U.P. APPR. A.R. SIGN. DATE 12.09 1.1.2.5 Medium-High Power Fan Cooled Thermal Sensors 150mW to 500W Features ֺֺ High powers and energies, large apertures ֺֺ Fan cooled ֺֺ Up to 500W ֺֺ φ50mm and φ65mm apertures FL250A-BB-50 / FL500A / FL400A-BB-50 / FL500A-LP1 Model FL250A-BB-50 FL400A-BB-50 FL400A-LP-50 FL500A Use General purpose General purpose Absorber Type Spectral Range µm Aperture mm Power Mode Power Range (a) Power Scales Power Noise Level (a) Maximum Average Power Density kW/cm2 Response Time with Meter (0-95%) typ. s Power Accuracy +/-% Linearity with Power +/-% Energy Mode Energy Range Energy Scales Minimum Energy mJ (a) Maximum Energy Density J/cm2 <100ns 1µs 0.5ms 2ms 10ms Cooling Fiber Adapters Available (see page 44) Weight kg Version Part number: Standard Sensor BeamTrack Sensor: Beam, Position & Size (p.58) Broadband 0.19-20 φ 50mm Broadband 0.19 - 20 φ 50mm High power densities and long pulses LP 0.4 - 1.5, 10.6 φ 50mm Very large aperture High power densities and long pulses Broadband LP1 0.19 - 20 0.25 - 2.2 φ 65mm φ 65mm 150mW - 250W 250W / 30W 10mW 10 at 250W 12 at 150W 2.5 3 1 300mW - 400W 400W / 50W 40mW 8 at 400W 12 at 150W 2.8 3 1.5 300mW - 400W 400W / 50W 40mW 10 at 400W 14 at 150W 2.8 3 1.5 500mW - 500W 500W / 50W 25mW 7 at 500W 12 at 150W 2.8 3 1.5 500mW - 500W 500W / 50W 25mW 16 at 500W 39 at 150W 2.8 3(b) 1.5 80mJ - 300J 300J / 30J / 3J 80 75mJ - 600J 600J / 60J / 6J 75 75mJ - 600J 600J / 60J / 6J 75 100mJ - 600J 600J / 60J / 6J 100 100mJ - 600J 600J / 60J / 6J 100 0.3 0.5 5 10 30 fan ST, FC, SMA, SC 0.8 0.3 0.5 5 10 30 fan ST, FC, SMA, SC 0.9 0.05 0.3 20 50 150 fan ST, FC, SMA, SC 0.9 0.3 1 5 10 30 fan NA 2.7 0.05 0.3 15 40 200 fan NA 2.7 7Z02739 7Z07902 7Z02734 7Z02735 7Z02648 7Z02667S 1.1.2.5 Sensors FL400A-LP-50 FL500A-LP1 Notes: (a) For lower powers up to 50W it is recommended to work with the fan off and then the noise level is ~3 times lower. It is also recommended to measure energy with the fan off. Notes: (b) LP1 sensors have relatively large spectral variation in absorption and have a calibrated spectral curve at all wavelengths in their spectral range to the above specified accuracy. Nova and Orion meters do not support this feature and when used with those meters, accuracy will be ±3% for 532nm, 808nm, 1064nm and 2100nm and ±6% for other wavelengths in the spectral range 400-1100nm. FL500A / FL500A-LP1 FL250A-BB-50 / FL400A-BB-50 / FL400A-LP-50 105 (2x) M3x4.5 deep 72 90 106 58 18 23 18 19 18.5 7 17 90 50 ADJUSTABLE 107-153 75 DC Power Supply Socket 100 REV. 1 DRAWN APPR. NAME U.P. A.R. SIGN. DATE 12.09 37 For latest updates please visit our website: www.ophiropt.com/photonics 01.08.2013 1.1.2.6 High Power Water Cooled Thermal Sensors and Power Pucks 1W to 300W 1.1.2.6 Sensors Features ֺֺ High powers ֺֺ Water cooled ֺֺ Up to 300W ֺֺ φ50mm aperture L250W / L300W-LP Model L250W L300W-LP Use General purpose Absorber Type Spectral Range µm Aperture mm Power Mode Power Range Power Scales Power Noise Level Maximum Average Power Density kW/cm2 Response Time with Meter (0-95%) typ. s Power Accuracy +/-% Linearity with Power +/-% Energy Mode Energy Range Energy Scales Minimum Energy mJ Maximum Energy Density J/cm2 <100ns 1µs 0.5ms 2ms 10ms Cooling Minimum Water Flow Rate at Full Power Weight kg Version Part number Broadband 0.19 - 20 φ 50mm High power densities and long pulses LP 0.4 - 1.5, 10.6 φ 50mm 1W - 250W 250W / 30W 50mW 10 at 250W 14 at 100W 2.5 3 2 4W - 300W 300W / 30W 200mW 11 at 300W 14 at 150W 2.5 3 (a) 2 120mJ - 200J 200J / 30J / 3J 120 200mJ - 300J 300J / 30J / 3J 200 0.3 0.5 5 10 30 water 1 liter/min (b) 0.6 0.05 0.3 20 50 150 water 1 liter/min (b) 0.6 7Z02688 7Z02689 Notes: (a) Notes: (b) Calibrated for 1.064µm and 10.6µm Water temperature range 18-30°C. Water temperature rate of change <1°C/min. L250W / L300W-LP 38 01.08.2013 For latest updates please visit our website: www.ophiropt.com/photonics 1.1.2.6 High Power Water Cooled Thermal Sensors and Power Pucks 5W to 1500W 1000W / 1000W-LP L1500W / L1500W-LP Model 1000W 1000W-LP L1500W L1500W-LP Use General purpose General purpose Absorber Type Spectral Range µm Aperture mm Power Mode Power Range Power Scales Power Noise Level Maximum Average Power Density kW/cm2 Response Time with Meter (0-95%) typ. s Power Accuracy +/-% Linearity with Power +/-% Energy Mode Energy Range Energy Scales Minimum Energy mJ Maximum Energy Density J/cm2 <100ns 1µs 0.5ms 2ms 10ms Cooling Minimum Water Flow Rate at Full Power Weight kg Version Part number: Standard Sensor StarLink Sensor: Direct USB link to PC (p. 42) Broadband 0.19 - 20 φ 34mm High power densities and long pulses LP 0.4 - 1.5, 10.6 φ 34mm Broadband 0.19 - 20 φ 50mm High power densities and long pulses LP 0.4 - 1.5, 10.6 φ 50mm 5W - 1000W 1000W / 200W 200mW 7.5 at 500W 6 at 1000W 2.5 3 (a) 2 5W - 1000W 1000W / 200W 200mW 9 at 500W 7 at 1000W 2.5 3 (a) 2 15W - 1500W 1500W / 300W 700mW 7.5 at 500W 5 at 1500W 2.7 4 (a) 2 15W - 1500W 1500W / 300W 700mW 9 at 500W 6 at 1500W 2.7 4 (a) 2 300mJ - 300J 300J / 30J 300mJ 300mJ - 300J 300J / 30J 300mJ 500mJ - 200J 200J / 20J 500mJ 500mJ - 200J 200J / 20J 500mJ 0.3 0.4 5 10 30 water 1.8 liter/min (b) 0.8 V2 7Z02664 787005 0.05 0.3 20 50 150 water 1.8 liter/min (b) 0.8 V2 7Z02668 0.3 0.4 5 10 30 water 2.5 liter/min (b) 1.2 V1 7Z02661 0.05 0.3 20 50 150 water 2.5 liter/min (b) 1.2 V1 7Z02665 Notes: (a) Notes: (b) 1000W / 1000W-LP Calibrated for ~0.8µm 1.064µm Calibrated for 1.064µm and Calibrated for ~0.8µm 1.064µm and 10.6µm 10.6µm and 10.6µm Water temperature range 18-30°C. Water temperature rate of change <1°C/min. 1.1.2.6 Sensors Features High powers Water cooled Up to 1500W φ34mm and φ50mm apertures Calibrated for 1.064µm and 10.6µm L1500W / L1500W-LP 39 For latest updates please visit our website: www.ophiropt.com/photonics 01.08.2013 1.1.2.6 High Power Water Cooled Thermal Sensors and Power Pucks 100W to 30kW Features ֺֺ Highest powers ֺֺ Water cooled ֺֺ Up to 30kW ֺֺ φ74mm apertures Model 30K-W Use Absorber Type Spectral Range µm Aperture mm Power Range Power Scales Power Noise Level Backscattered Power Maximum Average Power Density kW/cm2 Response Time with Display (0-95%) typ. s Power Accuracy +/-% Linearity with Power +/-% Cooling Minimum Water Flow Rate at Full Power Water Pressure Requirements Highest powers to 30kW Beam deflector + broadband absorber 0.8 – 2, 10.6µm (a) φ74mm 100W – 30kW 30kW / 6kW / 600W 1W Approximately 4% 10kW/cm² anywhere in the beam (c) 7s 5 (a) 2 Water (b) 25 liter/min Pressure drop across sensor ~0.2MPa. Pressure drop across 8 meters of ½” tubing with 9.5mm ID is ~0.3MPa Quick connector for ½” OD, 3/8” ID nylon tubing 10 meters 19 V1 7Z02746 Water Connectors Cable Length Weight Kg Version Part number Notes: (a) Notes: (b) Notes: (c) 1.1.2.6 Sensors 30K-W Calibrated for 1.07µm Water inlet temperature range 15-20°C. Water temperature rate of change <1°C/min. For beam centered within ¼ of beam diameter. IMPROPERLY CENTERED BEAM CAN CAUSE DAMAGE TO SENSOR. Maximum tilt angle ±5 degrees. 30K-W 286 105 HANDLE 229 300 7 30° 143 74 23 30 ° 84 30° 1/4" NPT THREAD SIZE CABLE ADJUSTABLE 180-275 20 QUICK CONNECT FITTING FOR 1/2" NYLON TUBING 140 300 40 For latest updates please visit our website: www.ophiropt.com/photonics 01.08.2013 1.1.2.6 High Power Water Cooled Thermal Sensors and Power Pucks 1.1.2.6 Sensors 20W to 10kW Features Highest powers Water cooled Up to 10kW φ45mm and φ50mm apertures 5000W / 5000W-LP 10K-W Model 5000W 5000W-LP 10K-W Use General purpose Absorber Type Broadband High power densities and long pulses LP Spectral Range µm Aperture mm Power Mode Power Range Power Scales Power Noise Level Maximum Average Power Density kW/cm2 Response Time with Meter (0-95%) typ. s Power Accuracy +/-% Linearity with Power +/-% Energy Mode Energy Range Energy Scales Minimum Energy mJ Maximum Energy Density J/cm2 <100ns 1µs 0.5ms 2ms 10ms Cooling Minimum Water Flow Rate at Full Power Weight kg Version Part number 0.19 - 20 φ 50mm 0.4 - 1.5, 10.6 φ 50mm Highest powers and power densities Beam deflector + broadband absorber 0.8 - 2, 10.6 φ45mm 20W - 5000W 5000W / 500W 1W 6 at 1000W 3 at 5000W 3 5 (a) 2 20W - 5000W 5000W / 500W 1W 7 at 1000W 4 at 5000W 3 5 (a) 2 100W - 10kW 10kW / 1kW 2W See note (c) below 2.7 5 (a) 2 NA NA NA NA NA NA 0.3 0.4 5 10 30 water 4.5 liter/min (b) 2.8 0.05 0.3 20 50 150 water 4.5 liter/min (b) 2.8 NA NA NA See note (c) below 7Z02119 7Z02255 Notes: (a) Notes: (b) Notes: (c) 5000W / 5000W-LP Calibrated for ~0.8µm 1.064µm and Calibrated for 1.064µm and 10.6µm Calibrated for 1.064µm and 10.6µm 10.6µm Water temperature range 18-30°C. Water temperature rate of change <1°C/min. Beam diameter Max power density Max energy density 1ms pulse width 3ms pulse width 10ms pulse width 2 <15mm 10kW/cm 30J/cm2 60J/cm2 150J/cm2 2 2 15 - 20mm 7kW/cm 20J/cm 40J/cm2 100J/cm2 20 - 40mm 5kW/cm2 15J/cm2 30J/cm2 70J/cm2 40 - 45mm 4kW/cm2 12J/cm2 25J/cm2 60J/cm2 10K-W 40A 01.08.2013 water 9 liter/min (b) 4.5 V1 7Z02645 For latest updates please visit our website: www.ophiropt.com/photonics 1.1.2.6 High Power Water Cooled Thermal Sensors and Power Pucks 20W to 10kW Comet 1K Comet 10K-HD Comet 10K Model Comet 1K Comet 10K Comet 10K-HD Use Absorber Type For powers to 1kW Broadband For powers to 10kW Broadband Spectral Range µm Aperture mm Power Mode Power Range Repeatability Maximum Average Power Density kW/cm2 0.2 - 20 φ50mm 1.06 and 10.6 φ100mm For high power density beams Broadband with reflective cone beam spreader 1.06 and 10.6 φ55mm 20W to 1kW Power 1K Model 100W 10 200W 8 300W 6 500W 5 1kW 4 5 ±2% ±1W from 20W to 1kW 100W4 200W to 10kW ±1% for same initial temperature Power Damage Threshold 1kW 3.5 2kW 2.8 3kW 2.5 5kW 1.5 10kW 1 5 ±2% from 1kW to 10kW 1kW4 Power Beam dia <40 Beam dia >40 1kW 10 7 2kW 10 6 3kW 8 5 5kW 6 3 10kW 4 2 5 ±2% from 1kW to 10kW 1kW4 300W3 400W2 1kW 1 3kW3 4kW2 10kW 1 3kW3 4kW2 10kW 1 Power Accuracy +/-% Linearity with Power +/-% Number of readings before probe must be cooled (for 25°C starting temp.) Maximum Energy Density J/cm2 <100ns 10µs 1ms 10ms Time to Reading Temperature Compensation Maximum Permitted Probe Temperature Display Operation Mode Battery Weight kg Version Part number Comet 1K 1.1.2.6 Sensors Features ֺֺ Comet power pucks measure heat rise from 10s exposure to laser ֺֺ Accurate, built in temperature compensation algorithm. ֺֺ Up to 10kW ֺֺ Up to 100mm apertures 200W to 10kW 0.3 0.3 1 1 1 3 10 10 30 50 50 150 Initial reading 10s after exposure, final Initial reading 20s after exposure, Initial reading 30s after exposure, reading 20s after exposure final reading 40s after exposure final reading 70s after exposure Temperature compensated to give accurate readings independent of starting probe temperature 70°C before measurement, 140°C after measurement 2x8 character LCD. Character height 5mm. CE Approved. AUTO: Automatic measurement with laser set to 10s timed exposure. Unit senses temperature rise and measures automatically. MANUAL: User places probe in front of beam for 10s. Unit beeps to indicate start and stop measurement points. History: Stores last three readings. Calibration: Can be recalibrated by user. 2 x AA. Lifetime in normal use approximately 1 year. 0.3 1.2 1.2 V1 V2 7Z02702 7Z02705 7Z02706 Comet 10K Comet 10K-HD 41 For latest updates please visit our website: www.ophiropt.com/photonics 01.08.2013 1.1.3 StarLink Direct to PC Power Sensors The StarLink Power Sensor Series 1.1.3 Sensors The StarLink series is a select group of Ophir power sensors that are provided with the Ophir Juno USB PC interface attached. The StarLink sensor is connected via a USB cable to the PC USB port and can then operate directly with the PC with no need for an Ophir power meter. The StarLink package comes bundled with the celebrated Ophir StarLab software – the easiest to use and most sophisticated power/energy meter PC software available. Alternatively, StarLink sensors can be operated from the user’s software via the COM Object interface provided or can work with LabVIEW via the drivers provided. For more details about the computer interface options and StarLab softwrare, see section 2.3.1 on page 105. Below is a list of the StarLink power sensors currently available together with the reference page for the specifications on the relevant sensor. StarLink Sensor StarLink P/N Corresponding stand alone sensor Ophir P/N Data sheet page PD300-StarLink 3A-StarLink 3A-QUAD-StarLink 3A-P-StarLink 3A-FS-StarLink 10A-StarLink 10A-PPS-StarLink 30A-BB-18-StarLink 50(150)A-BB-26-PPS-StarLink 30(150)A-BB-18-StarLink L50(150)A-StarLink FL250A-BB-50-PPS-StarLink 1000W-StarLink 787100 787000 787203 787001 787002 787004 787202 787006 787200 787007 787003 787201 787005 PD300 3A 3A-QUAD 3A-P 3A-FS 10A 10A-PPS 30A-BB-18 50(150)A-BB-26-PPS 30(150)A-BB-18 L50(150)A FL250A-BB-50-PPS 1000W 7Z02410 7Z02621 7Z07934 7Z02622 7Z02628 7Z02637 7Z07904 7Z02692 7Z07900 7Z02699 7Z02633 7Z07902 7Z02664 22 28 56 28 28 30 56 30 57 32 34 58 39 42 01.08.2013 For latest updates please visit our website: www.ophiropt.com/photonics 1.1.4 Power Sensors Accessories 1.1.4.1 Accessories for PD300 Sensors (For PD300R, PD300-IRG and 3A-IS series, see page 44) Fiberoptic Adapters Accessory Description Part number PD300-CDRH φ7mm aperture adapter for CDRH measurements Adapters for mounting fibers to PD300 sensors as shown below 7Z02418 Fiber Adapters PD300 F.O. Adapter PD300-FO-SMA PD300-FO-ST 1.1.4 Sensors PD300 with F.O. Adapter Mounted SC type ST type FC, FC/APC type SMA type 7Z08221 7Z02210 7Z02213 7Z02212 PD300-FO-FC PD300-FO-SC 43 For latest updates please visit our website: www.ophiropt.com/photonics 01.08.2013 1.1.4.2 Accessories for Thermal Sensors, PD300R, PD300-IRG, 3A-IS and FPS-1 Fiberoptic Adapters and Voltage Converter 1.1.4.2 Sensors SC fiber adapter ST fiber adapter FC fiber adapter Sensor Series Thermal Sensors 3A / 3A-QUAD / 3A-P / 3A-P-QUAD / 3A-FS / 3A-P-THz 10A / 10A-PPS / 10A-P 12A / 12A-P 30A-BB-18 / 30A-N-18 50(150)A-BB-26 / 50(150)A-BB-26-PPS / F150A-BB-26 / F150A-BB-26-PPS L50(150)A-BB-35 / L50(150)A-LP1-35 / L50(150)A-PF-35 30A-P-17 / 30(150)A-SV-17 / 30(150)A-HE-17 30(150)A-BB-18 / 30(150)A-LP1-18 L40(150)A / L40(150)A-LP1 / L50(150)A FL250A-BB-35 / FL250A-BB-50-PPS / FL250A-LP1-35 FL400A-BB-50 / FL250A-BB-50 Photodiode Sensors PD300R series and FPS-1 3A-IS / 3A-IS-IRG PD300-IRG General Accessories SH to BNC Adapter IR Phosphor Card Female SM1 to SM1 Adapter SMA fiber adapter Fiber adapter mounting bracket (1 bracket fits all fiber adapters) SC fiber adapter ST fiber adapter FC, FC/APC SMA fiber fiber adapter adapter 7Z08227 7Z08226 7Z08229 1G01236 7Z08227 7Z08227 7Z08226 7Z08226 7Z08229 7Z08229 7Z08216 1G01236 1G01236 7Z08222 not needed not needed not needed 7Z08211 7Z08210 7Z08265 7Z08230 7Z08211 7Z08238 (a) 7Z08265 7Z08212 1G02259 7Z08213 not needed Allows connection of sensor to voltage measuring device for measurement of 7Z11010 raw voltage output. Glass slide (75x25mm) with phosphor coating (25x50mm) that visualizes spectral region 810-860nm, 900-1100nm and 1500-1600nm. Stands up to 1kW/cm² and 7F01235A 0.5J/cm². Self actuating, does not need charging from light source. For mounting PD300R and FPS-1 to SM1 optical components and systems 1G02260 Note: (a) The fiber mounting bracket for these sensors is a triple adapter for mounting up to three different fibers looking at same spot SC fiber adapter ST fiber adapter FC fiber adapter SMA fiber adapter SM1 to M20 Adapter Mounting Bracket for PD300R Series 30A with input 30AF.O. WITH F.O. input FL250A WITH F.O. input 53 26 Allows PD300R models to be used 95 F.O. ADAPTER MOUNTING BRACKET 64 with above fiber adapters 64 64 F.O. ADAPTER MOUNTING BRACKET and FPS-1, P/N 1G02259 FL250A with F.O. input SH to BNC adapter Allows raw voltage output from F.O. ADAPTER thermal sensors F.O. ADAPTER 75 REV. 1 NAME DRAWN T.M. APPR. A.R. SIGN. DATE 12.09 75 REV. 1 DRAWN APPR. NAME T.M. A.R. SIGN. DATE 12.09 44 01.08.2013 For latest updates please visit our website: www.ophiropt.com/photonics IR Phosphor Glass 1.1.4.3 High Power Water Cooled and Fan Cooled Laser Beam Dumps Up to 10kW Model BD10K-W BD5000W-BB-50 BDFL500A-BB-50 BD5000W-BB-50 Use 1.1.4.3 Sensors BDFL500A-BB-50 Features ֺֺ Up to 10kW CW ֺֺ Water or Fan cooled ֺֺ High Power Density ֺֺ φ45-50mm aperture BD10K-W General purpose High power beam dump Absorber Type Spectral Range µm Typical Absorption Aperture mm Maximum Incident Power Maximum Average Power Density Broadband 0.19 - 20 Broadband 0.19 - 20 86% for 600 to 2500nm, 82% for 10.6µm φ 50mm 5000W 6kW/cm2 at 1000W 3kW/cm2 at 5000W φ 50mm 500W 7kW/cm2 Maximum Energy Density J/cm2 <100ns 1µs 0.5ms 2ms 10ms Cooling Minimum Water Flow Rate at Full Power Weight kg Version Part number Notes: (a) Notes: (b) Max power and energy density Beam Deflector + Broadband 0.19 - 20 φ 45mm 10,000W See note (b) below See note (b) below 0.3 0.4 5 10 30 Fan N/A 0.9 water 4.5 liter/min (a) 2.8 water 9 liter/min (a) 4.5 7Z17200 7Z17201 7Z17202 Water temperature range 18-30°C. Water temperature rate of change <1°C/min Beam diameter Max power density Max energy density 1ms pulse width 2 <15mm 10kW/cm 30J/cm2 15 - 20mm 7kW/cm2 20J/cm2 20 - 40mm 5kW/cm2 15J/cm2 2 40 - 45mm 4kW/cm 12J/cm2 BDFL500A-BB-50BDFL500A-BB-50 BD5000W-BB-50 3ms pulse width 60J/cm2 40J/cm2 30J/cm2 25J/cm2 10ms pulse width 150J/cm2 100J/cm2 70J/cm2 60J/cm2 106 90 105 58 72 50 7 16.5 18.5 23 90 18 DC POWER Supply Socket ADJUSTABLE 107-153 75 (2x) M3 x 4.5 deep 100 REV. BD10K-W 1 NAME DRAWN T.M. APPR. A.R. SIGN. DATE 12.09 BD10K-W-Beam Dump 71 146 45 55 18.5 OUT ADJUSTABLE 135-180 30° 30° IN 1/8" NPT THREAD SIZE QUICK CONNECT FITTING FOR 3/8" PLASTIC HOSE 75 100 REV. 1 NAME DRAWN U.P. APPR. A.R. SIGN. DATE 08.12 45 For latest updates please visit our website: www.ophiropt.com/photonics 01.08.2013 1.1.5 OEM Solutions Introduction 1.1.5 Sensors Many laser systems manufacturers need to have a measuring capability built into their systems. Ophir is the world’s leading supplier of OEM laser power/energy measurement instrumentation which can be built into host systems (such as medical, industrial, etc). With extensive experience accumulated in the field, Ophir offers the largest variety of OEM products and is therefore best able to satisfy customer requirements. Many configurations possible An OEM solution is usually needed to monitor laser performance in the system, and possibly to provide fast feedback for system control. Depending on your application, various configurations can be used, such as: ֺֺ ֺֺ ֺֺ ֺֺ Simple sensor, with raw analog output Sensor with electronics providing an analog or digital output Complete instrument, including numeric display and/or PC interface Custom designed solution for special requirements In the following pages, you will see a range of "standard" OEM sensors available; these are actually families of existing OEM sensors with typical specifications shown. They can be tailored as needed to fit your specific requirements. In addition to the products described below, Ophir has developed hundreds of other OEM solutions. Simply contact your Ophir representative who is likely to have just the right solution to your needs. 46 01.08.2013 For latest updates please visit our website: www.ophiropt.com/photonics Thermal OEM Sensors Ophir pioneered the compact self-contained laser power meter sensors with built-in amplifiers. These sensors are easy to install and give a calibrated voltage, proportional to power. They contain all the electronics needed including a speed up circuit to increase the speed of response of the sensor to the order of 1s, 0-95%. Connections to the sensors are simple, with the host providing DC power and the sensor providing a voltage output proportional to power. 1.1.5 Sensors In most cases, the sensor is used in one of three ways: 1. Beam Dump Mode For lasers, such as surgical lasers, which are used in short bursts, the sensor is a beam dump with full power on it at all times except for the short periods of beam use when the beam is deflected to the work area. 2.Sampling Mode In this mode, the laser is usually available to the user and is only deflected to the monitor for short times when the beam is sampled by the sensor. Sampling is performed with a deflection mirror or with an output fiber optic cable which is inserted into the measuring port from time to time. 3. Rear Leak Mode In this mode, a small fraction (0.5-2%) of the laser beam “leaks” out of the rear mirror of the laser and is constantly monitored by the sensor. 47 For latest updates please visit our website: www.ophiropt.com/photonics 01.08.2013 Advantages of Ophir Thermal OEM Sensors Compactness Available in sizes down to 38x38x25mm or 48x48x15mm. 1.1.5 Sensors Versatility Ophir offers OEM sensors for any type and wavelength of laser, for any power or configuration. Although the power measured usually ranges from 1-150 watts, the sensors can measure from tens of mW or mJ to Kilowatts or hundreds of Joules, and can be cooled with water, air or conduction. Ophir offers a large selection of standard OEM sensors at competitive prices and excellent delivery times. If required, the package, including the connectors, can be customized to customer specifications. Reliability and accuracy Ophir’s measuring sensors use the reliable and accurate thermopile disc principle: the output is a low impedance voltage proportional to power. The thermopile disc samples the entire beam, making it more accurate than silicon detectors. The thermopile provides a faster response than thermoelectric types. Suitable absorbers which will not burn out or change reading with high power density lasers are available for any application. Calibration Ophir sensors can be factory calibrated at all required wavelengths. In addition to the sensors described below, Ophir offers a number of other OEM sensors with larger aperture, diffusers in front, special absorbers, single sided amplifiers (± voltage and ground is not required, only + voltage and ground) and other special features. Ophir also offers an OEM version of the Nova power meter consisting of just circuit boards with no casing, as well as OEM sensors with RS232 or USB output instead of analog voltage. Possible configurations of thermal OEM solutions include: ֺֺ ֺֺ ֺֺ ֺֺ ֺֺ ֺֺ Disc with raw analog output Disc with separate amplifier board Sensor with either raw or amplified analog output Sensor with RS232 interface Sensor with USB interface Complete solution including sensor and meter 48 01.08.2013 For latest updates please visit our website: www.ophiropt.com/photonics 1.1.5.1 Standard OEM Thermal Sensors 10mW to 20W 20C-UAU 20C-A 1.1.5.1 Sensors Features 20C-SH ֺֺ Conduction cooled ֺֺ Spectrally flat ֺֺ “A” version gives analog voltage calibrated to power ֺֺ “UA” version can give analog voltage output or digital RS232 output and can measure power or energy. Can also have multiple switchable ranges and/or multiple switchable wavelengths ֺֺ "UAU" version is similar to the UA version but operates via the USB terminal of the PC These specifications refer to standard OEM sensors, and are to be understood as generic, describing sensor families. Ophir will be happy to help you with a specific solution for your particular application. Model 20C-SH 20C-A 20C-UAU Type Smart sensor Analog OEM sensor Features Compact smart sensor Compact, built in amplifier Absorber Type Spectral Range µm Aperture mm Power Mode Maximum power (a) Broadband 0.19 - 20 φ12 Broadband 0.19 - 20 (c) φ12 Digital USB connection digital output Compact, external amplifier board Broadband 0.19 - 20 (c) φ12 4W free standing 20W heat sinked 20mW 0.5mW 23 at 20W 35 at 4W 0.8 3 1 ±5V to ±18V regulated 4W free standing 20W heat sinked 10mW 0.2mW 23 at 20W 35 at 4W 0.8 3 1 Via host USB NA NA NA NA NA NA NA NA NA NA conduction 4 pin Molex (b) 38x38x34mm Consult Ophir representative NA NA NA NA conduction Mini B USB connector 38x38x14mm Consult Ophir representative 4W free standing 20W heat sinked Minimum power 10mW Power Noise Level 0.2mW Maximum Average Power Density kW/cm2 23 at 20W 35 at 4W Response Time (0-95%), typ. (sec) 0.8 Power Accuracy +/-% at calibrated wavelength 3 Linearity with Power +/-% 1 Amplifier power supply (for A, UAU versions) NA Energy Mode Maximum Energy 10J Minimum Energy 6mJ Energy Accuracy +/-% at calibrated wavelength 5 Maximum Energy Density J/cm2 <100ns 0.3 0.5ms 2 2ms 2 10ms 2 Cooling conduction Output Ophir smart plug Dimensions 38x38x14mm Part number 7Z02602 Note: (a) Note: (b) Note: (c) 20C-SH With analog “A” version, maximum power is also limited by maximum output voltage where output voltage is at most 2V less than input voltage. 4 pin Molex connections: +Voltage, -Voltage, Analog signal out, Ground Calibrated at customer selected wavelength 20C-A 20C-UAU 49 For latest updates please visit our website: www.ophiropt.com/photonics 01.08.2013 1.1.5.1 Standard OEM Thermal Sensors 80mW to 50W 1.1.5.1 Sensors Features ֺֺ Conduction cooled ֺֺ Spectrally flat ֺֺ “UA” version can give analog voltage output or digital RS232 output and can measure power or energy Can also have multiple switchable ranges and/or multiple switchable wavelengths ֺֺ "UAU" version is similar to the UA version but operates via the USB terminal of the PC L30C-SH L30C-UA These specifications refer to standard OEM sensors, and are to be understood as generic, describing sensor families. Ophir will be happy to help you with a specific solution for your particular application. Model L30C-SH Type Smart sensor Features Absorber Type Spectral Range µm Aperture mm Power Mode Maximum power (a) Minimum power Power Noise Level Maximum Average Power Density kW/cm2 Response Time (0-95%), typ. (sec) Power Accuracy +/-% at calibrated wavelength Linearity with Power +/-% Amplifier power supply (for UA, UAU versions) Energy Mode Maximum Energy Minimum Energy Energy Accuracy +/-% at calibrated wavelength Maximum Energy Density J/cm2 <100ns 0.5ms 2ms 10ms Cooling Output Dimensions Part number Note: (a) Note: (b) Note: (c) L30C-SH L30C-UA Digital USB connection digital output Medium aperture, built in amplifier Broadband 0.19 - 20 (c) φ26 10W free standing 50W heat sinked 80mW 4mW 17 at 50W 28 at 10W 1.5 3 1 NA 10W free standing 50W heat sinked 80mW 4mW 17 at 50W 28 at 10W 1.5 3 1 ±6V to ±24V 10W free standing 50W heat sinked 80mW 4mW 17 at 50W 28 at 10W 1.5 3 1 Via host USB 30J 30mJ 5 100J 30mJ 5 100J 30mJ 5 0.3 5 10 30 conduction Ophir smart plug 60x60x38mm 773434 0.3 5 10 30 conduction 6 pin Molex (b) 60x60x38mm Consult Ophir representative 0.3 5 10 30 conduction Mini B USB connector 60x60x38mm Consult Ophir representative With analog “UA” version, maximum power is also limited by maximum output voltage where output voltage is at most 2V less than input voltage. 4 pin Molex connections: +Voltage, -Voltage, Analog signal out, Ground 6 pin Molex connections: RS232 input, Ground, +Voltage, Analog signal out, high/low voltage or switch input when used, RS232 output Calibrated at customer selected wavelength L30C-UA 50 01.08.2013 L30C-UAU Digital RS232 connection analog or digital output Medium aperture smart sensor Medium aperture, built in amplifier Broadband Broadband 0.19 - 20 0.19 - 20 (c) φ26 φ26 For latest updates please visit our website: www.ophiropt.com/photonics 1.1.5.1 Standard OEM Thermal Sensors 60mW to 100W 100C-SH Features ֺֺ Conduction or water cooled ֺֺ Spectrally flat ֺֺ “UA” version can give analog voltage output or digital RS232 output and can measure power. Can also have multiple switchable ranges and/or multiple switchable wavelengths ֺֺ "UAU" version is similar to the UA version but operates via the USB terminal of the PC 1.1.5.1 Sensors 100C-UA/100C-UAU The following specifications refer to standard OEM sensors, and are to be understood as generic, describing sensor families. Ophir will be happy to help you with a specific solution for your particular application. Model 100C-SH 100C-UA 100C-UAU Type Smart sensor Digital USB connection digital output Low profile, separate amplifier Features Low profile, smart sensor Digital RS232 connection analog or digital output Low profile, separate amplifier Absorber Type Spectral Range µm Aperture mm Power Mode Maximum power (a) Broadband 0.19 - 20 φ 18 Broadband 0.19 - 20 (c) φ 18 Broadband 0.19 - 20 (c) φ 18 100W if used with suitable heat sink, 4W free standing 60mW 3mW 30 at 4W 14 at 100W 1.2 3 1 ±6V to ±24V 100W if used with suitable heat sink, 4W free standing 60mW 3mW 30 at 4W 14 at 100W 1.2 3 1 Via host USB NA NA NA NA NA NA NA NA conduction 6 pin Molex (b) 48x48x14.5mm Consult Ophir representative NA NA NA NA conduction Mini B USB connector 48x48x14.5mm Consult Ophir representative 100W if used with suitable heat sink, 4W free standing Minimum power 60mW Power Noise Level 3mW Maximum Average Power Density kW/cm2 30 at 4W 14 at 100W Response Time (0-95%), typ. (sec) 1.2 Power Accuracy +/-% at calibration wavelength 3 Linearity with Power +/-% 1 Amplifier power supply (for UA, UAU versions) NA Energy Mode (where applicable) Maximum Energy NA Minimum Energy NA 2 Maximum Energy Density J/cm <100ns NA 0.5ms NA 2ms NA 10ms NA Cooling conduction Output Ophir smart plug Dimensions 48x48x14.5mm Part number 7Z02680 Note: (a) Note: (b) Note: (c) 100C-SH With analog “UA” version, maximum power is also limited by maximum output voltage where output voltage is at most 2V less than input voltage. 4 pin Molex connections: +Voltage, -Voltage, Analog signal out, Ground 6 pin Molex connections: RS232 input, Ground, +Voltage, Analog signal out, high/low voltage or switch input when used, RS232 output Calibrated at customer selected wavelength 100C-UA 51 For latest updates please visit our website: www.ophiropt.com/photonics 01.08.2013 1.1.5.1 Standard OEM Thermal Sensors 60mW to 150W 1.1.5.1 Sensors Features ֺֺ Conduction or water cooled ֺֺ Spectrally flat ֺֺ “UA” version can give analog voltage output or digital RS232 output and can measure power or energy. Can also have multiple switchable ranges and/or multiple switchable wavelengths ֺֺ "UAU" version is similar to the UA version but operates via the USB terminal of the PC 150C-SH 150C-UA/150C-UAU 150W-UA/150W-UAU The following specifications refer to standard OEM sensors, and are to be understood as generic, describing sensor families. Ophir will be happy to help you with a specific solution for your particular application. Model 150C-SH Type Digital RS232 connection Digital RS232 connection Same as UA but with digital analog or digital output analog or digital output mini USB connection digital output only High power, smart sensor High power, built-in High power, built-in amplifier amplifier, water cooled Broadband Broadband Broadband 0.19 - 20 0.19 - 20 (c) 0.19 - 20 (c) φ 18 φ 18 φ 18 Features Absorber Type Spectral Range µm Aperture mm Power Mode Maximum power (a) Minimum power Power Noise Level Maximum Average Power Density kW/cm2 Response Time (0-95%), typ. (sec) Power Accuracy +/-% at calibration wavelength Linearity with Power +/-% Amplifier power supply (for UA, UAU versions) Energy Mode (where applicable) Maximum Energy Minimum Energy Maximum Energy Density J/cm2 <100ns 0.5ms 2ms 10ms Cooling Output Dimensions Part number Note: (a) Note: (b) Note: (c) 150C-SH 150C-UA 150W-UA 150C / W-UAU Smart sensor 60W if used with suitable heat sink, 5W free standing 60mW 3mW 30 at 5W 20 at 60W 60W if used with suitable heat sink, 5W free standing 60mW 3mW 30 at 5W 20 at 60W 150W 100mW 5mW 12 at 150W 1.2 3 1.2 3 1.2 3 1 NA 1 ±6V to ±24V 1 ±6V to ±24V 100J 20mJ 100J 20mJ 100J 50mJ 0.3 5 10 30 Conduction Ophir smart plug 50.8x50.8x33mm 77023 0.3 5 10 30 Conduction 6 pin Molex (b) 50x50x38mm Consult Ophir representative 0.3 5 10 30 Water 6 pin Molex (b) Mini B USB connector 50x50x38mm Consult Ophir representative Consult Ophir representative Via host USB With analog “UA” version, maximum power is also limited by maximum output voltage where output voltage is at most 2V less than input voltage. 4 pin Molex connections: +Voltage, -Voltage, Analog signal out, Ground 6 pin Molex connections: RS232 input, Ground, +Voltage, Analog signal out, high/low voltage or switch input when used, RS232 output Calibrated at customer selected wavelength 150C-UA 150W-UA (2x) M3x5 deep 2 sides MOUNTING THREADS 50 11 34 50 18 19 MOLEX 22-01-2065 38 (2x) 1/8"-27 NPT WATER CONNECTIONS 52 01.08.2013 For latest updates please visit our website: www.ophiropt.com/photonics 9.5 38 1.1.5.1 Standard OEM Thermal Sensors L150C-UA / L150C-UAU L250W-UA / L250W-UAU L300W-UA / L300W-UAU Features ֺֺ Conduction and water cooled ֺֺ Spectrally flat ֺֺ “UA” version can give analog voltage output or digital RS232 output and can measure power or energy. Can also have multiple switchable ranges and/or multiple switchable wavelengths ֺֺ "UAU" version is similar to the UA version but operates via the USB terminal of the PC 1.1.5.1 Sensors 0.2W to 300W The following specifications refer to standard OEM sensors, and are to be understood as generic, describing sensor families. Ophir will be happy to help you with a specific solution for your particular application. Model Type Features Absorber Type Spectral Range µm Aperture mm Power Mode Maximum power (a) L150C-UAU L250W-UAU L300W-UAU Digital RS232 connection Digital RS232 connection Digital RS232 connection Same as UA but with analog or digital output analog or digital output analog or digital output digital mini USB connection digital output only Large aperture, built-in Large aperture, built-in Large aperture, built-in amplifier amplifier, water cooled amplifier, water cooled Broadband Broadband Broadband 0.19 - 20 (c) 0.19 - 20 (c) 0.19 - 20 (c) φ 50 φ 50 φ 50 L150C-UA 20W free standing, 150W heat sinked Minimum power 0.2W Power Noise Level 10mW Maximum Average Power Density kW/cm2 27 at 20W 12 at 150W Response Time (0-95%), typ. (sec) 2.5 Power Accuracy +/-% at calibration wavelength 3 Linearity with Power +/-% 1 Amplifier power supply (for UA, UAU versions) ±6V to ±24V Energy Mode (where applicable) Maximum Energy 100J Minimum Energy 80mJ Maximum Energy Density J/cm2 <100ns 0.3 0.5ms 5 2ms 10 10ms 30 Cooling conduction Output 6 pin Molex (b) Dimensions 80x80x45mm Part number Consult Ophir representative Note: (a) Note: (b) Note: (c) L150C-UA L250W-UA L300W-UA 250W water cooled 300W water cooled 0.3W 15mW 10 at 250W 2.5 3 2 ±6V to ±24V 0.5W 25mW 9 at 300W 2.5 3 2 ±6V to ±24V 200J 120mJ 300J 200mJ 0.3 5 10 30 water 6 pin Molex (b) 80x80x58mm Consult Ophir representative 0.3 5 10 30 water 6 pin Molex (b) Mini B USB connector 80x80x58mm Consult Ophir representative Consult Ophir representative Via host USB With analog “UA” version, maximum power is also limited by maximum output voltage where output voltage is at most 2V less than input voltage. 4 pin Molex connections: +Voltage, -Voltage, Analog signal out, Ground 6 pin Molex connections: RS232 input, Ground, +Voltage, Analog signal out, high/low voltage or switch input when used, RS232 output Calibrated at customer selected wavelength L250W-UA / L300W-UA 53 For latest updates please visit our website: www.ophiropt.com/photonics 01.08.2013 1.1.5.2 Examples of Custom OEM Power Sensor Solutions In addition to the standard OEM products described above, Ophir has accumulated over 25 years experience in developing products which are tailored to precise physical configurations provided by the OEM customer. These products include custom discs (with or without electronics), specially configured thermal- or photodiode-based power sensors, and much more. A number of these special OEM products are shown below. 1.1.5.2 Sensors OEM Photodiode Sensor with RS232 Output This sensor is similar to the UA thermal OEM sensors described above, except it has a photodiode instead of thermal detector. The sensor shown has 5 decades of dynamic range and has the following dimensions: 50mm x 50mm x 33mm. OEM Photodiode Sensor with Universal Amplifier Board Truncated PD300 sensor with Universal amplifier board giving calibrated voltage output. Either analog or RS232 communication. Flat Profile Thermal Sensor This sensor with 50mm aperture is used as an exposure detector for photolithography and is only 10mm thick. Super Compact Thermal Sensor Thermal OEM sensor designed to be cemented into user system. Dimensions are under 10mm x 20mm footprint and 4mm height. The sensor can be connected to an Ophir smart meter to measure power or energy or can be used directly with voltage output. Compact, hand held thermal Smart Sensor This thermal sensor is only 20mm thick to enable probing in hard-to-reach locations, and can measure up to 25W. It is designed specifically to be hand-held, and works with any Ophir Smart Meter. Ultra Fast OEM Power Sensor sing an innovative new axial thermopile method, this sensor is designed to be built into an U industrial CO2 or YAG laser for fast feedback to control the laser power stability. It has a response time of 50ms and power capacity of 100W. Ordering Information: The products shown above are examples of OEM solutions developed for specific customer applications. Please consult with your Ophir representative who will be happy to help you with any requirements you may have. 54 01.08.2013 For latest updates please visit our website: www.ophiropt.com/photonics 1.2 BeamTrack Power / Position / Size Sensors 1.2 Sensors Ophir now has the new BeamTrack line of thermal sensors that can measure beam position and beam size while measuring power. This innovative device will provide an additional wealth of information on your laser beam – centering, beam position, beam wander, beam position and wander, beam size as well as power and single shot energy. The BeamTrack sensor is illustrated schematically here and works as follows: the signal coming from the sensor is divided into 4 quadrants so by measuring and comparing the output from the 4 sections we can determine the position of the center of the beam to a high degree of accuracy. In addition to the 4 quadrants, there is now a special patented beam size detector. After processing outputs from these various detectors, the user is presented with the beam position as well as beam size. Note that the beam size is calibrated only for Gaussian beams but for other beams it will give relative size information and will indicate if the beam is changing size. 3rd Quad 2nd Quad 1st Quad Beam size detector 4th Quad Total output Operation of BeamTrack Sensors BeamTrack sensors look similar to Ophir thermal sensors of the same type except that there is a small electronics module on the cable from the sensor head to the smart plug. When BeamTrack sensors are plugged into compatible displays or PC interfaces (Nova II, Vega, StarLite and Juno), along with the power measurement, there is a visual display of the beam position and beam size. The beam position can be accurately tracked and logged for beam wander measurements. The beam size is calibrated only for Gaussian beams but other beams may be measured and the sensor will give a repeatable measurement of the relative beam size for tracking changes in the size of the beam over time. 55 For latest updates please visit our website: www.ophiropt.com/photonics 01.08.2013 1.2.1 BeamTrack-Power / Position / Size Sensors 100µW to 10W 3A-QUAD / 3A-P-QUAD 10A-PPS 1.2.1 1.3 Sensors Features ֺֺ All the features of standard power sensors plus... ֺֺ Accurate tracking of beam position to fractions of a mm ֺֺ Monitoring of the laser beam size Model 3A-QUAD (a) 3A-P-QUAD (a) 10A-PPS (a) Use Functions Absorber Type Spectral Range µm Aperture mm Power Mode Power Range Power Scales Power Noise Level Thermal Drift (30min)% Maximum Average Power Density kW/cm2 Response Time with Display (0-95%) typ. s Power Accuracy +/-% Linearity with Power +/-% Energy Mode Energy Range Energy Scales Minimum Energy Maximum Energy Density J/cm2 <100ns 0.5ms 2ms 10ms Beam Tracking Mode Position Beam Position Accuracy mm (c) Beam Position Resolution mm Min Power for Position Measurement Size (d) Size Accuracy mm Size Range mm (4σ beam diameter) Min Power for Size Measurement Cooling Weight kg Fiber Adapter Available (see page 44) Part number: Standard Sensor StarLink Sensor: Direct USB link to PC (p. 42) General purpose Power / Energy / Position Broadband 0.19 - 20 φ 9.5mm Short pulses Power / Energy / Position P type 0.15 - 8 φ 12mm Low power Power / Energy / Position / Size Broadband 0.19 - 20 φ 16mm 100µW - 3W 3W to 300µW 5µW 10 - 40µW(b) 1 1.8 3 1 160µW - 3W 3W to 300µW 10µW 10 - 40 µW (b) 0.05 2.5 3 1 20mW - 10W 10W / 5W / 0.5W 1mW NA 28 0.8 3 1 20µJ - 2J 2J to 200µJ 20µJ 30µJ - 2J 2J to 200µJ 30µJ 6mJ - 2J 2J / 200mJ 6mJ 0.3 1 2 4 1(e) 1(e) 1(e) 1(e) 0.3 2 2 2 0.15 0.02 300µW 0.15 0.02 400µW 0.1 0.02 50mW NA NA NA convection 0.3 ST, FC, SMA, SC 7Z07934 787203 NA NA NA convection 0.3 ST, FC, SMA, SC 7Z07935 ±(5%+50µm) for centered beam 1.5 - 10 50mW convection 0.3 ST, FC, SMA, SC 7Z07904 787202 Notes: (a) The BeamTrack features are supported by Nova II, Vega and StarLite meters , Juno interface and StarLab application. Notes: (b) Depending on room airflow and temperature variations. Notes: (c) For position within inner 30% of aperture. Notes: (d) Assumes laser beam with Gaussian (TEM00) distribution. For other modes, size measurement is relative. Notes: (e) For P type and shorter wavelengths derate maximum energy density as follows: Wavelength Derate to value 1064nm not derated 532nm not derated 355nm 40% of stated value 266nm 10% of stated value 193nm 10% of stated value Interface Module on cable 1.5M cable to sensor 1.5M cable to sensor 77 77 10A-PPS 3A-QUAD / 3A-P-QUAD 0.5M cable to smart connector 0.5M cable to smart connector 48 64 30 ABSORBER SURFACE 3A-P-QUAD=19.4mm 3A-QUAD=20mm 65 33.5 3A-P-QUAD= 12 3A-QUAD= 9.5 70 Absorber Surface 16 43 25 23 43 11.5 19 REMOVABLE PART Removable Part M20x1 x4 deep 18 97-143 ADJUSTABLE 10 M20x1 x4 deep 75 ADJUSTABLE 92-127 18 56 01.08.2013 ° 30° 75 75 100 For latest updates please visit our website: www.ophiropt.com/photonics REV. 1 DRAWN APPR. NAME E.K. A.R. SIGN. DATE 10.11 100 1.2.2 BeamTrack-Power / Position / Size Sensors 50(150)A-BB-26-PPS 40mW to 150W F150A-BB-26-PPS 1.2.2 Sensors Features ֺֺ All the features of standard power sensors plus... ֺֺ Accurate tracking of beam position to fractions of a mm ֺֺ Monitoring of the laser beam size Model 50(150)A-BB-26-PPS (a) F150A-BB-26-PPS (a) Use Absorber Type Spectral Range µm Aperture mm Power Mode Power Range Maximum Intermittent Power Power Scales Power Noise Level Maximum Average Power Density kW/cm2 Response Time with Display (0-95%) typ. s Power Accuracy +/-% Linearity with Power +/-% Energy Mode Energy Range Energy Scales Minimum Energy mJ Maximum Energy Density J/cm2 <100ns 0.5ms 2ms 10ms Beam Tracking Mode Position Beam Position Accuracy mm (c) Beam Position Resolution mm Min Power for Position Measurement Size (d) Size Accuracy mm (e) Size Range mm (4σ beam diameter) Min Power Density for Size Measurement Cooling Fiber Adapter Available (see page 44) Weight Kg Version Part number: Standard Sensor StarLink Sensor: Direct USB link to PC (p. 42) General purpose Broadband 0.19 - 20 φ 26mm General purpose Broadband 0.19 - 20 φ 26mm 40mW - 150W 150W for 1.5min, 100W for 2.2min, 50W continuous 150W / 50W / 5W 2mW 12 at 150W, 17 at 50W 1.5 3 1.5 50mW - 150W (b) NA 150W / 30W / 3W 8mW (b) 12 at 150W, 17 at 50W 1.5 3 1 20mJ - 100J 100J / 30J / 3J / 300mJ 20 20mJ - 100J 100J / 30J / 3J / 300mJ 20 (b) 0.3 5 10 30 0.3 5 10 30 0.1 2.5% of beam size 100mW 0.1 2.5% of beam size 100mW ±5% for centered beam φ3 - 20 1 W/cm² convection ST, FC, SMA, SC 0.4 ±5% for centered beam φ3 - 20 1 W/cm² fan ST, FC, SMA, SC 0.45 7Z07900 787200 7Z07901 Notes: (a) The BeamTrack features are supported by Nova II, Vega and StarLite meters , Juno interface and StarLab application. Notes: (b) For powers up to 30W it is recommended to work with the fan off and then the noise level is ~3 times lower. It is also recommended to measure energy with the fan off. Notes: (c) Position accuracy for the central 10mm of the aperture as limited by beam position resolution. Position can be tracked with ±1mm accuracy over the entire aperture. Accuracy is reduced by a factor of 3 at minimum power. Notes: (d) Assumes laser beam with Gaussian (TEM00) distribution. For other modes, size measurement is relative. Notes: (e) Accuracy spec will be maintained for beams from 3.5 to 17mm not deviating from center more than 15% of beam diameter. For beams below 8mm in size and powers above 75W error in size can reach ±10%. Interface Module on cable 50(150)A-BB-26-PPS F150A-BB-26-PPS 80 34 26 REF Absorber Surface (2x) M3x4 deep 5.9 (2x) M3x4 deep 18 5.9 77 8 8 0.5M cable to smart connector 77 13 22 Absorber Surface (4x) R3 34 26 REF 0.5M cable to smart connector 13 ADJUSTABLE 95-140 18 43 64 93 62 (4x) R3 64 22 Interface Module 1.5M cable to module 14.5 6 DC power supply socket ADJUSTABLE 95-140 1.5M cable to module 18 14.5 Interface Module 18 77 64 0.5M cable to smart connector 43 1.5M cable to sensor 77 64 43 1.5M cable to sensor 64 75 75 100 100 For latest updates please visit our website: www.ophiropt.com/photonics 18 18 57 01.08.2013 D 1.2.3 BeamTrack-Power / Position / Size Sensors 150mW to 250W FL250A-BB-50-PPS 1.2.3 1.3 Sensors Features ֺֺ All the features of standard power sensors plus... ֺֺ Accurate tracking of beam position to fractions of a mm ֺֺ Monitoring of the laser beam size Model FL250A-BB-50-PPS (a) Use Absorber Type Spectral Range µm Aperture mm Power Mode Power Range (b) Power Scales Power Noise Level Maximum Average Power Density kW/cm2 Response Time with Display (0-95%) typ. s Power Accuracy +/-% Linearity with Power +/-% Energy Mode Energy Range Energy Scales Minimum Energy mJ Maximum Energy Density J/cm2 <100ns 0.5ms 2ms 10ms Beam Tracking Mode Position Beam Position Accuracy mm (c) Beam Position Resolution mm Min Power for Position Measurement Size (d) Size Accuracy mm (e) Size Range mm (4σ beam diameter) Min Power Density for Size Measurement Cooling Fiber Adapter Available (see page 44) Weight Kg Version Part number: Standard Sensor StarLink Sensor: Direct USB link to PC (p. 42) General purpose Broadband 0.19 - 20 φ 50mm 150mW - 250W 250W / 30W 15mW 10 at 250W, 12 at 150W 2.8 3 1.5 80mJ - 300J 300J / 30J / 3J 80 0.3 5 10 30 0.2 0.1 2W ±5% for centered beam Ø 5-35 3 W/cm² fan ST, FC, SMA, SC 0.9 7Z07902 787201 Notes: (a) The BeamTrack features are supported by Nova II, Vega and StarLite meters, Juno interface and StarLab application. Notes: (b) For powers up to 50W it is recommended to work with the fan off and then the noise level is ~3 times lower. It is also recommended to measure energy with the fan off. Notes: (c) Position accuracy for the central 20mm of the aperture as limited by beam position resolution. Position can be tracked with ±1mm accuracy over central 32mm of the aperture. Accuracy is reduced by a factor of 3 at minimum power. Notes: (d) Assumes laser beam with Gaussian (TEM00) distribution. For other modes, size measurement is relative. Notes: (e) Accuracy spec will be maintained for beams from 6 to 35mm not deviating from center more than 15% of beam diameter. Interface Module on cable 1.5M cable to sensor 77 FL250A-BB-50-PPS 105 0.5M cable to smart connector 0.5M cable to smart connector 72 (2x) M3x4.5 deep 90 106 58 50 Absorber Surface 90 43 1.5M cable to sensor 77 10.2 18 23 19 18.5 43 18 DC power supply socket ADJUSTABLE 107-153 18 18 7 17 75 100 58 01.08.2013 For latest updates please visit our website: www.ophiropt.com/photonics 1.2.4 BeamTrack-Power / Position / Size Sensors Device Software Support ֺֺ ֺֺ BeamTrack sensors are fully supported by the Vega, Nova-II, StarLite and Juno devices Attach the sensor to the meter. On startup, it will be recognized as a BeamTrack sensor and tracking options will be enabled Use the Track screen to measure power, position and size simultaneously Use the Stability screen to measure pointing stability (also known as beam wander) over time 1.2.4 Sensors ֺֺ ֺֺ Track Screen on Nova II Sensor type and S/N Measurement parameters Power measurement Position and size graph Position and size measurement Soft Keys Pointing Stability Screen of Vega Time elapsed since start of measurement Number of position measurement Graphical presentation of all the measurements Marker at point of last measurement Last measurement Statistics since start of measurement Change rate of measurement Reset statistics and graph 59 For latest updates please visit our website: www.ophiropt.com/photonics 01.08.2013 1.2.4 BeamTrack-Power / Position / Size Sensors PC Software Support ֺֺ ֺֺ 1.2.4 Sensors ֺֺ StarLab COM Object for System Integrators including demo applications in VB, VC+ and MatLab the Track screen to measure power, position and size simultaneously LabVIEW Demo Application Examples of some StarLab Screens Stability Screen Log data for future review Graph controls including; Sample size, Autoscale option, Reset button and Graph type selections Power measurement and statistics Functions (apply to power only) Stability Graph. The more hits in one location the brighter the color Statistics of the stability sample Graph can be zoomed in and out manually or auto-scaled Position & SizeScreen Power measurement and statistics Parameter configuration Functions (applies to power only) Position and size displayed numerically Graph with spot drawn to scale and market on position 60 01.08.2013 For latest updates please visit our website: www.ophiropt.com/photonics 1.3 Sensors Energy sensors 61 For latest updates please visit our website: www.ophiropt.com/photonics 01.08.2013 Energy Sensors Introduction Energy Sensors 1.3 Sensors Ophir has two types of energy sensors, pyroelectric and RP. Pyroelectric sensors are for measuring repetitive pulse energies and average powers at pulse rates up to 25000 pulses per second and pulse widths up to 20ms. RP sensors are specialty items mainly for very long Introduction pulse widths and very high average powers that cannot be measured by pyroelectric sensors. Note that single shot energy with pulse rates Ophir has two types of energy sensors, pyroelectric and RP. Pyroelectric sensors are for measuring repetitive pulse energies and average powers at pulse less than one pulse every 5s or sorates canupbe measured thermal sensors in the poweritems sensor to 25000 pulses perwith second and pulse widths up todescribed 10ms. RP sensors are specialty mainlysection. for very long pulse widths and very high average Pyroelectric Sensors powers that cannot be measured by pyroelectric sensors. Note that single shot energy with pulse rates less than one pulse every 5s or so can be measured with thermal sensors described in the power sensor section. Pyroelectric Sensors Pyroelectric crystal – thickness <1mm Pyroelectric type sensors are useful for measuring the energy of repetitively pulsed lasers at up to Heat sink disc 25,000Hz and are sensitive to lowPyroelectric energies.type sensors are useful for measuring the energy of repetitively pulsed lasers at up to 25,000Hz and are sensitive to low energies. They are less durable than thermal types and therefore should not used should whenever is not necessary They are less durable than thermal types andbe therefore not be it used whenever it - + to measure the energy of each pulse average power is sufficient. is not and necessary to measure themeasurement energy of each pulse and average power - + measurement is sufficient. Pyroelectric sensors use a pyroelectric crystal that generates an electric charge proportional to the heat - + Pyroelectric sensors use a pyroelectric crystal that generates an electric charge + absorbed. Since the two surfaces of the crystal are metalized, the total charge generated is collected and - + proportional to the heat absorbed. Since the two surfaces of the crystal are therefore the response is not dependent beam sizegenerated or position. This and charge then capacitor metalized, on the total charge is collected therefore thecharges response a is not - + beam size or position. This charge charges a capacitor parallel in parallel with the crystal and thedependent voltageon difference thus generated is then proportional to the inpulse energy. - + with the crystal and the voltage difference thus generated is proportional to the pulse - + After the energy is read by the electronic circuit, the charge on the crystal is discharged to be ready for energy. After the energy is read by the electronic circuit, the charge on the crystal is - + of the pyroelectric depends on the time it takes for the heat to the next pulse. The response timedischarged to be ready for sensor the next pulse + - + Themetallic response type time ofpyro the pyroelectric sensor the time it takes the heat enter the crystal and heat it up. For detectors, thisdepends time isontens of µs andfor thus the - + to enter therate. crystalFor andthe heatBF it up. ForBB metallic metallic type can run at a high repetition and type,type the response time is hundreds of µs pyro detectors, this time is tens of µs and thus the metallic type can run at a high - + with a correspondingly lower repetition repetition rate. rate. For the BF and BB type, the response - + Ophir pyroelectric detectors havetime unique and proprietary circuitry that allow them to measure long is hundreds of us with a correspondingly lower repetition rate. - + + have unique and proprietary circuitry thatisallow them toas 30% pulses as well as short pulses andOphir workpyroelectric at a highdetectors duty cycle, i.e. where the pulse width as much measure long pulses as well as short pulses and work at a high duty cycle, i.e. where of the total cycle time. the pulse width is as much as 30% of the total cycle time. Ophir came out with the new compact C line of pyroelectric sensors that replaced previous models. The Electrical leads RPcompletely Sensorsupgraded and the new sensors are superior in every electronics and mechanics has been way: more compact, wider dynamic range, have repetition rates and way measure longer pulses.the Through development, Ophir The exclusive Ophir higher RP type heads represent a unique of accurately measuring energy ofconstant high average power and large duty cycle pulsed lasers, while at the same time measuring average power and temporal pulse shape. again brings you the best performance in the market. RP Sensors Principle of Operation RP heads incorporate an innovation (patented) that allows measurement of the energy of high energy repetitively pulsed lasers which is of advantages over pyroelectric measurement in certain cases: higher average powers than a pyroelectric and high duty cycles up to 70% which arerepresent typical of switched diode way lasers.of accurately measuring the energy of high average power and large duty cycle The exclusive Ophir RP type heads a unique The basic approach is to incorporate twoand sensors in one measurement head. The RP measurement head has a standard thermopile type pulsed lasers, while at the same time measuring average power temporal pulse shape. detector enabling it to measure average laser power to a high degree of accuracy, generally ±3%. In addition, it contains a fast photodiode detector, which measures the energy of the laser pulses in real time. The photodiode detector is mounted so that a fraction of the radiation Principle of Operation falling on the thermopile absorber, 4% to 15% depending on head type, is scattered from the absorber. A fraction of that falls on the photodiode (see illustration below). (There is also a larger, fast photodiode connected directly to an oscilloscope via the BNC connector RP heads incorporate an innovation (patented) thattheallows measurement ofbeam the energy of high energy repetitively pulsed lasers which is enabling it to measure temporal pulse shape of the to a resolution of ns.) Combining the average powercases: measurement the relative pulse energy repetition rate,and the unit calculates the absolute energy of advantages over pyroelectric measurement in certain higherwith average powers than and a pyroelectric high duty cycles up to 70%per pulse. which are typical of switched diode lasers. The basic approach is to incorporate two sensors in one measurement head. The RP measurement head has a standard thermopile type detector enabling it to measure average laser power to a high degree of accuracy, generally ±3%. In addition, it contains a fast photodiode detector, which measures the energy of the laser pulses in real time. The photodiode detector is mounted so that a fraction of the radiation falling on the thermopile absorber, 4% to 15% depending on head type, is scattered from the absorber. A fraction of that falls on the photodiode, see illustration below (there is also a larger, fast photodiode connected directly to an oscilloscope via the BNC connector enabling it to measure the temporal pulse shape of the beam to a resolution of ns). Combining the average power measurement with the relative pulse energy and repetition rate, the unit calculates the absolute energy per pulse. 62 01.08.2013 For latest updates please visit our website: www.ophiropt.com/photonics Absorption and Damage Graphs for Pyroelectric Sensors Absorption vs. Wavelength 100.00 90.00 1.3 Sensors BB Pyro BF BB Pyro 80.00 BF Pyro metallic ABSORPTION % 70.00 60.00 PE50-DIF PE50-DIF 50.00 BF-DIF BF-DIF 40.00 30.00 20.00 Pyro metallic 10.00 0.00 0.1 1.0 10.0 100.0 WAVELENGTH WAVELENGTH µmum Damage Threshold vs. Pulse Width 10000 Pulsed Laser Damage Threshold BF Energy Density in J/cm²_ 1000 100 Pyro metallic 10 Pyro BB 1 BF 0.3 0.1 Pyro BB Pyro metallic 0.01 1E-10 1E-09 0.00000001 0.0000001 0.000001 0.00001 0.0001 0.001 0.01 0.1 1 Pulse Width in Seconds 63 For latest updates please visit our website: www.ophiropt.com/photonics 01.08.2013 Wavelength Range and Repetition Rate for Energy Sensors Wavelength Range 1.3 Sensors Model PD10-C PD10-pJ-C PD10-IR-pJ-C PE9-C PE10-C PE10BF-C PE25-C PE25BF-C PE50-C PE50BF-C PE25BF-DIF-C PE50-DIF-C PE50BF-DIF-C PE50BB-DIF-C PE50-DIF-ER-C PE100BF-DIF-C 0.19 0.532 1.1 2.2 3 10 12 20 Wavelength m Repetition Rate Range Model PD10-C PD10-pJ-C PD10-IR-pJ-C PE9-C PE10-C PE10BF-C PE25-C PE25BF-C PE50-C PE50BF-C PE50-DIF-C PE25BF-DIF-C PE50BF-DIF-C PE50BB-DIF-C PE50-DIF-ER-C PE100BF-DIF-C 0 20 40 100 120 250 400 1K 3K 4K 5K Maximum Pulse Rate Hz 64 01.08.2013 For latest updates please visit our website: www.ophiropt.com/photonics 10K 20K 25K 1.3.1 Photodiode Energy Sensors 10pJ to 15µJ PD10-C / PD10-pJ-C / PD10-IR-pJ-C Model PD10-C PD10-pJ-C PD10-IR-pJ-C Use Aperture mm Absorber Type Spectral Range µm (a) Surface Reflectivity % approx. Calibration Accuracy +/-% (a) Energy Scales Lowest Measurable Energy nJ (b) Max Pulse Width ms Maximum Pulse Rate pps Noise on Lowest Range nJ Additional Error with Frequency % Linearity with Energy for > 10% of full scale (b) Damage Threshold J/cm2 Maximum Average Power mW Maximum Average Power Density W/cm2 Maximum Energy vs. Wavelength Low energies φ10 Si photodiode with attenuator 0.19 - 1.1 50 5 20µJ to 20nJ 1 at 900nm 0.005 20kHz 0.05 ±1% to 20kHz (c) ±1.5% 0.1 50 at 800nm 50 Wavelength Maximum Energy <300nm 15µJ 350-550nm 8µJ >800nm 5µJ Lowest energies φ10 Si photodiode 0.2 - 1.1 30 5 200nJ to 200pJ 0.01 at 900nm 0.005 20kHz 0.001 ±1% to 20kHz (d) ±1.5% 0.1 0.5 5 Wavelength Maximum Energy <300nm 150nJ 350-550nm 75nJ >800nm 50nJ Fiber Adapters Available (see page 76) Weight kg Version Part number: Standard Sensor Previous Model Part Number ST, FC, SMA, SC 0.25 ST, FC, SMA, SC 0.25 Infrared φ5 Ge photodiode 0.7 - 1.8 30 5 20nJ to 200pJ 0.03 at 1550nm 0.005 10kHz 0.01 ±1.5% to 10kHz ±1.5% 0.1 0.5 5 Wavelength 800 - 900nm 1000 - 1300nm 1300 - 1400nm 1480 - 1560nm >1650nm ST, FC, SMA, SC 0.25 7Z02944 7Z02823 7Z02945 7Z02824 7Z02946 7Z02827 Note: (a) This is basic calibration accuracy. In certain wavelength regions calibration there is additional error as tabulated here. <250nm >950nm add ±3% add ±2% <250nm >950nm add ±2% add ±2% <900nm >1700nm 1.3.1 1.3 Sensors Features ֺֺ Silicon and Germanium detectors ֺֺ Very sensitive - down to 10pJ ֺֺ Repetition rates to 20kHz ֺֺ Wide spectral range Maximum Energy 20nJ 8nJ 7nJ 6nJ 20nJ add ±2% add ±2% Note: (b) With the “user threshold” setting set to minimum. For other settings, the spec is for >10% of full scale or greater than twice the "user threshold", whichever is greater. The user threshold is available with Nova II, Vega, StarLite or Juno. For other meters, the threshold is set to minimum and the linearity spec is >10% of full scale. The PD-C series will only operate with Nova or Orion meters with an additional adapter Ophir P/N 7Z08272 (see page 77). The adapter can introduce up to 1% additional measurement error. The user threshold feature allows adjustment of the internal threshold up to 25% of full scale if desired to avoid false triggering in noisy environments. For highest accuracy, it is recommended to zero the sensor against the meter the first time it is used with a particular meter. For further information, see the FAQs on our Website. Note: (c) Additional Error with Frequency of ±1% on ly for energies up to 2µJ. For higher energies ±1% up to 10kHz, -4% at 20kHz. Note: (d) Additional Error with Frequency of ±1% only for energies up to 20nJ. For higher energies ±2% up to 10kHz, -5% at 20kHz. PD10-C / PD10-pJ-C PD10-C / PD10-PJ-C PD10-IR-pJ-C 5 Active Area 22 62 (2x) M2.5x6 deep 22 62 (2x) M2.5x6 deep ° 120 120 ° 8 0° 10 12 0 12 11.5 54 ° 10 54 ADJUSTABLE 90-139 11.5 8 ADJUSTABLE 90-139 3 0° 3 0° 100 75 100 75 65 For latest updates please visit our website: www.ophiropt.com/photonics REV. 2 NAME DRAWN U.P. APPR. A.R. SIGN. DATE 12.12 REV. 2 NAME DRAWN U.P. APPR. A.R. SIGN. DATE 12.12 01.08.2013 1.3.2 Pyroelectric Energy Sensors 0.2µJ to 10mJ PE9-C PE10-C / PE10BF-C 1.3.2 Sensors Features ֺֺ φ8mm and φ12mm apertures ֺֺ Repetition rates up to 25,000Hz ֺֺ Highest sensitivity sensors ֺֺ Pulse widths up to 5ms ֺֺ New compact PE-C series Model PE9-C Use Aperture mm Absorber Type Spectral Range µm (a) Surface Reflectivity % approx. Calibration Accuracy +/-% (a) Max Pulse Width Setting (g) Energy Scales Lowest Measurable Energy µJ (c, d) Max Pulse Width µs Maximum Pulse Rate pps Noise on Lowest Range µJ Additional Error with Frequency % Most sensitive φ8 metallic 0.15 - 12 50 3 1µs 2µs 1mJ to 2µJ 1mJ to 2µJ 0.5 <0.2 1 2 25kHz 15kHz 0.04 0.05 ±1% to 15kHz, ±1% to 15kHz ±6% to 25kHz Damage Threshold J/cm2 <100ns 1µs 300µs Linearity with Energy (c) Maximum Average Power W Maximum Average Power Density W/cm2 Fiber Adapters Available (see page 76) Weight kg Version Part Number: Standard Sensor Previous Model Part Number StarLink Sensor: Direct USB link to PC (p. 75) Note: (a) Calibrated curve is checked and adjusted at the following wavelengths (µm) PE10-C PE10BF-C Sensitive φ12 metallic 0.15 - 12 50 3 20µs 1µs 1mJ to 20µJ 10mJ to 2µJ 0.5 1 20 1 10kHz 25kHz 0.1 0.1 ±1% to 10kHz ±2% to 15kHz, ±3% to 25kHz 30µs 10mJ to 20µJ 1 30 5kHz 0.15 ±1% to 5kHz High damage threshold φ12 BF 0.15 - 3, 10.6 (e) 20 3 (f ) 1ms 5ms 10mJ to 20µJ 10mJ to 200µJ 7 20 1000 5000 250Hz 50Hz 1 5 ±1% ±1% 0.1 0.2 3 ±1% 2 30 ST, FC, SMA, SC 0.25 0.1 0.2 3 ±1.5% 2 50 ST, FC, SMA, SC 0.25 0.8 (b) 1 (b) 2 (b) ±2% 3 50 ST, FC, SMA, SC 0.25 7Z02933 PE-9: 7Z02877 PE9-F: 7Z02882 7Z02932 7Z02938 0.193, 0.355, 1.064, 1.48-1.6 0.193, 1.064, 0.355 787152 0.193, 0.248, 0.355, 0.532, 1.064 240 - 800nm add ±4%, 2-3µm add ±8%, 10.6µm add ±15% 0.2-3µm ±2%, 10.6µm ±5% For other wavelengths in the curve there is additional calibration error as stated. Note: (b) For wavelenghts below 600nm, derate damage threshold to 60% of given values. Below 300nm, derate to 40% of given values. Note: (c) For >7% of full scale, with the "user threshold" setting set to minimum. For other settings, the spec is for >7% of full scale or greater than twice the "user threshold", whichever is greater. The user threshold is available with Nova II, Vega, StarLite or Juno. For other meters, the threshold is set to minimum and the linearity spec is >10% of full scale. The PE-C series will only operate with Nova or Orion meters with an additional adapter Ophir P/N 7Z08272 (see page 77). The adapter can introduce up to 1% additional measurement error. The user threshold feature allows adjustment of the internal threshold up to 25% of full scale if desired to avoid false triggering in noisy environments. The user threshold setting represents the approximate minimum energy for pulse widths below ~50% of the pulse width setting. For longer pulse widths, the actual minimum may be higher. For highest accuracy, it is recommended to zero the sensor against the meter the first time it is used with a particular meter. For further information, see the FAQs on our Website. Note: (d) A shock absorbing mounting post is available for situations in which sensor is mounted on a surface subject to shock or vibration. This can prevent false triggering and allow working at lower minimum energies (see accessory page 77 for mounting post). Note: (e) The 3000nm setting is calibrated for 10.6µm as well. To measure CO2 laser, set to the 3000nm setting. The additional error for measuring 10.6µm is ±5%. Note: (f ) Add 3% to error for wavelengths >2µm. Note: (g) For PE9-C: with the Laserstar, Pulsar, USBI, Quasar and Nova/Orion with adapter only 2 of the 3 pulse width settings are available; the 1µs and 2µs settings. 21 PE9-C 62 8 PE10-C / PE10BF-C 21 12 62 10.5 7.5 7.5 ADJUSTABLE 90-139 10.5 ADJUSTABLE 90-139 30° 30° 100 75 100 75 66 01.08.2013 For latest updates please visit our website: www.ophiropt.com/photonics REV. 1 NAME DRAWN E.K. APPR. A.R. SIGN. DATE 11.10 1.3.2 Pyroelectric Energy Sensors 8µJ to 10J PE25BF-C PE25-C Energy Sensor with optional heat sink 1.3.2 Sensors Features ֺֺ φ24mm apertures ֺֺ Metallic coating for high rep rates ֺֺ BF coating for highest damage threshold ֺֺ Rep rates up to 10kHz ֺֺ Measure lasers with pulse widths up to 20ms ֺֺ New compact PE-C series Model PE25-C PE25BF-C Use High rep rate High damage threshold Aperture mm Absorber Type Spectral Range µm (a) Surface Reflectivity % approx. Calibration Accuracy +/-% (a) Max Pulse Width Setting (e) φ24 metallic 0.15 - 3 50 3 2µs 10J to 200µJ 8 0.002 10kHz 0.5 ±2% to 5kHz ±4% to 10kHz ±1.5% φ24 BF 0.15 - 3, 10.6 (f ) 20 3 1ms 2ms 10J to 10J to 2mJ 2mJ 60 100 1 2 250Hz 100Hz 10 20 ±1% ±1% Energy Scales Lowest Measurable Energy µJ (c,d) Max Pulse Width ms Maximum Pulse Rate pps Noise on Lowest Range µJ Additional Error with Frequency % Linearity with Energy for >7% of full scale (c) Damage Threshold J/cm2 (b) <100ns 1µs 300µs 2ms Maximum Average Power W (d) Maximum Average Power Density W/cm2 Uniformity over surface Fiber Adapters Available (see page 76) Weight kg Version Part Number: Standard Sensor StarLink Sensor: Direct USB link to PC (p. 75) Note: (a) Calibration curve is verified and adjusted at specified wavelengths. At other wavelengths, there may be an additional error up to the value given. 30µs 10J to 200µJ 10 0.03 5kHz 1 ±1.5% 500µs 10J to 2mJ 60 0.5 900Hz 6 ±2% to 750Hz 1ms 10J to 2mJ 80 1 450Hz 10 ±1.5% to 400Hz 5ms 10J to 2mJ 100 5 100Hz 20 ±1.5% to 80Hz 5ms 10J to 2mJ 120 5 50Hz 20 ±1% 10ms 10J to 2mJ 120 10 40Hz 20 ±1% 20ms 10J to 2mJ 200 20 20Hz 40 ±2% ±2% 0.1 0.2 2 6 15, 25 with optional heat sink 20 ±2% over central 50% of aperture ST, FC, SMA, SC 0.25 0.8 1 5 10 15, 25 with optional heat sink 20 ±2% over central 50% of aperture ST, FC, SMA, SC 0.25 7Z02937 787156 7Z02935 787154 Specified wavelengths: 248-266nm, 355nm, 1064nm and 2940nm. Max additional error at other wavelengths: ±2%. Specified wavelengths: 193nm, 248-266nm, 355nm, 532nm, 1064nm and 2940nm. Max additional error at other wavelengths: ±2%. Note: (b) For wavelengths below 600nm, derate damage threshold to 60% of given values. Below 300nm, derate to 40% of given values. Note: (c) With the "user threshold" setting set to minimum. For other settings, the spec is for >7% of full scale or greater than twice the "user threshold", whichever is greater. The user threshold is available with Nova II, Vega, StarLite or Juno. For other meters, the threshold is set to minimum and the linearity spec is >10% of full scale. The PE-C series will only operate with Nova or Orion meters with an additional adapter Ophir P/N 7Z08272 (see page 77). The adapter can introduce up to 1% additional measurement error. The user threshold feature allows adjustment of the internal threshold up to 25% of full scale if desired to avoid false triggering in noisy environments. The user threshold setting represents the approximate minimum energy for pulse widths below ~50% of the pulse width setting. For longer pulse widths, the actual minimum may be higher. For highest accuracy, it is recommended to zero the sensor against the meter the first time it is used with a particular meter. For further information, see the FAQs on our Website. Note: (d) A shock absorbing mounting post is available for situations in which sensor is mounted on a surface subject to shock or vibration. This can prevent false triggering and allow working at lower minimum energies. Note however, that in this case the maximum average power will be reduced to 10W without heat sink and 20W with heat sink (see accessory pages 76-77 for heat sink and mounting post). Note: (e) With the Laserstar, Pulsar, USBI Quasar and Nova or Orion with adapter only 2 of the 5 pulse width settings are available. For the PE-C models the 30µs and 1ms settings and for the PE-BF models the 1ms and 10ms settings. Note: (f ) The 3000nm setting is calibrated for 10.6µm as well. To measure CO2 laser, set to the 3000nm setting. The additional error for measuring 10.6µm is ±5%. * For sensors drawings please see page 71 67 For latest updates please visit our website: www.ophiropt.com/photonics 01.08.2013 1.3.2 Pyroelectric Energy Sensors 10µJ to 10J 1.3.2 Sensors Features ֺֺ φ46mm apertures ֺֺ Metallic coating for high rep rates ֺֺ BF coating for highest damage threshold ֺֺ Rep rates up to 10kHz ֺֺ Measure lasers with pulse widths up to 20ms ֺֺ New compact PE-C series PE50-C PE50BF-C Energy Sensor with optional heat sink Model PE50-C PE50BF-C Use High rep rate High damage threshold Aperture mm Absorber Type Spectral Range µm (a) Surface Reflectivity % approx. Calibration Accuracy +/-% (a) Max Pulse Width Setting (e) φ46 metallic 0.15 - 3 50 3 2µs 10J to 200µJ 10 0.002 10kHz 0.5 ±2% to 2kHz ±4.5% to 5kHz ±1.5% φ46 BF 0.15 - 3, 10.6 (f ) 20 3 1ms 2ms 10J to 10J to 2mJ 2mJ 120 300 1 2 250Hz 100Hz 30 60 ±1% ±1% Energy Scales Lowest Measurable Energy µJ (c,d) Max Pulse Width ms Maximum Pulse Rate pps Noise on Lowest Range µJ Additional Error with Frequency % Linearity with Energy for >7% of full scale (c) Damage Threshold J/cm2 (b) <100ns 1µs 300µs 2ms Maximum Average Power W (d) Maximum Average Power Density W/cm2 Uniformity over surface Fiber Adapters Available (see page 76) Weight kg Version Part Number: Standard Sensor StarLink Sensor: Direct USB link to PC (p. 75) Note: (a) Calibration curve is verified and adjusted at specified wavelengths. At other wavelengths, there may be an additional error up to the value given. 30µs 10J to 200µJ 10 0.03 5kHz 1 ±2% 500µs 10J to 2mJ 60 0.5 900Hz 6 ±2% to 750Hz 1ms 10J to 2mJ 80 1 450Hz 10 ±2% to 400Hz 5ms 10J to 2mJ 100 5 100Hz 20 ±1% to 80Hz 5ms 10J to 20mJ 600 5 50Hz 100 ±1% 10ms 10J to 20mJ 600 10 40Hz 100 ±1% 20ms 10J to 20mJ 600 20 20Hz 100 ±2% ±2% 0.1 0.2 2 6 15, 25 with optional heat sink 20 ±2% over central 50% of aperture ST, FC, SMA, SC 0.25 0.8 1 5 10 15, 25 with optional heat sink 20 ±2% over central 50% of aperture ST, FC, SMA, SC 0.25 7Z02936 787155 7Z02934 787153 Specified wavelengths: 248-266nm, 355nm, 1064nm and 2940nm. Max additional error at other wavelengths: ±2%. Specified wavelengths: 193nm, 248-266nm, 355nm, 532nm, 1064nm and 2940nm. Max additional error at other wavelengths: ±2%. Note: (b) For wavelengths below 600nm, derate damage threshold to 60% of given values. Below 300nm, derate to 40% of given values. Note: (c) With the "user threshold" setting set to minimum. For other settings, the spec is for >7% of full scale or greater than twice the "user threshold", whichever is greater. The user threshold is available with Nova II, Vega, StarLite or Juno. For other meters, the threshold is set to minimum and the linearity spec is >10% of full scale. The PE-C series will only operate with Nova or Orion meters with an additional adapter Ophir P/N 7Z08272 (see page 77). The adapter can introduce up to 1% additional measurement error. The user threshold feature allows adjustment of the internal threshold up to 25% of full scale if desired to avoid false triggering in noisy environments. The user threshold setting represents the approximate minimum energy for pulse widths below ~50% of the pulse width setting. For longer pulse widths, the actual minimum may be higher. For highest accuracy, it is recommended to zero the sensor against the meter the first time it is used with a particular meter. For further information, see the FAQs on our Website. Note: (d) A shock absorbing mounting post is available for situations in which sensor is mounted on a surface subject to shock or vibration. This can prevent false triggering and allow working at lower minimum energies. Note however, that in this case the maximum average power will be reduced to 10W without heat sink and 20W with heat sink (see accessory pages 76-77 for heat sink and mounting post). Note: (e) With the Laserstar, Pulsar, USBI Quasar and Nova or Orion with adapter only 2 of the 5 pulse width settings are available. For the PE-C models the 30µs and 1ms settings and for the PE-BF models the 1ms and 10ms settings. Note: (f ) The 3000nm setting is calibrated for 10.6µm as well. To measure CO2 laser, set to the 3000nm setting. The additional error for measuring 10.6µm is ±5%. * For sensors drawings please see page 71 68 01.08.2013 For latest updates please visit our website: www.ophiropt.com/photonics 1.3.3 High Energy Pyroelectric Sensors 20µJ to 10J PE50-DIF-C PE25BF-DIF-C 1.3.3 Sensors Features ֺֺ Sensors with diffuser for high energies and high energy densities ֺֺ Metallic coating for high rep rates ֺֺ BF coating for highest damage threshold ֺֺ Wide spectral range. Measure YAG and harmonics and many more. ֺֺ Rep rates up to 10kHz ֺֺ Measure lasers with pulse widths up to 20ms Model PE50-DIF-C PE25BF-DIF-C Use High rep rate. Complete calibration curve Complete calibration curve. High damage threshold Aperture mm Absorber Type Spectral Range µm (a) Surface Reflectivity % approx. Calibration Accuracy +/-% (a) Max Pulse Width Setting (e) Energy Scales φ35 Metallic with diffuser 0.19 - 3 25 3 2µs 30µs 500µs 10J to 10J to 10J to 2mJ 200µJ 200µJ 20 20 100 0.002 0.03 0.5 10kHz 5kHz 900Hz 1 2 20 ±2% to ±2% ±1% to 2kHz 750Hz ±4.5% to 5kHz ±1.5% φ20 BF with diffuser 0.19 - 2.2 25 3 1ms 2ms 5ms 10J to 2mJ 10J to 2mJ 10J to 20mJ 100 150 200 1 2 5 250Hz 100Hz 50Hz 15 30 40 ±1% ±1% ±1% Lowest Measurable Energy µJ (c,d) Max Pulse Width ms Maximum Pulse Rate pps Noise on Lowest Range µJ Additional Error with Frequency % Linearity with Energy for >7% of full scale (c) Damage Threshold J/cm2 (b) <100ns 1µs 300µs 2ms Maximum Average Power W (d) Maximum Average Power Density W/cm2 Uniformity over surface Weight kg Version Part Number: Standard Sensor StarLink Sensor: Direct USB link to PC (p. 75) 1ms 5ms 10J to 2mJ 10J to 20mJ 120 200 1 5 450Hz 100Hz 20 40 ±2% to ±1% to 400Hz 80Hz 10ms 10J to 20mJ 200 10 40Hz 40 ±1% 20ms 10J to 20mJ 300 20 20Hz 60 ±2% ±2% 1 2 20 40 20, 30 with optional heat sink 100 ±2.5% over central 20mm 0.25 3 5 25 50 20, 30 with optional heat sink 120 ±2.5% over central 10mm 0.25 7Z02939 787157 7Z02941 Notes: (a) Calibration curve is verified and adjusted at specified wavelengths. At other wavelengths, there may be an additional error up to the value given. Specified wavelengths: 193nm, 248-266nm, 1064nm, 2100nm and 2940nm. Additional error at 193nm ±6%. Max additional error at other wavelengths not specified above: ±2%. 193nm reading may need 1min irradiation to stabilize. Notes: (b) For wavelengths >2µm, derate to 10% of above values. For beam size <=5mm. For 10mm beam, derate to 50% of above value. Specified wavelengths: 193nm, 248-266nm, 355nm, 532nm, 1064nm and 2100nm. Additional error at 193nm ±6%. Max additional error at other wavelengths not specified above: ±3%. 193nm reading may need 1min irradiation to stabilize. For wavelengths below 600nm, derate to 60% of given values. For wavelengths below 240nm, derate to 1J/cm². For beam size <=5mm. For 10mm beam, derate to 50% of above values. Notes: (c) With the "user threshold" setting set to minimum. For other settings, the spec is for >7% of full scale or greater than twice the "user threshold", whichever is greater. The user threshold is available with Nova II, Vega, StarLite or Juno. For other meters, the threshold is set to minimum and the linearity spec is >10% of full scale. The PE-C series will only operate with Nova or Orion meters with an additional adapter Ophir P/N 7Z08272 (see page 77). The adapter can introduce up to 1% additional measurement error. The user threshold feature allows adjustment of the internal threshold up to 25% of full scale if desired to avoid false triggering in noisy environments. The user threshold setting represents the approximate minimum energy for pulse widths below ~50% of the pulse width setting. For longer pulse widths, the actual minimum may be higher. For highest accuracy, it is recommended to zero the sensor against the meter the first time it is used with a particular meter. For further information, see the FAQs on our Website. Notes: (d) A shock absorbing mounting post is available for situations in which sensor is mounted on a surface subject to shock or vibration. This can prevent false triggering and allow working at lower minimum energies. Note however, that in this case the maximum average power will be reduced to 13W without heat sink and 25W with heat sink (see accessory pages 76-77 for heat sink and mounting post). Notes: (e) With the Laserstar, Pulsar, USBI, Quasar and Nova/Orion with adapter only 2 of the 5 pulse width settings are available. For the PE-C models the 30µs and 1ms settings and for the PE-BF models the 1ms and 10ms settings. *For sensors drawings please see page 71 69 For latest updates please visit our website: www.ophiropt.com/photonics 01.08.2013 1.3.3 High Energy Pyroelectric Sensors 100µJ to 40J 1.3.3 Sensors Features ֺֺ Sensors with diffuser for high energies and high energy densities ֺֺ BF coating for highest damage threshold ֺֺ BB coating for spectral flatness ֺֺ Wide spectral range. Measure YAG and harmonics and many more. ֺֺ Rep rates up to 250Hz ֺֺ Measure lasers with pulse widths up to 20ms ֺֺ PE50BF-DIFH-C sensor - highest damage threshold PE50BF-DIF-C / PE50BF-DIFH-C PE50BB-DIF-C DIFFUSER IN DIFFUSER OUT Model PE50BF-DIF-C / PE50BF-DIFH-C PE50BB-DIF-C Use Complete calibration curve. Highest damage threshold Removable diffuser. Spectrally flat Diffuser Aperture mm Absorber Type Spectral Range µm (a) Surface Reflectivity % approx. Calibration Accuracy +/-% (a) Max Pulse Width Setting (e) Energy Scales Fixed φ35 BF with diffuser 0.19 – 2.2, 2.94 25 3 1ms 2ms 5ms 10ms 10J to 10J to 10J to 10J to 2mJ 2mJ 20mJ 20mJ 0.2 0.4 0.8 0.8 1 2 5 10 50Hz 40Hz 250Hz 100Hz 40 80 200 200 ±1% ±1% ±1% ±2% ±2% PE50BF-DIF-C PE50BF-DIFH-C 4 6 8 10 30 30 50 50 20, 30 with optional heat sink Diffuser out φ46 BB 0.19 – 20 5 3 3ms 10ms 20ms 10J to 10J to 10J to 2mJ 20mJ 20mJ 0.1 0.1 0.2 3 10 20 40Hz 10Hz 5Hz 15 15 20 ±1% ±1% ±1% ±2% Diffuser out 0.3 0.3 1 2 10, 15 with optional heat sink 10 ±2% over 70% of diameter 0.25 Lowest Measurable Energy mJ (c,d) Max Pulse Width ms Maximum Pulse Rate pps Noise on Lowest Range µJ Additional Error with Frequency % Linearity with Energy for >7% of full scale (c) Damage Threshold J/cm2 (b) <100ns 1µs 300µs 2ms Maximum Average Power W (d) 20ms 10J to 20mJ 0.8 20 20Hz 200 ±2% Maximum Average Power Density W/cm2 Uniformity over surface Weight kg Version Part Number: Standard Sensor Previous Model Part Number StarLink Sensor: Direct USB link to PC (p. 75) 200 ±2.5% over central 20mm 0.25 Notes: (a) Calibration accuracy at various wavelengths as specified here. Specified wavelengths: 193nm, 248-266nm, 355nm, 532nm, 1064nm, 2100nm and 2940nm. Additional error at 193nm ±6%. Max additional error at other wavelengths not specified above: ±3%. 193nm reading may need 1min irradiation to stabilize. For wavelengths >2μm, derate to 10% of above values. For wavelengths below 600nm, derate to 60% of given values (for DIFH 50% of given values). For wavelengths below 240nm, derate to 1J/cm². For beam size <=5mm. For 10mm beam, derate to 50% of above values. At other wavelengths, there may be an additional error up to the value given. Notes: (b) 7Z02940 7Z02943 787158 Diffuser in φ33 BB with diffuser 0.4 – 2.5 15 3 3ms 10ms 40J to 40J to 8mJ 8mJ 0.5 5 3 10 40Hz 10Hz 40 60 ±1% ±1% 20ms 40J to 8mJ 5 20 5Hz 80 ±1% Diffuser in 3 3 10 20 30, 40 with optional heat sink 500 ±2.5% over central 20mm 7Z02947 7Z02866 Calibrated at 1064nm Max additional error at other wavelengths is ±2% Calibrated at 1064nm, 532nm and 2100nm only Notes: (c) With the "user threshold" setting set to minimum. For other settings, the spec is for >7% of full scale or greater than twice the "user threshold", whichever is greater. The user threshold is available with Nova II, Vega, StarLite or Juno. For other meters, the threshold is set to minimum and the linearity spec is >10% of full scale. The PE-C series will only operate with Nova or Orion meters with an additional adapter Ophir P/N 7Z08272 (see page 77). The adapter can introduce up to 1% additional measurement error. The user threshold feature allows adjustment of the internal threshold up to 25% of full scale if desired to avoid false triggering in noisy environments. The user threshold setting represents the approximate minimum energy for pulse widths below ~50% of the pulse width setting. For longer pulse widths, the actual minimum may be higher. For highest accuracy, it is recommended to zero the sensor against the meter the first time it is used with a particular meter. For further information, see the FAQs on our Website. Notes: (d) A shock absorbing mounting post is available for situations in which sensor is mounted on a surface subject to shock or vibration. This can prevent false triggering and allow working at lower minimum energies. Note however, that in this case the maximum average power will be reduced to 13W without heat sink and 25W with heat sink (see accessory pages 76-77 for heat sink and mounting post). Notes: (e) With the Laserstar, Pulsar, USBI, Quasar and Nova/Orion with adapter only 2 of the pulse width settings are available. For the PE-BF models the 1ms and 10ms settings and for the PE-BB model the 3ms and 10ms settings. *For sensors drawings please see page 71 70 01.08.2013 For latest updates please visit our website: www.ophiropt.com/photonics PE25-C PE50-C / PE50BF-C 21 24 21 46 62 7.5 62 7.5 10.5 ADJUSTABLE 90-139 10.5 1.3.3 Sensors PE25-C / PE25BF-C ADJUSTABLE 90-139 30° 30° 100 100 75 PE25BF-DIF-C 75 PE50BF-DIF-C / PE50-DIF-C 28.5 35 7.5 35 62 NAME U.P. APPR. A.R. SIGN. 62 DATE REV. 1 10.11 NAME DRAWN E.K. APPR. A.R. SIGN. DATE 11.10 47 REV. 2 DRAWN 47 20 13.5 7.5 18 7.5 ADJUSTABLE 90-139 24.5 ADJUSTABLE 90-139 30° 30° 100 100 75 75 PE50BF-DIFH-C PE50BB-DIF-C 31 21.5 35 NAME DRAWN E.K. APPR. A.R. SIGN. REV. 1 21 62 DATE 11.10 NAME DRAWN E.K. APPR. A.R. SIGN. DATE 11.10 7.5 62 47 10.5 23.5 33-(Diffuser In) 46-(Diffuser Out) 62 REV. 1 28.5 10.5 7.5 Removable Diffuser Assembly ADJUSTABLE 90-139 ADJUSTABLE 90-139 30° 30° 100 75 REV. 1 100 NAME DRAWN U.P. APPR. A.R. SIGN. 75 DATE 07.12 71 For latest updates please visit our website: www.ophiropt.com/photonics 01.08.2013 1.3.3 High Energy Pyroelectric Sensors 10µJ to 40J PE50-DIF-ER-C DIFFUSER IN 1.3.3 Sensors Features ֺֺ Removable diffusers ֺֺ PE50-DIF-ER-C mainly for NIR lasers ֺֺ PE100BF-DIF-C for very large beams ֺֺ Rep rates up to 10kHz ֺֺ Measure lasers with pulse widths up to 20ms PE100BF-DIF-C DIFFUSER IN DIFFUSER OUT Model PE50-DIF-ER-C PE100BF-DIF-C Use Mainly for 1064nm, 2.1µm and 2.94µm Very large aperture Diffuser Aperture mm Absorber Type Spectral Range µm (a) Surface Reflectivity % approx. Calibration Accuracy +/-% (a) Max Pulse Width Setting (c) Energy Scales Diffuser out Diffuser in φ46 φ33 Metallic Metallic with diffuser 0.19 - 3 0.4 - 3 50 50 3 3 2μs 30μs 500μs 1ms 5ms 2μs 30μs 500μs 1ms 5ms 10J to 10J to 10J to 10J to 10J to 30J to 30J to 30J to 30J to 30J to 200µJ 200µJ 2mJ 2mJ 2mJ 600μJ 600μJ 6mJ 6mJ 6mJ Lowest Measurable Energy 0.01 0.01 0.06 0.08 0.1 0.05 0.05 0.3 0.4 0.5 mJ (b, d) Max Pulse Width ms 0.002 0.03 0.5 1 5 0.002 0.03 0.5 1 5 Maximum Pulse Rate pps 10kHz 5kHz 800Hz 400Hz 100Hz 10kHz 5kHz 800Hz 400Hz 100Hz Noise on Lowest Range µJ 1 1 6 10 20 5 5 30 50 100 Additional Error with ±2% to ±2% ±2% ±2% ±1% ±2% to ±2% ±2% ±2% ±1% Frequency % 2kHz to 2kHz to ±4.5% 80Hz ±4.5% 80Hz to 5kHz to 5kHz Linearity with Energy for > ±1.5% 10% of full scale (b) Damage Threshold J/cm2 <100ns 0.1 1.5 1µs 0.2 3 300µs 2 20 2ms 6 60 Maximum Average Power W (d) 15, 25 with optional heat sink 40, 60 with optional heat sink Maximum Average Power 20 500 Density W/cm2 Weight kg 0.3 Version Part Number 7Z02948 Previous Model Part Number 7Z02867 Notes: (a) DIFFUSER OUT Diffuser out φ96 BF 0.15 - 3 20 3 1ms 2ms 5ms 10J to 10J to 10J to 2mJ 20mJ 20mJ 0.4 0.7 1.5 Diffuser in φ85 BF with diffuser 0.4 - 2.5 50 3 10ms 20ms 1ms 2ms 5ms 10J to 10J to 40J to 40J to 40J to 20mJ 20mJ 40mJ 40mJ 40mJ 1.5 1.5 2 3 5 1 200 80 10 35 200 2 100 150 5 50 250 20 25 200 1 200 300 ±1% 2 100 500 10ms 40J to 40mJ 5 5 10 50 35 1000 600 20ms 40J to 40mJ 5 20 25 600 ±1% 0.8 1 5 10 15 20 3 3 10 25 40 500 1.2 7Z02942 7Z02890 Calibrated at 532nm and 1064nm Calibrated at 1064nm, Calibrated at 532nm Calibrated at 532nm, 1064nm and only 2100nm and 2940nm and 1064nm only 1550nm only Notes: (b) With the "user threshold" setting set to minimum. For other settings, the spec is for >10% of full scale or greater than twice the "user threshold", whichever is greater. The user threshold is available with Nova II, Vega, StarLite or Juno. For other meters, the threshold is set to minimum and the linearity spec is >10% of full scale. The PE-C series will only operate with Nova or Orion meters with an additional adapter Ophir P/N 7Z08272 (see page 77). The adapter can introduce up to 1% additional measurement error. The user threshold feature allows adjustment of the internal threshold up to 25% of full scale if desired to avoid false triggering in noisy environments. The user threshold setting represents the approximate minimum energy for pulse widths below ~50% of the pulse width setting. For longer pulse widths, the actual minimum may be higher. For highest accuracy, it is recommended to zero the sensor against the meter the first time it is used with a particular meter. For further information, see the FAQs on our Website. Notes: (c) With the Laserstar, Pulsar, USBI, Quasar and Nova/Orion with adapter only 2 of the 5 pulse width settings are available. For the PE50-DIF-ER-C, the 30µs and 1ms settings and for the PE100BF-DIF-C, the 1ms and 10ms settings. Notes: (d) A shock absorbing mounting post is available for situations in which sensor is mounted on a surface subject to shock or vibration. This can prevent false triggering and allow working at lower minimum energies. Note however, that in this case the maximum average power will be reduced to 13W without heat sink and 25W with heat sink (see accessory pages 76-77 for heat sink and mounting post). Not available for model PE100BF-DIF-C. PE50-DIF-ER-C PE100BF-DIF-C 28.5 23.5 33-(Diffuser In) 46-(Diffuser Out) 85-(Diffuser In) 96-(Diffuser Out) 21 62 32.5 24 85 62 125 10.5 7.5 12 7 Removable Diffuser Assembly ADJUSTABLE 90-139 30° ADJUSTABLE 122-170 30° 100 75 100 72 01.08.2013 For latest updates please visit our website: www.ophiropt.com/photonics 75 Removable Diffuser Assembly 1.3.4 RP Sensors 200mW to 1500W L1500W-LP1-RP FL250A-RP Model FL250A-RP L1500W-LP1-RP Use Absorber Type Spectral Range for Power µm Spectral Range for Energy µm Aperture mm Power Mode Power Range Power Scales Power Noise Level mW Maximum Average Power Density kW/cm2 Response Time with Display (0-95%) typ. s Power Accuracy +/-% Linearity with Power +/-% Minimum Average Power Energy Mode Energy Range Energy Scales Energy Accuracy for energies >30% of full scale Minimum Energy Long pulse lasers Broadband 0.19 - 6 0.4 - 1.1 φ50mm High power pulsed lasers LP1 0.6 - 1.1 0.6 - 1.1 φ50mm 200mW to 250W 250W / 30W 10 8 2.5 3 1 200mW 10W to 1500W 1500W / 300W 700 6 2.7 5 at 800nm and 1064nm 2 10W 100J to 1mJ 100J to 30mJ ±5% 1mJ in repetitive mode. 50mJ in single shot mode 200 6 Pulse Width J/cm2 pps <10µs 0.3 15000 0.5ms 5 1400 5ms 20 150 100ms 400 7 200J to 150mJ 200J to 1J ±5% 150mJ in repetitive mode. 500mJ in single shot mode 200 8 Pulse Width J/cm2 pps <10µs 0.05 15000 0.5ms 20 1400 5ms 120 150 100ms 2000 7 Maximum Pulse Width ms Stabilization Time s Maximum Energy Density and Rep Rate vs. Pulse Width Pulse Shape Photodiode Response Time Peak Voltage into 50Ω System Specifications with USB PC Interface Frequency Measurement Accuracy Statistics Displayed Maximum Data Acquisition Rate Cooling Weight kg Version Part number FL250A-RP 1.3.4 Sensors Features ֺֺ Very long pulse repetitive lasers ֺֺ Energy measurement at high average powers ֺֺ Pulse rates to 15kHz ֺֺ Pulse widths to 200ms ֺֺ Temporal pulse shape measurement into scope 1µs 1µs 0.8V for 1kW peak power at 1064nm 0.3V for 1kW peak power at 1064nm ±0.01% ±0.01% Min, Max, Std Dev Min, Max, Std Dev Sample to 15kHz, every pulse to 1000Hz in turbo mode fan water 1.2 1.4 V1 7Z02921 7Z02919 L1500W-LP1-RP 73 For latest updates please visit our website: www.ophiropt.com/photonics 01.08.2013 Maximum Laser Repetition Rate for a Given Pulse Width Setting for RP Heads Maximum Pluse Width Setting (ms) 0.01 0.1 1 10 100 10000 1.3.4 Sensors 10000 1000 100 10 Maximum Repetition Rate (Hz) 100000 74 01.08.2013 For latest updates please visit our website: www.ophiropt.com/photonics 1.3.5 StarLink Direct to PC Energy Sensors The StarLink Energy Sensor Series 1.3.5 Sensors The StarLink series is a select group of Ophir energy sensors that are provided with the Ophir Juno USB PC interface attached. The StarLink sensor is connected via a USB cable to the PC USB port and can then operate directly with the PC with no need for an Ophir power meter. The StarLink package comes bundled with the celebrated Ophir StarLab software – the easiest to use and most sophisticated power/energy meter PC software available. Alternatively, StarLink sensors can be operated from the user’s software via the COM Object interface provided or can work with LabVIEW via the drivers provided. For more details about the computer interface options and StarLab software, see section 2.3.1 on page 105. Below is a list of the StarLink energy sensors currently available together with the reference page for the specifications on the relevant sensor. StarLink Sensor StarLink P/N Corresponding stand alone sensor Ophir P/N Data sheet page PE10-C-StarLink PE25-C-StarLink PE25BF-C-StarLink PE50-C-StarLink PE50BF-C-StarLink PE50-DIF-C-StarLink PE50BF-DIF-C-StarLink 787152 787156 787154 787155 787153 787157 787158 PE10-C PE25-C PE25BF-C PE50-C PE50BF-C PE50-DIF-C PE50BF-DIF-C 7Z02932 7Z02937 7Z02935 7Z02936 7Z02934 7Z02939 7Z02940 66 67 67 68 68 69 70 75 For latest updates please visit our website: www.ophiropt.com/photonics 01.08.2013 1.3.6 Energy Sensors Accessories 1.3.6.1 Accessories for Pyroelectric Sensors Oscilloscope Adapter for Pyroelectric Sensors 1.3.6 Sensors Fiberoptic Adapter for Pyroelectric Sensors Heat Sink for PE-C Series Sensors Beam Splitter Assembly 138 121 108 62 112 4 5° 75 91 LASER LASER Beam splitter installed – reflected beam on sensor Beam Splitter removed – direct beam on sensor F. S. Beam Splitter, 2 sided reflection F.S. Beam Splitter, 2 sided reflection unpolarized light unpolarized light 16 Material Spectral range Aperture Damage threshold for pulses Fraction split off UV grade fused silica 0.19 - 2.2µm φ60mm < 10ns PW >300µs PW 5J/cm2 >200J/cm2 See graph Percent reflectance Beam Splitter Specifications Percent reflectance 14 12 10 8 6 4 2 0 00 200 200 400 400 600 600 800 800 1000 1000 1200 1200 1400 1400 1600 1600 1800 1800 2000 2000 2200 2200 2400 2400 2600 2600 2800 2800 Wavelength, nm Wavelength, nm Accessory Description Heat Sink Heat sink that screws onto rear of PE25 and PE50 series 7Z08267 sensors and allows working at over 50% higher average powers. Plugs in between the PE sensor and power meter. 1Z11012 Provides BNC output to scope to see every pulse up to the maximum frequency of the sensor. To mount fibers to sensors you need an adapter bracket and fiber adapter. All fiber adapters are compatible with the adapter bracket selected. Mounting brackets to allow mounting fiber adapters to pyroelectric sensors. Bracket P/N Distance from fiber detector 7Z08275 10mm Scope Adapter Fiber Adapters Fiber Adapter Brackets PE Sensor Family Type PD10-C / PD10-pJ-C / PD10-IR-pJ-C PE50-C / PE50BF-C PE9-C /PE10-C/ PE10BF-C / PE25-C / PE25BF-C Fiber Adapters For all PE sensors above Beam Splitter Assembly Part number 7Z08270 7Z08269 Fiber adapters for mounting to above brackets Beam Splitter Assembly to measure pulsed laser sources too energetic for direct measurement. The reading with the Beam Splitter can be calibrated by setting the laser to a lower energy that will not damage the sensor and then taking a measurement with the beam splitter and without and taking the ratio. SC type 7Z08227 7Z17001 76 01.08.2013 For latest updates please visit our website: www.ophiropt.com/photonics 15mm 10mm ST type 7Z08226 FC type 7Z08229 SMA type 1G01236 3000 3000 1.3.6.1 Accessories for Pyroelectric Sensors - Continued Damage Threshold Test Slides Shock Absorbing Mounting Post IR Phosphor Glass 1.3.6.1 1.3 Sensors Nova PE-C Adapter PE-C to PE Size Adapter PE-C Sensor Size Adapter Accessory Description Part number Shock Absorbing Mounting Post Damage Threshold Test Plates Post with rubber encased thread to isolate sensor from vibration and prevent false triggering at low energy levels. Test plates with same absorber coating as the sensor. For testing that laser beam is not above damage threshold (1such plate is included with sensor package). The adapter plugs between the Nova D15 socket and the smart plug of the PE-C sensor to allow the Nova to operate with PE-C series sensors. See PE-C spec sheet for details. The newer PE-C series sensors have a φ62mm diameter. The older PE series sensors have a φ85mm diameter. This adapter allows using the PE-C type sensors in jigs and setups that were originally designed for PE sensors. Glass slide (75x25mm) with phosphor coating (25x50mm) that visualizes spectral region 810-860nm, 900-1100nm and 1500-1600nm. Stands up to 1KW/cm² and 0.5J/cm². Self actuating, does not need charging from light source. 7Z08268 Nova PE-C Adapter PE-C to PE Size Adapter IR Phosphor Card Metallic type BF type 7E06031A 7E06031D 7Z08272 7Z08273 7F01235A 77 For latest updates please visit our website: www.ophiropt.com/photonics 01.08.2013 1.3.6.2 Fast Photodetector Model FPS-1 1.3.6.2 Sensors Features ֺֺ Fast 1ns response time ֺֺ Measure temporal pulse shape of short or long pulses ֺֺ Wide spectral range 193 – 1100nm ֺֺ Optional attenuators and fiber adapters available ֺֺ Battery or wall cube operation Description The FPS-1 fast photodetector is a compact easy to use very fast photodetector with wide spectral response. It is used to measure the temporal pulse shape of laser pulses. It has two modes of operation: Into 50Ohm load for ns high peak power pulses and 10kOhm load for longer lower peak power pulses. In order to adjust the input intensity to the level appropriate for the detector, you may scatter the laser light off of a white matt surface and back off till the appropriate intensity is reached. Alternatively, or in addition, you may procure the ND attenuators listed below which may be stacked. Specifications of the FPS-1 Fast Photodetector 61 27 23 BNC Connector 12 7.5 9.2 17 1.035"-40 (SM1) 9.5 Alternate Pole Mounting Thread Battery housing 11.5 1/4" - 20 REF 1/4" - 20 BSWx6 deep Mounting Thread 78 01.08.2013 Battery On/Off 24.5 Input Dimensions Thread Sensor Part Number Optional Accessories and P/N Silicon PIN photodiode 193nm – 1100nm 0.8mm² 720nm See graph below Into 50Ω load Into 10kΩ load 0.15V for 1W/cm² input 60V for 1W/cm² input 1.5ns 3µs 10V 12V A23 alkaline battery (40 hours lifetime). Also can be operated from 12VDC wall cube power supply. The power supply can be ordered from your local distributor. Direct beam or from fiber connection. See drawing Front flange is threaded with male SM1 thread. FPS-1 fast photodiode 7Z02505 7Z08200 ND1 nom. x10 attenuator 7Z08201 ND2 nom. x50 attenuator Fiber adapters SMA 1G01236 FC 7Z08229 SC 7Z08227 ST 7Z08226 SM1 to M20 adapter (1 necessary for above adapters and/or attenuators) 1G02259 49 Detector Spectral Range Detector Area Wavelength of Peak Sensitivity Spectral Response Performance Specs Sensitivity at Peak Wavelength Risetime 10-90% Maximum Output Voltage Power Supply For latest updates please visit our website: www.ophiropt.com/photonics Detector Surface 1.3.7 OEM Solutions Introduction 1.3.7 Sensors Many laser systems manufacturers need to have a measuring capability built into their systems. Ophir is the world’s leading supplier of OEM laser power/energy measurement instrumentation which can be built into host systems (such as medical, industrial, etc). With extensive experience accumulated in the field, Ophir offers the largest variety of OEM products and is therefore best able to satisfy customer requirements. Many configurations possible An OEM solution is usually needed to monitor laser performance in the system, and possibly to provide fast feedback for system control. Depending on your application, various configurations can be used, such as: ֺֺ ֺֺ ֺֺ ֺֺ Just a sensor, with raw analog output Sensor with electronics providing an amplified – or digital - output Complete instrument, including numeric display and/or PC interface Custom designed solution for special requirements In the following pages, you will see a range of "standard" OEM sensors available; these are actually families of existing OEM sensors with typical specifications shown. They can be tailored as needed to fit your specific requirements. In addition to the products described below, Ophir has developed hundreds of other OEM solutions. Simply contact your Ophir representative who is likely to have just the right solution to your needs. 79 For latest updates please visit our website: www.ophiropt.com/photonics 01.08.2013 Standard Pyroelectric OEM Sensors - Introduction Ophir manufactures three main types of pyroelectric OEM sensors: 1.3.7 Sensors ֺֺ ֺֺ ֺֺ Low profile pyro sensors with no electronics with a BNC output to connect to the host electronics. These sensors can also be connected to an oscilloscope to measure pulse energy. Since the energy of pyro sensors is proportional to the peak to valley voltage output and not the maximum voltage output, the user has to take this into account in designing the electronic interface (see below). Low profile smart sensors to be used with Ophir smart meters. These PE-RE type sensors have a Remote Electronics (RE) module to enable interface with the meter. Compact pyroelectric sensors with built-in amplifiers and signal conditioners which put out a voltage proportional to energy and hold this voltage for a preset period after each pulse (see below). Typical output from a low-profile pyroelectric sensor appears as follows: Ophir low profile pyroelectric sensor output for repetitively pulsing laser In the example shown above using a low-profile sensor, note that energy is proportional to ΔV and not to the voltage above the zero level. Note also that the peak rapidly decays and therefore the output depends on pulse rate and duration. It follows therefore that in order to measure pyroelectric pulses, the voltage level must be known before the pulse and must also compensate for pulse rate (or work at a low enough pulse rate for the correction to be rendered negligible). When using a sensor with built-in electronics, typical output appears as follows: Output from Ophir pyroelectric OEM sensor with built-in signal conditioning Note that the energy is now proportional to the output voltage and since the voltage is held for a fixed time, the output is much less dependent on pulse rate or duration. In the above example, the user does not need to perform any signal conditioning but simply has to read the voltage level to determine the energy. 80 01.08.2013 For latest updates please visit our website: www.ophiropt.com/photonics 1.3.7.1 Standard OEM Pyroelectric Energy Sensors 2µJ to 20mJ PE10-S PE10-S-Q 1.3.7.1 Sensors Features ֺֺ Compact ֺֺ Low Profile ֺֺ Low Cost The following specifications refer to standard OEM sensors, and are to be understood as generic, describing sensor families. Ophir will be happy to help you with a specific solution for your particular application. Model Features PE10-S High sensitivity and rep rate PE10-S-Q Very compact Aperture mm Absorber Type Spectral Range µm (a) Surface Reflectivity % approx. Calibration Accuracy +/-% (a) Sensitivity (approx) at 1064nm Max Pulse Width (b) Maximum Pulse Rate pps (b) Maximum Energy Minimum Energy Noise Equivalent Energy, approx Output Damage Threshold J/cm2 <100nm 1µs 300µs Maximum Average Power W Maximum Average Power Density W/cm2 Dimensions Part Number 12 Metallic 0.19-3 50 3 100V/J into 1MΩ 25us 400 20mJ 2µJ 100nJ BNC 8 Metallic 0.19-3 50 3 15V/J into 1MΩ and 5nF load 500us 100 20mJ 2µJ 100nJ Flying Leads 0.1 0.2 3 2 50 Ø50.8 x 14mm Consult Ophir representative 0.1 0.2 3 2 50 30 x 40 x 14mm Consult Ophir representative Notes: (a) Notes: (b) PE10-S At calibrated wavelength, standard 1064nm. Others on request. There is a trade off between repetition rate, sensitivity and maximum pulse width. If standard products are not suitable, these parameters can be tailored to customer requirements. PE10-S-Q 81 For latest updates please visit our website: www.ophiropt.com/photonics 01.08.2013 1.3.7.1 Standard OEM Pyroelectric Energy Sensors 0.1mJ to 10J PE25-S / PE25BB-S PE25-A-DIF-XXX-YYY(c) PE25BB-S-DIF 1.3.7.1 Sensors Features ֺֺ Compact ֺֺ Low Profile ֺֺ Low Cost ֺֺ With built-in electronics, for complete self-contained OEM solution with calibrated square pulse output The following specifications refer to standard OEM sensors, and are to be understood as generic, describing sensor families. Ophir will be happy to help you with a specific solution for your particular application. Model PE25-S PE25BB-S PE25BB-S-DIF PE25-A-DIF-XXX-YYY(c) Features General purpose Spectrally flat Aperture mm Absorber Type Spectral Range µm Surface Reflectivity % approx. Calibration Accuracy +/-% Sensitivity (approx) at 1064nm Max Pulse Width Maximum Pulse Rate pps Frequency Dependence Pulse Width Dependence Noise Equivalent Energy, approx Output 24 x 24 Metallic 0.19-3 (a) 50 3 (a) 9V/J into 1MΩ 300us (b) 40 (b) 24 x 24 Broadband 0.19-20 (a) 10 3 (a) 5.5V/J into 1MΩ 1ms (b) 20 (b) High damage threshold φ 20 Broadband + diffuser 0.4-3 (a) 15 3 (a) 2V/J into 1MΩ at 2.9µm 1ms (b) 20 (b) Built in amplifier. Output of calibrated square pulses φ 24 Metallic + diffuser 0.4-3 15 3 5µJ BNC 50µJ BNC 150µJ BNC 10J 0.1mJ 10J 1mJ 10J 3mJ 0.1 0.2 2 0.3 0.3 1 3 3 10 Output Hold Calibration Adjustment Maximum Energy Minimum Energy Damage Threshold J/cm2 <100nm 1µs 300µs Linearity with Energy Maximum Average Power W Maximum Average Power Density W/cm2 Dimensions Part Number Notes: (a) Notes: (b) Notes: (c) Notes: (d) Notes: (e) PE25-S / PE25BB-S 10 10 10 10 Ø50.8 x 14mm Ø50.8 x 14mm Consult Ophir representative 30 300 Ø50.8 x 18mm Customer specified Volt/J into input impedance of >3kΩ (d) Hold time can be specified by customer (e) Trimpot accessible through back cover of sensor 10J 0.1mJ 1.5 3 8-100, depending on wavelength ±2% for > 10% of full scale 50 Ø50.8 x 28mm At calibrated wavelength, standard 1064nm. Others on request. There is a trade off between repetition rate, sensitivity and maximum pulse width. If standard products are not suitable, these parameters can be tailored to customer requirements. XXX denotes the calibration wavelength in μm and the YYY denotes the calibrated sensitivity in V/J. Output voltage is limited to 1.5 volt less than input V+. For example if input voltage is +6V and sensitivity is 10V/J, then maximum pulse energy is limited to 4.5V = output of 0.45J. Accuracy of hold time is ±20%. Maximum hold time limited to 50% of duty cycle. At end of hold time, voltage drops to below 0.2V. PE25-A-DIF-XXX-YYY (c) 82 01.08.2013 3ms 1000 <±2% to maximum frequency <±2% to maximum pulse width For latest updates please visit our website: www.ophiropt.com/photonics 1.3.7.1 Standard OEM Pyroelectric Energy Sensors 1mJ to 10J Features ֺֺ Large apertures ֺֺ Compact ֺֺ Low Profile ֺֺ Low Cost 1.3.7.1 Sensors PE50-S / PE50BB-S The following specifications refer to standard OEM sensors, and are to be understood as generic, describing sensor families. Ophir will be happy to help you with a specific solution for your particular application. Model Features PE50-S Large aperture PE50BB-S Large aperture, spectrally flat Aperture mm Absorber Type Spectral Range µm (a) Surface Reflectivity % approx. Calibration Accuracy +/-% (a) Sensitivity (approx) at 1064nm Max Pulse Width (b) Maximum Pulse Rate pps (b) Maximum Energy Minimum Energy Noise Equivalent Energy, approx Output Damage Threshold for 10ns pulses J/cm2 <100nm 1µs 300µs Maximum Average Power W Maximum Average Power Density W/cm2 Dimensions Part Number φ 46 Metallic 0.19-3 50 3 2.5V/J into 1MΩ 800µs 10 10J 1mJ 20uJ BNC φ 46 Broadband 0.19-20 5 3 1.8V/J into 1MΩ 2ms 10 10J 10mJ 0.5mJ BNC 0.1 0.2 2 20 10 Ø75 x 14mm Consult Ophir representative 0.3 0.3 1 15 10 Ø75 x 14mm Consult Ophir representative Notes: (a) Notes: (b) At calibrated wavelength, standard 1064nm. Others on request. There is a trade off between repetition rate, sensitivity and maximum pulse width. If standard products are not suitable, these parameters can be tailored to customer requirements. PE50-S / PE50BB-S 83 For latest updates please visit our website: www.ophiropt.com/photonics 01.08.2013 1.3.7.2 Examples of Custom OEM Energy Sensor Solutions 1.3.7.2 Sensors In addition to the standard OEM products described above, Ophir has accumulated over 25 years experience in developing products which are tailored to precise physical configurations provided by the OEM customer. These products include special antireflection coatings for specific wavelengths, specially configured pyroelectric sensors (with or without electronics), and much more. A number of these special OEM products are shown below. OEM Pyroelectric Sensor with Built-In Amplifier This sensor requires a compact cylindrical case with detector sensitivity reaching the diameter edge. The Ø32 x 30mm device has a built in amplifier. Ophir Pyroelectric Sensor with add on OEM Electronics Module This pyroelectric sensor is designed to be used as a Smart Sensor compatible with Ophir Smart meters, but also comes with an OEM I/F module providing calibrated analog voltage output to host system. PE10-OEM Sensor This is a highly compact OEM pyroelectric sensor, measuring only φ 22 x 7.5mm with an AR coating on the surface for the wavelength of measurement. It can have a simple analog output or can be supplied with a circuit board to produce calibrated analog or digital RS232 or USB output. PE-C RS232 OEM Sensors The new PE – C Series of pyroelectric sensors has an option of RS232 output suitable for OEM use. The sensors give numerical energy output and the ranges and wavelength settings can be controllable from the host PC. The input and output is available at the DB9 connector at the end of the cable. Ordering Information: The products shown above are examples of OEM solutions developed for specific customer applications. Please consult with your Ophir representative who will be happy to help you with any requirements you may have. 84 01.08.2013 For latest updates please visit our website: www.ophiropt.com/photonics Power Meters 85 For latest updates please visit our website: www.ophiropt.com/photonics 01.08.2013 2.0 Power Meters & Interfaces Power Meter Finder The table below lists the specs and features of Ophir Power Meters and PC Interfaces 2.0 Power Meters Meters Digital Display Display Color Analog Display Rechargeable Battery Detector Support Thermal Sensors Photodiode Sensors Pyroelectric Sensors RP Sensors BeamTrack Sensors* Measurement Options Average Power Energy per Pulse (Pyro. Sensors) Single Shot Energy (Thermal Sensors) Statistics Analog Out Trigger input & output Real-Time Logging RS232 GPIB USB Bluetooth On-Board Data Storage Automation Interface Labview VI's Part number Page in the catalog Vega Nova II LaserStar Single Channel Yes Monochrome No Yes Nova StarLite Yes Monochrome Yes Yes LaserStar Dual Channel Yes Monochrome No Yes Yes Color Yes Yes Yes Monochrome No Yes Yes Monochrome Yes Yes Yes Yes Yes No Yes Yes Yes Yes No Yes Yes Yes Yes Yes No Yes Yes Yes Yes No Yes Yes Yes No No Yes Yes Yes No Yes Yes Yes Yes Yes 1V,2V,5V,10V No Yes Yes Yes Yes 1V,2V,5V,10V No Yes Yes Yes Yes 1V No Yes Yes Yes Yes 1V No Yes Yes Yes Yes 1V No Yes Yes Yes No 1V No 30Hz N/A 2000Hz N/A 250K Yes for USB Yes 7Z01560 89 30Hz N/A 2000Hz N/A 50K Yes for USB Yes 7Z01550 91 30Hz 1500Hz N/A N/A 50K No Yes 7Z01601 93 30Hz 1500Hz N/A N/A 50K No Yes 7Z01600 93 10Hz N/A N/A N/A 1K No Yes 7Z01500 95 N/A N/A N/A N/A No No No 7Z01565 97 Ophir power meters are true plug-and-play instruments. With all sensor information and calibration stored in the sensor plug, just plug in any one of over 150 Ophir sensors and the instrument is calibrated and configured to measure laser power and energy with that sensor. *Position and size measurement capabilities on Vega, Nova II, StarLite and Juno. Power and single-shot energy measurement on all instruments. 86 01.08.2013 For latest updates please visit our website: www.ophiropt.com/photonics PC Interfaces Quasar Juno USBI Pulsar-4 Pulsar-2 Pulsar-1 N/A N/A N/A Yes N/A N/A N/A Powered from USB N/A N/A N/A Powered from USB N/A N/A N/A No N/A N/A N/A No N/A N/A N/A No Yes Yes Yes No No Yes Yes Yes No Yes Yes Yes Yes Yes No Yes Yes Yes No No Yes Yes Yes No No Yes Yes Yes No No Yes Yes Yes Yes No No Yes Yes Yes Yes No No Yes Yes Yes Yes 1V No Yes Yes Yes Yes No Yes Yes Yes Yes Yes No Yes Yes Yes Yes Yes No Yes N/A N/A N/A 500Hz No No No 7Z01300 103 N/A N/A 10,000Hz N/A No Yes Yes 7Z01250 101 N/A N/A 2000Hz N/A No Yes Yes 7Z01200 N/A N/A 25,000Hz N/A No Yes Yes 7Z01201 102 N/A N/A 25,000Hz N/A No Yes Yes 7Z01202 102 N/A N/A 25,000Hz N/A No Yes Yes 7Z01203 102 2.0 Power Meters Wireless Interface 87 For latest updates please visit our website: www.ophiropt.com/photonics 01.08.2013 Power Meters and PC Interfaces 2.0 Power Meters Ophir power meters and PC interfaces work on the smart plug principle. This means that almost any Ophir power meter or PC interface can work – plug and play – with almost any of the wide range of Ophir sensors. Ophir power meters are also the most sensitive, lowest noise, most precise calibration units on the market thus giving the untmost performance from our smart sensors. As for ease of use, only Ophir power meters have smart keys to give the easiest and most convenient user interface. The units also come with a versatile range of software to use seamlessly either with the Ophir software or the user’s own. Thermal Sensors Powers mW to kW and single shot energy Photodiode Sensors Powers pW to Watts Pyroelectric Sensors Energies pJ to Joules Rep rates to 25kHz Computer Interfaces with USB/Bluetooth Power Meters with USB/RS232 Vega color Juno compact Nova ll general Nova compact Laserstar 2 channel Pulsar 1, 2, 4 channels Quasar wireless USB Interface basic Software Solutions StarLab, LabVIEW, StarCom ActiveX & COM Object Interfaces StarLab software 88 01.08.2013 For latest updates please visit our website: www.ophiropt.com/photonics LabVIEW 2.1 Power Meters 2.1.1 Vega Color Screen Laser Power/Energy Meter ֺֺ ֺֺ ֺֺ ֺֺ ֺֺ ֺֺ ֺֺ ֺֺ ֺֺ ֺֺ ֺֺ Compatible with all Ophir thermal, BeamTrack, pyroelectric and photodiode sensors Brilliant color large size TFT 320x240 display Compact handheld design with rubberized bumpers and optimized 2 position kickstand Choice of digital or analog needle display Illuminated keys for working in the dark Analog output Log every point at up to 4000Hz with pyro sensors Non volatile data storage up to 250,000 points Laser tuning screen and power and energy log USB and RS232 interfaces with StarLab and StarCom PC applications, LabVIEW driver, COM Object Interface and ActiveX control (see pages 105-109) Soft keys and menu driven functions with on line help Many software features such as density, min/max, scaling etc. 2.1.1 Power Meters ֺֺ The Vega is the most versatile and sophisticated handheld laser power/energy meter on the market. Just plug in one of the many Ophir sensors and you have a whole measurement laboratory at your fingertips. The bright color display gives unparalleled legibility and ease of interpreting information. The Vega has many on board features such as laser tuning, data logging, graphing, normalize, power or energy density units, attenuation scaling, max and min limits. The Vega can also display the power or energy with a high resolution simulated analog needle display. The Vega can be operated either by battery or from an AC source with the charger plugged in at all times. Its bright display and backlit keys allow easy use in dark room conditions or with laser glasses on. The built-in USB and RS232 interfaces and StarLab and StarCom PC software allow on-line processing of data or processing previously stored data; results are displayed graphically on a PC. To support PC interfacing, LabVIEW drivers, COM Object Interface and ActiveX controls are provided. StarLab Software Selected Screens Digital Power Screen and Color Functions ֺֺ ֺֺ ֺֺ ֺֺ Choice of bright on dark or dark on bright characters Optimize colors for use with laser eye protection glasses Can average over selected period. Useful for unstable lasers Bar graph can show max / min / average in different colors Standard Power Screen Sensor type and S/N Access further functions Average period Choice of bright on dark or dark on bright characters Power range Go to energy screen Detailed help Zoom bar graph can show max/min/ave BeamTrack Power/Position/Size Screen ֺֺ ֺֺ ֺֺ ֺֺ Monitoring of laser beam size Accurate tracking of beam position to fractions of a mm Beam position and wander All the other features of standard power/energy meters Subtract offset BeamTrack Power/Position/Size Screen Sensor type and S/N Power measurement Position and size measurement with BeamTrack sensor Measurement parameters Position and size graph Soft Keys 89 For latest updates please visit our website: www.ophiropt.com/photonics 01.08.2013 Analog Power Screen ֺֺ ֺֺ ֺֺ Choice of smaller display with range, menu, laser and average headers. Perfect for adjusting and maximizing laser power Persistent graphical display allows tracking of minimum maximum values measured Large analog needle with small digital display as well Energy threshold Energy/Limits Screen ֺֺ 2.1.1 Power Meters ֺֺ ֺֺ Pulsed energy sensors (single or repetitive) and thermal sensors (single shot only). Frequency measurement with pulsed energy sensors. Limits screen with bright colored warning Energy range Energy Logging Screen ֺֺ ֺֺ ֺֺ ֺֺ Pyroelectric and thermal sensors Continuous scroll with up to 100 points on screen Full statistics Store data onboard and recall Enlarge variation pulse to pulse Choose analog needle screen Additional Functions ֺֺ Press the menu choice on the main screen and many more options pop up as shown Set startup configuration Laser tune screen with continuous graph Adjust sensor calibration Normalize so present reading is 1.00 Enter beam diameter and read in units of W/cm2 or J/cm2 Adjust sensor response time Put in factor to read input power with attenuator or beam splitter Set for alarm if preset min or max limits exceeded Return to previous menu Adjust power meter parameters Specifications Power Meter Features Program Features Brilliant color TFT 320 x 240 pixel graphics LCD. Large 16mm digits. High resolution analog needle also can be chosen. Many screen features including power with multicolor bar graph, energy, average, exposure, frequency, graphs, scaling, special units, and more. Complete on line context sensitive help screens. USB, RS232 and user selectable 1, 2, 5 and 10 Volt full scale analog output. 15 times/sec Molded high impact plastic with optimized angle two level kickstand. Rubberized sides for easy grip and protection against damage. Folds to a compact 208mm L x 117mm W x 40mm H Rechargeable NiMH batteries with typically 18 hours between charges. The charger can be ordered from your local distributor. The charger also functions as an AC adapter. Data can be viewed on board or transmitted to pc: On Board: Non volatile storage of up to 250,000 data points in up to 10 files. Max data logging rate 4000(a) points/s. Transmitted to PC: Data transmission rate of ~500 points/s. RS232 baud rate of 38400. Works with Thermopile, BeamTrack, Pyroelectric and Photodiode sensors. Automatic continuous background cancellation with PD300 sensors Submicrojoule and multikilohertz capability with pulsed energy sensors. Preferred start up configuration can be set by user. User can recalibrate power, energy, response time and zero offset. Notes: (a) The above refers to the rate of logging every single point in turbo mode. Above that rate, the instrument will sample points but not log every single point. Outputs Screen Refresh Case Size Battery Data Handling Sensor Features Ordering Information Item Vega Carrying Case USB Cable for Vega RS232 Cable for Vega Battery Pack for Vega Description Vega color universal power meter for thermal, pyroelectric and photodiode sensors Carrying case 38x30x11 cm. For power meter and up to 3 sensors USB to mini DIN cable (1 unit supplied with Vega) D9 to mini DIN cable (1 unit supplied with Vega) Replacement battery pack for the Vega 90 01.08.2013 For latest updates please visit our website: www.ophiropt.com/photonics Ophir P/N 7Z01560 1J02079 7E01205 7E01206 7E14007 2.1.2 Nova ll Versatile Laser Power/Energy Meter ֺֺ ֺֺ ֺֺ ֺֺ ֺֺ ֺֺ ֺֺ ֺֺ ֺֺ ֺֺ ֺֺ Compatible with all Ophir thermal, BeamTrack, pyroelectric and photodiode sensors Large high definition LCD display Choice of digital or analog needle display 2 position kickstand Backlighting and rechargeable battery Analog output Log every point at up to 4000Hz with pyro sensors Non volatile data storage up to 54,000 points Laser tuning screen and power and energy log USB and RS232 interfaces with StarLab and StarCom PC applications, LabVIEW driver, COM Object Interface and ActiveX control (see pages 105-109) Soft keys and menu driven functions with on-line help Many software features such and density, min/max, scaling etc. 2.1.2 Power Meters ֺֺ The Nova II is the most versatile and sophisticated handheld laser power/energy meter on the market. Just plug in one of the many Ophir sensors and you have a whole measurement laboratory at your fingertips. The Nova II has many on-board features such as laser tuning, data logging, graphing, normalize, power or energy density units, attenuation scaling, max and min limits. The Nova II can also display the power or energy with a high resolution simulated analog needle display. The Nova II can be operated either by battery or from an AC source with the charger plugged in at all times. Its backlight allows illumination of the power meter in low light conditions. The built-in USB and RS232 interfaces and StarLab and StarCom PC software allow on-line processing of data or processing previously stored data; results are displayed graphically on a PC. To support PC interfacing, LabVIEW drivers, Com Object Interface and ActiveX controls are provided. StarLab Software Selected Screens Digital Power Screen ֺֺ ֺֺ ֺֺ ֺֺ CW industrial, medical and scientific lasers pW to Multi kW with appropriate sensors Can average over selected period. Useful for unstable lasers Fast response bar graph Standard Power Screen Access further functions Sensor type and S/N Selected range Average period Selected laser wavelength Power range Change to energy Zoom bar graph Subtract offset Detailed help BeamTrack Power/Position/Size Screen ֺֺ ֺֺ ֺֺ ֺֺ Monitoring of laser beam size Accurate tracking of beam position to fractions of a mm Beam position and wander All the other features of standard power/energy meters BeamTrack Power/Position/Size Screen Sensor type and S/N Power measurement Position and size measurement Measurement parameters Position and size graph Soft Keys 91 For latest updates please visit our website: www.ophiropt.com/photonics 01.08.2013 Analog Power Screen ֺֺ ֺֺ Perfect for adjusting and maximizing laser power Large analog needle with small digital display as well Choice of smaller ,display with range menu, laser and average headers Energy Screen ֺֺ ֺֺ Pulsed energy sensors (single or repetitive) and thermal sensors (single shot only) Frequency measurement with pulsed energy sensors Energy range Frequency 2.1.2 Power Meters Energy Logging Screen ֺֺ ֺֺ ֺֺ ֺֺ Pyroelectric and thermal sensors Continuous scroll with up to 100 points on screen Full statistics Store data onboard and recall Enlarge variation pulse to pulse Choose analog needle screen Additional Functions ֺֺ Press the menu choice on the main screen and many more options pop up as shown Laser tune screen with continuous graph Normalize so present reading is 1.00 Enter beam diameter and read in units of W/cm2 or J/cm2 Put in factor to read input power with attenuator or beam splitter Set for alarm if preset min or max limits exceeded Set startup configuration Adjust sensor calibration Adjust sensor response time Adjust power meter parameters Return to previous menu Specifications Power Meter Program Features High legibility 320 x 240 pixel graphics LCD with switchable electroluminescent backlight. Large 18mm digits. High resolution analog needle also can be chosen. Many screen features including power with bar graph, energy, average, exposure, frequency, graphs, scaling, special units, and more. Complete on line context sensitive help screens. USB, RS232 and 1, 2, 5 and 10 volt full scale analog output. 15 times/sec Molded high impact plastic with two level kickstand. Folds to a compact 208mm Lx 117mm Wx 40mm H Rechargeable NiMH batteries with typically 18 hours between charges. The charger can be ordered from your local distributor. The charger also functions as an AC adapter. Data can be viewed on board or transmitted to PC: On Board: Non volatile storage of up to 54000 data points in up to 10 files. Max data logging rate 4000 (a) points/s. Transmitted to PC: Data transmission rate of ~500 points/s. RS232 baud rate of 38400. Works with Thermopile, BeamTrack, Pyroelectric and Photodiode sensors. Automatic continuous background cancellation with PD300 sensors. Submicrojoule and multikilohertz capability with pulsed energy sensors. Preferred startup configuration can be set by user. User can recalibrate power, energy, response time and zero offset. Notes: (a) The above refers to the rate of logging every single point in turbo mode. Above that rate, the instrument will sample points but not log every single point. Features Outputs Screen Refresh Case Size Battery Data Handling Sensor Features Ordering Information Item Nova II Carrying Case Nova II USB Cable Nova II RS232 Cable Battery Pack Description Nova II universal power meter for thermal, pyroelectric and photodiode sensors Carrying case 38x30x11 cm. For power meter and up to three sensors USB to mini DIN cable (1 unit supplied with Nova II) D9 to mini DIN cable (1 unit supplied with Nova II) Replacement battery pack for the Nova II 92 01.08.2013 For latest updates please visit our website: www.ophiropt.com/photonics Ophir P/N 7Z01550 1J02079 7E01205 7E01206 7E14007 2.1.3 Laserstar ֺֺ ֺֺ ֺֺ ֺֺ ֺֺ ֺֺ ֺֺ ֺֺ ֺֺ ֺֺ ֺֺ ֺֺ ֺֺ ֺֺ ֺֺ ֺֺ ֺֺ Two models available: dual and single channel Single channel model can be upgraded to dual channel Compatible with all Ophir thermopile, pyroelectric, photodiode and RP sensors Large LCD display Backlighting and rechargeable battery Screen graphics and statistics (std dev. min, max) Analog output Built-in RS232 interface Log every data point at >1500Hz with pyroelectric sensors Non-volatile data storage up to 54,000 points Laser tuning screen and power log Audio sound for laser tuning and low battery RS232 interface with StarCom PC application software and LabVIEW driver (see pages 107-109) GPIB option (IEEE488.1) NIST traceable CE marked Soft keys, menu-driven 2.1.3 Power Meters Versatile Laser Power/Energy Meter IEEE 488 GPIB Cable for LaserStar The dual channel model enables user to simply plug in any of Ophir’s thermal, pyroelectric, photodiode or RP sensors and measure two channels independently, or the ratio or difference between them in real time. Up to 10 data files (54,000 points total) can be stored for onboard review or downloading to computer even if Laserstar has been switched off. The built-in RS232 interface and StarCom PC software allow on-line processing of data or processing previously stored data; results are displayed graphically on a PC. To support PC interfacing, LabVIEW drivers are provided. LabVIEW StarCom Software Selected Screens Digital Power Screen ֺֺ ֺֺ ֺֺ ֺֺ CW industrial, medical and scientific lasers pW to multi kW with appropriate sensors Can average over selected period. Useful for unstable lasers Fast response bar graph Laser Tuning Screen or Power Log Screen (not shown) ֺֺ ֺֺ ֺֺ Active sensor (for multisensor power meter) Laser Average period Power range Change to energy Zoom Subtract Change bar graph offset range Access further fuctions Maximizing laser power User selected time period and zoom Option of audio tune tone for maximizing laser power Previous sreen Change settings Set maximum reading 93 For latest updates please visit our website: www.ophiropt.com/photonics 01.08.2013 Energy Measurement Screen ֺֺ Laser Pyroelectric and thermal sensors - single pulse ֺֺ Pyroelectric frequency measurement Change to power Select average period or none Energy Log Screen Store every pulse ֺֺ ֺֺ ֺֺ ֺֺ Pulsed energy sensors Thermal sensors - successive single pulses Continuous scroll Energy statistics Frequency Present energy range Trigger indication Temporary pause Change laser wavelengh Reset Change range Zoom reading Access further functions screen Enter statistics statistics of showing points gathered Ratio Screen 2.1.3 Power Meters ֺֺ ֺֺ ֺֺ Two independent sensors Measure ratio, sum, difference Normalize one sensor to the other Normalize sensor B to reading of A Subtract background Data Storage and Transmission ֺֺ ֺֺ ֺֺ Non-volatile storage of power and energy logging data Store in up to 10 files and transmit to PC PC using StarCom Windows program provided Selected file Save new data in file Delete data from file View and scroll through date in file. Every energy point can be seen Specifications Power Meter High legibility 64 x 240 pixel graphics supertwist LCD with switchable, electroluminescent backlight which operates from charger or battery. Large 17mm digits. Screen refresh 15Hz. Features Many screen features including: power with bargraph, energy, average, exposure, frequency, graphs and more. Outputs RS232 and analog output 1V f.s. Screen Refresh 15 times /sec Case Molded high-impact plastic with swivel display and EMI conductive shielding, to allow use even in proximity to pulsed lasers. Size Folds to a compact 228mm W x 195mm L x 54mm H. Battery Rechargeable 18 hours between charges. The charger can be ordered from your local distributor. The charger also functions as AC adapter. Multisensor Option Two sensors can be connected and measure independently, or the ration, sum or difference of the two can be displayed. Data Handling Data can be viewed on board or transmitted to PC: On Board: Non volatile storage of up to 54,000 data points in up to 10 files. Max data logging rate >1500 points/s. Transmitted to PC: Data transmission rate of ~500 points/s. RS232 baud rate of 38400. Sensor Features Works with thermal, pyroelectric, photodiode and RP sensors. Automatic, continuous, background cancellation with PD300 sensors. Submicrojoule and multikilohertz capability with pulsed energy sensors. Program Features Preferred startup configuration can be set by user. User can recalibrate power, energy, response time and zero offset. Ordering Information Item Laserstar Laserstar 2 Channel RS232 Cable for Laserstar Laserstar Battery Pack Laserstar IEEE Option Description Laserstar single channel universal power meter for thermal, pyroelectric, photodiode and RP sensors Laserstar with dual channel capability including ration and difference measurement Cable RS232 D9 - D25 (1 unit supplied with Laserstar) Laserstar NiMH Battery update Kit IEEE GPIB adapter for Laserstar (see page 99) 94 01.08.2013 For latest updates please visit our website: www.ophiropt.com/photonics Ophir P/N 7Z01600 7Z01601 7E01121 7Z14006A 78300 2.1.4 NOVA ֺֺ ֺֺ ֺֺ ֺֺ ֺֺ ֺֺ ֺֺ ֺֺ ֺֺ ֺֺ ֺֺ Compact and durable Compatible with all Ophir sensors: thermal, pyroelectric and photodiode (Not compatible with PE-C series of pyroelectric sensors) Single shot energy measurement with thermal sensors Optional RS232 interface with StarCom PC application and LabVIEW driver (see pages 107-109) Power and energy logging with graphical display and statistics Power averaging Easy to use soft keys, menu-driven Screen graphics Backlight and rechargeable battery Analog output EMI rejection 2.1.4 Power Meters Compact and Durable Power / Energy Meter RS232 cable for Nova Compatible with the complete range of Ophir thermal (power and energy), pyroelectric and photodiode sensors, Nova is truly versatile:measuring power or energy from pJ and pW to hundreds of Joules and thousands of Watts. With the optional scope adapter, you can connect your pyro sensor to an oscilloscope and see every pulse up to the maximum frequency permitted by the sensor. Smart connector sensors automatically configure and calibrate Nova when plugged in. Soft keys guide you through the screen graphics. Finished working? Your configuration can be saved for future use. Nova's exclusive autoranging tune screen displays laser power graphically and displays maximum power. Zoom and time scale can be adjusted by user. The optional RS232 interface and StarCom PC software allow on-line processing of data or processing previously stored data; results are displayed graphically on a PC. To support PC interfacing, LabVIEW drivers are provided. StarCom Software LabVIEW Selected Screens Laser Digital Power Screen ֺֺ ֺֺ Units (w or dbm) CW industrial, medical and scientific lasers pW to multi kW with appropriate sensors Bargraph (with zoom) Press Menu button or soft keys to make legends visible (not shown). Laser Max power Units Laser Tuning Screen or Power Log Screen (not shown) ֺֺ ֺֺ Maximizing laser power User selected time period and zoom Press Menu button or soft keys to make legends visible. Time Zoom Exit ±50% Sweep/Time 95 For latest updates please visit our website: www.ophiropt.com/photonics 01.08.2013 Energy Measurement Screen ֺֺ ֺֺ Pyroelectric and thermopile sensors-single pulse Pyroelectric frequency measurement (not shown) Laser Units Soft key legends Change range Change to Power Measurement Flashes Ready for next pulse Zoom bar graph Energy Log Screen 2.1.4 Power Meters ֺֺ ֺֺ ֺֺ ֺֺ Laser wavelength Pyroelectric sensors Thermopile sensors-successive single pulses Continuous scroll Energy statistics Energy of last pulse Press Menu button or soft keys to make legends visible (not shown) Pyroelectric Exposure Screen ֺֺ ֺֺ Sum or average energies over user selected time period / number of pulses Medicine, photolithography Total exposure Number of pulses measured Toggle Go / Stop Time period of measurement Average Screen ֺֺ ֺֺ Thermopile, photodiode and pyroelectric sensors (Does not operate with PE-C series of pyroelectric sensors) Periodic (1/3 sec to 30 sec) or continuous (10 sec to 1 hour) average for fast-changing or slow-changing laser soft key legends Average power Time period Soft key legends Toggle Go / Stop Specifications Power Meter Features Outputs Screen Refresh Case Size Battery Data Handling Sensor features Program features High legibility 32 x 122 pixel graphics supertwist LCD with switchable electroluminescent backlight. Large 12mm digits. Many screen features: including power with bar graph, energy, average, exposure, frequency, graphs, and more. RS232 and analog output 1V f.s. (optional) 15 times / sec. Molded high-impact plastic with kickstand and EMI conductive shielding, to allow use even in proximity to pulsed lasers. Very compact: 205 x 95 x 39mm. Rechargeable 12 volts. 22 hours use between charges. The charger can be ordered from your local distributor. The charder also functions as AC adapter. Data can be viewed on board or transmitted to PC: On Board: Max data logging rate >10 points/s Transmitted to PC: Data transmission rate of ~50 points/s. RS232 baud rate of 19200 Works with thermopile, pyroelectric, and photodiode sensors. Automatic, continuous, background cancellation with PD300 sensors. Submicrojoule and multikilohertz capability with model PE sensors. All sensors use smart connector containing configuration information. Preferred startup configuration can be set by user. User can recalibrate power or energy. Response time. Zero offset. Ordering Information Item Nova Description Nova universal power meter for thermal, pyroelectric and photodiode sensors Adapter to allow Nova to operate with PE-C series pyroelectric sensors. Nova PE-C Adapter Plugs between Nova D15 socket and PE-C D15 plug Carrying Case Carrying case 38x30x11cm. For display and up to three sensors Nova RS232 assemblies - allow Nova power meter to communicate with PC and be controlled by PC Nova RS232 Assembly RS232 adapter with standard 2 meter cable (including software) (see page 99) Nova RS232 Assembly RS232 adapter with 5 meter cable (including software) Nova RS232 Assembly RS232 adapter with 8 meter cable (including software) Battery Pack Replacement battery pack for Nova 96 01.08.2013 For latest updates please visit our website: www.ophiropt.com/photonics Ophir P/N 7Z01500 7Z08272 1J02079 78105 781052 781051 7Z11200 2 .1.5 StarLite Low Cost Power / Energy Meter ֺֺ ֺֺ ֺֺ ֺֺ ֺֺ ֺֺ ֺֺ ֺֺ ֺֺ ֺֺ ֺֺ Compatible with all standard Ophir Thermal, BeamTrack, PE-C Pyroelectric and Photodiode sensors Brilliant large size TFT 320x240 display Compact handheld design with rubberized bumpers and optimized kickstand Choice of digital or analog needle display Analog output Easy to use soft keys Easy measurement configuration with context sensitive help Backlighting and rechargeable battery Single shot energy measurement with thermal sensors Power averaging Resizable Screen graphics EMI rejection 2.1.5 Power Meters ֺֺ StarLite is a low cost power / energy meter capable of measuring power or energy from pJ and pW to hundreds of Joules and thousands of Watts. It also supports position and size measurement with the BeamTrack family of sensors. StarLite can also display the power or energy with a high resolution simulated analog needle display. All StarLite measurement screens can be configured to either show the measurement parameters or to hide them in order to maximize the graphical and numeric displays. StarLite can be operated either by battery or from an AC source with the charger plugged in at all times. Its backlight allows illumination of the power meter in low light conditions. Selected Screens Digital Power Screen ֺֺ ֺֺ ֺֺ ֺֺ CW industrial, medical and scientific lasers pW to Multi kW with appropriate sensors Can average over selected period. Useful for unstable lasers. Fast response bar chart Barchart Display of Power Measurement Sensor Settings Sensor type and S/N Set measurement mode to Power, Energy, or Track Scroll to on screen functions Set display to Barchart, Needle, or Position BeamTrack Power/Position/Size Screen ֺֺ ֺֺ ֺֺ Monitoring of laser beam size Accurate tracking of beam position to fractions of a mm Power measured at the same time Set measurement configuration BeamTrack Position and Size Screen Sensor type and S/N Sensor Settings Set measurement mode to Power, Energy, or Track Set measurement configuration 97 For latest updates please visit our website: www.ophiropt.com/photonics 01.08.2013 Analog Needle Screen ֺֺ ֺֺ ֺֺ Perfect for adjusting and maximizing laser power or energy Persistent graphical display allows tracking of minimum maximum values measured Large analog needle with small digital display as well Large Analog Needle with Persistence Battery Status Indicator Min Max Indicators Scroll back to Mode, Display, and Setup keys Persistence is on. Previous readings shown in gray Press to zoom graph on present measurement Configuration Screen 2.1.5 Power Meters ֺֺ ֺֺ ֺֺ Easy adjustment of all measurement configuration parameters Context sensitive help for selected parameter Sensor and meter information provided Press to apply Offset Configuration Screen Sensor Settings. Press scroll down key to select the one(s) to adjust Battery Status Indicator Context Sensitive Help Meter information Zero instrument electronics Exit to measurement screens Sensor information Scroll down to next parameter Enter and update selected parameter Specifications Power Meter Features Outputs Screen Refresh Case Size Battery Sensor Features High legibility TFT 320 x 240 pixel graphics LCD. Large 16mm digits. High resolution analog needle also can be chosen. Power, single shot energy, energy and frequency of high rep rate lasers, position, and size. 1V Full Scale analog output. 15 times/sec Molded high impact plastic with optimized angle kickstand. Rubberized sides for easy grip and protection against damage. Folds to a compact 213mm L x 113mm W x 40mm H Rechargeable Li-ion batteries with typically 8 hours between charges. The charger can be ordered from your local distributor. The changer also functions as an AC adapter. Works with Thermopile, BeamTrack, Pyroelectric and Photodiode sensors. Automatic continuous background cancellation with PD300 sensors. Submicrojoule and multikilohertz capability with pulsed energy sensors. Ordering Information Item StarLite Carrying Case USB Cable for StarLite Battery Pack for StarLite Description StarLite universal power meter for Thermal, BeamTrack, Pyroelectric and Photodiode sensors Carrying case 38x30x11 cm. For power meter and up to 3 sensors USB-A to MICRO-B cable for field upgrade support (1 unit supplied with StarLite) Replacement battery pack for the StarLite 98 01.08.2013 For latest updates please visit our website: www.ophiropt.com/photonics Ophir P/N 7Z01565 1J02079 7E01279 7E14008 2.1.6 ACCESSORIES RS232 Module for Nova Plug in module allows transfer of power and energy data to PC and remote control of power meters from PC. Includes manual and StarCom application program (refer to page 107). IEEE488 GPIB for Laserstar 2.1.6 Power Meters Option available with Laserstar power meter allowing Laserstar to operate with GPIB protocol. The option comes with StarCom software and also LabVIEW VIs to build LabVIEW applications. Carrying Cases Carrying case for Vega, Nova II, StarLite or Nova power meters and up to 3 sensors. Ordering Information Item Nova RS232 Assembly Nova RS232 Assembly Nova RS232 Assembly Laserstar IEEE Option Carrying Case for Vega, Nova II, StarLite and Nova Description RS232 adapter with standard 2 meter cable (including software) RS232 adapter with 5 meter cable (including software) RS232 adapter with 8 meter cable (including software) IEEE GPIB adapter for Laserstar Carrying case 38x30x11 cm. For power meter and up to three sensors Ophir P/N 78105 781052 781051 78300 1J02079 99 For latest updates please visit our website: www.ophiropt.com/photonics 01.08.2013 PC Connectivity Options for Power/Energy Measurement Sample data with Ophir power meter at up to 4000 points per second Ophir power meter capable of on board storage of data of up to 250,000 points and data storage rate of up to 4000 points per second 2.1.6 Power Meters Ophir sensor to USB interfaces with up to 4 channel connectivity Ophir Pyroelectric, Thermal and Photodiode sensors measure at up to 25,000 points per second Ophir Quasar interface with wireless connectivity Transmit real time data to PC at up to 25,000 points/s per channel (sensor limited) via USB Transmit real time data to PC at 500 points per second via Bluetooth StarLab software (data transmitted via USB or Bluetooth) StarCom software (data transmitted via RS232) StarLab software 100 01.08.2013 Transmit stored data or real time data to PC via USB or RS232 For latest updates please visit our website: www.ophiropt.com/photonics StarCom software 2.2 PC Interfaces 2.2.1 Compact Juno USB Interface Convert your laptop or desktop PC into an Ophir sensor power/energy meter ֺֺ ֺֺ From sensor to interface to PC - no power source needed Plug and play with all standard Ophir smart sensors Position & size measurement with BeamTrack sensors Record every energy pulse at up to 10kHz Log power and energy, average, statistics, histograms and more with included StarLab application LabVIEW VIs and COM Object interface Very compact - is just an extension of the smart plug Smart Sensor to Juno to PC Ophir’s basic smart compact Juno module turns your PC or laptop into a full fledged Ophir laser power/energy meter. Just install the software, plug the sensor into the Juno module and connect the Juno with a standard USB cable to the PC USB port. Using the Juno, you can connect several sensors to the PC by using one Juno module for each sensor and, if necessary, a USB hub. LabVIEW Juno operating with StarLab software 2.2.1 Power Meters ֺֺ ֺֺ ֺֺ ֺֺ ֺֺ Juno with BeamTrack sensor and StarLab showing beam power, position and size Specifications Power Measurement Power log period Energy Measurement Max real time data logging to PC Trigger input and output Timing General Number of sensors supported Compatible sensors Power supply Dimensions Notes: 5s to 500hr. 10,000Hz (a) N.A. Supports time stamp for each pulse - resolution 10µs One sensor per unit. Can combine several units with software for display of up to 8 sensors on one PC Supports all standard Ophir pyroelectric, thermal and photodiode sensors (b) Powered from USB 76 x 55 x 22mm (a) This is the data logging rate for every single point in turbo mode. Above that rate, the instrument will sample points but not log every single point (b) Not including RP sensors, PD300-CIE, BC20 and PD300-BB Ordering Information Item Juno Juno USB cable Description Compact module to operate one Ophir sensor from your PC USB port. Comes with software. Max repetition rate for every pulse 10kHz. Powered from PC USB port Cable USB2.0 A MINI-B (1 unit supplied with Juno) Ophir P/N 7Z01250 7E01217 101 For latest updates please visit our website: www.ophiropt.com/photonics 01.08.2013 2.2.2 Pulsar Multichannel and Triggered USB Interfaces Convert your laptop or desktop PC into a multichannel power/energy meter ֺֺ ֺֺ ֺֺ ֺֺ ֺֺ ֺֺ ֺֺ From sensor to interface to PC 1,2 and 4 channel models Plug and play with most Ophir sensors Record every energy pulse at up to 25kHz Measure missing pulses & trigger output with external trigger Log power and energy, average, statistics, histograms and more with included StarLab application LabVIEW VIs, COM Object Interface and ActiveX software included 2.2.2 Power Meters Smart Sensor to Pulsar to PC Ophir’s 1-4 channel Pulsar interface turns your PC or laptop into a full fledged Ophir multi-channel laser power/energy meter. Just install the software, plug the sensor into the Pulsar and the USB cable from the Pulsar to the PC USB port. With the Pulsar series, you can connect up to 4 sensors to each module, monitor each pulse at up to 25kHz and utilize external trigger. Pulsar-4 operating with StarLab software LabVIEW Specifications Power Measurement Power log period Energy Measurement Max real time data logging to PC Trigger input and output Timing General Number of sensors supported Compatible sensors Power supply Dimensions Notes: 5s to 500hr. 25,000Hz (a) BNC trigger input to enable measurement of missing pulses or to select specific pulses. Can also be configured to give trigger output Supports time stamp for each pulse - resolution 1μs 4 / 2 / 1 sensors per unit. Can combine several units with software for display of up to 8 sensors on one PC Supports all standard Ophir pyroelectric, thermal and photodiode sensors (b) 12V wall cube power supply plugs into jack on rear. The power supply can be ordered from your local distributor. 189 x 103 x 33mm (a) Limited by the maximum repetition rate of the sensor. At present only the PE9-F can operate up to 25000Hz (b) Not including RP sensors, PD300-CIE, BC20 and PD300-BB Ordering Information Item Pulsar-4 Description Module to operate up to 4 Ophir sensors from your PC USB port. Comes with software. Max repetition rate for every pulse 25kHz. Has external trigger capability. Powered from wall cube power supply (can be ordered from your local distributor). Same as above but for 2 channels only Pulsar-2 Pulsar-1 Same as above but for 1 channel only Pulsar USB Cable USB-A to B cable (1 unit supplied with Pulsar) USB Interface (USBI) Legacy smart sensor to USB interface with similar performance to Juno but larger size. Has analog output. See summary legacy page 104 for specifications 102 01.08.2013 For latest updates please visit our website: www.ophiropt.com/photonics Ophir P/N 7Z01201 7Z01202 7Z01203 7E01202 7Z01200 2.2.3 Quasar Wireless Bluetooth Interface Straight from your measuring sensor to your laptop or PC with no cables ֺֺ ֺֺ ֺֺ ֺֺ ֺֺ ֺֺ ֺֺ Quasar table model connects to any Ophir sensor and broadcasts to your PC Wireless range of 10-30 meters depending on surroundings Operates from rechargeable battery with typically >40 hours lifetime Powerful USB interface with StarLab PC application software included Converts your PC into a complete laser power/energy meter Log power and energy, average, statistics, histograms and more Monitor up to 7 Quasars simultaneously on one PC Quasar module connects to any Ophir sensor, thermal, pyroelectric or photodiode Any PC or laptop connects to Quasar module via Bluetooth adapter and operates as a power/energy meter/data logger Specification Sensor Compatibility Number of Sensors on One PC Operating Range Power 2.2.3 Power Meters Quasar Bluetooth Wireless Sensor to PC Interface All Ophir standard sensors, thermal, photodiode and pyroelectric Up to 7 Quasars can operate simultaneously and be displayed at the same time on one PC 10-30 meters depending on surroundings when used with built in laptop Bluetooth or Ophir recommended adapter Powered by rechargeable NiMH battery. Battery life typical 40 hours, 20 hours for pyro sensors. Automatically goes into sleep mode when not connected to PC. Low batt indication. Charges from 12VDC either polarity. The charger can be ordered from your local distributor. LED Indicator Bluetooth Standard LED indicator indicates whether connected, in standby or off Bluetooth class 1. Connection to PC is transparent to user. Will work with built in laptop Bluetooth and most add on USB to Bluetooth adapters. Ophir recommended USB to Bluetooth adapter Ophir P/N 7E10039 (see table below) Data Transfer Rate for Pyro Sensors 500Hz Dimensions 96mm W x 95mm D x 36mm H not including antenna Connections 15 pin D type sensor connector standard Ophir 12V charger input Ordering Information Item Quasar Bluetooth Interface USB to Bluetooth adapter Battery Pack for Quasar Description Module to operate one Ophir sensor from your PC via Bluetooth wireless interface. Comes with software. Max repetition rate for every pulse 500Hz. Powered from built in rechargeable battery. Comes with power supply. Bluetooth adapter required when not available on PC. See next line Adapter for PC or Laptop not equipped with built in Bluetooth. This adapter is tested and recommended by Ophir. Quasar is not guaranteed to work with all other adapters on the market Replacement battery pack for Quasar Ophir P/N 7Z01300 7E10039 7E14007 103 For latest updates please visit our website: www.ophiropt.com/photonics 01.08.2013 Summary of Computer Options for Ophir Meters and Interfaces Communications With Ophir RS232, USB, Bluetooth and GPIB communication options you can transfer data from the sensor to the PC in real time or offline. You can also control your Ophir power meter from the PC. ֺֺ ֺֺ ֺֺ ֺֺ USB standard on Nova II, Vega power meters and Juno, Pulsar and USBI PC interfaces Bluetooth wireless on the Quasar interface RS232 standard with the Laserstar, Nova II and Vega, optional on the Nova GPIB optional with the Laserstar 2.2.3 Power Meters Ophir Power Meter and Interface Specifications Model Nova Laserstar Nova II / Vega StarLite (c) Communication Method Power Measurement Power log period Max points stored onboard Max points direct on PC Analog output RS232 RS232 / GPIB USB / RS232 5s to 24hr. 300 12s to 600hr. 5400 unlimited 1V F.S. unlimited 1V F.S. 12s to 600hr. Nova II 5400 Vega 27000 unlimited 1V, 2V. 5V, 10V F.S. >10Hz Energy Measurement Max real time data logging to PC Max onboard data logging rate Data transfer rate of a data file from instrument to PC Max points stored onboard Trigger input and output Timing - time stamp for each pulse General Automation Interface LabVIEW VIs Maximum baud rate PC file format Number of sensors supported Compatible sensors Power supply Dimensions Notes: Juno N.A Pulsar-1, 2 or 4 USB USB USB interface Quasar (legacy) Bluetooth USB Bluetooth N.A N.A 5s to 500hr. N.A 5s to 500hr. N.A 5s to 500hr. N.A 5s to 500hr. N.A N.A 1V F.S. unlimited N.A unlimited N.A unlimited 1V F.S. unlimited N.A 25,000Hz (a) 10,000Hz (a) 2000Hz (a) 500Hz >10Hz >30Hz RS232 >2000Hz USB(a) N.A >1500Hz GPIB(a) >30Hz RS232 >1500Hz (a) 4000Hz (a) N.A N.A N.A N.A N.A ~50 points/s ~500 points/s ~500 points/s N.A N.A N.A N.A N.A 1000 54,000 N.A N.A N.A N.A N.A N.A Nova II 60,000 N.A Vega 250,000 N.A N.A N.A N.A N.A N.A N.A resolution 50ms resolution 10ms N.A BNC trigger N.A input to enable measurement of missing pulses. Can also be configured to give trigger output. resolution 1µs resolution 10µs no no yes N.A yes yes yes no yes yes yes N.A yes yes yes no 19200 (b) 38400 38400 N.A N.A. N.A. N.A. N.A. Text files, spreadsheet compatible ASCII N.A Text files, spreadsheet compatible ASCII One sensor per One sensor per One sensor One sensor per 4 / 2 / 1 sensors One sensor One sensor One sensor unit. unit for single per unit. Can unit per unit. Can per unit. Can per unit. Can per unit. Can channel mode. combine several combine several combine several combine several combine several Two sensors units with units with units with units with units with per unit for dual software for software for software for software for software for channel mode. display of up display of up display of up display of up display of up to to 8 sensors on to 8 sensors on to 8 sensors on to 8 sensors on 7 Quasars on one PC one PC one PC one PC one PC Supports most Ophir pyroelectric, thermal and photodiode sensors Powered Powered Powered Powered 12V wall cube Powered from Powered from Powered from internal from internal from internal from internal plugs into jack USB USB from internal rechargeable rechargeable rechargeable rechargeable on rear rechargeable battery power battery power battery power battery power battery power supply supply supply supply supply 205 x 95 x 228 x 195 x 208 x 117 x 213 x 113 x 189 x 103 x 76 x 55 x 155 x 90 x 96 x 95 x 39mm 54mm 40mm 40mm 33mm 22mm 34mm 36mm (a) The above refers to the rate for logging every single point in turbo mode. Above that rate, the instrument will sample points but not log every single point. (b) For pyroelectric sensors, maximum guaranteed baud rate is 9600. (c) The low cost StarLite power meter does not have a PC Interface support or onboard logging. For customers that need these features, please consider one of our other offerings 104 01.08.2013 For latest updates please visit our website: www.ophiropt.com/photonics 2.3 Software Solutions 2.3.1 StarLab StarLab turns your PC into a laser power/energy multi-channel station Extensive Graphic Display of Data ֺֺ ֺֺ Line Plot, Histogram, Bar chart, Simulated Analog Needle Multiple data sets on one graph or separate graphs on the same screen Advanced Measurement Processing Power/Energy Density, Scale Factor, Normalize against a reference Multi-channel comparisons User defined mathematical equations: channels A/B, (A-B)/C etc. Position & size measurement with BeamTrack sensors Data Logging for Future Review ֺֺ ֺֺ Can be displayed graphically or saved in text format Easily exported to an Excel spreadsheet Fully supports Vega, Nova-II, Pulsar, Juno, USBI and Quasar devices with all standard Ophir sensors Flexible Display Options with StarLab Choose which channels to display Each sensor displayed separately Maximize one of the sources Then choose separate or together 1 2 Setup Screen 2.3.1 Power Meters ֺֺ ֺֺ ֺֺ ֺֺ Choose line graph Choose sensor settings Choose display and graph settings or bargraph 3 Choose sensor functions or histogram or needle display One of above screens maximized 105 For latest updates please visit our website: www.ophiropt.com/photonics 01.08.2013 Multiple sensors displayed together The settings and scale are from channel chosen 2.3.1 Power Meters Click on one of the channels Here multi line graph display has been chosen Settings and functions may be opened to adjust then minimized as needed Here multi line histogram display has been chosen BeamTrack Power/Position/Size sensor Power Position Size Here a BeamTrack position and size graph is shown 106 01.08.2013 For latest updates please visit our website: www.ophiropt.com/photonics 2.3.2 StarCom Plot of ratio of energy B/A vs. energy A Plot of power vs. time Histogram plot of energy distribution System Integrator Solutions Besides their use as stand-alone, fully featured laser power/energy meters, Ophir devices are easily incorporated into larger end-user applications. This allows system integrators to leverage Ophir’s excellence in measurement capabilities with legacy analysis packages. 2.3.2 Power Meters This software is supplied with the Nova II, Laserstar, Vega and Nova with RS232 option. It allows you to measure, analyze and record power and energy from any Ophir sensor. You can log the data from each sensor simultaneously to file. Communication Protocols All Ophir devices support one or two forms of communication with the PC. Device RS232 USB GPIB Bluetooth Pulsar Vega Nova-II USB Interface Nova LaserStar Quasar Juno RS232 RS232 communication is the simplest to integrate into your OEM application. Integrated Development Environments (IDE’s) such as Microsoft Visual Studio provide functions and methods for accessing the PC’s com port. The following is all that you need to get your RS232 applications up and running ֺֺ Appendix A5 of the StarCom User Manual (P/N 1J06025) contains an alphabetical listing and detailed description of all commands available with the Nova, Nova-II, Vega and LaserStar devices. 107 For latest updates please visit our website: www.ophiropt.com/photonics 01.08.2013 ֺֺ ֺֺ ֺֺ ֺֺ ֺֺ Appendix A4 of the StarCom User Manual (P/N 1J06025) gives an example of polling the Nova device for measurements. This was written in VB6. An appropriate RS232 assembly. Nova RS232 Assembly (P/N 78105) for use with the Nova device. Nova II / Vega RS232 cable (P/N 7E01206) for use with the Nova-II and Vega devices (included with the Nova II / Vega). LaserStar RS232 cable (P/N 1E01121, included with the LaserStar). GPIB Besides RS232, the LaserStar can also communicate via GPIB (IEEE 488.1). Using the SDK supplied by the vendor of your GPIB controller hardware, a LaserStar IEEE cable (P/N 78300) and the StarCom User Manual, you can integrate the LaserStar into your GPIB solution. 2.3.2 Power Meters USB Ophir provides a common interface for communication and control of all of our USB speaking devices. OphirLMMeasurement is a COM object that is included as part of the StarLab installation (StarLab 2.10 and higher) that allows the system integrator to take control of the Juno, Nova-II, Pulsar, USBI and Vega devices; integrating them into his in-house measurement and analysis package. For communication via USB, device drivers and additional support software must be installed on your PC. These components are installed as part of the StarLab application’s installation process. System Integrators will need the following components: ֺֺ ֺֺ ֺֺ ֺֺ ֺֺ OphirLMMeasurement COM Object.doc. lists and describes the methods and events available for configuring, controlling and uploading measurements from Ophir devices. OphirLMMeasurement.dll. COM object component developed and supplied by Ophir for communication with the Juno, Nova-II, Pulsar, USBI and Vega devices. The COM object is registered when the application is installed. OphirLMMeasurement COM Object.doc describes how to register it on another PC where the Ophir application has not been installed. Standard USB cable for use with the Pulsar and USBI devices (included). Standard mini-B USB cable for use with the Juno device (included). Nova II / Vega USB cable (P/N 7E01205) for use with the Nova-II and Vega devices (included with the Nova II / Vega). Ophir provides example projects of COM Object clients in VC#, VB.NET and LabVIEW. These are found in the Automation Examples subdirectory of our StarLab PC Application. Note: The OphirFastX (for Pulsar devices) as well as the OphirUsbX (for Nova-II, USBI and Vega devices) ActiveX packages are included with the StarLab installation so as to not disrupt legacy OEM installations by customers. However, new features will not be added to them. For new designs, we highly recommend using OphirLMMeasurement. 108 01.08.2013 For latest updates please visit our website: www.ophiropt.com/photonics 2.3.3 LabVIEW Solutions Ophir has long recognized the growing LabVIEW community of developers. For over 10 years, we have been providing LabVIEW libraries for all of our devices. These are full open-source applications that can be used as is or tailored by the LabVIEW programmer to his specific needs. These starter applications are basic software only that allows the LabVIEW programmer to experiment freely to fully feel the strength of our devices’ respective command sets. These applications contain VIs (Virtual Instruments) to control the instrument. You can combine VIs to create successively larger and more versatile larger VIs by simply connecting them together. Users can create sophisticated, custom applications in minutes. In most cases, applications can be built and tested even before the instrument even arrives. The versatility of these tools is limitless. VI Libraries Ophnova.llb Library supplied for use with the Nova. Communication is in RS232 and is based on NI-VISA. 2.3.3 Power Meters All of our LabVIEW libraries can be downloaded from our web site: www.ophiropt.com Ophlstrd.llb Library supplied for use with the Dual-Channel LaserStar. Communication can be set to RS232 or GPIB and is based on NI-VISA. OphInstr.llb This library can be configured to work with the Nova-II, Vega, USB Interface or Single-Channel LaserStar devices. It can also work with the Juno with a Thermopile or Photodiode sensors. It can be set to RS232, USB or GPIB. It is based on NI-VISA for all 3 communication protocols. Therefore to work with it in USB, first run the SwapINF utility that we provide to configure your PC to replace the USB drivers supplied by Ophir with drivers supplied by National Instruments. LabVIEW COM Demo.llb Library supplied for use with all of our USB speaking devices (Juno, Nova-II, Pulsar, USBI, Vega). Makes use of our COM object. Included with our StarLab application. 109 For latest updates please visit our website: www.ophiropt.com/photonics 01.08.2013 2.4 OEM Power Meter Solutions 2.4.1 Examples of Custom OEM Power/Energy Meter Solutions In addition to the standard products described above, Ophir has accumulated over 25 years experience in developing products which are tailored to precise physical configurations provided by the OEM customer. These products include special display software options, OEM power/energy meter board sets and much more. A number of these special OEM products are shown below. 2.4.1 Power Meters Moving LED Indicator Thermal OEM sensor with special LED indicator where LEDs light up in proportion to power reading. When power is over maximum, red LEDs light up. Rack Mount Laserstar Meter OEM Laserstar meter for rack mount with input from front, outputs and shielded metal case on rear. Nova OEM Board Set The Nova meter can be purchased as a board set for installation in the host system. Communication with the unit is either via RS232 or via the set’s own buttons; output can be RS232 digital or an analog voltage. Ordering Information: The products shown above are examples of OEM solutions developed for specific customer applications. Please consult with your Ophir representative who will be happy to help you with any requirements you may have. 110 01.08.2013 For latest updates please visit our website: www.ophiropt.com/photonics Beam Analysis Laser Beam Analysis 111 For latest updates please visit our website: www.ophiropt.com/photonics 01.08.2013 3.1 Choosing a Beam Profiler A laser beam profiler will increase your chance of success anytime you wish to design or apply a laser or when you find your laser system is no longer meeting specifications. You would never think of trying to build a mechanical part without a micrometer. So why attempt to build lasers or laser systems with only a power meter? You will produce the desired results more quickly if you can measure basic things like beam width or size, beam profile and power. We believe as Lord Kelvin said: “You cannot improve it if you cannot measure it”. 3.1.1 Four Basic Questions When choosing a laser beam profiler there are a plethora of choices to do the job, including CCD and CMOS cameras, scanning slit sensors, InGaAs and pyroelectric cameras, pinhole, and knife edge sensors to mention some. How does one decide which is the proper solution for one’s application and from which company to obtain the profiler system? When making the selection there are four basic questions about the laser application that one must answer. 3.1 Beam Analysis Wavelength? The first question is: What wavelength(s) do you intend to measure? The answer to this question determines the type of detector needed, and what the most cost effective approach may be. For the UV and visible wavelength range from <193nm up to the very near infrared at around 1300nm, silicon detectors have the response to make these measurements. The largest number of cost effective solutions exist for these wavelengths including CCD cameras and silicon detectorequipped scanning aperture systems. Which of these is the best will be determined by the answers to the other three questions. For the near infrared, from 800 to 1700nm, the choices become less abundant. In the lower end of this range from 800–1300nm the CCD cameras may still work, but InGaAs arrays become necessary above 1300nm. These are quite expensive; four to five times the cost of the silicon CCDs. Scanning slit systems equipped with germanium detectors are still quite reasonably priced, within a few hundred dollars of their silicon-equipped cousins. At the mid and far infrared wavelengths the pyroelectric cameras and scanning slits sensors with pyroelectric detectors provide viable alternatives, again the best approach being determined by the answers to the subsequent questions. Beam Size? The second question is: What beam width or spot size do you wish to measure? This question can also impact the profiler type choices. Arrays are limited by the size of their p ixels. At the current state-of-the-art pixels are at best around 4µm for silicon arrays, and considerably larger, 30um to 80um with InGaAs and pyroelectric cameras. This means that a UV-NIR beam should be larger than 50µm or roughly 10 pixels in diameter to ensure that enough pixels are utilized to make an accurate measurement. Beams with spot sizes smaller than 50um can be optically magnified or expanded to be measured with a camera. InGaAs camera pixels are around 30µm, limiting the minimum measurable beam size to 300µm; pyroelectric array pixels are even larger at 80µm, meaning the beams need to be at least 0.8mm to yield accurate results. Scanning slit profilers can measure with better than 2% accuracy beams that are four times the slit width or larger, putting the minimum beam sizes at around 8µm without magnification. Those investigators who want to measure their beams directly without additional optics could find this to be an advantage. Power? The third question is: What is the power of the beam? This determines the need for attenuation, and/or beam splitting, as well as the detector type. Array detectors, such as silicon CCD, CMOS, InGaAs and Pyroelectric cameras will usually need attenuation when measuring lasers. Scanning slit type profilers can measure many beams directly without any attenuation, due to the natural attenuation of the slit itself. Detector arrays and knife-edge profilers, by their nature, will allow the entire beam to impact the detector at some point in the measurement, leading to detector saturation unless the beam is appropriately attenuated. Lasers of any wavelength with CW powers above 100mW can be measured with the pyroelectric detector-equipped scanning slit profiler, making it the easiest profiler for many applications. Scanning slit profilers can directly measure up to kilowatts of laser power, depending on the spot size or power density. 112 01.08.2013 For latest updates please visit our website: www.ophiropt.com/photonics CW or Pulsed? The final question is: Is the laser continuous wave (CW) or pulsed? Lasers that operate pulsed at r epetition rates less than ~10 kHz are best profiled with an array. Scanning apertures simply cannot make these measurements effectively in “real time”. CW and pulsed beams with repetition rates above ~10 kHz can be measured with scanning slits if the combination of the repetition rate and the beam size are sufficient to have enough laser pulses during the transit time of the slits through the beam to obtain a good profile. Knife-edge profilers are only able to measure CW beams. Pulsed beams have other considerations when selecting a beam profiling instrument, particularly pulse-to-pulse repeatability, and pulse-energy damage thresholds of the slit material or in the case of array detectors, beam sampling optics. 3.1.2 One More Question Besides these four questions about the physical nature of the laser to be measured, there is one more that needs to be asked: How accurate does the measurement need to be? Not all profilers or profiler companies are equal in this regard. Properly designed, maintained and calibrated camera and based slit profilers can provide nanometer precision for both beam width and beam position (centroid) measurements. How and where a profiler is to be used is also an important consideration in the equation. Profilers used by research and development scientists are often specialized. Ease-of-use and high throughput may be of no consequence if the purpose is to characterize specific optical systems that are well understood by the investigator. On the other hand, when a profiler needs to be used on the factory floor for quality assurance of the manufacturing process, ease-of-use, high throughput, and reproducibility become paramount. In this case the profiler requiring the least “fiddling” is generally the best fit. Here there is a competition between the intuitive and the ease-of-use. Some people find the 2-dimensional camera array to be the most intuitive, because they can relate to the idea of “taking a picture” of the laser beam; X-Y scanning slits may seem less intuitive. For any process that uses or works with CW or high frequency pulsed lasers the scanning slit will have the advantage of measuring the beam directly, possibly even at its focus point, without additional attenuation optics. The dynamic range of these systems is also broad enough to measure both the focused and the unfocused beam without changing the level of attenuation. Camera arrays, on the other hand will require attenuation adjustment. Conversely, if the important aspect of the measurement is the two-dimensional image of the beam, or if the laser is pulsed at a low repetition rate, the array will be the solution; even if it means attenuation optics. Also, many factory applications may want to ‘embed’ the beam profiler into a manufacturing cell or a piece of automation so the measurements and possibly pass/fail results are completed automatic. If so look for a system that has this ability. Most often the capability to interface the profiler into the overall system through a LabView, Excel or .NET interface is available. So Camera or scanning slit, whichever is selected the user must first determine the laser beam measurement environment and what information about the beam profile is most important to the success of the application. Ease of use and absolute spot size favors the scanning slit system while knowing about the hot and cold spots or the image of the beam under test, or any low repetition pulsed laser, requires a camera based beam profiling system. The assistance of knowledgeable product specialists is required to provide analysis of the measurement requirements of your laser application as well as to describe the features and benefits of available products. Camera-based Beam Profiler 3.1.2 Beam Analysis A state-of-the-art CCD array with 4µm pixels can provide ±2% beam width accuracy for beams larger than 50µm. Accuracy for smaller beams may be worse due to the effects of insufficient resolution or pixilation. In addition, the effects of attenuation optics, noise and proper baseline zeroing or offset compensation can have dramatic impact on the accuracy of the measurement. Cameras that are not designed specifically for profiling may be much worse due to the presence of a cover glass and/or IR cut-off filter covering the array. These optical elements must be removed for laser profiling to prevent interference fringes or distortion of the beam being tested. Camera arrays provide a true two-dimensional picture of the beam and will show fine structure and hot and cold spots, which a slit will integrate out. Some applications do not require a map of the laser power distribution with in the spot. Spot size and spot location are sufficient. Other applications require that a careful mapping of the complete mode structure is made. These applications require 2D, array based sensors. The accuracy requirement is a question of what the data is to be used for. Accurate collimation or focus control requires the highest beam size accuracy. Checking the laser for hot spots, uniformity or beam shape dictates that the 2D sensor is employed and is as important as absolute size measurement accuracy. Slit-based Beam Profiler 113 For latest updates please visit our website: www.ophiropt.com/photonics 01.08.2013 3.1.3 User Guide for Choosing the Optimum Beam Profiling System Laser Power Wavelength UV-Vis Minimum Beam Size >20 <50µm <100mW 100mW-100W >100W <20µm NS-Si NS-Pyro HP-NS NS-Si/3.5/1.8 NS-Si/9/5 SP620 SP620 NS-Pyro NS-Pyro/9/5 SP620 NIR 10001100nm SP620 NS-Pyro HP-NS NS-Ge SP620 NS-Pyro NS-Ge/3.5/1.8 NS-Ge/9/5 NS-Pyro/9/5 SP620 >50µm >500µm >1mm NS-Si/9/5 NS-Si /9/5 NS-Si /9/5 NS-Pyro/9/5 NS-Pyro/9/5 NS-Pyro/9/5 SP620 SP620 SP620 NS-Ge/9/5 NS-Ge/9/5 NS-Ge/9/5 NS-Pyro/9/5 NS-Pyro/9/5 NS-Pyro/9/5 SP620 SP620/ SP503 Pyrocam NS-Ge NS-Pyro 3.1.3 Beam Analysis NS-Ge/3.5/1.8 NS-Ge/9/5 NS-Pyro Telecom and Eye-Safe 11001800nm 1500-1600nm HP-NS NS-Ge NS-Ge NS-Ge SP 620-1550 SP 620-1550 SP 620-1550 Pyrocam NS-Pyro HP-NS Pyrocam NS-Pyro MIR & FIR NS-Pyro/9/5 NS-Ge/3.5/1.8 NS-Ge/9/5 Pyrocam w/ Beam Expansion NS-Pyro/9/5 NS-Ge/9/5 NS-Ge/9/5 NS-Ge/9/5 NS-Pyro/9/5 NS-Pyro/9/5 NS-Pyro/9/5 XEVA XEVA XEVA Pyrocam Pyrocam NS-Ge/9/5 Pyrocam NS-Ge/9/5 SP 620-1550 XEVA SP 620-1550 NS-Pyro/9/5 NS-Pyro/9/5 XEVA NS-Pyro/9/5 Pyrocam Pyrocam Pyrocam ModeCheck Abbreviations: FIR Far Infrared GeGermanium HP High Power MIRMid-Infrared UV-Vis Ultraviolet - Visible NIR Near Infrared SiSilicon SP Indicates camera profiler NSNanoScan 114 01.08.2013 For latest updates please visit our website: www.ophiropt.com/photonics Laser Minimum Wavelength Beam Size UV-Vis CW or Pulsed >5mm >10mm CW Pulsed <1kHz Pulsed >1kHz Price 2D/3D No optics Speed Ease of use NS-Si /9/5 NS-Si /25/25 NS SP620 SP620 SP620 SP620 NS NS NS SP620 SP620 NS NS NS NS XEVA NS NS NS NS-Pyro/20/25 NS-Pyro/20/25 SP620 SP620 NS 15001600nm SP620 NS-Pyro/20/25 NS-Pyro/20/25 SP620 SP620 NS L11059 NS-Ge/12/25 Telecom and EyeSafe 11001800nm NS L11059 NS-Ge/12/25 NIR 10001100nm Customer Priority NS XEVA NS-Pyro/20/25 NS-Pyro/20/25 XEVA NS Pyrocam Pyrocam NS-Ge/12/25 NS-Pyro/20/25 SP 620-1550 NS XEVA NS-Pyro/20/25 NS-Pyro/20/25 NS Pyrocam Pyrocam XEVA XEVA SP 620-1550 SP 620-1550 NS NS NS Pyrocam NS NS NS NS Pyrocam Pyrocam 3.1.3 Beam Analysis MIR & FIR Abbreviations: FIR Far Infrared GeGermanium HP High Power MIRMid-Infrared UV-Vis Ultraviolet - Visible NS NIR Near Infrared SiSilicon SP Indicates camera profiler NSNanoScan 115 For latest updates please visit our website: www.ophiropt.com/photonics 01.08.2013 3.1.4 Benefits of Beam Profiling You can get more out of your laser ֺֺ Figure 1 shows an industrial Nd: YAG laser, near Gaussian beam, with 100 Watts output power and 1.5kW/cm2 power density. Figure 2 is the same Nd: YAG beam at greater power, 170 Watts, but it split into 2 peaks producing only 1.3kW/cm2 power density. The power density of the beam decreased 13% instead of increasing by the 70% expected. Without measuring the beam profile and beam width, you would not know what happened to your power density, and why the performance did not improve. 1 2 Laser cavities become misaligned ֺֺ Figures 3 & 4 are beam profiles of CO2 lasers used for ceramic wafer scribing in the same shop. The second laser with the highly structured beam produced mostly scrap parts, until the laser cavity was aligned. Off axis delivery optics ֺֺ Figures 5 & 6 show an industrial Nd:YAG laser with misaligned turning mirror, before and after adjustment. 3 4 5 6 7 8 3.1.4 Beam Analysis Alignment of devices to lenses ֺֺ Figures 7 & 8 show beam profiles during alignment of a collimating lens to a laser diode. The first profile shows poor alignment of the lens to the diode, which can easily be improved when seeing the profile in real time. Laser amplifier tuning ֺֺ Figures 9 & 10 show a Cr:LiSAF femtosecond laser oscillator beam with a near Gaussian output, and what happens to the oscillator beam with poor input alignment. All these examples illustrate the need for beam monitoring ֺֺ ֺֺ ֺֺ ֺֺ ֺֺ ֺֺ ֺֺ Measurement of the beam profile is needed to know if problems exist, and the profile must be seen to make corrections Most laser processes can be improved Scientific experiments can be more accurate Commercial instruments can be better aligned Military devices can have greater effectiveness Industrial processing produces less scrap Medical applications are more precise Just knowing the beam profile can make the difference between success and failure of a process. 9 116 01.08.2013 For latest updates please visit our website: www.ophiropt.com/photonics 10 3.2 Introduction to Camera-Based Profilers Beam Attenuating Accessories A camera-based beam profiler system consists of a camera, profiler software and a beam attenuation accessory. Spiricon offers the broadest range of cameras in the market to cope with wavelengths from 13nm, extreme UV, to 3000 µm, in the long infrared. Both USB and FireWire interfaces are available for most wavelength ranges providing flexibility for either laptop or desktop computers. BeamGage Profiling software Power Sensor: Optional Power Meter: Optional Laser Example of Beam Attenuator: 2 wedge beam splitter with adjustable ND filters Camera BeamGage®, the profiling software, comes in three versions: Standard, Professional and Enterprise. Each builds off of the next adding additional capability and flexibility needed for adapting to almost any configuration requirement. Spiricon also has the most extensive array of accessories for beam profiling. There are components for attenuating, filtering, beamsplitting, magnifying, reducing and wavelength conversion. There are components for wavelengths from the deep UV to CO2 wavelengths. Most of the components are modular so they can be mixed and matched with each other to solve almost any beam profiling requirement needed. The BeamGage software is written specifically for Microsoft Windows operating systems and takes full advantage of the ribbon-base, multi-window environment. The software performs rigorous data analyses on the same parameters, in accordance with the ISO standards, providing quantitative measurement of numerous beam spatial characteristics. Pass/Fail limit analysis for each of these parameters can be also applied. ֺֺ ֺֺ ֺֺ ֺֺ ֺֺ ֺֺ ֺֺ ֺֺ ֺֺ ֺֺ ISO Standard Beam Parameters Dslit, Denergy, D4σ Centroid and Peak location Major and Minor axes Ellipticity, Eccentricity Beam Rotation Gaussian Fit Flat-top analysis / Uniformity Divergence Pointing stability 3.2 Beam Analysis Acquisition and Analysis Software For data display and visualization, the user can arrange and size multiple windows as required. These may contain, for example, live video, 2D Topographic and 3D views, calculated beam parameters and summary statistics in tabular form with Pass/Fail limit analysis, and graphical strip chart time displays with summary statistics and overlays. Custom configured instrument screens with multiple views can be saved as configuration files for repeated use. Data can be exported to spreadsheets, math, process/ instrumentation and statistical analysis programs, and control programs by logging to files or COM ports, or by sharing using LabView or ActiveX Automation. ֺֺ ֺֺ ֺֺ ֺֺ ֺֺ ֺֺ ֺֺ ֺֺ Video Dual Aperture Profiles Beam Statistics 3D Profile View 2D Topographic View Time Statistics Charts Pointing / Targeting Hide measurements and features not in use for user simplicity Notes 117 For latest updates please visit our website: www.ophiropt.com/photonics 01.08.2013 3.2.1 3.2.1.1 BeamGage®-Standard Version ֺֺ ֺֺ ֺֺ ֺֺ ֺֺ ֺֺ Extensive set of ISO quantitative measurements Patented Ultracal™ algorithm for highest accuracy measurements in the industry Customizable user interface for ‘ease of use Auto-setup and Auto-exposure capabilities for fast set-up and optimized accuracy Statistical analysis on all calculated results displayed in real time New BeamMaker® beam simulator for algorithm self-validation The performance of today’s laser systems can strongly affect the success of demanding, modern laser applications. The beam's size, shape, uniformity or approximation to the expected power distribution, as well as its divergence and mode content can make or break an application. Accurate knowledge of these parameters is essential to the success of any laser-based endeavor. As laser applications push the boundaries of laser performance it is becoming more critical to understand the operating criteria. 3.2.1.1 Beam Analysis For over thirty years Ophir-Spiricon has developed instruments to accurately measure critical laser parameters. Our LBA and BeamStar software have led the way. Now with the introduction of BeamGage, Ophir-Spiricon offers the first “new from the ground up” beam profile analysis instrument the industry has experienced in over 10 years. BeamGage includes all of the accuracy and ISO approved quantitative results that made our LBA software so successful. BeamGage also brings the ease-of-use that has made our BeamStar software so popular. Our patented UltraCal algorithm, guarantees the data baseline or “zero-reference point” is accurate to 1/10 of a digital count on a pixel-by-pixel basis. ISO 11146 requires that a baseline correction algorithm be used to improve the accuracy of beam width measurements. UltraCal has been enhanced in BeamGage to assure that accurate spatial measurements are now more quickly available. 118 01.08.2013 For latest updates please visit our website: www.ophiropt.com/photonics See Your Beam As Never Before: The Graphical User Interface (GUI) of BeamGage is new. Dockable and floatable windows plus concealable ribbon tool bars empowers the BeamGage user to make the most of a small laptop display or a large, multi-monitor desktop PC. Beam only (Note results overlaid on beam profile). Beam plus results ֺֺ 3D displays Rotate & Tilt. All displays Pan, Zoom, Translate & Z axis Zoom. 3.2.1.1 Beam Analysis Dual or single monitor setup with beam displays on one and results on the other. (Note that results can be magnified large enough to see across the room). Multiple beam and results windows. (Note quantified profile results on 3D display & quantified 2D slices). 119 For latest updates please visit our website: www.ophiropt.com/photonics 01.08.2013 Measure Your Beam As Never Before: Ultracal: Essential, or no big deal? If you want accurate beam measurements, you want Ultracal. What is Ultracal? Our patented, baseline correction algorithm helped establish the ISO 11146-3 standard for beam measurement accuracy. The problems with cameras used in beam profile measurements are: a) baseline, or zero, of the cameras drift with time temperature, and b) include random noise. Ultracal is the only beam profiler algorithm that sets the baseline to “zero”, and, in the center of the noise. (Competitive products use other less sophisticated algorithms that perform a baseline subtraction, but truncate the noise below the “zero” of the baseline. This leaves only a “positive” component, which adds a net value to all beam measurements). Try the following on any other beam profiler product to see the inherent error if you don’t use Ultracal. 1. Measure a beam with full intensity on the profiler camera. 2. Insert a ND2 filter (100X attenuation) into the beam and measure it again. 3. Compare the results. 3.2.1.1 Beam Analysis 4. The Standard Deviation below is about 3%, which is phenomenal compared to the 100% or more of any beam profiler without Ultracal. Beam at full intensity, Width 225µm, Std Dev 0.06µm Beam attenuated 100X (displayed here in 2D at 16X magnitude zoom), Width 231µm, Std Dev 7µm Adding the use of Automatic Aperture improves the accuracy to 1%. (The conditions of this measurement is a camera with a 50dB SNR). 5. You normally don’t make measurements at such a low intensity. But occasionally you may have a drop in intensity of your beam and don’t want to have to adjust the attenuation. Or, you may occasionally have a very small beam of only a few tens of pixels. In both of these cases, Ultracal becomes essential in obtaining accurate measurements. 120 01.08.2013 For latest updates please visit our website: www.ophiropt.com/photonics Beam Measurements and Statistics Small sample of possible measurements out of a list of 55 Sample of calculation results with statistics applied 3.2.1.1 Beam Analysis BeamGage allows you to configure as many measurements as needed to support your work, and comes standard with over 55 separate measurement choices. To distinguish between calculations that are based on ISO standards and those that are not, a graphical ISO logo is displayed next to appropriate measurements. You can also choose to perform statistical calculations on any parameter in the list. 121 For latest updates please visit our website: www.ophiropt.com/photonics 01.08.2013 Multiple Charting Options You can create strip charts for stability observations on practically any of the calculations options available. (See next page for sample listing). Charts enable tracking of short or long term stability of your laser. Strip chart of beam D4sigma width. Note how changing conditions affects the width repeatability. Beam intensity changed over 10db, making noise a significant factor in measurement stability. Beam Pointing Stability Open the Pointing Stability Window to collect centroid and peak data from the core system and display it graphically. View a chart recorder and statistical functions in one interface: A centroid location scatter plot with histogram colorcoding. Set a sample limit, and specify the results items to graph on the strip chart. A pointing stability strip chart presents data over time for the Centroid X and Y, Peak X and Y and centroid radius from an origin or from the mean centroid. The radius is referenced from either an Origin established in BeamGage or from the continuously calculated Average Centroid position. Easy to Use and Powerful BeamGage is the only beam profiler on the market using modern Windows Vista and Windows 7 navigation tools. The menu system of BeamGage is easy to learn and easy to use with most controls only one mouse click away. Some ribbon toolbar examples: Some of the Beam Display options (Display access options under the Tools tab on the left). Some of the Beam Capture options. 122 01.08.2013 For latest updates please visit our website: www.ophiropt.com/photonics Beam Profile 3.2.1.1 Beam Analysis Peak location scatter plot with histogram color-coding. BeamGage Main Display Screen Quick Access Toolbar for common tasks Beam Results With Statistics ISO Compliant Results Tabbed Control Access 1D Profiling Options 2D Beam Display Tool Windows that dock inside or float outside App Cursors With Power / Energy Readouts Processing Status Indicators User Definable Window Layout 3D Beam Display Integrated Help System Buffered Video Scrolling Controls Pass / Fail with Password Protection for Production Testing BeamGage allows the user to configure the displayed calculations; set-up the screen layout and password protect the configuration from any changes. This permits secure product testing as well as data collection for Statistical Process Control (SPC), all while assuring the validity of the data. 3.2.1.1 Beam Analysis File Save/Load ApplicationButton Failures (or successes) can be the impetus for additional actions including a TTL output signal or PC beep and the termination of further data acquisition. 123 For latest updates please visit our website: www.ophiropt.com/photonics 01.08.2013 Camera Compatibility For lasers between 190-1320nm wavelenghts, BeamGage interfaces to silicon CCD Firewire (1394) and USB cameras. For applications between 1440-1605nm, BeamGage supports cost effective phosphor coated CCD cameras. For demanding applications between 900-1700nm, BeamGage supports an InGaAs camera. And for applications in the ultraviolet, 13-355nm, or far infrared or Terahertz range, 1.06-3000nm, BeamGage supports Spiricon’s Pyrocam III, pyroelectric array camera. 190-1100nm Model SP503U Spectral Response nm Application 190 - 1100nm* ½” format, slim profile, wide dynamic range, CW & pulsed lasers, adjustable ROI Number of Elements Interface Style Windows 05 support SP620U 190 - 1100nm* 1/1.8” format, high resolution, wide dynamic range, pulsed lasers, CW YAG, adjustable ROI 640 x 480 1600 x 1200 USB USB Windows 7 (32/64), Vista (32/64) or XP (32) Pro GRAS20 Gevicam L11059 190 - 1100nm* 1/1.8” format, high resolution, CW YAG, adjustable ROI 190 - 1100nm* 1/1.8” format, high resolution, networkable, long cable distances, adjustable ROI 190 - 1100nm* 36mm x 24mm, 35mm format for large beams, CW YAG, Adjustable ROI 1600 x 1200 Firewire 1394b 1600 x 1200 Gigbit Ethernet Windows 7 (32/64) or Vista (32/64) 4008 x 2672 USB Windows 7 (32/64), Vista (32/64) or XP (32) Pro 3.2.1.1 Beam Analysis 1440-1605nm Model SP503U-1550 Spectral Response nm Application 1440 - 1605nm 1440 - 1605nm NIR wavelengths, ½” format, NIR wavelengths, 1/1.8” low resolution format, low resolution, adjustable ROI and binning 640 x 480 1600 x 1200 USB USB Windows 7 (32/64), Vista (32/64) or XP (32) Pro Number of Elements Interface Style Windows 05 support SP620U-1550 GRAS20-1550 1440 - 1605nm NIR wavelengths, 1/1.8” format, adjustable ROI 1600 x 1200 Firewire 1394b 13-355nm & 1.06-3000µm 900-1700nm Model XEVA 100Hz Model Pyrocam III Spectral Response Application 900 - 1700nm High resolution InGaAS performance, NIR wavelengths 320 x 256 USB 2.0 Windows 7 (32(, Vista (32) or XP (32) Pro Spectral Response nm Application 13-355nm & 1.06-3000µm UV & Far IR Number of Elements Interface Style Windows 05 support 124 x 124 Firewire 1394a Windows 7 (32/64), Vista (32/64) or XP (32) Pro Number of Elements Interface Style Windows 05 support 124 01.08.2013 For latest updates please visit our website: www.ophiropt.com/photonics BeamGage-Standard Unique Features Power/Energy Calibration Using the USB output from select Ophir power/energy meters, the BeamGage application will display measured power/energy values from the full range of Ophir thermopile, photodiode and pyroelectric sensors. Pulsed lasers can be synced up to 100Hz, or the frame rate of the triggered camera, whichever is less. This is the first time in the industry a laser power meter has been married to a laser beam profile system. BeamGage is the only product to integrate profiling and power meter measurements BeamGage contains a utility, BeamMaker, that can synthetically generate beam profile data by modeling either Laguerre, Hermite or donut laser beams in various modal configurations. BeamMaker permits the user to model a beam profile by specifying the mode, size, width, height, intensity, angle, and noise content. Once generated the user can then compare the theoretically derived measurements to measurements including experimental inaccuracies produced by the various measurement instruments and environmental test conditions. Users can now analyze expected results and confirm if measurement algorithms will accurately measure the beam even before the experiment is constructed. BeamMaker can help laser engineers, technicians and researchers understand a beam’s modal content by calculating results on modeled beams for a better understanding of real laser beam profiles. BeamMaker is to laser beam analysis as a function generator is to an oscilloscope. 3.2.1.1 Beam Analysis BeamMaker®; Numerical Beam Profile Generator BeamMaker producing a synthetically generated Hermite TEM22 beam and displayed in both 2D and 3D Integrated automatic Help linked into the Users Guide Touch sensitive Tool tips are available on most all controls, and "What’s This" help can provide additional details. Confused about what something is or forgot how it works, just go to the top right corner and touch the "What’s This" help icon, drag it and right click on the control or menu item that you want more info about and you are taken to the explanation within the BeamGage Users Guide. 125 For latest updates please visit our website: www.ophiropt.com/photonics 01.08.2013 3.2.1.2 BeamGage®-Professional Professional is an upgrade version of BeamGage-Standard that has all of the BeamGage-Standard features plus additional functionality. Image Partitioning Partitioning allows the user to subdivide the camera image into separate regions, called partitions, and compute separate beam results within each partition. When using partitioning special results items can be displayed that relate to delta values between the computed centroids or peaks of each partition. Partitioning is useful to enable separate analysis of individual beams when multiple beams impinge on the camera simultaneously. This feature is particularly useful when analyzing multiple fibers in a single bundle. 3.2.1.2 Beam Analysis Shown is an example of the results for partition P2 and its related display frame. Observe that the selected partition is highlighted in RED. The crosshair in each partition is user controlled. The crosshair can be moved to a new position with the mouse or can be numerically positioned using the expanded controls that appear when a partition is created. Automation Interface BeamGage Professional provides an automation interface via .Net components to allow customers the ability to build custom applications’ that incorporate the laser beam analysis and processing power of BeamGage. The BeamGage automation interface allows developers to control BeamGage programmatically via a set of “puppet strings” known as the automation interface. The automation interface was developed to provide the ability to base control decisions for a second application on results and behaviors recognized by BeamGage. With this ability users can quickly and efficiently meet their manufacturing/analysis goals with minimum human interaction. The automation interface was designed to achieve two main goals. First, to allow the BeamGage user to programmatically do what they could otherwise do via the graphical user interface (GUI). Second, to expose stable interfaces to the user that will not change, causing breaks to their dependant code. Interface examples for LabVIEW, Excel and .Net VB are included. 3.2.1.3 BeamGage®-Enterprise Enterprise is an upgrade version of BeamGage-Professional that has all of the BeamGage-Standard and -Professional features plus additional functionality. Networking BeamGage Enterprise Edition (BGE) allows cameras to be accessed and shared over an Ethernet local area network (LAN) that shares a common domain. 126 01.08.2013 For latest updates please visit our website: www.ophiropt.com/photonics 3.2.1.4 Software Comparison Chart Features BeamGage® Standard BeamGage® Professional BeamGage® Enterprise (all features in Standard plus) (all features in Pro plus) Features Overview User selectable for either best “accuracy” or “ease of use” Supports our patented Ultracal algorithm plus Auto-setup and Auto-exposure capabilities Extensive set of ISO quantitative measurements Support for USB, Firewire and Pyrocam III cameras. Supports InGaAs cameras in Firewire cameras limited to 32bit OS only. 32bit OS only Support for USB, Firewire and Pyrocam III InGaAs New Beam Maker® beam simulator for algorithm self validation. See below for more detailed description. Simultaneous 2D and 3D displays Multi-instance, multi-camera use Supports Gig-E camera in both 32 and 64 bit OS GigE Supports networked USB Firewire and Pyrocam III cameras. Gig-E in a future release. Results synchronised to select models of Ophir power/ energy meters. Supported products include: Vega, Nova II, Pulsar, USBI and Juno, in both 32 and 64bit OS. (Quasar is not supported) Supports Satellite windows on multiple monitors Continuous zoom scaling in both 2D and 3D Window partitioning to allow analysis of multiple beams on a single camera Full featured logging capabilities in a reloadable Industry standard data file format Configurable Report Generator that allows cut and paste of results, images and settings. Quantitative Calculations; Basic Results Power/Energy Results Spatial Results Supports English, German, Japanese and Chinese Windows OS in both 32 and 64bit. Multilingual GUI in English, Japanes and Chinese. (per ISO 11145, 11146-1/-3, and 13694) Total power or energy (Can be calibrated or sync’d to an external Ophir power/energy meter) Peak power/energy density Min. Fluence Average pulse power Peak pulse power Device efficiency % in Aperture Peak and Centroid locations Beam width ֺֺ Second Moment (D4s) ֺֺ Knife Edge 90/10 ֺֺ Knife Edge (User selectable level) ֺֺ Percent of Peak (User selectable) ֺֺ Percent of Total Energy (User selectable) ֺֺ Encircled power smallest slit @ 95.4 ֺֺ Moving slit (User selectable) Beam diameter ֺֺ Average diameter (based on x/y widths) ֺֺ Second Moment (D4s) ֺֺ Encircled power smallest aperature 86.5 ֺֺ Encircled power smallest aperature (User selectable level) NET Automation interface that. allows for remote control Examples in LabView, Excel and .Net VB 3.2.1.4 Beam Analysis Camera ROI support on USB and Firewire cameras Manual and Auto-aperturing to reduce background effects Pass/Fail on all results items, w/multiple alarm options Beam Pointing Stability scatter plot and stripchart results 127 For latest updates please visit our website: www.ophiropt.com/photonics 01.08.2013 Features BeamGage® Standard Elliptical Results ֺֺ Elliptical orientation ֺֺ Ellipticity ֺֺ Eccentricity Distance Measurement ֺֺ Cursor to Crosshair ֺֺ Centroid to Crosshair Area Results Beam cross-sectional area Focal Length method Far-field two-point method Far-field Wide Angle method 2D whole beam fits 1D line fits Height Width X/Y Centroid Goodness of fit Roughness of fit 2D and 1D Flatness Effective Area Effective Power/Energy Fractional Effective Power/Energy Effective Average Fluence Uniformity Plateau Uniformity Edge Steepness 1D or 2D surface inclination Frame Averaging Frame Summing Frame Reference Subtraction Image Convolution Camera signal/noise calculator Row and Column summing with results loggable Divergence Gaussian Fit Tophat Results 3.2.1.4 Beam Analysis Other Quantitative Items Beam Stability Displays and Results Beam Profile Display Options (per ISO 11670) Pointing Stabilty of Centroid ֺֺ Scatter Plot display w/histogram ֺֺ Mean Centroid ֺֺ Azimuth angle of the scatter ֺֺ Stability (M’/m’/S) ֺֺ Max Radius ֺֺ X/Y centroid/peak Strip chart plots ֺֺ Sample/Time controlled ֺֺ Pass/Fail limits ֺֺ Auto scaling ֺֺ Beam Width/Diameter Strip Charts with Results ֺֺ X/Y M/m beam widths plots ֺֺ Beam Diameter plot ֺֺ Mean/Std Dev/Min/Max results displayed ֺֺ Power/Energy Strip Charts ֺֺ Total Power/Energy plot ֺֺ Peak fluence plot ֺֺ Avg Power plot ֺֺ Elliptical Results Strip Chart ֺֺ Elliptical orientation plot ֺֺ Ellipticity plot ֺֺ Eccentricity plot ֺֺ Mean/Std Dev/Min/Max results displayed Utilizes advanced hardware accelerated graphics engines. All display windows can be satellited to utilize multiple display monitors. Can open one each simulaneous 2D and 3D beam display windows Common color palette for 2D and 3D displays Can open X and/or Y 1D beam slice profiles overlaid onto the 2D or 3D displays or in separate windows BeamGage® Professional BeamGage® Enterprise (all features in Standard plus) (all features in Pro plus) Scalable Intensity Histogram, exportable X or Y axial off axis image correction 128 01.08.2013 For latest updates please visit our website: www.ophiropt.com/photonics BeamGage® Standard Continuous software zooming in both 1D, 2D and 3D displays Pan to any detector location Continuous Z axis display magnitude scaling Multiple 128 color palettes user selectable Results items can be pasted into 2D, 3D, 1D, Pointing stability or Chart display windows. 1D Features 2D Features 3D Features Partitioning Available overlaid with 2D and 3D or in separate windows X any Y plots on separate or combined displays 1D displays with basic results and column row summing option Tophat 1D displays with Tophat results Gaussian 1D displays with Gaussian fit results 1D Profile display of the Gauss fit results on 1D, 2D and 3D displays Continuously zoomable and resizable displays in satellitable window Continuous Z axis display magnitude scaling Zoomable to subpixel resolution for origin and cursor placements Pixel boundaries delinated at higher zoom magnifications Adjustable Cursors that can track peak or centroid Adjustable Crosshairs that can track peak or centroid Adjustable manual apertures Viewable Auto-aperture placement Displayed beam width marker Integrated Mouse actuated pan/zoom controls Separate 2D pan/zoom window to show current view in 2D beam display Manual or fixed origin placement 3D graphics utilize solid surface construction with lighting and shading effects Integrated Mouse actuated pan/zoom/tilt/rotate controls Selectable Mesh for drawing speed vs resolution control Continuously zoomable and resizable displays in satellitable window Continuous Z axis display magnitude scaling User enabled backplanes with cursor projections BeamGage® Professional BeamGage® Enterprise (all features in Standard plus) (all features in Pro plus) Able to partition the camera imager into multiple regions with separate results. Ability to create partitions using the manual aperture controls Users can subdivide the imager into separate beam measurement regions. All enabled results are computed inside of each partition The manual aperture is used to define and create rectangular partition When partitioning is enabled some new results items will be enabled Centroid measurements between beams in each partition can be performed Partitioned imagers must have a single origin common to all partitions. All coordinate results are globally referenced to this single origin Statistical Analysis 3.2.1.4 Beam Analysis Features Performed on all measurement functions with on-screen display ֺֺ Choices of intervals ֺֺ Manual start/stop ֺֺ Time from 1 second to 1000 hours ֺֺ Frames from 2 to 99,999 Measurements reported ֺֺ Current frame data, Mean, Standard Deviation, Minimum, Maximum of each calculation performed Controls integrated with beam stability results, scatter and strip chart plots 129 For latest updates please visit our website: www.ophiropt.com/photonics 01.08.2013 Features BeamGage® Standard File types Industry Standard HDF5 data and setup file format which are compatable in third party applications such as MatLab and Mathmatica Math program and Excel compatable ASCII-csv results files Graphics in jpg file format Legacy file compatability with LBA formats A user defined single file output that can contain settings, beam displays, beam profiles, charts, results, etc. in either .pdf or .xps file formats Images, reports, results, graphs, charts, statistics and setup information Option to print many frames in a single operation WYSIWYG images Set Maximum/Minimum limits on all calculations and statistics Red/Green font color indication on result items Multiple choices for indication of failed parameters, including TTL pulse for external alarm Master pass/fail which triggers alarm on any failure USB signal, beep, stop, and log alarm options Video Data Logging Formats: HDF5, ASCII-csv Results in ASCII-csv Pictures 2D and 3D in jpg, gif, tiff, bmp, png file formats Charts in ASCII-csv Cursor Data in ASCII-csv Row/Column summed in ASCII-csv Continuous Logging Time Interval Logging Frame Count Logging Periodic Sampling Pass/Fail Sampling Burst Sampling, after a user specified time interval, sample a user specified number of frames Convert frame buffer data to third party format Export a user specified number of frames from the buffer Export Image Data: ASCII-cvs Export Results: ASCII-csv Export Picture: jpg, gif, tiff, bmp, png file formats supported Export Cursor Data: ASCII-cvs Export Row/Column summed: ASCII-cvs Export Image Data in Aperture Printing Pass/Fail Logging 3.2.1.4 Beam Analysis Exporting Automation Interface (.NET) Integrated Help Signal Conditioning for Enhanced Accuracy PDF Operators Manual Context Sensitive (Whats this?) Help Context Sensitive Hints Spiricon’s patented Ultracal enables more accurate beam measurement and display. Ultracal takes a multi- frame average of the baseline offset of each individual pixel to obtain a baseline accurate to approximately 1/8 of a digital count. This baseline offset is subtracted from each frame, pixel by pixel, to obtain a baseline correction accurate to 1/8 digital count. Spiricon’s Ultracal method retains numbers BeamGage® Professional BeamGage® Enterprise (all features in Standard plus) (all features in Pro plus) Automation Interface with examples in LabVIEW, Excel and .Net VB Automate launch and termination of the application Automate start, stop, Ultracal, Auto-X and Auto Setup Automate the loading of application setups Automate control of most camera settings Automate a subset of the application features and controls Automate the capture of Binary Video Data Automate the acquisition of application results Automate the acquisition of application Images 130 01.08.2013 For latest updates please visit our website: www.ophiropt.com/photonics BeamGage® Standard BeamGage® Professional BeamGage® Enterprise (all features in Standard plus) (all features in Pro plus) less than zero that result from noise when the baseline is subtracted. Retaining fractional and negative numbers in the processed signal can increase the beam width measurement accuracy by up to 10X over conventional baseline subtraction and clip level methods. Spiricon’s Ultracal conforms to the best method described in ISO 11146-3:2004. Frame Averaging Up to 256 frames can be averaged for a signal-to-noise ratio, S/N, improvement of up to 16X (Noise is averaged up to 1/256th [8 fractional bits]). Data is processed and stored in a 32bit format. Frame Summing Up to 256 frames can be summed to pull very weak signals out of the noise. Due to the precise nature of Ultracal baseline setting, (i.e., a retention of both positive and negative noise components) summing of frames can be performed without generating a large offset in the baseline. Convolution (Adjacent Pixel Averaging) Choice of 5 convolution algorithms for spatial filtering for both display and calculations. Spatial filtering improves the visual S/N. Beam Maker® Beam Maker is a new feature that allows the user to model both Laguerre-Gaussian and Hermite-Gaussian laser beams in various modal configurations. With these models you have verification and validation tools that allows not only OSI but also the end user to verify BeamGage’s basic beam width measurement algorithms. It can also be used to model laser beams with special input conditions such as signal-to-noise, background offset, and bits per pixel resolution. This allows the user to better understand the accuracy of measurements made under both optimum and adverse conditions. This tool provides the user with a method to validate algorithms against current ISO standards and methods. It can also be used to validate third party algorithms by making the output data available for use in third party applications. Camera Features Camera features are governed by the capabilities of the various cameras that will interface with these software products, and second by which of these camera features are implimented in the software. This section will describe typical camera features supported in the application. Black Level Control (used by Ultracal and Auto-X and Auto-setup) Gain Control (used by Auto-X and Auto-setup) Exposure Control (used by Auto-X and Auto-setup) User Programmable ROI Pixel Binning Pixel Sampling Bits per pixel setting External Trigger Input Trigger Delay Strobe Output Strobe Delay External Trigger Probe Internal Trigger Probe Camera related features in the These are features related to but not generally applications dependent upon the camera design. Gamma Correction Gain Correction Bad Pixel Correction Lens Applied Option Pixel scale settings Magnification settings Frame buffer settings Ultracal Enable Auto-X (auto exposure control) Perform an Auto-Setup 8/10/12/14/16 bits per pixel Select Format or ROI Measure S/N ratio Trigger, Capture and Synchronization Capture methods are features related to the application Methods while Synchronization methods relate more to the abilities of the specific camera. NOTE: Frame capture rates are determined by many factors and are not guaranteed for any specific operating configuration. 3.2.1.4 Beam Analysis Features 131 For latest updates please visit our website: www.ophiropt.com/photonics 01.08.2013 Features 3.2.1.4 Beam Analysis Video Playback System Requirements BeamGage® Standard BeamGage® Professional BeamGage® Enterprise (all features in Standard plus) (all features in Pro plus) Trigger modes ֺֺ CW - captures continuously, see Capture Options below ֺֺ Trigger-In from laser: Trigger pulses supplied to the camera ֺֺ Strobe-Out to laser: Strobe pulses output from the camera ֺֺ Video Trigger: Frame captured and displayed only when the camera sees a signal greater than a user set level Capture options ֺֺ Capture options are redefined and are approached in a different manner than older products. The items listed below will allow for all of the previous methods but with more flexability than ever before ֺֺ Results Priority: Results priority will slow the capture rate to be in sync with the computational results and display updates ֺֺ Frame Priority: Frame priority will slow results and display updating to insure that frames are collected and stored in the frame buffer as fast as possible (replaces block mode) ֺֺ Stop After: Will collect a set number of frames and then stop (replaces Single-Shot mode) ֺֺ Periodic: Will collect frame at a programmed periodic rate ֺֺ Periodic Burst: Will collect frames in a Burst at programmed periodic rates Post processing is still available but is done via a different mechanism and is limited to only data file sources Video playback, post processing and post analysis User customizable playback rates Video file quick pan/search controls Whole video file playback looping with sub-selection looping Playback Video produced by logging Almost all measurements can be performed on video files PC computer running Windows7 (32/64) or XP (32) Pro Laptop or Desktop Note that some cameras require a 32bit OS. Consult factory for latest 64bit camera availability. 64bit OS required for Lw11058 camera. Not all cameras run in all Microsoft 05 versions, see fics camera section for specifics GHz Pentium style processor, dual core recommended Minimum 2GB RAM (4GB required for Lw11058 camera) Minimum 3-4GB RAM Accelerated Graphics Processor Hard drive space suitable to hold the amount of video data you expect to store (50-100 GB recommended) Provision for PCI-Express, FireWire, USB2 or Gigabit Ethernet input depending on camera. Interface hardware provided with a cameras except USB2. 132 01.08.2013 For latest updates please visit our website: www.ophiropt.com/photonics Ordering Information P/N SP90197 SP90198 SP90199 SP90200 SP90202D SP90202L SP90203D SP90203L SP90236 SP90237 SP90238 SP90239 SP90320 SP90241 SP90242D SP90242L SP90243D SP90243L SP90246 SP90247 3.2.1.4 Beam Analysis Item Description BeamGage Standard USB2 Beam Profiler Systems (camera and software) BGS-USB-SP503 BeamGage Standard software, software license, ½” format 640x480 pixel camera with 4.5mm CCD recess. Comes with USB cable and 3 ND filters. BGS-USB-SP503-1550 BeamGage Standard software, software license, ½” format 640x480 pixel camera with 4.5mm CCD recess. Phosphor coated to 1550 nm. Comes with USB cable and 3 ND filters. BGS-USB-SP620 BeamGage Standard software, software license, 1/1.8” format 1600x1200 pixel camera with 4.5mm CCD recess. Comes with USB and cable and 3 ND filters. BGS-USB-SP620-1550 BeamGage Standard software, software license, 1/1.8” format 1600x1200 pixel camera with 4.5mm CCD recess. Phosphor coated to 1550 nm. Comes with USB and cable, 3 ND filters. BeamGage Standard FireWire Beam Profiler Systems (camera and software) BGS-FWB-GRAS20,DESKTOP BeamGage Standard software, software license, 1/1.8” format 1600x1200 1394b camera with 17.5mm C-mount recess. Comes with 1394b and trigger cable, PCI-Express interface card and 3 ND filters. Desktop model. BGS-FWB-GRAS20,LAPTOP BeamGage Standard software, software license, 1/1.8” format 1600x1200 1394b camera with 17.5mm C-mount recess. Comes with 1394b and trigger cable, Laptop PCI-Express interface, power supply and 3 ND filters. Laptop Model. BGS-FWB-GRAS20-1550,DESKTOP BeamGage Standard software, software license, 1/1.8” format 1600x1200 Phosphor coated 1550nm sensor, 1394b camera with 17.5mm C-mount recess. Comes with 1394b and trigger cable, PCI-Express interface card and 3 ND filters. Desktop model. BGS-FWB-GRAS20-1550,LAPTOP BeamGage Standard software, software license, 1/1.8” format 1600x1200 Phosphor coated 1550nm sensor 1394b camera with 17.5mm C-mount recess. Comes with 1394b and trigger cable, PCI-Express interface card and 3 ND filters. Laptop Model. BeamGage Professional USB2 Beam Profiler Systems (camera and software) BGP-USB-SP503 BeamGage Professional Edition software, software license, 1/2” format 640x480 pixel camera with 4.5mm CCD recess. Comes with USB cable and 3 ND filters. BGP-USB-SP503-1550 BeamGage Professional Edition software, software license, 1/2” format 640x480 pixel camera with 4.5mm CCD recess. Phosphor coated 1550nm sensor. Comes with USB cable and 3 ND filters. BGP-USB-SP620 BeamGage Professional Edition software, software license, 1/1.8” format 1600x1200 pixel camera with 4.5mm CCD recess. Comes with USB cable and 3 ND filters. BGP-USB-SP620-1550 BeamGage Professional Edition software, software license, 1/1.8” format 1600x1200 pixel camera with 4.5mm CCD recess. Phosphor coated 1550nm sensor. Comes with USB cable and 3 ND filters. BGP-USB-L11059 BeamGage Professional Edition software, software license, 35mm format 4008x2672 pixel camera. Comes with universal power supply, USB cable and 3 ND filters. BGP-USB-XC130 BeamGage Professional Edition software, software license, 320x256 pixel InGaAs camera with C-mount recess. .9 to 1.7um spectral band. Comes with universal power supply, USB cable, external trigger cable and 3 ND filters (consult factory for other camera options). BeamGage Professional FireWire Beam Profiler Systems (camera and software) BGP-FWB-GRAS20-DESKTOP BeamGage Professional Edition software, software license, 1/1.8” format 1600x1200 pixel camera with 12.5mm C-mount CCD recess. Comes with 1394b and trigger cables, PCI-Express interface card and 3 ND filters. Desktop model. BGP-FWB-GRAS20-LAPTOP BeamGage Professional Edition software, software license, 1/1.8” format 1600x1200 pixel camera with 12.5mm C-mount CCD recess. Comes with 1394b and trigger cables, PCI-Express interface card, camera power supply, and 3 ND filters. Laptop model. BGP-FWB-GRAS20-1550-DESK BeamGage Professional Edition software, software license, 1/1.8” format 1600x1200 pixel camera with 12.5mm C-mount CCD recess. Phosphor coated 1550nm sensor. Comes with 1394b and trigger cables, PCI-Express interface card and 3 ND filters. Desktop model. BGP-FWB-GRAS20-1550-LAPTP BeamGage Professional Edition software, software license, 1/1.8” format 1600x1200 pixel camera with 12.5mm C-mount CCD recess. Phosphor coated 1550nm sensor. Comes with 1394b and trigger cable, PCI-Express interface card, camera power supply, and 3 ND filters. Laptop model. BeamGage Enterprise USB2 Beam Profiler Systems (camera and software) BGE-USB-SP503 BeamGage Enterprise Edition software, software license, 1/2” format 640x480 pixel camera with 4.5mm CCD recess. Comes with USB cable and 3 ND filters. BGE-USB-SP503-1550 BeamGage Enterprise Edition software, software license, 1/2” format 640x480 pixel camera with 4.5mm CCD recess. Phosphor coated 1550nm sensor. Comes with USB cable and 3 ND filters. BGE-USB-SP620 BeamGage Enterprise Edition software, software license, 1/1.8” format 1600x1200 pixel camera with 4.5mm CCD recess. Comes with USB cable and 3 ND filters. BGE-USB-SP620-1550 BeamGage Enterprise Edition software, software license, 1/1.8” format 1600x1200 pixel camera with 4.5mm CCD recess. Phosphor coated 1550nm sensor. Comes with USB cable and 3 ND filters. BGE-USB-L11059 BeamGage Enterprise Edition software, software license, 35mm format 4008x2672 pixel camera. Comes with universal power supply, USB cable and 3 ND filters. BGE-USB-XC130 BeamGage Enterprise Edition software, software license, 320x256 pixel InGaAs camera with C-mount recess. .9 to 1.7um spectral band. Comes with universal power supply, USB cable, external trigger cable and 3 ND filters (consult factory for other camera options). BeamGage Enterprise Gig-E Beam Profiler Systems (camera and software) BGE-GigE-OSI182000 BeamGage Enterprise Edition software, software license, 1/1.8” format 1600x1200 pixel Gig-E camera with 17.5mm C-mount CCD recess. Comes with Cat5e cable, power supply with ext trigger adapter, Ethernet destop and laptop PCI-Express cards and 3 ND filters. BGE-GigE-OSI182000-1550 BeamGage Enterprise Edition software, software license, 1/1.8” format 1600x1200 pixel Gig-E camera with 17.5mm C-mount CCD recess. Phosphor coated 1550nm sensor. Comes with Cat5e cable, power supply with ext trigger adapter, Ethernet destop and laptop PCI-Express cards and 3 ND filters. SP90248 SP90249 SP90321 SP90251 SP90269 SP90272 133 For latest updates please visit our website: www.ophiropt.com/photonics 01.08.2013 3.2.1.4 Beam Analysis Ordering Information Item Description BeamGage Enterprise FireWire Beam Profiler Systems (camera and software) BGE-FWB-GRAS20-DESKTOP BeamGage Enterprise Edition software, software license, 1/1.8” format 1600x1200 pixel camera with 17.5mm C-mount CCD recess. Comes with 1394b and trigger cable, PCI-Express interface card and 3 ND filters. Desktop model. BGE-FWB-GRAS20-LAPTOP BeamGage Enterprise Edition software, software license, 1/1.8” format 1600x1200 pixel camera with 17.5mm C-mount CCD recess. Comes with 1394b and trigger cable, PCI-Express interface card, camera power supply, and 3 ND filters. Laptop model. BGE-FWB-GRAS20-1550-DESK BeamGage Enterprise Edition software, software license, 1/1.8” format 1600x1200 pixel camera with 17.5mm C-mount CCD recess. Phosphor coated 1550nm sensor. Comes with 1394b and trigger cable, PCI-Express interface card and 3 ND filters. Desktop model. BGE-FWB-GRAS20-1550-LAPTP BeamGage Enterprise Edition software, software license, 1/1.8” format 1600x1200 pixel camera with 17.5mm C-mount CCD recess. Phosphor coated 1550nm sensor. Comes with 1394b and trigger cable, PCI-Express interface card, camera power supply, and 3 ND filters. Laptop model. Software Upgrades BEAMSTAR TO BGS UPGRADE Upgrade any BeamStar FX or SP based product to BeamGage Standard Edition. Requires a camera key to activate. (SP cameras may require a firmware upgrade to enable ROI features). BEAMSTAR TO BGP UPGRADE Upgrade any BeamStar FX or SP based product to BeamGage Professional Edition. Requires a camera key to activate (SP cameras may require a firmware upgrade to enable ROI features). BEAMSTAR TO BGE UPGRADE Upgrade any BeamStar FX or SP based product to BeamGage Enterprise Edition. Requires a camera key to activate (SP cameras may require a firmware upgrade to enable ROI features). LBA TO BGS UPGRADE Upgrade any LBA-FW/USB/USB-SP based product to BeamGage Standard Edition. Requires a camera key to activate (Older Pyrocam III’s require a Firmware Upgrade). LBA TO BGP UPGRADE Upgrade any LBA-FW/USB/USB-SP based product to BeamGage Professional Edition. Requires a camera key to activate (Older Pyrocam III’s require a Firmware Upgrade). LBA TO BGE UPGRADE Upgrade any LBA-FW/USB/USB-SP based product to BeamGage Enterprise Edition. Requires a camera key to activate (Older Pyrocam III’s require a Firmware Upgrade). BGS TO BGP UPGRADE Upgrade BeamGage Standard Edition to Professional Edition. Requires a new camera key to activate. BGS TO BGE UPGRADE Upgrade BeamGage Standard Edition to Enterprise Edition. Requires a new camera key to activate. BGP TO BGE UPGRADE Upgrade BeamGage Professional Edition to Enterprise Edition. Requires a new camera key to activate. PC Accessories for Cameras PCI-Express FireWire 1394a/b PCI-Express, IEEE 1394a/b FireWire card for installation to desktop PC’s. Card has both 1394a and 1394b Desktop Card compatible ports. Compatible with all LBA and BeamGage FireWire systems. 1394b FireWire Cable 1394b FireWire cable, 4.5 meter length. 1394a/b Adapter Cable 1394a-6 to 1394b-9 adaptor cable, 4.5 meter length. 1394b FireWire Power Supply External Wall cube power supply for 1394b CardBus and PCI-Express/34 Laptop Adapters. USB A-B Cable USB Cable with A to B connectors, 5 meter length. USB A-mini B Cable USB Cable with A to mini-B connectors, 5 meter length. USB-Pass/Fail Cable Output Pass/Fail signals when BeamGage is in out mode Optical Synch for Pulsed Lasers Optical Trigger for FX and SP Cameras Optical trigger assembly which can be mounted on camera or separately to sense laser pulses and synchronize FX and SP cameras with pulses. Comes with a BNC cable. Stand for mounting sold separately. 134 01.08.2013 For latest updates please visit our website: www.ophiropt.com/photonics P/N SP90252D SP90252L SP90253D SP90253L SP90219 SP90229 SP90230 SP90210 SP90231 SP90232 SP90233 SP90234 SP90235 SP90164 SP90166 SP90207 SP90167 SP90204 SP90205 SP90060 SPZ17005 3.2.2 BeamMicTM – Basic Laser Beam Analyzer System ֺֺ ֺֺ ֺֺ ֺֺ ֺֺ ֺֺ ֺֺ ֺֺ ֺֺ ֺֺ ֺֺ ֺֺ ֺֺ ֺֺ ֺֺ ֺֺ High-speed false color beam intensity profile displays in both 2D and 3D Operates in Windows 7 (32/64) VISTA (32/64) and XP (32) Professional Numerical beam profile analysis employs patented advanced calibration algorithms. Extensive set of ISO quantitative measurements ISO beam width and diameter methods Enhanced window layout tools to get the most out of the desktop display area Pass/fail testing available on most all measured parameters Support for USB SPxxx series cameras Supports satellite windows on multiple monitors Continuous zoom scaling in both 2D and 3D Results logging capabilities exportable to Excel Industry std data file formats, HDF5 and CSV Configurable Report Generator that allows cut and paste of results, images and settings from .PDF and .XPS file types Statistical Analysis of all measured parameters Both Drawn and Auto Aperture for isolating beam data Integrated automatic Help linked into this .pdf Users Guide The beam’s size, shape, uniformity or approximation to the expected power distribution, can make or break an application. Accurate knowledge of these parameters is essential to the accuracy of any laser-based application. As laser applications push the boundaries of laser performance it is becoming more critical to understand the operating criteria. BeamMic Main Display Screen File Save/Load ApplicationButton Integrated Help System Tabbed Control Access 2D Beam Display Tool Windows that dock inside or float outside App 3.2.2 Beam Analysis The BeamMic series of laser beam analyzer systems are designed for entry level or basic profiling needs. Beam Results With Statistics ISO Compliant Results Processing Status Indicators 3D Beam Display Buffered Video Scrolling Controls 135 For latest updates please visit our website: www.ophiropt.com/photonics 01.08.2013 Camera Compatibility For lasers between 190-1100nm wavelenghts, BeamMic interfaces to silicon CCD USB cameras. For applications between 1440-1605nm, BeamMic supports cost effective phosphor coated CCD cameras. 190-1100nm Model SP503U SP620U Spectral Response nm Application 190 - 1100nm* ½” format, slim profile, wide dynamic range, CW & pulsed lasers, adjustable ROI 190 - 1100nm* 1/1.8” format, high resolution, wide dynamic range, pulsed lasers, CW YAG, adjustable ROI Pixel spacing Number of Elements Interface Style Windows 05 support 9.9µm X 9.9µm 4.40µm X 4.40µm 640 x 480 1600 x 1200 USB USB Windows 7 (32/64), Vista (32/64) or XP (32) Pro 3.2.2 Beam Analysis * May be useable for wavelengths below 350nm but sensitivity is low and detector deterioration may occur. Therefore UV image converter is recommended. Although our silicon cameras have shown response out to 1320nm it can cause significant blooming which could lead to errors of beam width measurement. We would suggest our XC130 InGaAs camera and BeamGage for these wavelengths to give you the best measurements. 1440-1605nm Model SP503U-1550 SP620U-1550 Spectral Response nm Application 1440 - 1605nm NIR wavelengths, ½” format, low resolution 1440 - 1605nm NIR wavelengths, 1/1.8” format, low resolution, adjustable ROI and binning Pixel spacing** Number of Elements Interface Style Windows 05 support 9.9µm X 9.9µm 4.40µm X 4.40µm 640 x 480 1600 x 1200 USB USB Windows 7 (32/64), Vista (32/64) or XP (32) Pro ** Despite the small pixel size, the spatial resolution will not exceed 50µm due to diffusion of the light by the phosphor coating 136 01.08.2013 For latest updates please visit our website: www.ophiropt.com/photonics Features BeamMIc - Laser Beam Analyzer Software Features Overview Designed for entry level or basic profiling needs Supports our patented Ultracal algorithm plus Auto-setup and Auto-exposure capabilities Extensive set of ISO quantitative measurements Support for high and low resolution USB cameras Simultaneous 2D and 3D displays Multi-instance, multi-camera use Supports Satellite windows on multiple monitors Continuous zoom scaling in both 2D and 3D Camera ROI support Manual and Auto-aperturing to reduce background effects Pass/Fail on all results items, w/multiple alarm options Results logging capabilities in a reloadable Industry standard data file format Configurable Report Generator that allows cut and paste of results, images and settings. Supports English, German, Japanese and Chinese Windows OS in both 32 and 64bit . Multilingual GUI in English, Japanese and Chinese. (per ISO 11145, 11146-1/-3, and 13694) Total power or energy Peak power/energy density Min. Fluence Peak and Centroid locations Beam width ֺֺ Second Moment (D4s) ֺֺ Knife Edge 90/10 ֺֺ Knife Edge (User selectable level) ֺֺ Percent of Peak (User selectable) ֺֺ Percent of Total Energy (User selectable) ֺֺ Encircled power smallest slit @ 95.4 ֺֺ Moving Slit (User Selectable) Beam diameter ֺֺ Average diameter (based on x/y widths) ֺֺ Second Moment (D4s) Elliptical Results ֺֺ Elliptical orientation ֺֺ Ellipticity ֺֺ Eccentricity Continuously zoomable and resizable displays in satellitable window Continuous Z axis display magnitude scaling Zoomable to subpixel resolution for origin and cursor placements Pixel boundaries delinated at higher zoom magnifications Adjustable Cursors that can track peak or centroid Adjustable manual apertures Viewable Auto-aperture placement Displayed beam width marker Integrated Mouse actuated pan/zoom controls Manual or fixed origin placement 3D graphics utilize solid surface construction with lighting and shading effects Integrated Mouse actuated pan/zoom/tilt/rotate controls Selectable Mesh for drawing speed vs resolution control Continuously zoomable and resizable displays in satellitable window Continuous Z axis display magnitude scaling User enabled backplanes with cursor projections Performed on all measurement functions with on-screen display ֺֺ Choices of intervals ֺֺ Manual start/stop ֺֺ Time from 1 second to 1000 hours ֺֺ Frames from 2 to 99,999 Measurements reported ֺֺ Current frame data, Mean, Standard Deviation, Minimum, Maximum of each calculation performed Quantitative Calculations; Basic Results Power/Energy Results Spatial Results 2D Features 3D Features Statistical Analysis Features 3.2.2 Beam Analysis Software Specifications BeamMIc - Laser Beam Analyzer Software 137 For latest updates please visit our website: www.ophiropt.com/photonics 01.08.2013 File types Printing Pass/Fail 3.2.2 Beam Analysis Logging Industry Standard HDF5 data and setup file format which are compatable in third party applications such as MatLab and Mathmatica Math program and Excel compatable ASCII-csv results files Graphics in jpg file format A user defined single file output that can contain settings, beam displays, beam profiles, results in either .pdf or .xps file formats Images, reports, results, statistics and setup information Option to print many frames in a single operation WYSIWYG images Set Maximum/Minimum limits on all calculations and statistics Red/Green font color indication on result items Multiple choices for indication of failed parameters, including TTL pulse for external alarm Master pass/fail which triggers alarm on any failure USB signal, beep, stop, and log alarm options Results in ASCII-csv Continuous Logging Time Interval Logging Frame Count Logging Pass/Fail Sampling Exporting Convert frame buffer data to third party format Export a user specified number of frames from the buffer Export Image Data: ASCII-cvs Export Results: ASCII-csv Export Picture: jpg, gif, tiff, bmp, png file formats supported Export Image Data in Aperture Integrated Help PDF Operators Manual Context Sensitive (Whats this?) Help Context Sensitive Hints Signal Conditioning for Enhanced Spiricon’s patented Ultracal enables more accurate beam measurement and display. Accuracy Ultracal takes a multi- frame average of the baseline offset of each individual pixel to obtain a baseline accurate to approximately 1/8 of a digital count. This baseline offset is subtracted from each frame, pixel by pixel, to obtain a baseline correction accurate to 1/8 digital count. Spiricon’s Ultracal method retains numbers less than zero that result from noise when the baseline is subtracted. Retaining fractional and negative numbers in the processed signal can increase the beam width measurement accuracy by up to 10X over conventional baseline subtraction and clip level methods. Spiricon’s Ultracal conforms to the best method described in ISO 11146-3:2004 Frame Averaging Up to 256 frames can be averaged for a signal-to-noise ratio, S/N, improvement of up to 16X (Noise is averaged up to 1/256th [8 fractional bits]). Data is processed and stored in a 32bit format. Frame Summing Up to 256 frames can be summed to pull very weak signals out of the noise. Due to the precise nature of Ultracal baseline setting, (i.e., a retention of both positive and negative noise components) summing of frames can be performed without generating a large offset in the baseline. Convolution (Adjacent Pixel Averaging) Choice of 5 convolution algorithms for spatial filtering for both display and calculations. Spatial filtering improves the visual S/N. Camera features are governed by the capabilities of the various cameras that will Camera Features interface with these software products, and second by which of these camera features are implimented in the software. This section will describe typical camera features supported in the application. Black Level Control (used by Ultracal and Auto-X and Auto-setup) Gain Control (used by Auto-X and Auto-setup) Exposure Control (used by Auto-X and Auto-setup) Pixel Sampling Bits per pixel setting External Trigger Input Trigger Delay Strobe Output Strobe Delay External Trigger Probe Internal Trigger Probe Camera related features in the These are features related to but not generally dependent upon the camera design. applications Gamma Correction Gain Correction Bad Pixel Correction Lens Applied Option Pixel scale settings Magnification settings Frame buffer settings Ultracal Enable Auto-X (auto exposure control) Perform an Auto-Setup 8 & 12 bits per pixel Select Format Measure S/N ratio Features BeamMIc - Laser Beam Analyzer Software 138 01.08.2013 For latest updates please visit our website: www.ophiropt.com/photonics Trigger, Capture and Synchronization Capture methods are features related to the application while Synchronization methods Methods relate more to the abilities of the specific camera. NOTE: Frame capture rates are determined by many factors and are not guaranteed for any specific operating configuration. Trigger modes ֺֺ CW - captures continuously, see Capture Options below ֺֺ Trigger-In from laser: Trigger pulses supplied to the camera ֺֺ Strobe-Out to laser: Strobe pulses output from the camera ֺֺ Video Trigger: Frame captured and displayed only when the camera sees a signal greater than a user set level Capture options ֺֺ Capture options are redefined and are approached in a different manner than older products. The items listed below will allow for all of the previous methods but with more flexability than ever before ֺֺ Results Priority: Results priority will slow the capture rate to be in sync with the computational results and display updates ֺֺ Frame Priority: Frame priority will slow results and display updating to insure that frames are collected and stored in the frame buffer as fast as possible (replaces block mode) ֺֺ Stop After: Will collect a set number of frames and then stop (replaces SingleShot mode) ֺֺ Periodic: Will collect frame at a programmed periodic rate ֺֺ Periodic Burst: Will collect frames in a Burst at programmed periodic rates Post processing is still available but is done via a different mechanism and is limited to only data file sources System Requirements PC computer running Windows7 (32/64) or XP (32) Pro Laptop or Desktop GHz Pentium style processor, dual core recommended Minimum 2GB RAM (4GB required for Lw11058 camera) Accelerated Graphics Processor Hard drive space suitable to hold the amount of video data you expect to store (50-100 GB recommended) Ordering Information P/N SP90279 SP90280 SP90281 SP90282 SP90219 SP90229 SP90230 SPZ17005 3.2.2 Beam Analysis Item Description BeamMic USB2 Beam Analyzer Systems (camera and software) BM-USB-SP503 BeamMic software, software license, ½” format 640x480 pixel camera with 4.5mm CCD recess. Comes with USB cable and 3 ND filters. BM-USB-SP503-1550 BeamMic software, software license, ½” format 640x480 pixel camera with 4.5mm CCD recess. Phosphor coated to 1550 nm. Comes with USB cable and 3 ND filters. BM-USB-SP620 BeamMic software, software license, 1/1.8” format 1600x1200 pixel camera with 4.5mm CCD recess. Comes with USB and cable and 3 ND filters. BM-USB-SP620-1550 BeamMic software, software license, 1/1.8” format 1600x1200 pixel camera with 4.5mm CCD recess. Phosphor coated to 1550 nm. Comes with USB and cable, 3 ND filters. Software Upgrades BeamMic to BGS Upgrade Upgrade BeamMic to BeamGage Standard Edition. Requires a camera key to activate. (SP cameras may require a firmware upgrade to enable ROI features). BeamMic to BGP Upgrade Upgrade BeamMic to BeamGage Professional Edition. Requires a camera key to activate (SP cameras may require a firmware upgrade to enable ROI features). BeamMic to BGE Upgrade Upgrade BeamMic to BeamGage Enterprise Edition. Requires a camera key to activate (SP cameras may require a firmware upgrade to enable ROI features). Optical Synch for Pulsed Lasers Optical Trigger for SP Cameras Optical trigger assembly which can be mounted on camera or separately to sense laser pulses and synchronize SP cameras with pulses. Comes with a BNC cable. Stand for mounting sold separately. Recommended Optional LBS-300-BB Dual beam splitters and configurable 9 ND filters for 190-1550nm; screws onto front of camera SP90186 139 For latest updates please visit our website: www.ophiropt.com/photonics 01.08.2013 3.2.3 Cameras 3.2.3.1 190-1100nm USB Silicon CCD Cameras SP Series Features ֺֺ USB 2.0 compatible ֺֺ 64dB true system dynamic range - highest in the industry ֺֺ Programmable high speed electronic shutter ֺֺ Spectral range: 190 - 1100nm ֺֺ Gain adjustable to accommodate a wide range of input levels ֺֺ Built in optical trigger synchronizes with even the shortest laser pulses. ֺֺ Slim profile and multiple mounting options Built-in photodiode trigger 3.2.3.1 Beam Analysis SP503U/SP620U L-Series Features ֺֺ 35mm format for large beams ֺֺ 59dB true system dynamic range ֺֺ Spectral range: 190 - 1100nm USB L11059 140 01.08.2013 For latest updates please visit our website: www.ophiropt.com/photonics USB Cameras for use with Laptop or Desktop PC Item Specification Model SP503U SP620U USB L11059 Application ½" format, slim profile, wide dynamic range, CW & pulsed lasers, adjustable ROI 190 - 1100nm (2) 6.3mm W x 4.7mm H 9.9µm x 9.9µm 640 x 480 64 dB ±1% ±2% 30 fps at full resolution 60 fps at 320x240 1/1.8" format, high resolution, wide dynamic range, pulsed lasers, CW YAG, adjustable ROI 190 - 1100nm (2) 7.1mm W x 5.4mm H 4.40µm x 4.40µm 1600 x 1200 62 dB ±1% 36mm x 24mm, 35mm format for large dia. beams, CW & pulsed lasers, ideal for CW YAG, Adjustable ROI 190 - 1100nm (2) 35mm x 24mm 9.0µm x 9.0µm 4008 x 2672 59 dB ±1% 7.5 fps at full resolution 28 fps at 640x480 44 fps at 320x240 3.1 fps at full resolution higher rates with binning and smaller region of interest Shutter duration Gain control Trigger Photodiode trigger Saturation intensity (1) Lowest measurable signal (1) Damage threshold Dimensions and CCD recess Image quality at 1064nm Operation mode Software supported PC interface Notes: 30us to multiple frame times 43:1 automatic or manual control 29:1 automatic or manual control 1. BNC connector accepts positive or negative trigger. LED on camera indicates triggering. Will synchronize with laser repetition rates up to 1KHz. Built in pre-trigger allows synchronization to even sub-nanosecond pulses 2. Same connector can provide trigger out to synch laser. Supports programmable delay on Strobe Out 3. Same connector accepts photodiode trigger (see below) Optional photodiode trigger available: P/N SPZ17005 1.3µW/cm2 2.2µW/cm2 2.2µW/cm2 0.5nW/cm2 2.5nW/cm2 50W/cm2 / 0.1J/cm2 with all filters installed for <100ns pulse width(3) 96mm x 76mm x 16mm 96mm x 76mm x 23mm CCD recess: 4.5mm below surface CCD recess: 4.5mm below surface Pulsed with trigger sync - excellent Pulsed with trigger sync - excellent Pulsed with video trigger - good Pulsed with video trigger - good CW - poor CW - good Interline transfer progressive scan CCD BeamGage USB 2.0 10us to multiple frame times Supports both Trigger In and Strobe Out N/A 0.15µW/cm2 0.17nW/cm2 0.15mW/cm2 83mm x 76mm x 128mm CCD recess: 18.8mm below bezel, 31.75 from ND filter holder Pulsed with trigger sync - excellent Pulsed with video trigger - good CW - good (1) Camera set to full resolution at maximum frame rate and exposure times, running CW at 632.8nm wavelength. Camera set to minimum useful gain for saturation test and maximum useful gain for lowest signal test. (2) May be useable for wavelengths below 350nm but sensitivity is low and detector deterioration may occur. Therefore UV image converter is recommended. Although our silicon cameras have shown response out to 1320nm it can cause significant blooming which could lead to significant errors of beam width measurement. We would suggest our XC130 InGaAs camera for these wavelengths to give you the best measurements. (3) This is the damage threshold of the filter glass of the filters. Assuming all filters mounted with ND1 (red housing) filter in the front. Distortion of the beam may occur with average power densities as low as 5W/cm2. 3.2.3.1 Beam Analysis Spectral Response Active Area Pixel spacing Number of effective pixels Minimum system dynamic range Linearity with Power Accuracy of beam width Frame rates: In 12 bit mode 141 For latest updates please visit our website: www.ophiropt.com/photonics 01.08.2013 3.2.3.2 190-1100nm Firewire Silicon CCD Cameras Models GRAS 20 Features ֺֺ 61dB true system dynamic range (14 bit with BeamGage) ֺֺ High speed electronic shutters ֺֺ Exclusive Ultracal available for ISO conforming accuracy ֺֺ Flexible external trigger and strobe output for synchronization with laser pulses ֺֺ Available with BeamGage software GRAS 20 GRAS 20/GRAS 20-1550 DUAL IEEE-1394b PORTS 44 65 ACTIVE AREA 7.1 x 5.4 35 17.5 29 ACTIVE AREA TRIGGER / SERIAL PORT 1"-32 UN (C-Mount) Beam Analysis Firewire Cameras for use with Laptop or Desktop PC Item Specification Model GRAS 20 Application Spectral Response Maximum beam size Pixel spacing Number of effective pixels Minimum system dynamic range (1) Linearity with Power Accuracy of beam width Frame rates Shutter duration Gain control Trigger Photodiode trigger Saturation intensity (1) Lowest measurable signa (1) Damage threshold Dimensions and CCD recess Image quality at 1064nm Operation mode Software supported PC interface Minimum host system requirements 1/1.8” format, high resolution, CW YAG, adjustable ROI 190 – 1100nm(3) 7.1mm W x 5.4mm H 4.4µm x 4.4µm 1600 x 1200 61dB ±1% ±2% 15Hz full res; >60Hz depending on ROI(2) From 1/frame rate to 1/10,000s. Manual or continuous automatic control 0db to 25db Manual control Supports both trigger in and strobe out Optional photodiode trigger available: ESP-GRAS 0.3µW/cm2 0.4nW/cm2 50W/cm2 / 1J/cm2 with all filters installed for <100ns pulse width(4) 35mm x 44mm x 65mm Fixed C-mount Pulsed with video trigger - good Pulsed, sync - excellent CW - good Interline transfer progressive scan CCD BeamGage IEEE 1394b Firewire IEEE 1394b requires 1394b port or PCI-Express or CardBus Slot Notes: (1) Camera set to full resolution at maximum frame rate and equivalent exposure times, running CW at 632.8nm wavelength. Camera set to minimum useful gain for saturation test and maximum useful gain for lowest signal test. (2) The maximum rate depends on the ROI (Region of Interest) size, the bits readout, and the number of cameras on the same bus. The SCOR 20 operates at 7.5Hz 12 bits and 15Hz 8 bits. It operates up to at least 60Hz with a smaller ROI. The frame rate also depends on PC resources. (3) May be usable for wavelengths below 350nm but sensitivity is low and detector deterioration may occur. Therefore UV image converter is recommended. Although our silicon cameras have shown response out to 1320nm it can cause significant blooming which could lead to significant errors of beam width measurement. We would suggest our XC130 InGaAs camera for these wavelengths to give you the best measurements. (4) This is the damage threshold of the filter glass of the filters. Assuming all filters mounted with ND1 (red housing) filter in the front. Distortion of the beam may occur. 142 01.08.2013 For latest updates please visit our website: www.ophiropt.com/photonics 3.2.3.3 190-1100nm Gig-E Silicon CCD Cameras Models Gevicam Features ֺֺ Ethernet compatible ֺֺ Network multiple cameras, multiple versions of BeamGage ֺֺ Long cable distances ֺֺ High speed image acquisition ֺֺ External trigger for synchronization with laser pulses Gevicam Gevicam Item Specification Model Gevicam Application Spectral Response Maximum beam size Pixel spacing Number of effective pixels Minimum system dynamic range (1) Linearity with Power Accuracy of beam width Frame rates Shutter duration Gain control Trigger Photodiode trigger Saturation intensity (1) Lowest measurable signa (1) Damage threshold Dimensions and CCD recess Image quality at 1064nm Operation mode Software supported PC interface Minimum host system requirements Windows OS support 1/1.8” format, high resolution, networkable, long cable distances, adjustable ROI 190 - 1100nm* 7.16mm (H) x 5.44mm (V) 4.4µm x 4.4µm 1600 x 1200 ~57dB full speed, full resolution, min gain ±1% ±2% 17fps @ full resolution /7.5fps optional; faster rates with binning 60ms @ 17fps; 133ms @ 7.5fps 33dB 5V TTL 2µsec min, positive pulse, rising edge triggered N/A 0.3µW/cm2 0.5lux @ 17fps 50W/cm2 / 0.1J/cm2 with all filters installed for <100ns pulse width(3) 34mm x 34mm x 69mm CCD recess: 17.5mm below surface Pulsed with video trigger - good, Pulsed sync - excellent, CW - good Inline transfer progressive scan BeamGage - Enterprise Gigbit ethernet PC desktop with PCI-Express slot or laptop with PCI-Express/34 slot Windows 7 (32/64) or Vista (32/74) Notes: (1) Camera set to full resolution at maximum frame rate and equivalent exposure times, running CW at 632.8nm wavelength. Camera set to minimum useful gain for saturation test and maximum useful gain for lowest signal test. (2) The maximum rate depends on the ROI (Region of Interest) size, the bits readout, and the number of cameras on the same bus. The SCOR 20 operates at 7.5Hz 12 bits and 15Hz 8 bits. It operates up to at least 60Hz with a smaller ROI. The frame rate also depends on PC resources. (3) May be usable for wavelengths below 350nm but sensitivity is low and detector deterioration may occur. Therefore UV image converter is recommended. Although our silicon cameras have shown response out to 1320nm it can cause significant blooming which could lead to significant errors of beam width measurement. We would suggest our XC130 InGaAs camera for these wavelengths to give you the best measurements. (4) This is the damage threshold of the filter glass of the filters. Assuming all filters mounted with ND1 (red housing) filter in the front. Distortion of the beam may occur. Beam Analysis Gig-E Cameras for use with Laptop or Desktop PC 143 For latest updates please visit our website: www.ophiropt.com/photonics 01.08.2013 3.2.3.4 1440-1605nm Phosphor Coated CCD Cameras For NIR Response Features ֺֺ 1440-1605 nm Wavelengths ֺֺ NIR Telecom mode field analysis ֺֺ NIR Laser beam analysis Available Models ֺֺ USB models: SP503U-1550 SP620U-1550 ֺֺ Firewire models: GRAS20-1550 ֺֺ Analog Camera: SP-1550M Phosphor Coating Technology SP-1550M SP503U-1550 SP620U-1550 GRAS20-1550 The up-conversion from NIR to visible light in the 1550 series cameras is nonlinear. The anti-Stokes phosphor coating produces visible photons at a rate roughly the square of the input signal. This is shown dramatically where the camera total output increases dramatically faster than a linear output shown in the bottom line. The CCD camera saturation in the center of a beam, the up-converted visible signal drops as the square of the input signal. Thus the lower signal wings of a beam are suppressed, resulting in the appearance and measurement of a beam width much smaller than actual. 1550nm Fiber Output 1610nm OPO Output Non-Linearity of SP-1550M Camera at 1550nm SP-1550M Camera: Comparison of Beam Shape with and without Correction Factor Uncorrected Peak Signal Magnitude in Digital Counts Linear From Min Signal Output signal in digital counts 3.2.3.4 Beam Analysis This illustration is a comparison of the cross-section of a beam with and without correction. As seen, the real width of the beam is much greater than would be observed without correction. Beam Width With Correction, width=86 Pixels Without Correction, width = 58 Pixels Total input Power in uW Beam Width in Pixels Non-linear output of the 1550 series cameras. Cross-section of a fiber beam with and without non-linearity correction. 144 01.08.2013 For latest updates please visit our website: www.ophiropt.com/photonics Wavelength Response The anti-Stokes up-conversion efficiency is very wavelength dependent. This graph shows the typical spectral response curve of a new, high response coating. As seen, we have calibrated the response from 1527nm to 1605nm. We have extrapolated the shorter wavelength region by comparing our measured response to data published over the entire range. mW/cm 2 for Full Video 100 Phosphor Coated CCD Response 10 Measured Signal required versus wavelength to achieve Extrapolated from Published Data camera full signal illumination by anti-Stokes up conversion material. 1 1460 1470 1480 1490 1500 1510 1520 1530 1540 1550 1560 1570 1580 1590 1600 1610 Wa velength (nm) Phosphor Coated Cameras with Spiricon's BeamGage software Spiricon's engineers have carefully measured the non-linearity of the signal generated by the Phosphor Coated series cameras. The software in the BeamGage incorporates an algorithm to correct for the non-linearity. This illustration shows the linearity obtained, showing in the top line that the low level signals drop linearly, rather than at the square of the input, seen in the lower line. Beam profile of a fiber beam with non-linearity correction. Beam profile of a fiber beam without non-linearity correction. 3.2.3.4 Beam Analysis The two photos show the uncorrected and corrected camera beam shape in 3D. See the BeamGage section for additional information on the beam analyzer. SP-1550M; RS-170 monitor display when used without a frame grabber. 145 For latest updates please visit our website: www.ophiropt.com/photonics 01.08.2013 Specifications: Phosphor Coated For NIR Response Model SP503U-1550 SP620U-1550 GRAS20-1550 SP-1550M Application NIR wavelengths, ½" format, low resolution NIR wavelengths, 1/1.8" format, adjustable ROI NIR wavelengths, ½" format Spectral Response Maximum beam size Pixel spacing (1) Number of effective pixels Minimum system dynamic range (2) Linearity with Power Spatial Uniformity Accuracy of beam width Frame rates In 12 bit mode (3) 1440 - 1605nm 6.3mm W x 4.7mm H 9.9μm x 9.9μm 640 x 480 ~30 dB NIR wavelengths, 1/1.8" format, low resolution, adjustable ROI and binning 1440 - 1605nm 7.1mm W x 5.4mm H 4.4μm x 4.4μm 1600 x 1200 ~30 dB 1440 - 1605nm 7.1mm x 5.4mm 4.4μm x 4.4μm 1600 x 1200 ~30dB 1440 - 1605nm 4.7mm x 5.4mm 8.4μm x 9.8μm 640 x 480 pixels ~30dB ±5% ±5% ±5% ±5% 15Hz full res >60Hz with smaller ROI (3) 30 Hz ±5% ±5% ±5% ±5% ±5% for beams larger than 0.6 mm 30 fps at full resolution 8 fps at full resolution 60 fps at 320x240 28 fps at 640x480 44 fps at 320x240 Shutter duration 30μs to multiple frame times Gain control 43:1 manual 29:1 manual Trigger Supports both Trigger In and Strobe Out Photodiode trigger Consult Factory Saturation intensity 7mW/cm2 at 1550 nm Lowest measurable signal ~ 50μW/cm2 Damage threshold 50W/cm2/0.1J/cm2 with all filters installed for <100ns pulse width(4) Dimensions and CCD 96X76X16mm; 4.5mm below 96X76X28mm; 4.5mm below recess surface surface Operation mode Interline transfer progressive scan CCD Software supported BeamGage PC interface USB 2.0 Host system requirements 3.2.3.4 Beam Analysis Notes: 0db to 25db Manual control N/A (consult factory) 70 mW/cm2 at 1550 nm 70 mW/cm2 at 1550 nm 20mm x 44mm x 58mm Fixed 37mm x 34mm x 56mm CCD C-mount recess from surface 12.5mm, Adjustable Interline transfer progressive Interline Transfer interlaced scan CCD CCD BeamGage IEEE 1394b IEEE 1394 port or PCI-Express or CardBus Slot (1) Despite the small pixel size, the spatial resolution will not exceed 50μm due to diffusion of the light by the phosphor coating. (2) Signal to noise ratio is degraded due to the gamma of the phosphor’s response. Averaging or summing of up to 256 frames improves dynamic range by up to 16x = +24dB. (3) In normal (non-shuttered) camera operation, the frame rate is the fastest rate at which the laser may pulse and the camera can still separate one pulse from the next. With electronic shutter operation, higher rate laser pulses can be split out by matching the laser repetition to the shutter speed. (4) This is the damage threshold of the filter glass of the filters. Assuming all filters mounted with ND1 (red housing) filter in the front. Distortion of the beam may occur with average power densities as low as 5W/cm2. 146 01.08.2013 1/60 to 1/100,000 sec, 9 steps Manual adjustment N/A N/A For latest updates please visit our website: www.ophiropt.com/photonics 3.2.3.5 900-1700nm - InGaAs NIR Cameras Models XC-130 100Hz Features ֺֺ ֺֺ ֺֺ ֺֺ ֺֺ NIR performance at room temperature High resolution InGaAs array: 320x256 60dB true system dynamic range Exclusive Ultracal for ISO conforming accuracy Available with BeamGage software XEVA 100Hz 106,5 90,5 31,68 49,8 86,05 110,7 75,09 43,7 12,31 USB Cameras for use with Laptop or Desktop PC Model XEVA XC-130 Description Application Spectral response Element pitch Number or elements Area Lens Minimum system dynamic range Frame rate Non-uniformity correction Snap-shot mode Exposure control Imager Cooling Ambient operating temperature Dimensions, mm, HxWxD Weight, camera head Software supported PC interface NIR wavelengths, high resolution, ROI and binning 900-1700nm (consult factory for other options) 30µm square 320 x 256 9.6 x 7.6mm C-mount, (Optional) low gain 68dB, high gain 60dB 100 Hz (1) 2-Point correction plus bad pixel correction, NUC files provided Via external TTL trigger, cable provided 1us to 400 sec in Low Gain mode Thermoelectric cooler plus forced convection 0 - 50° C 111 x 87 x 107 mm approx. 1.8 kg BeamGage USB 2.0, special cable provided Note: (1) The uncorrected rate, final corrected rate will be less. 3.2.3.5 Beam Analysis 55 64 87,4 147 For latest updates please visit our website: www.ophiropt.com/photonics 01.08.2013 3.2.4 13-355nm and 1.06-3000µm - Pyroelectric Array Camera PyrocamTM III Series Features ֺֺ Spectral ranges available from 13 to 355 nm and 1.06 to >3000 µm ֺֺ Image CO2 lasers, telecom NIR lasers and other infrared sources out to Far IR THz sources ֺֺ Solid state array camera with 1000:1 linear dynamic range for accurate profiling ֺֺ Integrated chopper for CW beams and thermal imaging ֺֺ Versatile Firewire interface ֺֺ Interchangeable windows available for a variety of applications ֺֺ Image Viewer utility presents 3D isometric plots, 2D color contour plots and grayscale, among other views ֺֺ Includes BeamGage Laser Beam Analysis Software for extensive quantitative analysis and image display Spiricon has been the world leader in the manufacture of pyroelectric solid-state detector arrays and cameras. For over 25 years the PyrocamTM has been the overwhelming camera of choice for Laser Beam Diagnostics of IR and UV lasers and high temperature thermal imaging. Precision, stability, reliability, and versatility have become its proud heritage. 3.2.4 Beam Analysis The PyrocamTM III offers easy Windows® camera setup, direct Windows quantitative and image display, 14 bit digitizer, versatile Firewire® PC interface, an integral chopper for CW beams and thermal imaging, and many other enhanced features. See Your Beam As Never Before The PyrocamTM III camera creates clear and illuminating images of your laser beam profile. Displayed in 2D or 3D views, you can immediately recognize beam characteristics that affect laser performance and operation. This instantly alerts you to detrimental laser variations. Instantaneous feedback enables timely correction and real-time tuning of laser parameters. For example, when an industrial shop foreman saw the CO2 laser beam profile in Figure 1 he knew immediately why that laser was not processing materials the same as the other shop lasers, with the profile shown in Figure 2. Fig. 1. Industrial CO2 laser performing inconsistent processing. Fig. 2. Industrial CO2 laser performing specifed processing. Pulsed and CW Lasers The PyrocamTM III measures the beam profile of both pulsed and CW lasers. Since the pyroelectric crystal is an integrating sensor, pulses from femtosecond to 12.8ms can be measured. The pyroelectric crystal only measures changes in intensity, and so is relatively immune to ambient temperature changes. Because CW laser beams must be chopped to create a changing signal, the PyrocamTM III contains an integral chopper as an option. 148 01.08.2013 For latest updates please visit our website: www.ophiropt.com/photonics Measuring Terahertz Beam Profiles Spiricon’s PyrocamTM III pyroelectric camera is an excellent tool for measuring THz lasers and sources. The coating of the crystal absorbs all wavelengths including 1µm to over 3000µm (0.1THz to 300THz). For THz sources the sensitivity of the PyrocamTM III is relatively low, at about 300mW/cm2 at full output. With a S/N of 1000, beams of 30mW/cm2 are easily visible. In addition, with Spiricon’s patented Ultracal baseline setting, multiple frames can be summed to “pull” a signal out of the noise. Summing 256 frames enables viewing of beams as low as 1-2mW/cm2. With Terahertz research suddenly being a central topic of interest, the PyrocamTM III becomes an invaluable aid in this exciting research. Otherwise, scientists working on Terahertz research have no easy way to characterize the profile, or energy distribution, of their lasers or sources. Broad Wavelength Response THz laser beam at 0.2THz (1.55mm) 3mW input power; 19 frames summed. The PyrocamTM III detector array has a very broadband coating which enables operation at essentially all IR and UV laser wavelengths. The curve ends at 100nm in the UV, but X-ray operation has been observed. Likewise the curve ends at 100µm in the far IR, but the camera has been used at >3000µm. Er:YAG laser at 2.9µm. Output of infrared fiber optic. Fig. 6. Spectral response of PyrocamTM III detector array without window. THz laser beam at 1.6THz (184µm). 3.2.4 Beam Analysis Thus you can use the PyrocamTM III in the near IR for Nd:YAG lasers at 1.06µm, and for infrared fiber optics at 1.3µm and 1.55µm. Use the PyrocamTM III for HF/DF lasers near 4µm and for Optical Parametric Oscillators from 1 µm to 10µm. It measures Free Electron Lasers between 10µm and 3000µm. The PyrocamTM III is extremely useful in the UV from 355nm to 157nm for Excimer lasers and for tripled or quadrupled Nd:YAG lasers. The detector is stable under UV illumination, without the deterioration experienced by CCD cameras. (The pyroelectric detector operates in the visible spectrum, and can see the alignment HeNe used with CO2 lasers. However, spurious response from the underlying silicon multiplexer creates undesirable performance, and the camera is not recommended for quantitative visible measurements). Free Electron laser at 100µm. 149 For latest updates please visit our website: www.ophiropt.com/photonics 01.08.2013 Windows® PC Interface The PyrocamTM III Windows application incorporates setup software to control all functions of the camera, such as pulsed versus chopped operation, gain, and background reference subtraction, eliminating all controls from the camera housing. Windows Image Viewer A Windows viewer application enables viewing of the laser beam in a number of modes, including 3D isometric plots, 2D color contour plots, and gray scale for thermal imaging. This application enables stand-alone operation of the camera independent of any other software. Nevertheless, the Spiricon BeamGage beam analysis software provides many additional features and capabilities not incorporated with the camera. 3.2.4 Beam Analysis Composite Excimer LASIK beam profile at 193nm. Composite Excimer LASIK beam profile in 2D display. Hybrid Integrated Circuit Sensor The PyrocamTM III consists of a LiTa03 pyroelectric crystal mounted with indium bumps to a solid-state readout multiplexer. This sensor, developed for the Pyrocam I, has proven to be the most rugged, stable, and precise IR detector array available. Light impinging on the pyroelectric crystal is absorbed and converted to heat, which creates charge on the surface. The multiplexer then reads out this charge onto the video line. For use with short laser pulses, the firmware of the camera creates a very short electronic shutter to accurately capture the thermally generated signal. PyrocamTM III sensor array and window assembly 150 01.08.2013 PyrocamTM III Windows setup menu. For latest updates please visit our website: www.ophiropt.com/photonics State-Of-The-Art Electronics The camera features a 14 bit A/D converter which digitizes deep into the camera noise. This enables reliable measurement and analysis of both large signals and low level signals in the wings of the laser beam. Fourteen bit digitizing also enables accurate signal summing and averaging to pull weak signals out of noise. This is especially useful with fiber optics at 1.3µm and 1.55µm, and in thermal imaging. The PyrocamTM III camera electronics incorporates 2 Firewire® (IEEE 1394A) interface ports. Multiple Pyrocam IIIs can be daisy chained together using the 1394 cabling. New Housing & Chopper The PyrocamTM III incorporates a new compact housing measuring only 5.5” high by 5.1” wide, and 2.5” deep in the direction of the beam path. This allows the camera to be inserted into smaller spaces on the optical table. It also makes the camera useful as a portable camera for thermal imaging and on-site field service of laser systems. The PyrocamTM III integral focal plane chopper helps keep the camera head compact. The PyrocamTM III is an ideal camera for use in scientific laboratory investigation of laser beams. This includes physics, chemistry, and electronic system designs. As an example, the photos below show a research CO2 laser and a research Nd:YAG laser, both with cavity misalignment. The camera is also useful in product engineering of CO2 and other infrared lasers. The PyrocamTM III is an integral part of the assembly lines of many CO2 laser manufacturers. Integrators of systems are using the PyrocamTM sensor to make sure that optical systems are aligned and operating properly. CO2 laser with cavity misalignment. Nd:YAG laser with cavity misalignment. There are many medical applications of the PyrocamTM III, such as the analysis of excimer lasers used for eye surgery. In many cases these lasers need alignment to ensure that the eye surgery is performed as expected. Other medical IR lasers perform dermatology, for which the uniformity of the beam profile must be assured. Fiber optic communications, at 1.3µm and 1.55µm make significant use of the PyrocamTM III for analyzing the beams being emitted, as well as analyzing properties of the beams before launching them into fibers. The greater stability of the PyrocamTM III make it a good choice over other cameras operating at telecommunication wavelengths. CO2 laser with cavity misalignment. 3.2.4 Beam Analysis Applications Of The PyrocamTM Ill Nd:YAG laser with cavity misalignment. 151 For latest updates please visit our website: www.ophiropt.com/photonics 01.08.2013 The PyrocamTM III is becoming an essential tool in the maintenance of industrial infrared lasers, especially CO2. The PyrocamTM III replaces non-electronic mode burns and acrylic blocks by providing higher definition electronic recording of data, and analysis of short term fluctuations. The PyrocamTM III is superior to other electronic methods of measuring CO2 lasers because the entire beam can be measured in a single pulse, and additional measurements made in real-time. This ensures that the beam did not change during the measurement. Detector Damage Threshold The PyrocamTM III sensor is capable of operation with intensities about 106 times greater than CCD cameras. This makes the camera ideal for use with high power lasers, as less attenuation is required. Nevertheless, pulsed lasers with fluence too high can evaporate the absorbing front electrode. Pulsed damage threshold of pyroelectric detector coating. As shown the damage threshold increases with pulse width. With nanosecond and longer pulses, detector saturation occurs before damage. With shorter pulses it helps to increase the camera amplifier gain so that electronic saturation occurs before damage. 3.2.4 Beam Analysis The sensor can be damaged by excessive CW power, which causes crystal cracking. Very few PyrocamTM III detectors have been damaged by CW power, but some have been ablated by high peak pulse energy. 152 01.08.2013 For latest updates please visit our website: www.ophiropt.com/photonics GENERAL SPECIFICATIONS FOR PYROCAMTM III Application Spectral response Interchangeable windows Active area Element spacing Number of elements Pixel size CHOPPED CW OPERATION Chopping frequencies Optional chopper Sensitivity (RMS noise limit) Noise equivalent power (NEP) Saturation power Damage total power Over entire array Power density PULSED OPERATION Laser pulse rate Pulse width Sensitivity (peak noise limit) 24Hz 48Hz 220 nW/pixel (24Hz) 320 nW/pixel (48Hz) 2.2 mW/cm2 (24Hz) 3.2 mW/cm2 (48Hz) 45 nW/Hz1/2/pixel (1Hz) 2.2W/cm2(24Hz) 3.2W/cm2 (48Hz) 2W 8W/cm2 OPERATING CONNECTIONS AND CONDITIONS Power Single-shot to 1000Hz 1fs - 12.8ms 7nJ/pixel 70µJ/cm2 10mJ/cm2 20mJ/cm2 (1ns pulse) 600mJ/cm2 (1 µs pulse) 120/230 VAC 60/50Hz External Supply 5°C to 50°C 140mm H X 130mm W X 62mm D Centered in width 35.6mm from bottom 15.2mm behind front cover (without included C-mount attached) 1.52Kg Weight MEASUREMENTS PERFORMED BY THE WINDOWS IMAGE VIEWER Total power or energy in digital counts or calibrated in software Peak power or energy in digital counts or calibrated in software Peak location in µm Centroid location in µm Diameter at 1/e2 points in µm X & Y Knife edge beam widths in µm USING BEAMGAGE Extensive set of quantitative and image display capabilities. See BeamGage data sheet. FEATURES ֺֺ 14 bit digital output in CW, 13 bit digital output in pulsed ֺֺ More critical A & B grading criteria Grade A Up to 50 bad pixels, all correctable No uncorrectable clusters Grade B Up to 100 bad pixels No uncorrectable clusters within the 70% central area, no more than 2 outside ֺֺ Compact Head 5.53”HX5.13”WX2.53”D ֺֺ Internal integrated focal plane chopper for CW (24 & 48Hz). No separate controller ֺֺ Lens mount and internal focal plane chopper for IR imaging ֺֺ Two Firewire® interface ports to PC computer (IEEE 1394a) 3.2.4 Beam Analysis Saturation energy Damage threshold Operating temperature PHYSICAL DIMENSIONS Case Dimensions Detector Position UV and IR 13 - 355nm 1.06 - 3000µm See selection in Ordering Information section 12.4mm x 12.4mm 100µm x 100µm 124 x 124 85µm x 85µm 153 For latest updates please visit our website: www.ophiropt.com/photonics 01.08.2013 GENERAL SPECIFICATIONS FOR PYROCAMTM III FEATURES ֺֺ Firewire to PCI adapter ֺֺ Windows image viewer 2D and 3D beam display Readout externally calibratable for energy or power Frame averaging and summing for low level signal analysis Data logging Manual gain setting Plus calculations previously provided X & Y width Centroid location Peak location Total power or energy in digital counts ֺֺ Windows setup menu (control console - no buttons or knobs, more user friendly) ֺֺ High speed, up to 1kHz standard ֺֺ Automatic lock in to pulse trigger rate ֺֺ Programmable exposure time (to reduce signal loss from thermal spread) 50µs to 12.8ms in 50µs increments ֺֺ Slider for fine adjustment gain settings; 1X to 10X CW, 6X Pulse ֺֺ User enabled bad pixel correction ֺֺ Separate bad pixel correction for pulsed and CW ֺֺ User enabled gain correction - separate for pulsed and CW ֺֺ Internet field upgradeable firmware ֺֺ Interface to 3rd party software via ActiveX ֺֺ Export images in .bmp or ASCII file format 3.2.4 Beam Analysis Ordering Information Item Description Pyrocam III Beam Profiler Systems PY-III-P-A Pyroelectric array detector, pulsed only, Grade A, two FireWire ports, and basic viewer software. BeamGage Standard included. To complete this order, you must add an Interchangeable Window part number to accompany this system (see below). PY-III-P-B Pyroelectric array detector, pulsed only, Grade B, two FireWire ports, and basic viewer software. BeamGage Standard included. To complete this order, you must add an Interchangeable Window part number to accompany this system (see below). PY-III-C-A Pyroelectric array detector, chopped and pulsed, Grade A, two FireWire ports, and basic viewer software. BeamGage Standard included. To complete this order, you must add an Interchangeable Window part number to accompany this system (see below). PY-III-C-B Pyroelectric array detector, chopped and pulsed, Grade B, two FireWire ports, and basic viewer software. BeamGage Standard included. To complete this order, you must add an Interchangeable Window part number to accompany this system (see below). Interchangeable Windows for Pyrocam III (one included free with the purchase of a Pyrocam III Beam Profiler System) PY-III-W-BK7-1.064 Pyrocam III Window BK7 A/R coated to 1064nm PY-III-W-Si-1.05-2.5 Pyrocam III Window Silicon A/R coated to 1.05 - 2.5µm PY-III-W-Si-2.5-4 Pyrocam III Window Silicon A/R coated to 2.5 - 4µm PY-III-W-Ge-3-5.5 Pyrocam III Window Germanium A/R coated to 3 - 5.5µm PY-III-W-Ge-10.6 Pyrocam III Window Germanium A/R coated to 10.6µm PY-III-W-Ge-8-12 Pyrocam III Window Germanium A/R coated to 8 - 12µm PY-III-W-ZnSe-10.6 Pyrocam III Window Zinc Selenide A/R coated to 10.6µm PY-III-W-ZnSe-2-5 Pyrocam III Window Zinc Selenide A/R coated to 2 - 5µm PY-III-W-Poly-THz Pyrocam III Window Polyethylene uncoated for Tera-Hz wavelengths 154 01.08.2013 For latest updates please visit our website: www.ophiropt.com/photonics P/N SP90090 SP90091 SP90092 SP90093 SP90101 SP90102 SP90103 SP90104 SP90105 SP90106 SP90107 SP90108 SP90208 3.2.4.1 YAG Focal Spot Analyzer ֺֺ ֺֺ ֺֺ ֺֺ ֺֺ ֺֺ ֺֺ ֺֺ ֺֺ ֺֺ Image focal spots down to 25µm in size For laser powers up to 400W (additional external ND filters required) Measure how focal distance shifts with power Can measure systems with focal length as short as 50mm Modular design allows flexibility in use C-mount, compact laser beam sampler/attenuator for camera based laser beam profiling systems High damage threshold optics for measuring energetic sources Produces undistorted sample of laser under test Adjustable attenuation maximizes system dynamic range Up to 1 x 10⁻¹⁰ attenuation available (without external filters) Measure the focal spot of a relatively high power laser, in particular a YAG laser. The average power can be from <1 to 400 Watts and the focal spot can be as small as 25µm. The FSA can also be used to measure how the focal spot shifts with power. The lasers focal length from the lens to the focal spot is usually on the order of 70 to 120mm. The YAG FSA assembly adds a negative lens to the LBS-300 beam splitter assembly to increase the focal path and at the same time enlarge the image. Several focal length lenses are available to accommodate different host system focal paths. The FSA includes; user selectable negative lens, 2 beam splitters, a removable beam block on the 2nd splitter, and user selectable attenuation filters prior to the beam entering the camera. An excel spreadsheet is downloadable from our website that calculates which lenses are available to use for your application, how far to mount the FSA from your focusing lens in order to see the focal spot and what the magnification of the image will be. The FSA is mounted to the camera as shown. Then the assembly is placed below the final focusing lens of the laser at the recommended distance. The focal spot is found by moving the assembly closer and farther from the beam until the smallest spot size is seen. The exact magnification factor (usually 2-3 times) is calculated by moving the stage holding the FSA assembly a given lateral distance and seeing how far the centroid of the focal spot moves in the beam profiling software. This scaling factor is then entered into the software. In order to find focal spot shift with laser power, simply find focal spot at one power, change the power and measure how far the stage has to be moved up or down to get to the smallest beam size again. Incoming Beam Camera Negative lens LBS-300 2nd Output Beam; built-in beam block Focal Spot Assembly Looking from camera mounting position 3.2.4.1 Beam Analysis Operation: 1st Output Beam; either to power meter or to Beam Dump User selectable ND filters for attenuating input to the camera Focal Spot Assembly showing various beam paths 155 For latest updates please visit our website: www.ophiropt.com/photonics 01.08.2013 Examples of Usage 65µm diameter focal spot Focal spot shape changing with laser power level Specifications Model YAG Focal Spot Analyzer Wavelength Wedge Material Wedge Coating Clear aperture Wedge ND value, each ND Filters ND Values, nominal Filter Slides Filter Damage (1) 1064nm BK7 AR ≤1% 17.5mm ND ≥2 Bulk ND 0.3, .7, 1.0, 2.0, 3.0, 4.0 (Red holders) 3 50 W/cm2 1J/cm2, 10ns pulse FSA-50Y -50mm YAG FSA-100Y -100mm YAG FSA-125Y -125mm YAG FSA-150Y -150mm YAG FSA-200Y -200mm YAG 3.2.4.1 Beam Analysis Negative Lens To add FSA capability Accessories Variable Wedge ND Filter kit Beam Dumps WVF-300 BD-040-A, 40 Watts Max Power, Air Cooled BD-500-W, 500 Watts Max Power, Water Cooled Note: (1) ND bulk absorbing filters damage threshold is 50W/cm2 but should be used at <5W/cm2 to avoid thermal lensing effects. Ordering Information Item Description YAG Focal Spot Analyzer YAG Focal Spot Analyzer assembly requires 1 each LBS-300-NIR and 1 each Negative Lens LBS-300-NIR Beam splitter and attenuators; beam split 2 times FSA-50Y Negative lens; -50 mm YAG FSA-100Y Negative lens; -100 mm YAG FSA-125Y Negative lens; -125 mm YAG FSA-150Y Negative lens; -150 mm YAG FSA-200Y Negative lens; -200 mm YAG Accessories WVF-300 ND filters; variable wedge. Replaces fixed value filter slides BD-040-A Beam Dump; 40 Watts max. power, air cooled BD-500-W Beam Dump; 500 Watts max. power, water cooled 156 01.08.2013 For latest updates please visit our website: www.ophiropt.com/photonics P/N SP90185 SP90187 SP90188 SP90189 SP90190 SP90191 SP90195 SP90192 SP90193 3.3 Introduction to Scanning-Slit Profilers The scanning slit beam profiler moves two narrow orthogonal slits in front of a linear photo-detector through the beam under analysis. Light passing through the slit induces a current in the detector. Thus, as the slit scans through the beam, the detector signal is linearly proportional to the spatial beam irradiance profile integrated along the slit. A digital encoder provides accurate slit position. The photo-induced current signal is digitized and analyzed to obtain the beam profile in both X and Y from the two orthogonal slits. The slit apertures act as physical attenuators, preventing detector saturation for most beam applications. High dynamic range amplification allows operation over many orders of magnitude in beam power. From these profiles, important spatial information such as beam width, beam position, beam quality, and other characteristics are determined. This technique can accommodate a wide variety of test conditions. Because slit scanners measure beams at high powers with little or no attenuation, they are ideal to profile beams used in material processing. 3.3 Beam Analysis Carbon dioxide (CO2) lasers are widely used in materials processing, and have a 10.6 micron wavelength that cannot be profiled with most cameras. Slit scanners, therefore, provide an convenient means of measuring high-resolution CO2 lasers with powers up to and exceeding 1000 watts. 157 For latest updates please visit our website: www.ophiropt.com/photonics 01.08.2013 3.3.1 NanoScan 2 Scanning Slit Beam Profiler For High Accuracy Dimensional Measurementt NanoScan 2 now features direct USB2 connection to the PC and is available to measure CW and pulsed beams across the spectral range from UV to infrared up to 1800nm. Coupled with the new NanoScan 2 software package that allows configuration of the user interface displays, the Photon NanoScan 2 scanning slit profilers provide major enhancements to the ease-of-use and flexibility that customers have come to expect with its predecessors, the world-renowned NanoScan and BeamScan. Capabilities NanoScan 2 is a PC-based instrument for the measurement and analysis of optical beam spatial profiles in accordance with ISO standards. Beam profiles are measured using the International Standard ISO 11146. Scanheads can also measure power in accordance with ISO 13694. The NanoScan2 digital controller has 16-bit digitization of the signal for enhanced dynamic range up to 35dBpower optical. With the accuracy and stability of the beam profile measurement you can measure beam size and beam pointing with a 3-sigma precision of several hundred nanometers. The software controllable scan speed and a “peak-connect” algorithm allows the measurement of pulsed and pulse width modulated lasers with frequencies of 20kHz and higher*. The ability to alter the drum speed also helps to increase the dynamic range allowing a much larger operating space for any given scan head (see operating space charts for a graphic explanation). Benefits ֺֺ ֺֺ ֺֺ ֺֺ ֺֺ ֺֺ ֺֺ ֺֺ ֺֺ ֺֺ ֺֺ ֺֺ All NanoScan systems are calibrated to a NIST traceable source to ensure the ultimate in accuracy. The software finds a beam in less than 0.3 seconds and displays real-time updates up to 20Hz. The Z-axis datum plane of the NanoScan is known to ±25μm making the locating of beam waist position simple and accurate. Along with the ability to measure pulsed beam diameters, the NanoScan accurately measures and reports the pulse frequency of the laser, ensuring that the pulsed beam measurements are stable and accurate. 3.0 Beam Analysis NanoScan uses moving slits, one of the ISO Standard scanning aperture techniques. Measurement is possible for beam sizes from microns to centimeters at beam powers from microwatts to over kilowatts, often without attenuation. Detector options (silicon or germanium) allow measurement at wavelengths from the ultraviolet to the infrared. The sampling interval for beam measurements is adjustable to as little as 5.7nm, providing the extreme accuracy required to measure very small beams. Profile averaging and rolling averages are available to improve signal to noise. NanoScan software has built-in capability to control a mechanical linear stage for measurement of beam caustic. Software has a built-in M2 Wizard to assist in making manual propagation ratio measurements. Time charts allow any beam result to be charted over time. Results logging to text files. Relative power meter measurements. Optional ActiveX Automation commands with samples of automation programs for Excel VBA, LabView and Visual Basic.net. *The minimum frequency is a function of the beam size and the scan speed. This is a simple arithmetic relationship; there must be a sufficient number of pulses during the time that the slits sweep through the beam to generate a meaningful profile. Please refer to Photon’s Application Note, Measuring Pulsed Beams with a Slit-Based Profiler. 157-A For latest updates please visit our website: www.ophiropt.com/photonics 01.08.2013 New Configurable User Interface In addition to new hardware, the NanoScan2 has an updated integrated software package for the Microsoft Windows Platform, which allows the user to display any results windows on one screen. The software can select up to 16 regions-of-interest to allow the simultaneous measurement of up to 16 individual beams. The NanoScan 2 software comes in two versions, STD and PRO. The NanoScan 2 pro version of the software includes ActiveX automation for users who want to integrate the NanoScan into OEM systems or write their own user interface screens. The NanoScan into OEM systems or write their own u ser interface screens. File Menu Quick Access Toolbar Panel Title Bar Ribbon Bar 3.0 Beam Analysis Ribbon Tabs Results Window User Notes Status Bar Primary Dock Window (note tabs) 157-B 01.08.2013 For latest updates please visit our website: www.ophiropt.com/photonics Standard Windows Controls Integrated Power Meter The silicon and germanium NanoScan2 systems now come with an integrated 200mW power meter. The relative power meter provides 1.5% correspondence to a usersupplied measurement when configured in the same geometry as calibrated. It comes with a quartz attenuator window that provides a uniform response across a broad wavelength range. % of power within the aperture integrated power measurement calibrated with customer power sensor The power meter screen in the software shows both the total power and the individual power in each of the beams being measured. Available Detectors The NanoScan 2 is available with either silicon or germanium to cover the light spectrum from UV to infrared. The scan heads are available in several sizes, apertures and slit dimensions. See the table for available configurations. NanoScan Scanhead Model Si/3.5/1.8µm Si/9/5µm Si/9/25µm Wavelength Detector Entrance Aperture Slit Size 1/e² Beam Diameter Range1 Spatial Sampling Resolution Profile Digitization Scan Frequency Power Aperture Power Aperture OD Laser Type Operating Range 190nm - 950nm Silicon 3.5mm 1.8µm 7µm – ~2.3mm 5.3nm – 18.3µm 16 bit 1.25, 2.5, 5, 10, 20Hz User calibrated Metallized Quartz (200mW) CW or Pulsed2 See Operating Space Chart in Appendix C of User’s Manual see Operating Space Chart in Appendix C of User’s Manual Standard – see drawing in Appendix B of User’s Manual See Mechanical Drawing in Appendix of User’s Manual 190nm - 950nm Silicon 9mm 5µm 20µm – ~6mm 5.3nm – 18.3µm 16 bit 1.25, 2.5, 5, 10, 20Hz User calibrated Metallized Quartz (200mW) CW or Pulsed2 See Operating Space Chart in Appendix C of User’s Manual See Operating Space Chart in Appendix C of User’s Manual Standard – see drawing in Appendix B of User’s Manual See Mechanical Drawing in Appendix B of User’s Manual 190nm - 950nm Silicon 9mm 25µm 100µm – ~6mm 5.3nm – 18.3µm 16 bit 1.25, 2.5, 5, 10, 20Hz User calibrated Metallized Quartz (200mW) CW or Pulsed2 See Operating Space Chart in Appendix C of User’s Manual See Operating Space Chart in Appendix C of User’s Manual Standard – see drawing in Appendix B of User’s Manual See Mechanical Drawing in Appendix B of User’s Manual Damage Threshold Rotation Mount Scanhead Dimension 1. Assumes Gaussian (TEM00) Beam 2. Pulsed Operation Limited to Beam Diameter >≥100µm and pulse repetition rate ≥5kHz. NanoScan Scanhead Model Wavelength Detector Entrance Aperture Slit Size 1/e² Beam Diameter Range1 Spatial Sampling Resolution Profile Digitization Scan Frequency Power Aperture Power Aperture OD Laser Type Operating Range Damage Threshold Rotation Mount Scanhead Dimension Ge/3.5/1.8µm Ge/9/5µm Ge/9/25µm 700nm - 1800nm Germanium 3.5mm 1.8µm 4µm – ~2.3mm 5.3nm – 18.3µm 16 bit 1.25, 2.5, 5, 10, 20Hz User calibrated Metallized Quartz (200mW) CW or Pulsed2 See Operating Space Chart in Appendix C of User’s Manual see Operating Space Chart in Appendix C of User’s Manual Standard – see drawing in Appendix B of User’s Manual See Mechanical Drawing in Appendix B of User’s Manual 700nm - 1800nm Germanium 9mm 5µm 20µm – ~6mm 5.3nm – 18.3µm 16 bit 1.25, 2.5, 5, 10, 20Hz User calibrated Metallized Quartz (200mW) CW or Pulsed2 See Operating Space Chart in Appendix C of User’s Manual see Operating Space Chart in Appendix C of User’s Manual Standard – see drawing in Appendix B of User’s Manual See Mechanical Drawing in Appendix B of User’s Manual 700nm - 1800nm Germanium 9mm 25µm 100µm – ~6mm 5.3nm – 18.3µm 16 bit 1.25, 2.5, 5, 10, 20Hz User calibrated Metallized Quartz (200mW) CW or Pulsed2 See Operating Space Chart in Appendix C of User’s Manual see Operating Space Chart in Appendix C of User’s Manual Standard – see drawing in Appendix B of User’s Manual See Mechanical Drawing in Appendix B of User’s Manual 1. Assumes Gaussian (TEM00) Beam 2. Pulsed Operation Limited to Beam Diameter >≥100µm and pulse repetition rate ≥5kHz. 157-C For latest updates please visit our website: www.ophiropt.com/photonics 01.08.2013 The Most Versatile and Flexible Beam Profiling System Available Photon’s NanoScan scanning slit profilers provide major performance enhancements while maintaining the ease-of-use and flexibility that customers have come to expect with its predecessor, the world-renowned BeamScan. NanoScan 2 scanheads are available to measure CW and pulsed beams across the entire spectral range from UV to infrared. See Your Beam As Never Before The Graphical User Interface (GUI) of NanoScan is new. Dockable and floatable windows plus concealable ribbon tool bars empower the NanoScan user to make the most of a small laptop display or a large, multi-monitor desktop PC. Simple docked view Both docked and undocked windows 3.0 Beam Analysis Measured Beam Results From 1989 through 1996, John Fleischer, past President of Photon Inc., chaired the working laser beam width ISO/DIN committee that resulted in the ISO/DIN 11146 standard. The final approved standard, available in 13 languages. The standard governs profile measurements and analysis using scanning apertures, variable apertures, area sensors and detector arrays. NanoScan measures spatial beam irradiance profiles using scanning slit techniques. The standard NanoScan uses the moving-slit method, approved by International Standard ISO/DIN 11146.. Results measured include: ֺֺ ֺֺ ֺֺ ֺֺ ֺֺ ֺֺ ֺֺ ֺֺ ֺֺ ֺֺ ֺֺ ֺֺ Beam Width at various clip levels Example of the many measurements that can be made and the precision you can expect Centroid Position Peak Position Ellipticity 1D Gaussian Fit Beam Divergence Beam Separation Pointing Stability ROI Power (optional) Total Power (optional) Peak (in digitizer counts) Pulsed Laser Repetition Rate Knowing pointing stability is a critical factor in laser performance 157-D 01.08.2013 For latest updates please visit our website: www.ophiropt.com/photonics Optional Automation Interface The Pro model scanheads implement an Automation Server that can be used by an Automation Client written in Visual Basic for Applications (VBA), C/C++ or by an application with support for ActiveX Automation, such as Microsoft Excel, Microsoft Word or National Instruments’ LabVIEW. NanoScan Acquisition and Analysis Software *Feature NanoScan Standard NanoScan Professional (all features in Standard plus) Controls Source Capture Regions of Interest (ROI) Profiles Computation: ISO 13694, ISO 11146 2D/3D Charts Logging M² Views Profiles Results Pointing Charts 2D/3D M² Wizard Continuous, Rolling, Finite Centroid or Peak, Accumulate Mode, Beam Indicator, Graph Center, Colors 2D or 3D Mode, Linear or Logarithmic Scale, Resolution, Fill Contours, Solid Surface, or Wireframe, Clip Level Colors Chart Select, Parameter Select, Aperture Select, Update Rate, Start and Clear File Path/Name, Delimiter, Update Rate Rail Setup: Com Port and Length, Connect/Disconnect, Rail Control Displays Beam Profiles for each axis, with optional Gaussian Overlays Displays Values and Statistics for Selected results Displays the XY position of the Centroid or Peak for each ROI , with optional overlays and Accumulate Mode Displays Time Charts for User-selected results Displays pseudo 2D/3D Beam Profile An interactive procedure for measuring M2 by the Rayleigh Method File Saving NanoScan Data Files Text Files Data Logging Log to File Reports NanoScan Report Automation Interface ActiveX Automation Server Minimum System Requirements PC computer running windows 7 (32/64) Laptop or Desktop1 A dual core processor CPU, 2GHz or better 2GB of RAM² 1-USB 2.0 port available At least 250MB of free HDD space 1400 x 900 display resolution or better Graphics card w/hardware accelerator DVD-ROM drive Microsoft compatible pointing devices(e.g., mouse, trackball, etc) 3.0 Beam Analysis Pointing ScanHead Select, Gain, Filter, Sampling Resolution, AutoFind, Rotation Frequency, Record Mode Averaging, Rotation, Magnification, CW or Pulse Modes, Divergence, Gaussian Fit, Reference Position, Recompute Single or Multiple, Automatic or Manual, Colors Vertical Scale (1´, 10´, 100´), Logarithmic Scale, Z & PAN (Automatic or Manual) Dslit, (13.5%, 50% 2 User Selectable Clip Levels), D4Ó, Width ratios, Centroid Position, Peak Position, Centroid Separation, Peak Separation, Irradiance, Gaussian Fit, Ellipticity, Divergence, Total Power, Pulse Frequency, % power *Download the NanoScan Acquisition and Analysis Software Manual for a complete description of all Software Features 1. A business/professional version of windows is recommended. The NanoScan v2 software has not been tested with home versions of Windows. Both 64-bit and 32-bit versions of Windows 7 are supported. NanoScan v2 is no longer tested on Windows XP 32-bit operating systems. 2. The computer memory (RAM) will affect the performance of the software in the Data Recorder. 157-E For latest updates please visit our website: www.ophiropt.com/photonics 01.08.2013 Specifications Model YAG Focal Spot Analyzer Bus interface Signal digitization Maximum digitization clock Maximum update rate Data transfer On-board memory Weight Operating temperature Humidity Scanhead Dimensions Power CPU Clock Memory Clock Scanning Motor USB 2.0 16bit 20MHz 20Hz Bulk Transfer Mode 64MB mDDR SDRAM 434g (15.3 ounces) 0…50oC 90%, non-condensing 3.85”(9.78cm) L X 2.5”(6.35cm) Ø USB 2.0 Bus Powered 300MHz 264MHz Brushed DC, 4W max Mechanical Dimensions 3.0 Beam Analysis NanoScan2 Standard Scanhead: NS2-Si and NS2-Ge 157-F 01.08.2013 For latest updates please visit our website: www.ophiropt.com/photonics Typical NanoScan Operating Space Charts Silicon Detector Silicon Detector: Responsivity varies with wavelength. Detects between 190-950nm. Peak responsivity is 0.4 amps/watt at 850nm. Detector to detector responsivity variation can be as great as ±20%. Power: Power in the measured laser beam. Assumes a round beam diameter. An elliptic beam can be approximated by using the maximum width dimension and assuming all the energy is in a beam of this diameter. For extremely elliptic beams (ratio >4:1)/ contact the factory. Pulsed Operation ( ): Upper limit of the operating space for pulsed laser measurements. Black Coating Removed ( pyrodetectors are not blackened. 3.0 Beam Analysis Operating Range is at Peak Sensitivity of Detector. Operating Space is NOT absolute. THESE CHARTS TO BE USED AS A GUIDE ONLY. ): Slits are blackened to reduce back reflections; blackening begins to vaporize near this line. Slits in Slit Damage ( ): Power density (watts/cm2) where one can begin to cut the slits. Refer to Photon’s Damage Threshold with High Power Laser Measurements document. Left Boundary: Smallest beam size limited to 4-5 times the slit width. Some models have another limit due to electrical bandwidth. Right Boundary: Instrument entrance aperture. The largest beam width (1/e2) will be the aperture divided by 1.2-1.4. 157-G For latest updates please visit our website: www.ophiropt.com/photonics 01.08.2013 3.0 Beam Analysis Germanium Detector Responsivity: Detector conversion constant, incident photons to a current. Detector: Responsivity varies with wavelength. Detects between 700-1800nm. Peak responsivity is 0.7 amps/watt at 1550nm. Detector to detector responsivity variation can be as great as ±20%. Power: Power in the measured laser beam. Assumes a round beam diameter. An elliptic beam can be approximated by using the maximum width dimension and assuming all the energy is in a beam of this diameter. For extremely elliptic beams (ratio >4:1) contact the factory. Beam Diameter: Circular laser spot being measured by a narrow slit. Clip level method. Pulsed Operation ( ): Upper limit of the operating space for pulsed laser measurements. Black Coating Removed ( detectors are not blackened. ): Slits are blackened to reduce back reflections; blackening begins to vaporize near this line. Slits in pyro ): Power density (watts/cm2) where one can begin to cut the slits. Refer to Photon’s Aperture Damage due to High Slit Damage ( Incident Power document. Left Boundary: Smallest beam size limited to 4-5 times the slit width. Some models have another limit due to electrical bandwidth. Right Boundary: Instrument entrance aperture. The largest beam width (1/e2) will be the aperture divided by 1.2-1.4. 157-H 01.08.2013 For latest updates please visit our website: www.ophiropt.com/photonics NanoScan Options and Accessories NS2-Si/9/5-STD NS2-Si/9/25-STD NS2-Ge/3.5/1.8-STD NS2-Ge/9/5-STD NS2-Ge/9/25-STD NS2-Si/3.5/1.8-PRO NS2-Si/9/5-PRO NS2-Si/9/25-PRO NS2-Ge/3.5/1.8-PRO NS2-Ge/9/5-PRO NS2-Ge/9/25-PRO Description NanoScan2 Silicon Detector 3.5mm aperture 1.8micron slits. High-resolution head featuring Silicon detector, 63.5mm diameter head with rotation mount, 3.5mm entrance aperture, and matched pair of 1.8micron wide slits. Use from 190nm to wavelengths <1micron. Not for 1.06micron wavelength. NanoScan2 Si Detector 9mm aperture 5micron slits. High-resolution head featuring Si detector, 63.5mm diameter head with rotation mount, 9mm entrance aperture, and matched pair of 5 micron wide slits. Use from 190nm to wavelengths <1micron. Not for 1.06micron wavelength. NanoScan2 Si Detector 9mm aperture 25micron slits. High-resolution head featuring Si detector, 63.5mm diameter head with rotation mount, 9mm entrance aperture, and matched pair of 25 micron wide slits. Use from 190nm to wavelengths <1micron. Not for 1.06micron wavelength. NanoScan2 Ge Detector 3.5mm aperture 1.8micron slits. High-resolution head featuring Germanium detector, 63.5mm diameter head with rotation mount, 3.5mm entrance aperture, and matched pair of 1.8 micron wide slits. Use from 700nm to 1.8micron wavelength. NanoScan2 Ge Detector 9mm Aperture 5.0micron slits. High-resolution head featuring Germanium detector, 63.5mm diameter head with rotation mount, 9mm entrance aperture, and matched pair of 5 micron wide slits. Use from 700nm to 1.8micron wavelength. NanoScan2 Ge Detector 9mm Aperture 25 micron slits. High-resolution head featuring Germanium detector, 63.5mm diameter head with rotation mount, 9mm entrance aperture, and matched pair of 25 micron wide slits. Use from 700nm to 1.8micron wavelength. Software includes ActiveX automation feature. NanoScan2 Silicon Detector 3.5mm aperture 1.8micron slits. High-resolution head featuring Silicon detector, 63.5mm diameter head with rotation mount, 3.5mm entrance aperture, and matched pair of 1.8 micron wide slits. Use from 190nm to wavelengths <1micron. Not for 1.06micron wavelength. Software includes ActiveX automation feature. NanoScan2 Si Detector 9mm aperture 5micron slits. High-resolution head featuring Si detector, 63.5mm diameter head with rotation mount, 9mm entrance aperture, and matched pair of 5 micron wide slits. Use from 190nm to wavelengths <1micron. Not for 1.06micron wavelength. Software includes ActiveX automation feature. NanoScan2 Si Detector 9mm aperture 25micron slits. High-resolution head featuring Si detector, 63.5mm diameter head with rotation mount, 9mm entrance aperture, and matched pair of 25 micron wide slits. Use from 190nm to wavelengths <1micron. Not for 1.06micron wavelength. P/N PH00421 PH00422 PH00423 PH00424 PH00425 PH00426 PH00429 PH00430 PH00431 PH00432 PH00433 PH00434 3.0 Beam Analysis Item NS2-SI/3.5/1.8-STD 157-I For latest updates please visit our website: www.ophiropt.com/photonics 01.08.2013 3.3.1 NanoScanTM Scanning Slit Beam Profiler For High Accuracy Dimensional Measurement NanoScan is a PC-based instrument for the measurement and analysis of optical beam spatial profiles in accordance with ISO standards. Beam profiles are measured using the International Standard ISO 11146. Scanheads that are fitted with an optional power feature can measure power in accordance with ISO 13694. The system comprises a scanhead for sensing the laser beam, a USB 2.0 controller, and NanoScan software. An optional automation feature includes an ActiveX automation server. NanoScan uses moving slits, one of the ISO Standard scanning aperture techniques. Measurement is possible for beam sizes from microns to centimeters at beam powers from microwatts to over kilowatts, often without attenuation. Detector options (silicon, germanium, and pyroelectric technologies) allow measurement at wavelengths from the ultraviolet to the far infrared. It can simultaneously measure multiple beams and offers an optional power meter for scanheads with silicon and germanium detectors. Profiles are acquired with 12-bit digitization, and analyzed for real-time updates up to the maximum scanhead scan rate of 20Hz. With NanoScan, beam profile measurement is extremely easy: simply position the scanhead in the beam path and within seconds the system does the rest. 3.3.1 Beam Analysis Benefits ֺֺ ֺֺ ֺֺ ֺֺ ֺֺ ֺֺ ֺֺ ֺֺ ֺֺ ֺֺ ֺֺ ֺֺ All NanoScan systems are calibrated to a NIST traceable source to ensure the ultimate in accuracy. The software finds a beam in less than 0.3 seconds and displays real-time updates up to 20Hz. The Z-axis datum plane of the NanoScan is known to ±25μm making the locating of beam waist position simple and accurate. Along with the ability to measure pulsed beam diameters, the NanoScan accurately measures and reports the pulse frequency of the laser, ensuring that the pulsed beam measurements are stable and accurate. The sampling interval for beam measurements is adjustable to as little as 5.7nm, providing the extreme accuracy required to measure very small beams. Profile averaging and rolling averages are available to improve signal to noise. NanoScan software has built-in capability to control a mechanical linear stage for measurement of beam caustic. Software has a built-in M² Wizard to assist in making manual propagation ratio measurements. Time charts allow any beam result to be charted over time. Results logging to text files. Optional ActiveX Automation commands with samples of automation programs for Excel VBA, LabView and Visual Basic.net. Optional power meter with silicon and germanium scanhead. Measure Your Beam as Never Before The system has a USB 2.0 interface and operates with the latest Microsoft operating systems 64/32bit Windows 7, and provides deep, 12-bit digitization of the signal for enhanced dynamic range up to 35dB optical power. The digital controller improves the accuracy and stability of the beam profile measurement by orders of magnitude. It is now possible to measure beam size and beam pointing with a 3-sigma precision of 1µm or better. The software controllable scan speed and a “peak-connect” algorithm allow the measurement of pulsed and pulse width modulated lasers with frequencies of a few kHz and higher with any detector.* NanoScan Option NSEC: Side exit cable *The minimum frequency is a function of the beam size and the scan speed. This is a simple arithmetic relationship; there must be a sufficient number of pulses during the time that the slits sweep through the beam to generate a meaningful profile. Please refer to Photon’s Application Note, Measuring Pulsed Beams with a Slit-Based Profiler. 158 01.08.2013 For latest updates please visit our website: www.ophiropt.com/photonics NanoScan Main Display Screen Quick Access Toolbar Panel Title Bar Ribbon Bar Ribbon Tabs Results Window User Notes Status Bar Standard Windows Controls Primary Dock Window (note tabs) The Most Versatile and Flexible Beam Profiling System Available Photon’s NanoScan scanning slit profilers provide major p erformance enhancements while maintaining the ease-of-use and flexibility that customers have come to expect with its predecessor, the world-renowned BeamScan. NanoScan scanheads are available to measure CW and pulsed beams across the entire spectral range from UV to far infrared. 3.3.1 Beam Analysis File Menu 159 For latest updates please visit our website: www.ophiropt.com/photonics 01.08.2013 See Your Beam As Never Before The Graphical User Interface (GUI) of NanoScan is new. Dockable and floatable windows plus concealable ribbon tool bars empower the NanoScan user to make the most of a small laptop display or a large, multi-monitor desktop PC. Simple docked view Both docked and undocked windows 3.3.1 Beam Analysis Measured Beam Results From 1989 through 1996, John Fleischer, past President of Photon Inc., chaired the working laser beam width ISO/DIN committee that resulted in the ISO/DIN 11146 standard. The final approved standard, available in 13 languages, is a compromise based on many years of work by the committee. The standard governs profile measurements and analysis using scanning apertures, variable apertures, area sensors and detector arrays. NanoScan measures spatial beam irradiance profiles using scanning slit techniques. The standard NanoScan uses the moving-slit method, approved by International Standard ISO/DIN 11146. Results measured include: ֺֺ ֺֺ ֺֺ ֺֺ ֺֺ ֺֺ ֺֺ ֺֺ ֺֺ ֺֺ ֺֺ ֺֺ Beam Width at various clip levels Example of the many measurements that can be made and the precision you can expect Centroid Position Peak Position Ellipticity 1D Gaussian Fit Beam Divergence Beam Separation Pointing Stability ROI Power (optional) Total Power (optional) Peak (in digitizer counts) Pulsed Laser Repetition Rate Knowing pointing stability is a critical factor in laser performance 160 01.08.2013 For latest updates please visit our website: www.ophiropt.com/photonics Multiple Beam Analysis Software The NanoScan software is an integrated package for Microsoft Windows operating systems, it can measure from one to 16 beams in the NanoScan aperture, all with sub-micron precision. The optimal-pro software includes ActiveX automation for users who want to integrate the NanoScan into OEM systems or write their own u ser interface screens. M² Wizard M-squared (M²) software Wizard is an interactive program for determining the “times diffraction limit” factor M² by the Rayleigh Method. The M² Wizard prompts and guides the user through a series of manual measurements and data entries required for calculating M². The Optional Rayleigh Range Translation Test Fixture (RAL-FXT) provides convenient translation of a NanoScan scanhead assembly and a digital readout of its relative position along the Z-axis. Used with a user-provided focusing lens and the M² Wizard in the NanoScan Analysis Software, this fixture offers a quick and easy method to determine the times-diffraction propagation factor (M²) of a laser. The optional Translation Test Fixture makes manual M2 measurements accurate and repeatable The RAL-FXT features a base plate, sliding carriage and digital micrometer. The base plate (5.4×10.2×0.38in.) provides a series of ¼-20 threaded mounting holes at 2in. centers to facilitate convenient fixturing of the assembly with respect to the focusing lens. The sliding carriage accommodates the combination of the 0.125-in. dowel pin and the ¼-20 mounting hole found on any Photon scan head’s rotation mount, and enables smooth movement of the scan head assembly over a 6-in. range of travel. A Mitutoyo micrometer with a handy re-zeroing feature and accompanying slide provides precise determination of the scan head location and/or travel distance with a resolution of tens of microns. Pulsed Laser Beam Profiling In addition to profiling CW laser beams, NanoScan can also profile pulsed laser beams with repetition rate in the 1kHz range and above. To enable the measurement of these pulsed lasers, the NanoScan profiler incorporates a “peak connect” algorithm and software-controlled variable scan speed on all scanheads. The accuracy of the measurement generally depends on the laser beam spot size and the pulse-topulse repeatability of the laser. The NanoScan is ideal for measuring Q-switched lasers and lasers operating with pulse width modulation power (PWM) control. In the past few years, lasers with pico- and femtosecond pulse durations have begun to be used in many applications. Although these lasers add some additional complication to the measurement techniques, the NanoScan can also measure this class of laser. Optional Power Meter The silicon and germanium NanoScan systems offer the 200mW power meter as an option. The power meter can be calibrated against the user’s ISO- or NIST- traceable power meter. The 200mW power meter has a quartz attenuator w indow that provides a uniform response across a broad wavelength range with a 1.5% accuracy when used in the same geometry as calibrated. 3.3.1 Beam Analysis For automated and automatic M² measurements the NanoModeScan option is required. The power meter screen in the software shows both the total power and the individual power in each of the beams being measured. The power meter option is not available with pyroelectric detectors. 161 For latest updates please visit our website: www.ophiropt.com/photonics 01.08.2013 Optional Automation Interface The Pro model scanheads implement an Automation Server that can be used by an Automation Client written in Visual Basic for Applications (VBA), C/C++ or by an application with support for ActiveX Automation, such as Microsoft Excel, Microsoft Word or National Instruments’ LabVIEW. 3.3.1 Beam Analysis Optional Collimation Fixture A single beam size measurement using a Collimation Fixture is all that is required to determine laser beam collimation or divergence angle. Real-time optical alignment can then be performed to determine best collimation. No special training is needed to perform these simple measurements. Unlike with most measurement shortcuts, high-precision collimation measurements can be performed with exceedingly high resolution, higher than alternative techniques. All that is required for these accurate measurements of collimation is a test lens and a NanoScan. The laser beam profiler is positioned such that it measures beam size at the geometric focus of the lens. From lens theory, the angle of collimation is determined by the equation: q = Df / f, where q is the angle of collimation, Df is the beam size measured at the focal length, and f is the focal length of the lens. Once the beam size is measured at the focal length of the lens, simply dividing this measured beam size by the divergence angle determines the laser beam collimation angle. The beam profiler remains fixed, and active alignment is easily performed in real time. This level of simplicity, speed, and functionality is simply not possible with techniques involving multiple beam profile positions. Full featured application examples are included to help your learning curve when embedding NanoScan - PRO into an automation application Divergence/Collimation test fixtures based on a high quality test lens to focus your collimated or diverging beam. Fixtures require a complete NanoScan System. COL-FXT 250 Nominal 250mm focal length lens. Includes an enclosure to block stray light COL-FXT 250 TEL Nominal 250mm focal length lens. For wavelengths of use at 1310 or 1550nm with lens repositioning. Includes an enclosure to block stray light COL-FXT 500 MIR For wavelengths of use at 3–5µm. COL-FXT C02 Zinc selenide (ZnSe) lens with a focal length of 190.5mm. For wavelength of use at 10.6m. Includes an enclosure that holds an adjustable entrance iris. Requires a Pyro NanoScan System. 162 01.08.2013 For latest updates please visit our website: www.ophiropt.com/photonics NanoScan Configurations Detector Type Power Range Wavelength Aperture Slits Scanhead Size Silicon ~100nW-~100mW 190nm-950nm 25mm 25µm 100mm Germanium ~1µW-~100mW 700nm-1800nm 12mm 25µm 100mm Pyroelectric 100mW-100W 200nm- >2.0µm 9mm 5µm 63mm 25mm 20mm 25µm 100mm The power that can be handled by the NanoScan is dependent on the wavelength of the light to be measured. The wavelength of light determines both its reflectivity from the slit surfaces and the energetic nature of the interactions with materials. As a rule of thumb, there are three basic wavelength regimes that govern how much power the scanhead can handle: ֺֺ ֺֺ ֺֺ 3μm to FIR (>20μm) –100W maximum pyroelectric detector 700nm to 3μm—25W maximum pyroelectric detector; 1W germanium detector 3.3.1 Beam Analysis 190nm to 700nm—3W maximum pyroelectric detector; 1W silicon detector Power levels above these for any of these wavelengths can be considered “High Power.” See the High Power NanoScan section for appropriate products. Consult the damage thresholds charts found in the manual before placing an order or exposing any NanoScan slit profiler to a laser beam. 163 For latest updates please visit our website: www.ophiropt.com/photonics 01.08.2013 NanoScan Acquisition and Analysis Software *Feature NanoScan Standard NanoScan Professional (all features in Standard plus) Controls Source Capture Regions of Interest (ROI) Profiles Computation: ISO 13694, ISO 11146 Pointing 2D/3D Charts Logging M² Views Profiles Results Pointing 3.3.1 Beam Analysis Charts 2D/3D M² Wizard ScanHead Select, Gain, Filter, Sampling Resolution, AutoFind, Rotation Frequency, Record Mode Averaging, Rotation, Magnification, CW or Pulse Modes, Divergence, Gaussian Fit, Reference Position, Recompute Single or Multiple, Automatic or Manual, Colors Vertical Scale (1´, 10´, 100´), Logarithmic Scale, Z & PAN (Automatic or Manual) Dslit, (13.5%, 50% 2 User Selectable Clip Levels), D4Ó, Width ratios, Centroid Position, Peak Position, Centroid Separation, Peak Separation, Irradiance, Gaussian Fit, Ellipticity, Divergence, Total Power, Pulse Frequency, % power Continuous, Rolling, Finite Centroid or Peak, Accumulate Mode, Beam Indicator, Graph Center, Colors 2D or 3D Mode, Linear or Logarithmic Scale, Resolution, Fill Contours, Solid Surface, or Wireframe, Clip Level Colors Chart Select, Parameter Select, Aperture Select, Update Rate, Start and Clear File Path/Name, Delimiter, Update Rate Rail Setup: Com Port and Length, Connect/Disconnect, Rail Control Displays Beam Profiles for each axis, with optional Gaussian Overlays Displays Values and Statistics for Selected results Displays the XY position of the Centroid or Peak for each ROI , with optional overlays and Accumulate Mode Displays Time Charts for User-selected results Displays pseudo 2D/3D Beam Profile An interactive procedure for measuring M2 by the Rayleigh Method File Saving NanoScan Data Files Text Files Data Logging Log to File Reports NanoScan Report Automation Interface ActiveX Automation Server Minimum System Requirements PC computer running windows7 (32/64) Laptop or Desktop Core CPU 2GHz or better 3GB of RAM or better 1 USB 2.0 port At least 250MB free HDD space 1440x900 Display Resolution or greater Add-in PCI/PCI-Express graphics card w/hardware acceleration DVD-ROM drive *Download the NanoScan Acquisition and Analysis Software Manual for a complete description of all Software Features 164 01.08.2013 For latest updates please visit our website: www.ophiropt.com/photonics Ordering Information - NanoScan Systems Both -STD & -PRO NanoScan Systems Include: NanoScan v2 Integrated Software package for use with NanoScan scanheads under Microsoft Windows operating systems. ActiveX automation is provided in -PRO models. Certificate of Calibration. Beam width is traceable to National Institute of Standards and Technology (NIST) to better than ±2% (NanoScan Pyroelectric detectors calibration to better than ±3%). USB NS-Si/25/25-PRO USB NS-Ge/12/25-STD USB NS-Ge/12/25-PRO USB NS-PYRO/9/5-STD USB NS-PYRO/9/5-PRO USB NS-PYRO/9/25-STD USB NS-PYRO/9/25-PRO USB NS-PYRO/20/25-STD USB NS-PYRO/20/25-PRO NS-USB NH NS-Si/25/25-STD NH NS-Si/25/25-PRO NH NS-Ge/12/25-STD NH NS-Ge/12/25-PRO NH-PYRO/9/5-STD NH-PYRO/9/5-PRO NH-PYRO/9/25-STD NH-PYRO/9/25-PRO NH-PYRO/20/25-STD NH-PYRO/20/25-PRO Software Upgrades NSv2 STD to NSv2 PRO Upgrade NSv1 to NSv2 STD Upgrade NSv1 to NSv2 PRO Upgrade Legacy Software Description P/N NanoScan Si Detector 25mm aperture 25micron slits. High-resolution head featuring Si detector, 100mm PH00390 diameter head with rotation mount, 25mm entrance aperture, and matched pair of 25.0micron wide slits. Use from 190nm to wavelengths <1micron. Not for 1.06micron wavelength. USB Software includes automation feature. PH00019 NanoScan Si Detector 25mm aperture 25micron slits. High-resolution head featuring Si detector, 100mm diameter head with rotation mount, 25mm entrance aperture, and matched pair of 25.0micron wide slits. Use from 190nm to wavelengths <1micron. Not for 1.06micron wavelength. USB NanoScan Ge Detector 12.5mm Aperture 25micron slits. High-resolution head featuring Germanium PH00395 detector, 100mm diameter head with rotation mount, 12.5mm entrance aperture, and matched pair of 25micron wide slits. USB Software includes automation feature. PH00024 NanoScan Ge Detector 12.5mm Aperture 25micron slits. High-resolution head featuring Germanium detector, 100mm diameter head with rotation mount, 12.5mm entrance aperture, and matched pair of 25micron wide slits. USB NanoScan Pyroelectric Detector 9mm aperture 5micron slits. High-resolution head featuring pyroelectric detector, 63.5mm diameter head with rotation mount, 9mm entrance aperture, and matched pair of 5µm wide slits. Use for wavelengths from 190nm to >20µm. This model does not include a cooling fan. USB Software includes automation feature. PH00396 PH00025 NanoScan Pyroelectric Detector 9mm aperture 5micron slits. High-resolution head featuring pyroelectric detector, 63.5mm diameter head with rotation mount, 9mm entrance aperture, and matched pair of 5µm wide slits. Use for wavelengths from 190nm to >20µm. This model does not include a cooling fan. USB NanoScan Pyroelectric Detector 9mm aperture 25micron slits. High-resolution head featuring pyroelectric detector, 63.5mm diameter head with rotation mount, 9mm entrance aperture, and matched pair of 25μm wide slits. Use for wavelengths from 190nm to >20μm. This model does not include a cooling fan. Software includes automation feature. PH00400 NanoScan Pyroelectric Detector 9mm aperture 25micron slits. High-resolution head featuring pyroelectric detector, 63.5mm diameter head with rotation mount, 9mm entrance aperture, and matched pair of 25μm wide slits. Use for wavelengths from 190nm to >20μm. This model does not include a cooling fan. NanoScan Large Area Pyroelectric Detector 20mm aperture 25micron slits. High-resolution head featuring pyroelectric detector, 100mm diameter head with rotation mount, 20mm entrance aperture, and matched pair of 25micron wide slits. Use for wavelengths from 190nm to >20micron. This model does not include a cooling fan. USB Software includes automation feature. PH00397 NanoScan Large Area Pyroelectric Detector 20mm aperture 25micron slits. High-resolution head featuring pyroelectric detector, 100mm diameter head with rotation mount, 20mm entrance aperture, and matched pair of 25micron wide slits. Use for wavelengths from 190nm to >20micron. This model does not include a cooling fan. USB NanoScan USB Controller /NS USB Head only NanoScan-Si 25mm aperture 25µm slits Head only NanoScan-Si 25mm aperture 25µm slits Head only NanoScan-Ge 12mm aperture 25µm slits Head only NanoScan-Ge 12mm aperture 25µm slits Head only NanoScan-Pyro 9mm aperture 5µm slits Head only NanoScan-Pyro 9mm aperture 5µm slits Head only NanoScan-Pyro 9mm aperture 25μm slits Head only NanoScan-Pyro 9mm aperture 25μm slits Head only NanoScan-Pyro 20mm aperture 25µm slits Head only NanoScan-Pyro 20mm aperture 25µm slits Upgrade NanoScan v2 Standard version software to the PRO version. This upgrade opens the NanoScan automation feature for those users wanting to integrate or develop their own interface using Visual Basic for Applications to embed into such applications as LabView. Return scanhead to factory. For those NanoScan users with pre v2 software (approx. before July 2012) they can upgrade their hardware to v2 STD capability and can run the new software. Automation capability is not available in v2 STD. Once upgraded the legacy software will run but the automation feature will be disabled in v2 For those NanoScan users with pre v2 software (approx. before July 2012) they can upgrade their hardware to v2 PRO capability and can run the new software. Automation capability is included in v2 PRO. Once upgraded the legacy software will run including the automation capability in v2 Purchase the legacy V1.47 NanoScan software with licence and operations manual to –PRO scanheads to use the older software. (return scanhead to factory) PH00228 PH00026 PH00030 PH00406 PH00035 PH00411 PH00040 PH00412 PH00041 PH00416 PH00243 PH00413 PH00042 3.3.1 Beam Analysis Item USB NS-Si/25/25-STD PH00417 PH00418 PH00419 PH00420 165 For latest updates please visit our website: www.ophiropt.com/photonics 01.08.2013 NanoScan Options and Accessories Item P200 Power Option Description 200mW (maximum power level) relative power meter option for Silicon or Germanium detector NanoScans. The /P200 provides better than 1.5% accuracy when calibrated against user’s NIST traceable power meter and used in similar input geometry as calibrated.. P/N PH00046 Not applicable to Pyro-electric detector scan heads NSEC Cable-x NS-YE C-Mnt COL-FXT 250 PFSA DPFSA COL-FXT 250 TEL-X COL-FXT CO2 RAL-FXT RSP100 RSP200 RSP500 H-I LA H-I 980-VIS w/lens H-I 1550 w/ lens H-I High energy IR H-I 100X NOTE: P200 must be specified at time of purchase (Can be returned for upgrading) Side exit cable option for NanoScan Custom NanoScan cable-length x Extension NanoScan cable 3m C-Mount attachment for NS 250 mm FL collimation fixture UV-Grade fused silica right angle prism front surface attenuator in C-mount housing. Provides 4% front surface reflection Dual prism front surface attenuator comprising two UV-Grade Fused silica right angle prism units configured orthogonally to preserve polarization in a C-mount housing 250 mm FL collimation fixture 1550nm Collimation Fixture for 10.6µmWL Rayleigh fixture for manual M2 RailScan motion stage 100mm length RailScan motion stage 200mm length RailScan motion stage 500mm length Modify H-I for Large (100mm) Scan head NS lens mount bracket and 60X lens 980 WL NS lens mount bracket and 40X lens 1550 WL NS lens mount bracket w/ high energy lens WLxxx NS lens mount bracket and 100X lens WLxxx PH00252 PH00049 PH00050 PH00051 PH00070 PH00052 PH00053 PH00071 PH00072 PH00073 PH00078 PH00079 PH00080 PH00082 PH00146 PH00081 PH00147 PH00148 Power attenuation options 3.3.1 Beam Analysis ND stand for Neutral Density, a term used in photography to designate that a specific filter will attenuate all wavelengths across the visible equally or neutrally. This is the name given to the Wratten type 96 filters, which come in various Optical Densities, ND1, ND2, ND0.5, etc. however, the proper term for beam profiling is Optical Density, so the options should be OD1, OD2 etc. Item HP-ND1 350 thru 399nm HP-ND1 400 thru 700nm HP-ND2 400 thru 700nm HP-ND3 400 thru 700nm HP-ND1 750 thru 890nm HP-ND2 750 thru 890nm HP-ND3 750 thru 890nm HP-ND1 900 thru 1100nm HP-ND2 900 thru 1100nm HP-ND3 900 thru 1100nm HP-ND1 1150 thru 1600nm HP-ND2 1150 thru 1600nm HP-ND3 1150 thru 1600nm Description Must be ordered w/new system – Si only Must be ordered w/new system – Si only Must be ordered w/new system – Si only Must be ordered w/new system – Si only Must be ordered w/new system – Si & Ge only Must be ordered w/new system – Si & Ge only Must be ordered w/new system – Si & Ge only Must be ordered w/new system – Ge only Must be ordered w/new system – Ge only Must be ordered w/new system – Ge only Must be ordered w/new system – Ge only Must be ordered w/new system – Ge only Must be ordered w/new system – Ge only 166 01.08.2013 For latest updates please visit our website: www.ophiropt.com/photonics P/N PH00370 PH00371 PH00372 PH00373 PH00374 PH00375 PH00376 PH00377 PH00378 PH00379 PH00380 PH00381 PH00382 3.4 Accessories for Beam Profiling Introduction Spiricon has the most extensive array of accessories for beam profiling existing. There are components for attenuating, filtering, beam splitting, magnifying, reducing and wavelength conversion. There are components for wavelengths from the deep UV to CO2 wavelengths. Most of the components are modular so they can be mixed and matched with each other to solve almost any beam profiling requirement needed. 3.4.1 Neutral Density Attenuators/Filters For almost all applications, the laser beam intensity is too high for the operating range of the CCD. Therefore ND glass attenuator filters are available to reduce the intensity to the proper level at the CCD. In general, either the LBF-50 attenuating filer set or a set of individual, stackable, screw on filters is recommended. These filters are carefully designed not to affect beam quality or cause interference effects. One stackable ND1 filter and 2 ND2 filters are supplied standard with each camera. Stackable ND Filters ND1/ND2/ND3 Nominal ND value 1,2,3 3.4.1 Beam Analysis Model Clear aperature Damage threshold Mounting LBF-50 Continuously Variable 0.3, 0.7, 1, 2, 3, 4 1-6 continuously variable ATP-K Variable Attenuator ND=1.7-4.6 Max. ND: 7.4 (with fixed 2.8 grayglass attenuator) Ø19mm Ø12mm Ø20mm Ø15mm 5W/cm2 5W/cm2 5W/cm2 100mW/mm no distortion no distortion no distortion no thermal lensing C-Mount Threads C-Mount Threads C-Mount Threads C-Mount Threads UV ND Filters Speciality Filter for 355nm Speciality Filter for 1300nm 0.3, 0.7, 1.0, 1.3, 1.7, 2.0, 2.3, 2.7, 3.0, 3.3, 3.7, 4.0, 4.3, 4.7, 5.0, 6.0 Ø20mm 100W/cm2 CW, 10ns pulses, no distortion C-Mount Threads Pass 355nm, blocks 532nm & 1064nm Pass 1300nm, blocks <1100nm Ø19mm 5W/cm2 no distortion Ø19mm 5W/cm2 no distortion C-Mount Threads C-Mount Threads Stackable ND filters The individual filters come in three versions, the ND1 filter in the red housing with ~10% transmission in the visible, the ND2 filter in the black housing with ~1% transmission and the ND3 filter in the green housing with ~0.1% transmission. The individual filters can be screwed on top of each other and thus stacked. They are set at a small wedge angle in the housing so as not to cause interference effects. ND1, ND2 and ND3 stackable filters LBF-50 Stackable filter showing wedge The LBF-50 comes with a set of filters that are inserted into the flange shown, mounted on top of each other and secured. A set of 6 filters is provided that can achieve attenuation anywhere from ND 0.3 to ND 8. The LBF-50 is especially useful for CS or C mount cameras with the CCD recessed way below the surface. The filters are recessed into the camera thus saving thickness as shown in the illustration to the right. LBF - 50 filter assembly 168 01.08.2013 For latest updates please visit our website: www.ophiropt.com/photonics LBF-50 on C mount camera Transmission vs. Wavelength These ”neutral density” or ND filters do not have a flat response in attenuation vs. wavelength. See the graph for typical transmission vs. wavelength characteristics. Specifications Item Nominal ND (vis) Clear Aperture Damage threshold ND1 / ND2 / ND3 LBF-50 1, 2, 3 0.3, 0.7, 1, 2, 3, 4 Ø19mm Ø12mm 5W/cm2 , 1J/cm2 for ns pulses Continuously Variable Attenuator For maximum ease of use there is the continuously variable attenuator that can vary its attenuation over a very wide range just by pushing and pulling the filters laterally. The attenuator consists of two opposite wedges of ND glass. The surfaces are arranged so that no parallel surfaces face each other so as to eliminate interference effects. The variable attenuator uses the same C-mount thread as the other components so it can be combined with additional stackable filters and beam splitters, if necessary, as shown. Illustration of variable attenuator mounted with additional filter and beam splitters Push/Pull to vary attenuation Specifications Item Nominal ND (vis) Aperture Optical quality Damage threshold Additional filter Attenuation Sliders Variable attenuator 1 - 6 continuously variable Ø20mm 2 waves in visible 5W/cm2 , 1J/cm2 for ns pulses 3.4.1 Beam Analysis Beam Splitters 169 For latest updates please visit our website: www.ophiropt.com/photonics 01.08.2013 ATP-K Variable Attenuator This option makes beam profiling easy. The ATP-K attenuates your laser without ghost reflections or fringes and has a knob-operated variable wedge attenuator of ND 1.7–4.6, and comes with a fixed grayglass attenuator with ND 2.8. The ATP-K is also designed to be used with the HP-XXX high power attenuators and beam splitters. Both types of attenuators attach directly to the ATP-K via C-mount. The ATP-K has simple reproducible attenuation settings, and has a wavelength range of 360 to 2500+ nm. Figure 1 below shows the safe average power for negligible beam distortion from thermal lensing. Absorptive filters, such as used in the ATP-K have an upper power limit of approximately 100mW per mm beam diameter. For pulsed beams, Figure 2 shows the damage threshold for energy where breakage of the glass wedge may occur. This is approximately 5J per mm beam diameter. For lasers with power or energy levels above this the first stage of attenuation will need to come from our line of high power reflective attenuators. Figure 1 – Safe average power for negligible beam distortion Figure 2 – Point at which damage will occur with pulsed energy 3.4.1 Beam Analysis ATP-K Specifications Maximum Power/Energy Handling 100 mW/mm beam diameter 100 mJ total avg. energy Damage threshold: 5J Note: Powerful laser sources may require additional attenuation prior to the beam’s exposure to Model ATP-K. Additional attenuation usually is achieved by use of high-power laser mirror attenuators or clean, high-quality quartz plates (recommended with slight wedge angles). Wavelength Range Attenuation Range 360-2500+ nm Near flat response out to 1500nm Variable filters: ND = 1.7 to 4.6 Maximum ND 7.4 (with fixed 2.8 gray-glass attenuator) Note: ND (optical density) = log (1/T) or T=10 (-ND) where T is the fraction of light transmitted. For example, an ND of 5 transmits 0.00001 or 0.001%. Clear Aperture 15mm diameter Dimensions 94 (W) x 28 (H) x 43 (D) mm Thickness Tolerance ±0.25mm Mounting C-mount Base Mount ¼-20 High Power Attenuators Our high-power laser mirror attenuator transmits <1%, and comes in a C-Mount threaded adapter ring. It is also AR coated for either straight on or 45° orientation. Available standard configurations: ֺֺ ֺֺ ֺֺ ֺֺ ֺֺ ֺֺ HP-266 — Use for 266 ±50nm HP-355 — Use for 350 ±50nm HP-450 — Use for 450 ±50nm HP-600 — Use for 500–700nm HP-800 — Use for 700–900nm HP-1064 — Use for 1000–1100nm Other wavelengths available upon request. Note that if more than one reflective attenuator is required to reduce the beam power, one of them must be oriented 45° to the beam. Unlike absorptive attenuators, reflectors cannot be stacked, because they will form a laser cavity. 170 01.08.2013 For latest updates please visit our website: www.ophiropt.com/photonics UV ND Filters Specifications Item Nominal ND (UV) Aperture Damage threshold UV ND Filters 0.3, 0.7, 1.0, 1.3 ,1.7, 2.0, 2.3, 2.7, 3.0, 3.3, 3.7, 4.0, 4.3, 4.7, 5.0, 6.0 Ø20mm 100W/cm2 CW, 10ns pulses, no distortion Specialized Filters There are also specialized filters available to eliminate extraneous wavelengths when measuring very short or very long wavelengths where the CCD cameras are not sensitive and the desired signal can get swamped by extraneous light of other wavelengths. These filters are as follows: 3.4.1 Beam Analysis This accessory can be used with any camera fitted with C- mount threads. Simply thread the attenuator assembly into the front of the camera and then slide the ND filter arrays to get the desired amount of attenuation. This device can be used with laser outputs from microwatts to Watts. Three filter holders are provided with two filters in each holder. Each filter in the holder provides for a different value of attenuation. To use, slide the desired holder into the housing slot. A click is felt when the filter is properly aligned with the beam. The holders provided will allow for attenuation of up to ND 6. C-mount interface for universal application to our CCD and Pyroelectric cameras 190-380nm attenuation covers Excimer, Helium Cadmium, and the Nd:YAG UV harmonic laser wavelengths. Attenuation with these ND filters permits the best use of the dynamic range of a beam profiling camera. Attenuation range of 0.3 to 6.0 optical densities (ND). Set consists of three slides with two filters in each slide. The Six Filters include 0.3, 0.7, 1.0, 2.0, 3.0 and 4.0 optical densities. Two filters can be employed at one time for 0.3 – 6.0 optical attenuation in 0.3 or 0.4 ND steps. 20mm clear aperture will not vignette any of our applicable camera sensors. Damage threshold = 100W/cm2 for CW lasers and 20mJ/cm2 for nano-second pulse width lasers. Additional Beam Splitters can be added for attenuation of high power UV lasers. UV attenuation system uses high quality optics from the leader in laser beam diagnostics. 1. The 355nm filter for monitoring the 3rd harmonic of YAG. This filter transmits 355nm but blocks 532nm and 1064nm. 2. The 1300nm filter transmits1300nm but blocks wavelengths shorter than 1100nm. These filters are also on the same standard thread so they can be mixed with all the other components. See ordering information pages for more details. 171 For latest updates please visit our website: www.ophiropt.com/photonics 01.08.2013 Ordering Information Item ND1 stackable filter (red housing) ND2 stackable filter (black housing) ND3 stackable filter (green housing) LBF-50 filter set Filter holder and 50x50 filter set Variable filter ATP-K HP-266 HP-355 HP-450 HP-600 HP-800 HP-1064 UV ND Filters 3.4.2 Beam Analysis Filter for 355nm-V2; give an undistorted image of the 355nm light Filter for 1300nm Description 4mm spacing screw on filter for camera with transmission of between 20% and 5% depending on spectral range. Can be stacked and combined with other filters and beam splitters.. One filter is included with Spiricon cameras. 4mm spacing screw on filter for camera with transmission of between 7% and 0.5% depending on spectral range. Can be stacked and combined with other filters and beam splitters. Two filters are included with Spiricon cameras. 4mm spacing screw on filter for camera with transmission of between 2% and 0.05% depending on spectral range. Can be stacked and combined with other filters and beam splitters. Compact screw in filter holder with set of ND filters. Attenuations from low to 106. Filter holder with set of 4 standard Schott 50X50mm neutral density filters. Useful to reduce intensity before inputting into 4X beam reducer. Mounts to standard ¼” thread, ½” diameter laboratory rod. Continuously variable filter for complete control over beam intensity. Especially useful for pulsed lasers. Varies the intensity over more than 4 orders of magnitude between wavelengths 350nm and 1100nm. Can be stacked and combined with other filters and beam splitters. Variable Attenuator Package provides smooth knob operated variable wedges with attenuation of optical density (ND) 1.7–4.6 for a total attenuation capability of ND 7.4. Specially designed to eliminate ghost reflections, fringes, and light leaks. Small compact module including C-mount adapter to attach to camera, and C-mount receptacle to easily attach additional HP-series attenuators. High power laser grade fused silica reflective mirror attenuator for UV applications at 266nm. Second surface antireflection coated. Transmits <1%. Useful 266 ±50nm. High power laser grade fused silica reflective mirror attenuator for UV applications at 355nm. Second surface antireflection coated. Transmits <1%. Useful 355 ±50nm. High power laser mirror attenuator for applications in the visible from 400-500nm. Second surface anti-reflection coated.Transmits <1%. Useful 450 ±50nm. High power laser mirror attenuator for applications in the visible from 500-700nm. Transmits <1%. High power laser mirror attenuator for applications in the visible-Near IR from 700-900nm. Transmits <1%. High power laser mirror attenuator for applications in the Near IR from 1000-1100nm. Transmits <1%. 3 Filters holders each with 2 inconel UV ND. Filters for attunation up to ND 6. Silicon cameras can see the 355nm 3rd harmonic radiation of YAG. The YAG however usually emits some light at 532nm and 1064nm as well. This filter filters out the other 2 wavelengths to give undistorted image of the 355nm light. For all cameras that can operate at 1300nm but are quite insensitive there. This filter filters out all light below 1100nm to allow viewing 1300nm radiation without background interference. SPZ08235 SPZ08253 SP90081 SPZ08240 SPZ17012 PH00128 PH00129 PH00130 PH00131 PH00132 PH00133 PH00134 SP90228 SPZ08246 SPZ08242 3.4.2 Beam Splitter + Neutral Density Filters Combo The attenuators described before can provide a high degree of attenuation however, these neutral density attenuators cannot dissipate more than 5W or so. Therefore we often place beam splitters in front of the attenuators to reduce the intensity before the ND filters. These beam splitters are made of UV grade fused silica for use from 190 to 2000nm. Since they do not absorb light, they have a much higher power handling capacity than the ND attenuator/filters. Model LBS-300 LBS-100 Wavelength Reflection Nominal ND value (vis) multiple versions from 190 to 1550nm 0.01% of incident beam 0.3, 0.7, 1, 2, 3, 4 Clear aperature Damage threshold Mounting Ø17.5mm see spec sheet C-Mount Threads multiple versions; 400-900nm, 1064nm, 10.6µm 4% @ 400-900nm, 1% @1064nm, 0.5% or 5% @10.6µm 0.3, 0.7, 1, 2, 3, 4 for 300-900nm & 1064nm 30% & 60% for 10.6µm Ø19mm 5W/cm2 no distortion Lab post mounted 172 01.08.2013 P/N SPZ08234 For latest updates please visit our website: www.ophiropt.com/photonics LBS-300 Beam Splitters The LBS-300 beam splitter attachment for C-mount, CS-mount, or Ophir mount cameras allow you to measure laser beams with diameters up to 15mm and powers ranging from 10 mWatts to ~400 Watts. The beam sampler is designed so that the preferential polarization selection effect of a single wedge is cancelled out and the resulting beam image is polarization corrected to restore the polarization components of the original beam. The beam sampler operates by reflecting the incoming beam from the front surfaces of a pair of wedges through 90 degrees into the camera. Approximately 99% of the beam is transmitted through the beam sampler with 0.01% passed on to the camera. A set of adjustable ND filters are provided to make final intensity adjustments to the beam before it reaches the camera imager. As an option, you may order the WVF-300 (P/N SP90195) continuously variable ND filter set that can slide in and replace the fixed ND filters. If additional attenuation is needed, an external wedge (P/N SPZ17015) may be mounted at the input port, however this 3rd wedge will cause polarization selectivity when the beam is significantly polarized different in the S and P planes. Alternatively, two LBS-300s can be coupled in series providing up to a 10-8 attenuation. Primary beam in 2 - 45° wedges to reflect the primary beam into the camera Selection of 4 adjustable ND filters Optional SP90273 Large C-mount Wedge Splitter Ordering Information Model Part No. Wavelength Wedge Material Wedge Coating Clear aperture Reflection Wedge ND value, each ND Filters ND Values, nominal LBS-300-UV LBS-300-VIS LBS-300-NIR SP90183 SP90184 SP90185 266-355nm 400-700nm 1064nm UVFS BK7 BK7 A/R ≤1% AR ≤1% AR ≤1% 17.5mm 17.5mm 17.5mm 0.01% 0.01% 0.01% ND ≥2 ND ≥2 ND ≥2 Inconel Bulk ND Bulk ND 0.3, 0.7, 1.0, 2.0, 3.0, 4.0 0.3, 0.7, 1.0, 2.0, 3.0, 4.0 0.3, 0.7, 1.0, 2.0, 3.0, 4.0 (Blu holders) (Grn holders) (Red holders) Filter Slides 3 3 3 Maximum allowable input 100 W/cm2 CW 50 W/cm2 50 W/cm2 to filter (1) 20mJ/cm2, 10ns pulse 1J/cm2, 10ns pulse 1J/cm2, 10ns pulse Accessories Wedge Variable ND Filter kit N/A WVF-300 SP90195 WVF-300 SP90195 Beam Dumps BD-040-A, 40 Watts Max Power, Air Cooled BD-500-W, 500 Watts Max Power, Water Cooled Beam Deflector Assemby for 400-1100 nm only Large C-mount Wedge For additional attenuation add this to the front end of the LBS-300. Good for 350-2000nm Splitter Note: (1) LBS-300-BB SP90186 190-1550nm UVFS No coating, 4% reflection 17.5mm 0.16% ND ~1.3 One each of the UV, VIS & NIR sets See UV, VIS and NIR descriptions 9 See adjacent specifications 3.4.2 Beam Analysis Primary beam out WVF-300 SP90195 SP90192 SP90193 SP90263 SP90273 ND bulk absorbing filters damage threshold is 50W/cm2 but should be used at <5W/cm2 to avoid thermal lensing effects. 173 For latest updates please visit our website: www.ophiropt.com/photonics 01.08.2013 LBS-100 Attenuator The LBS-100 system that is not as compact as the LBS-300 above but has larger aperture, and has versions for longer wavelengths. The system contains the mounting frame, 1 wedge beam splitter and several attenuators. The exit end of the LBS-100 is standard C mount thread so all our cameras can be mounted to the frame. The wedge angle is 6.5 degrees to insure that the reflection from the rear side will not enter the camera. The optical elements are flat to 1/4 wave in the visible to insure no distortion of the beam. LBS-100 System 4X beam reducer Camera Incoming Beam LBS-100 3.4.2 Beam Analysis LBS-100 to 4X beam reducer adaptor The LBS beam splitter/attenuator system can be combined with the 4X beam reducer, as shown above, to attenuate and view large beams. Ordering Information Item Wavelength range LBS-100 Absorber material 400 - 900nm recommended, functional to 2600nm LBS-100 YAG 1064nm LBS-100 IR 0.5 10.6µm LBS-100 IR 5.0 10.6µm LBS-100 to 4X beam reducer adapter Neutral density glass Neutral Densities or transmission 0.3, 0.7, 1.0, 2.0, 3.0, 4.0 ND at 632nm Same Same CaF2 flats,3 -3mm 30% T for 3mm flat, and 1-1mm 60% T for 1mm flat at 10.6µm Same Same Wedge material Max power and reflection density on ND filters Fused Silica 4% in 5W/cm2 for no wavelength range distortion, 50W/ 400 - 900nm cm2 damage Dimensions P/N 19mm 65mm W x 55mm SP90061 H x 140mm D 1% at 1064nm ZnSe 0.5% at 10.6µm Same Same Same Same Same Same SP90057 SP90058 ZnSe 5% at 10.6µm Same Same Same SP90059 This adapter enables mounting of the LBS-100 beam splitter/attenuator assembly in front of the 4X beam reducer. The combined assembly can image large high power beams in one unit. 174 01.08.2013 Clear aperture For latest updates please visit our website: www.ophiropt.com/photonics SPZ17029 3.4.3 Beam Splitter Model Beam Tap l & ll Beam Tap l & ll YAG Stackable Beam Splitter Wavelength Reflection Clear aperature Damage threshold Mounting 400-700nm 4% & 0.16% of incident beam Ø17.5mm 5W/cm2 no distortion C-Mount Threads 1064nm 0.5% & 0.0025% of incident beam Ø17.5mm 5W/cm2 no distortion C-Mount Threads 190-2000nm 5% & 0.025% of incident beam Ø15mm >5J/cm2 C-Mount Threads Single & Dual Front-Surface Beam Samplers 200nm-2.5µm 0.057% @ 532nm Ø14mm 100MW/cm2 C-Mount Threads Beam Tap I & ll ֺֺ ֺֺ Dual surface reflector for equalizing S & P polarization The two planes of reflection are orthogonal Single Surface Polarization Problems Equalizing S & P reflected polarization Any arbitrary polarization component can be broken into equivalent S & P components. With complimentary sampling surfaces any given component gets reflected once as the S polarization, and the second time as the P polarization. Thus using 2 surfaces, the total reflected energy for all polarization components is the sum of the S reflectance and the P reflectance. This causes the sampled beam to have S & P components that are identical to the original beam. 3.4.3 Beam Analysis A single surface reflection at 45° is often used to sample a laser beam for profile measurements or for monitoring power or energy. However, as shown, at 45° a single surface reflects the S polarization component at more than 10 times the reflection of the P component. Depending on the laser polarization content, or stability, this sampling can provide very misleading and unreliable measurements. (The BT-I-YAG has both surfaces A/R coated for 1064nm so the reflection for both polarizations is equal at 0.5%. At other wavelengths far from 1064nm the above discussion applies). 175 For latest updates please visit our website: www.ophiropt.com/photonics 01.08.2013 Beam path through beam tap The Beam Tap II uses two reflecting surfaces such that the two planes of reflection are orthogonal. The standard Beam Tap I rear surface is AR coated from 400-700nm. This diagram shows the 6mm offset of the through beam that is created by the reflecting optic. The deflection angle of the output beam is less than 0.007 degrees. The rear surface of the flat is AR coated to maximize the throughput of the main beam. The standard Beam Tap II rear surface is AR coated for 400nm-700nm. The YAG version is AR coated for 1064nm on both surfaces. 6mm Typical Beam Offset Beam tap relection vs wavelength Shown is the Beam Tap II final sampled reflection vs. wavelength. As shown both the S & P reflection are nearly constant at 0.05% from the UV to the infrared. Ordering Information Model BT-I BT-II BT-I-YAG BT-II-YAG Surface Single surface, 1 cube Dual surface, 2 cubes Single surface, 1 cube Dual surface, 2 cubes Wavelength range 400-700nm 400-700nm 1064nm 1064nm Optical Material UVFS UVFS BK7 BK7 Reflection 4% Ravg 0.16% Ravg 0.5% Ravg 0.0025% Ravg P/N SP90135 SP90133 SP90173 SP90172 The stackable beam splitters are designed for maximum modularity and shortest beam path. They are compatible with almost all of our cameras having the standard C mount thread and can mount either to other attenuators or to the camera itself. Each beam splitter reduces the intensity of the beam by ~20 times (see graph below) so if a camera is equipped with filters that can operate with lasers typically up to ~1 Watt, with one beam splitter it can operate up to ~20 Watts and with two beam splitters up to ~400W. The Beam Splitters will operate for wavelengths from 190nm to 2000nm. The damage threshold of the beam splitters is >5J/cm2 for 10ns pulses. The beam splitters are mounted over the fixed or variable attenuators with a simple fastening ring and can be oriented in any direction with the beam coming from right, left up, down ,or front. The wedge angle of 10 degrees insures that only the reflection from the front surface will appear on the camera with no double images. The user must insure that there are beam stops for the transmitted and reflected beams. Note that if possible, the user should use an even number of beam splitters so as to cancel any possible polarization effects. beam path One beam splitter mounted Two beam splitters mounted Percent reflectance per surface 3.4.3 Beam Analysis Stackable Beam Splitters )Wevelength (nm 176 01.08.2013 For latest updates please visit our website: www.ophiropt.com/photonics Ordering Information Item Description 1st Wedge Beam Splitter 45 degree wedged beam 15mm (1) splitter to reduce intensities on image converter by ~20X. Aperture is 15mm Additional wedge beam splitter to mount to 1st wedge beam splitter 2nd Wedge Beam Splitter Aperture Path length to CCD with P/N 3 screw-on ND filters 60mm SPZ17015 93mm SPZ17026 (1) For converging beams a larger aperture 1st beam splitter is available P/N SPZ 17025. In that case, the aperture at the 1st beam splitter is 30mm Large aperture For converging beams a larger 30mm 1st Wedge aperture 1st wedge beam Beam Splitter splitter. Aperture is 30mm SPZ17025 Single and Dual Prism Front-Surface Beam Samplers The Prism Front-Surface Beam Sampler (PFSA) is a C-mount fixture housing a UV-Grade Fused Silica right angle prism, used for sampling the front surface reflection for high power/energy beam-profiling applications. Reflection at nominal incidence of 45°is polarization and wavelength dependent, with 532nm s-polarization reflected at 8.27%, and p-polarization at 0.68%. With large beam splitter mounted showing how to image converging beam The system is available as either a single prism ( PFSA) or dual orthogonal prism (DPFSA) unit. The dual orthogonal prism configuration results in polarization independent reflection of 0.057% at 532nm. Other filters and attenuators can be attached using the C-mount female threads at the input end. The use of a right-angle prism to sample the incident beam guarantees that any scattered secondary beams do not interfere with measurement, as shown in the sketch. Dual Prism Front Surface Sampler Incident Beam Scattered Beams Prism Front Surface Attenuator Specifications Wavelength of use Optical Material Surface Quality Surface Accuracy Angle of Incidence Clear Aperture Reflection λ (nm) 248.3 351.1 532 1064 Laser Damage Threshold Dimensions( PFSA) Dimensions (DPFSA) Output Mounting with Brass Lock Ring Input Mounting 200nm to ~2.5um UV-Grade Fused Silica 20-10 λ/10 45° 14mm x 14mm Polarization P 0.88% 0.75% 0.68% 0.64% CW> 100MW/cm2 38.1mm x 32.3mm x 29.5mm 44.5mm x 40mm x 32.5mm C-Mount Male (1”-32 Thread Male) C-Mount Female (1”-32 Thread Female) S 9.40% 8.65% 8.27% 8.01% 3.4.4 Beam Analysis Reflected Beam Two Single Prism Front Surface Samplers mounted on a ATP-K Attenuator Ordering Information Model PFSA DPFSA Surface Single Prism Front Surface Sampler Dual Prism Front Surface Sampler P/N PH00052 PH00053 177 For latest updates please visit our website: www.ophiropt.com/photonics 01.08.2013 3.4.4 Beam Expanders Microscope Objectives Screw on filters Model Wavelength Beam Size Change Clear aperture Mounting 4X Beam Expander with UV Converter 193nm-360nm 4X Expansion 1/4 the size of the CCD imager C-Mount Threads Beam Expander 400-1800nm 4X, 6X, 12X, 22X Object plane 8mm in front of device Camera with 4X Beam Expander With a camera having 4.4µm pixel spacing using the beam expander, the effective resolution can be as good as 0.5µm. The object plane that is imaged onto the CCD is located several mm in front of the assembly so even hard to get to focal spots and other small images are easy to image. The beam expanders are designed to accommodate up to 3 screw on filters or a variable attenuator behind them so a wide range of intensities can be accommodated. For intensities too large to be accommodated by just filters, beam splitters are available to reduce the intensity before the beam expander. The beam expander is primarily intended for nonparallel beams such as focal spots and fiber tips. If small parallel beams are imaged, interference effects may occur. The 4X Beam expander can also be fitted with a UV converter plate at its object plane so that you can look at small beams in the spectral range 193-360nm and expand them 4X. See ordering information for further details. Microscope objective assembly with beam splitter mounted 3.4.4 Beam Analysis Beam expanders are available for 4.5mm spacing CS mount 12.5mm spacing cameras. The 4X beam expander is an expanding telescope that images the beam as it looks at 8mm from the end of the expander onto the CCD while enlarging the image 4X. In addition to the 4X beam expander, other microscope objectives are available for expanding the beam even more. There are objectives for 6X, 12X and 22X expansion. The various expanders allow the use of our 2% and 10% filters as well as the variable attenuator so as to accommodate the camera to a wide range of source intensities . 177-A For latest updates please visit our website: www.ophiropt.com/photonics 01.08.2013 Shown is an image of the tip of a single mode fiber of 9µm diameter. The beam width as measured on the profiles shows 4X the actual size so we see a resolution of ~2µm. Approximate expansion ratio Spectral range 4X 6X 12X 22X 400 - 1800nm 600 - 1064nm 600 - 1064nm 600 - 1064nm UV converter assembly for 4X Beam Expander Distance from lens Distance from barrel to focus focus to 1st beam splitter 8mm 18mm 16mm 10mm past 1st surface 6mm 6mm 2.4mm 8mm Distance of closest approach to focus with 1 beam splitter 32mm 4.5mm 20mm 22mm Total length of assembly 50mm 107mm 101mm 102mm Ordering Information 3.4.4 Beam Analysis Item 4X reimaging beam expander Description Screw optical assembly that images the plane 8 mm in front of the expander onto the CCD while enlarging it 4X. Fits 4.5mm recess and CS mount cameras. Fiber adapter bracket for 4X beam expander Screw on bracket to use with Ophir fiber adapters so fiber is held in correct position to image fiber tip onto camera. Will give exact focus with FC type fiber. UV converter assembly for 4X beam expander Screw on assembly which has UV plate that converts 193 - 360nm radiation to visible. This plate is at the object plane of the 4X expander so it produces a 4X enlarged image on the CCD. 6X expanding microscope objective Screw optical assembly that images the plane 16mm in front of the lens onto the CCD while enlarging it ~6X. Fits 4.5mm recess and CS mount cameras. Needs spacer assy below. 12X expanding microscope objective Screw optical assembly that images the plane 6mm in front of the lens onto the CCD while enlarging it ~12X. Fits 4.5mm recess and CS mount cameras. Needs spacer assy below. 22X expanding microscope objective Screw optical assembly that images the plane 2.6mm in front of the lens onto the CCD while enlarging it ~22X. Fits 4.5mm recess and CS mount cameras. Needs spacer assy below. Spacer assy for objectives Spacer assembly for above. One only needed for all expanders above. Beam splitter for expanders above 45 degree angle wedge beam splitter which mounts onto beam expander. Reduces beam intensity by ~20 times. For spectral range 190 – 2500nm. Introduces 35mm extra beam path to object plane. Additional beam splitter for above Additional beam splitter to mount to 1st beam splitter. 178 01.08.2013 For latest updates please visit our website: www.ophiropt.com/photonics P/N SPZ17022 SPG01649 SPZ17019 SPZ08257 SPZ08259 SPZ08260 SPZ08261 SPZ17027 SPZ17026 3.4.5 Beam Reducers 4X Reimaging Beam Reducer The 4X Beam Reducer is an imaging system that images the plane 30cm in front of the reducer onto the camera CCD sensor while reducing the size 4 times and inverting it. The beam reducer uses the 3 screw on attenuators provided with the camera. Since the intensity of a beam after reduction will be increased by 4x4=16 times, it is advisable to attenuate the beam more than you would without beam reduction. This can be done with additional external beam splitters and attenuators which are available (see ordering information). Note that the custom designed beam reducer gives better image quality than tapered fibers since it does not introduce graininess or uneven pixel response. Also the image distortion of ~1% is considerably lower than with most tapered fibers. The beam reducer is not compatible with CS mount cameras. Shown is an image of an Alexandrite laser with beam diameter of 18mm. As can be seen, it is easily seen with the FX50 camera with the 4X beam reducer. LBS-100 combined with 4X beam reducer The 4X beam reducer can be combined with the LBS-100 beam splitter/attenuator system to attenuate higher power beams before reducing them in size Specifications of 4X beam reducer Spectral Range Antireflection Coating Beam reduction Accuracy Size Aperture Maximum Beam Size Distortion of Beam Damage Threshold 390nm to 1100nm Antireflection coating optimized for 1064nm and 532nm ± 3% Ø60 mm dia x 94mm length 50mm SP 503/FX50: 25x19mm, FX 33: 18x14mm, SP 620 or GRAS20: 28x21.2mm Less than 1% over 80% of diameter 30mJ per pulse for nanosecond pulses 3.4.5 Beam Analysis 4X beam reducer Ordering Information 4X Imaging Beam Reducer Item Description 4X reimaging beam reducer Screw on beam reducer for beams in the wavelength region 360 – 1100nm that reimages the beam 30cm in front of the unit onto the CCD while reducing the beam size 4X. Entrance aperture is 50mm. Fits 4.5mm recess cameras only. Accessories Filter holder and 50x50 filter set Filter holder with set of 4 standard Schott 50X50mm neutral density filters. Useful to further reduce intensity after for 4X beam reducer beam splitter before inputting into 4X beam reducer. Mounts to standard ¼” thread, ½” diameter laboratory rod. LBS-100 to 4X beam reducer This adapter enables mounting of the LBS-100 beam splitter / attenuator assembly in front of the 4X beam adapter reducer. The combined assembly can image large high power beams in one unit. See illustration on page163. P/N SPZ17017 SPZ08240 SPZ17029 179 For latest updates please visit our website: www.ophiropt.com/photonics 01.08.2013 3.4.6 CCTV lens for front imaging through glass or reflected surface When direct imaging in front of the camera, for example, an image projected onto a diffusing surface, such as a ground glass plate, it is necessary to reduce the image so that it completely fits onto the CCD chip surface. The 25mm and 50mm CCTV lenses image an object from a given plane in front of the lens onto the CCD while reducing the size. The lens can image such objects at distances from about 10cm in front of the lens (20cm for the 50mm lens) to 1 meter or more depending on the distance from the lens to the camera. The distance from lens to camera depends on the camera type and spacers placed between the lens and the camera. Focus adj Spacers Iris adj Camera Body A. - Total length of spacers added to system B. - Detector to Lens spacing. Distance ‘A’ plus the CCD inset for the camera type C. - Lens to Object spacing 3.4.6 Beam Analysis CCD inset for Camera Types C mount (Camera front to CCD = 17.5mm) for nominal lens magnification, use without spacers. CS mount (Camera front to CCD = 12.5mm) for nominal lens magnification, use 5mm spacer. SP mount (SP cameras. Camera front to CCD = 4.5mm) for nominal lens magnification, use with 13mm spacers. Ordering Information Item 25mm focal length CCTV lens kit 50mm focal length CCTV lens kit 4mm spacer 5mm spacer 8mm spacer Description 25mm focal length lens assembly with locking iris and focus adjustment. Includes 1 ea ‑ 8mm spacer and 2 ea ‑ 5mm spacers Same as above except 50mm focal length lens Screw on spacer to add 4mm spacing to optical system Screw on spacer to add 5mm spacing to optical system Screw on spacer to add 8mm spacing to optical system 180 01.08.2013 For latest updates please visit our website: www.ophiropt.com/photonics P/N SP90085 SP90038 SPG01698 SPG02106 SPG02067 3.4.7 Imaging UV lasers Integral Reimaging UV Image Converters The UV image converters are fluorescent plates that convert UV radiation that is poorly imaged by silicon cameras into visible light that is then imaged onto the CCD of the camera. These fluorescent plates are specially designed for UV conversion and have a high light output, wide linear dynamic range and high damage threshold. There are 3 versions available: 1. The 4X UV image converter for large beams converts to visible and then images onto the CCD while reducing the beam size 4X. 2. The 1:1 UV image converter converts to visible and images the beam onto the CCD without changing the size. Shown here is a profile of a 248mm Excimer laser beam 3. The 4X expander with UV converter converts to visible and images a beam enlarged 4X onto the CCD. 4X beam reducing UV Image Converter as mounted on camera Cross section of 4X reducing UV image Converter Fluorescent plate Imaging optics 1X UV Image Converter with Optional Beam Splitter 4X beam expander with UV converter Image plane at CCD Specifications 4X UV Image Reducing Converter 1X UV Image Converter 4X Beam Expander with UV converter Beam Reduction 4X reduction ±2% with included correction factor 50µm x 50µm 193 to 360nm ~1µJ/cm2 with blank filter ~30mJ/cm2 at 193nm, ~15mJ/cm2 at 248nm with included filter 20 times above values with optional beam splitter Ø30mm but effective beam size is limited to 4X CCD dimensions 100W/cm2 or 2J/cm2 with beam splitter Ø50mm dia x 185mm length 1:1 imaging ±2% with included correction factor 35µm x 35µm 4X expansion ±2% with included correction factor 15µm x 15µm ~15mJ/cm2 at 193nm, ~20mJ/cm2 at 248nm with included filter, 20 times greater with optional beam splitter Ø18mm but effective beam size is limited to CCD dimensions ~30mJ/cm2 at 193nm, ~15mJ/cm2 at 248nm 20 times above values with optional beam splitter 1/4 the size of the CCD dimensions Ø31mm dia x 120mm length Ø29mm dia x 69mm length Resolution Spectral range Minimum signal Saturation intensity Effective Aperture Damage threshold Dimensions 3.4.7 Beam Analysis All of the above imagers allow a beam splitter to be mounted at 45 deg angle in front of the imager so as to allow imaging of higher power/energy beams. Ordering Information Item Description 1X UV image converter Screw on imaging telescope that converts UV image to visible and images same size on CCD. For beam intensities from 50µJ/cm2 to 15mJ/cm2. Fits 4.5mm recess and CS mount cameras. Beam splitter for above 45 degree wedged beam splitter to reduce intensities on image converter by ~20X. For beam intensities of up to 300mJ/cm2 at 193nm. 4X reducing UV image Screw on imaging telescope that converts UV image to visible reduces the size 4X and images on CCD. For beam converter intensities from 1µJ/cm2 to 15mJ/cm2. Beam splitter for above 45 degree wedged beam splitter to reduce intensities on by ~20X. For beam intensities of up to 300mJ/cm2 at 193nm. UV converter assembly Screw on assembly which has UV plate to convert 193 - 360nm radiation to visible. The plate is at the object plane of for 4X beam expander the 4X expander (P/N SPZ17022) and produces a 4X enlarged image on the CCD. 20mm diameter UV Ø20mm diameter UV image conversion plate only. For customers that have own imaging system. Converts UV imaging plate image to visible. For beam intensities 50μJ/cm2 to 10μJ/cm2. 30mm diameter UV Ø30mm diameter UV image conversion plate only. For customers that have own imaging system. Converts UV imaging plate image to visible. For beam intensities 50μJ/cm2 to 10μJ/cm2. 50mm X 50mm UV 50X50mm diameter UV image conversion plate only. For customers that have own imaging system. Converts UV imaging plate image to visible. For beam intensities 1mJ/cm2 to 20mJ/cm2. Not suitable for 193nm. 100mm X 100mm UV 100X100mm diameter UV image conversion plate only. For customers that have own imaging system. Converts UV imaging plate image to visible. For beam intensities 1mJ/cm2 to 20mJ/cm2. Not suitable for 193nm. P/N SPZ17023 SPZ17015 SPZ17024 SPZ17007 SPZ17019 SPF01177 SPF01150 SP90082 SP90083 181 For latest updates please visit our website: www.ophiropt.com/photonics 01.08.2013 UView Ultraviolet Converter for C-mount Cameras The UView accessory converts ultraviolet radiation into a visible green beam profile that is reimaged onto a CCD style C-mount camera. The UView operates over the ultraviolet region of 190-390nm. It has a reimaging magnification factor of ~0.5x and a field of view (FOV) of ~15x20mm with an SP620 style camera. The FOV will vary with camera format. Camera and software sold separately. 3.4.7 Beam Analysis UView UView- top view UView- with camera (sold separately( UView Image Converter specifications Specifications Beam redactions Scale factor Spectral range Minimum signal Camera saturation1 Clear apreture Effective apretute Damage threshhold Mounting Dimensions Weight Adaptable beam analyzer camera systems ~ 0.50X nominal image reduction ~ 2.0 nominal scale factor for BeamGage, see label 190 to 390nm ~ 1uJ/cm2 ~ 30mJ/cm2 at 193nm, ~ 15mJ/cm2 at 248nm Varies with wavelength and camera type 18mm X 22mm 15mm X 20mm w/SP620, varies with camera format 5W/cm2 / 100mJ/cm2 3 1/4-20 threaded mounting points, see figure 11 see figure 7 Xxx oz. (yyy g )w/o camera The Uview can be used with the following cameras employed by BeamGage, LBA and BeamStar products: (This product will work with any X/CS-mountcamera but the FOV will vary based on imager format) SP503, SP260, SCOR20, GRAS20, FX50, FX33, FX33HD, L070, L130, L230 1. The UV converter glass will damage before it becomes saturated Ordering Information Item UView Description Uview, Accessory for C-mnt Cameras 182 01.08.2013 For latest updates please visit our website: www.ophiropt.com/photonics P/N SP90322 3.5 Near Field Profilers 3.5.1 Camera Based Near-Field Profiler ֺֺ ֺֺ ֺֺ ֺֺ ֺֺ ֺֺ ֺֺ ֺֺ ֺֺ Allows measurement of beams normally too small for camera profiler Expands beam to reduce power/energy density Provides near-field profile of fibers, LD junctions, and other small sources Can be used to measure tightly focused beam with camera and attenuation Nominal 10X, 20X, 40X, 60X Beam expansion available Easily calibrated to provide absolute measurement values Built-in continuously variable attenuation C-mount for attachment to any camera profiler Camera and BeamGage software purchased separately Near field profiling can also be used with camera profilers to analyze small beams, and involves a microscope objective lens to image the beam onto a camera detector array. This technique expands the measurement range of the camera to include smaller beams, which could not be ordinarily measured due to the pixel size of the detector array. Near field profiling is performed in fiber and waveguide analysis, lens characterization, and other applications where beams 50 microns or smaller are analyzed. While there are more accurate techniques to measure these beam sizes, the camera provides two-dimensional information that cannot always be obtained through knife-edge or scanning slit methods. This camera accessory includes base plate for mounting camera and Microscope Objective, ATP-K variable attenuator, 50mm C-Mount and an 8mm and 5mm spacer. User selectable magnification lenses, camera and BeamGage must be purchased separately. 3.5.1 Beam Analysis The near field of the test beam or sample is imaged with the microscope objective lens and relayed to the camera. The bracket mounting fixture holds both the lens and camera, which itself can be mounting on a positioner or optical rail. This complete system provides everything necessary to perform near-field measurements right out of the box. Camera NFP with ATP-K Variable Attenuator C-mount NFP Adapter Assembly ATP-K Variable ND Filter Fixed ND Filter Light Baffle Locking Ring 8mm C-mnt extender 5mm C-mnt extender Microscope Objective sold separately C-NFP Adapter Camera sold separately Ordering Information Item C-NFP Assy 60X 40X 20X 10x Description Includes base plate for mounting camera and Microscope Objective, ATP-K variable attenuator, 50mm C-Mount and an 8mm and 5mm spacer. 60X, Microscope objective 40X, Microscope objective 20X, Microscope objective 10X, Microscope objective P/N SP90291 SP90292 SP90293 SP90294 SP90295 183 For latest updates please visit our website: www.ophiropt.com/photonics 01.08.2013 3.5.2 Slit-Based NanoScan Near-Field Profiler Measuring the near field of sources such as laser diodes, VCSELs, optical fiber, and/or waveguides can be a difficult task. Accurate measurement of such small sources to the micron level requires high precision in the optical and mechanical design. To simplify this task and to fill this requirement, Photon offers several models of Near-Field Profilers (NFPs) covering a wide range of wavelengths and power levels. Another important application of these instruments is to extend the focused laser spot size measurement range of the NanoScan profiler. By expanding the size of a focused spot it is possible to reduce the power density and make possible the measurement of beams that are too powerful to be measured without attenuation, as well as those that are too small to be accurately measured with the standard scanhead. The NanoScan NFPs are easy-to-use turnkey systems that can be used either as a stand-alone instrument or integrated into manufacturing inspection systems. For NanoScan users who want to extend the measurement capability of their present systems, the optical and mechanical components are also available as accessories. The NFP-980 with 60:1 magnification and 1µm resolution, specifically designed for measurement of 980nm pump lasers, is also ideal for other applications in the wavelength range between 700nm–1100 nm. The NFP-1550, with 40:1 magnification and 2.6µm resolution, is designed for use in characterizing sources in the 1300-1600nm telecommunications wavelength band. Both models come with a NanoScan GE/9/5 scanhead and the magnifying objective lens, which can be rigidly mounted to an optional precision XYZ translation stage, which in turn is mounted to an optical rail. They also include the NanoScan Control and Data Acquisition Card and NanoScan Acquisition and Analysis Software. The system has all the standard Windows file saving, printing, communication and ActiveX capability. For visible wavelengths, the NFP-VIS is equipped with the NanoScan SI/9/5 scanhead and the 60:1 microscope objective, AR coated for the 400–700nm wavelength range. UV Wavelengths below 360nm can also be accommodated with an optional UV corrected microscope objective. For higher power and longer wavelength beams the NFP-Pyro is available. These systems can measure spot sizes from 5μm at any wavelength from 190nm to 20μm. This instrument configuration naturally reduces the power density incident on the instrument by one over the square of the magnification. The system can be supplied with a lens for the user-specified wavelength of use. 3.5.2 Beam Analysis For viewing VCSEL junctions, single-mode fibers and large long wavelength LD junctions there is an optional 100:1 objective lens option, producing diffraction limited performance from 400–700nm with a working distance of approximately 0.25-0.35mm and Numerical Aperture is 0.90. From 700–1600nm, this lens produces near diffraction-limited performance. NanoScan Near-Field Profiler Systems Parameter NFP-VIS NFP-980 NFP-1550 NFP-Pyro Tester Wavelength Range 400-700nm <360nm optional 0.49μm 140μm 3mm 160mm 0.85 60:01:00 NSSI/9/5 9mm 5μm 700-1100nm 1300-1700nm 190->20μm 1.1μm 140μm 3mm 160mm 0.85 60:01:00 NSGE/9/5 9mm 5μm 2.6μm 200μm 5.1mm 207mm 0.48 40:01:00 NSGE/9/5 9mm 5μm Lens Spread Function Maximum Source Objective Focal Length Objective Rear Focal Distance Objective Numerical Aperture Objective Magnification NanoScan Model Aperture Size Slit Width 3 Axis Stage Travel X (across rail) Y (normal to rail) Z (along rail) 13mm micrometer adjust 6.5mm fine pitch actuator 13mm micrometer adjust 184 01.08.2013 For latest updates please visit our website: www.ophiropt.com/photonics Wavelength and application dependent for these parameters NSPyro/9/5 9mm 5μm Ordering Information Model USB NFP-980(NS) Model USB NFP-VIS(NS) Model USB NFP-Pyro Description Model NFP-1550 NanoScan system with Germanium Detector 9mm Aperture 5µm Slits. Highresolution 63.5mm diameter head with rotation mount. Use from 700nm to 1.8microns Model NFP-980 NanoScan Germanium Detector 9mm Aperture 5.0micron Slits. High-resolution 63.5mm diameter head with rotation mount. Microscope Objective Lens Mount with 60:1 optics for 700-1100nm Model NFP-VIS NanoScan Silicon Detector 9mm aperture 5µm slits. High-resolution 63.5mm diameter head with rotation mount. Microscope Objective Lens Mount Bracket with 60:1 optics for 400-700nm NFP-NS-Pyro NanoScan pyroelectric detector with 9mm entrance 5µm slits. Use for wavelengths from 190mm to 20 microns (specify wavelengths of use when ordering). Lens Mount bracket with well-corrected aspheric high-energy 60:1 lens with a 0.68 NA. Available in wavelengths 400nm1100nm P/N PH00229 PH00230 PH00231 PH00232 3.5.2 Beam Analysis Item Model USB NFP-1550(NS) 185 For latest updates please visit our website: www.ophiropt.com/photonics 01.08.2013 3.6 What is M2 ? M2, or Beam Propagation Ratio, is a value that indicates how close a laser is to being a single mode TEM00 beam, which in turn determines how small a beam waist can be focused. For the perfect Gaussian TEM00 condition the M2 equals 1. For a laser beam propagating through space, the equation for the divergence, θ, of an unfocused beam is given by: θ0 = M24λ/πD0 For a pure Gaussian TEM00 beam M2 equals 1, and thus has no impact on the calculation. The calculation of the minimal beam spot is then: d0 = 4λ/πθ Again with M2 equal to 1, the focused spot is diffraction limited. For real beams, M2 will be greater than 1, and thus the minimum beam waist will be larger by the M2 factor. Characteristics of a laser beam as it passes through a focusing lens. How is M2 measured? 3.6 Beam Analysis M2 cannot be determined from a single beam profile measurement. The ISO/DIS 11146 requires that M2 be calculated from a series of measurements as shown in the figure above. M2 is measured on real beams by focusing the beam with a fixed position lens of known focal length, and then measuring the characteristics of the artificially created beam waist and divergence. To provide an accurate calculation of M2, it is essential to make at least 5 measurements in the focused beam waist region, and at least 5 measurements in the far field, two Rayleigh ranges away from the waist area. The multiple measurements ensure that the minimum beam width is found. In addition, the multiple measurements enable a “curve fit” that improves the accuracy of the calculation by minimizing measurement error at any single point. An accurate calculation of M2 is made by using the data from the multiple beam width measurements at known distances from a lens, coupled with the known characteristics of the focusing lens. M² Measurement Solutions Ophir-Spiricon and Photon have a number of solutions for the measurement of M² ranging from simple manual processes to fully automated dedicated instruments, depending on the frequency of the need to measure M² of lasers and laser systems. We have a system that will meet most needs, whether for research and development of new laser systems, manufacturing quality assurance, or maintenance and service of existing systems. 186 01.08.2013 For latest updates please visit our website: www.ophiropt.com/photonics 3.6.1 Camera Based Beam Propagation Analyzer: M2 M2-200s ֺֺ ֺֺ ֺֺ ֺֺ ֺֺ ֺֺ ֺֺ ֺֺ Automatically measure your beam quality in under 2 minutes Tune your laser for best operation ISO compliant Specifically developed for continuous usage Unequaled accuracy using patented UltracalTM Calibration Automatic attenuation adjustment Pulsed and CW for most beam diameters and powers Compact and portable Not all commercial M2 measuring instruments conform to the ISO 11146 method of employing a fixed position lens and moving detector. Instead, some manufacturers use a fixed position detector and a moving lens. If the laser beam is diverging or converging within the travel range of a moving lens, the reported M2 value and other results can be significantly compromised. Spiricon's M2-200s Beam Propagation Analyzer is fully ISO 11146 compliant. The M2-200s optical train uses a fixed position lens and camera. The mirrors that direct the focused beam into the camera are moved to precise locations, translating the beam through both the waist region and the far field regions. All these measurements and translations, as well as incremental beam attenuation, are automatically controlled by the M2-200s software. Software improvements in the M2-200s, including more efficient algorithm execution, has decreased the measurement reporting time by 2-3 times, making it possible to report M2 in under two minutes. Steering Mirrors Beam Attenuater 1st Laser Source “A” “B” 2nd Camera Alignment Tool 3.6.1 Beam Analysis Automatic M2 - at Production Speeds m2-200s Optical Train 187 For latest updates please visit our website: www.ophiropt.com/photonics 01.08.2013 Manual M2 Manual mode is available for beams that are too large or too small or at wavelengths outside the standard optical train. Mirror 2 Lens Filters Camera Laser Source Mirror 1 Accuracy by Design Spiricon products are known for accuracy. Using our patented UltracalTM calibration method and auto aperturing to exclude noise beyond the wings of the laser beam, assures the user of the most accurate measurements in the industry. Designed by Our Customers Spiricon has redesigned the M2-200, the world's top selling beam propagation system to include customer input, increased attention to durability, and operational robustness for continuous use applications - three shifts a day, seven days a week. Novice and seasoned users will appreciate these new features along with the time-tested excellence that the Spiricon M2-200 measurement system has provided over the years. Main Screen Functions 3.6.1 Beam Analysis This window displays quantitative measurements of the laser parameters. These include the X and Y beam widths, M2 or K, the divergence angles, the Rayleigh range, and other parameters shown. This window presents measurements of beam width vs. position for a given run. After measuring a few points, the software extrapolates a curve fit. The Xs and Ys represent individual measurement points. The solid lines present the best fit hyperbola of the beam propagation equation to the measured points. The M2 and other laser parameters are computed from the best fit hyperbola since it provides a smoothing of the data points. The 2D or 3D beam profile of the currently measured point in the beam propagation curve. This image enables visual intuitive verification of the beam profile behavior through focus. After each run the user can click any individual measured point and observe the beam profile. Outlying or anomalous points can be automatically or manually excluded from the curve fit calculations for more accurate results. 188 01.08.2013 For latest updates please visit our website: www.ophiropt.com/photonics General Accuracy ±5% typical, ±12% waist location and Rayleigh length typical (Note: Accuracy can be degraded by a variety of situations) Measurement Cycle Time 2-3 minutes typical, depending on setup conditions and operating mode Camera Attachment Std C-mount, 90° camera on axis rotation Translation System Step motor-driven lead screw Translation Pitch 4 mm/rev optical pitch Step Angle 1.8° (200 steps/rev) Sample Range M2 - 200 s 190 - 600 mm, typical Camera Specifications (for GRAS20 camera) Imager 1/1.8” CCD, 1600 x 1200 pixels Dynamic Range 12 bit A to D Frame Rates 7.5 FPS (at full resolution) Pixel size 4.4µm x 4.4µm Gain 0 to 25dB Shutter Control Programmable from 110µs to 70ms S/N Ratio 59dB at min gain Trigger Input Edge sensitive 3.3 / 5Vdc LVTTL / TTL (positive or negative, user programmable) Minimum pulse width 10us Trigger Out External Trigger cable provided Voltage Requirement 3.3Vdc LVTTL, Programmable Power Consumption Powered over Firewire Cable <3.5watts Dimensions 44mm (1.74") wide, 29mm (1.14") tall and 66mm(2.6") deep Mass 104g (3.7oz) Environmental Storage Temperature -30°C to 65°C Storage Humidity 95% maximum (non-condensing) Operating Temperature 10°C to 40°C Operating Humidity 95% maximum (non-condensing) Power Requirements* Line Voltage 95V AC to 250V AC Line Frequency 47Hz to 63Hz Maximum Power 4.5 Watts * For the Optical Train only. The PC computer supplies the power for the system components, such as the CCD camera. An external power supply is provided for Laptop computer use. Physical Weight M2-200s… 6.8 kg (without camera) Measurements M2x, M2y, Kx, Ky, BPPx, BPPy Statistical results( Width at waist Wx, Wy are available on Divergence angle qx, qy )all measurements Waist location Zx, Zy Rayleigh X, Y Astigmatism Asymmetry ratio Wavelength Range Different lenses are needed for different wavelength regions The M2-200s model include 3 standard lenses with nominal 300mm focal lengths. See below M2-200s-FW 266 - 587nm (included) 400 - 750nm (included) 650 - 1125nm (included) 1000 - 1300nm (optional) Attenuation Range Nominally from ND 0 to ND 4.8. Actual values vary with wavelength Beam Size 0.5mm - 10mm M2-200s Varies with wavelength, waist size and location, and M2 Damage Limits 1 Camera 0.15 µW/cm2 CW mode for a 10 mm input beam diameter 1.0 µJ/cm2 pulse mode for a 10 mm input beam diameter Both of the above for an M2 =1 @ 1064nm 1 CCD cameras can be damaged by power in excess of 100 mW/cm2 or energy in excess of 100 mJ/cm2. The M2-200s employs a focusing optic. While it may be that the laser input power or energy measures well below this damage threshold, it can easily exceed these levels when focused onto the camera sensor. Use caution and error on the side of safety. CCD cameras can be costly to repair or replace. 3.6.1.1 Beam Analysis 3.6.1.1 Specifications for the M2-200s Ordering Information Item Description M2-200s Beam Propagation Analyzer M2-200s-FW M2-200 software, software license, GRAS 20 Firewire camera, short optical train, automatic and manual operation, recommended for 266nm - 1064nm wavelengths M2-200 software, software license, short optical train, automatic and manual operation, recommended for 266nm M2-200s-FW-A 1064nm wavelengths (GRAS 20 camera not included) M2-200sM-FW Manual mode M2-200 software, software license, GRAS 20 Firewire camera, manual operation with a GRAS 20 Firewire camera (optical train not included) Manual mode M2-200 software, software license, manual operation with a Firewire camera (GRAS 20 Firewire M2-200sM-FW-A camera and optical train not included) 1000-1300nm lens Lens assy telecom, 300mn fl P/N SP90144 SP90145 SP90146 SP90147 11402-001 189 For latest updates please visit our website: www.ophiropt.com/photonics 01.08.2013 3.6.1.2 Model 1780 Instantly measure M2 The ModeScan Model 1780 is a laser beam profiling instrument that measures the M² Beam Propagation Ratio and all associated ISO 11146 parameters instantaneously in real time at video rates to over 20Hz. The measurement technique, patented by Photon Inc., uses 10 reflective surfaces to form simultaneous images of the propagating beam at 10 locations on a Model 2512 CCD array camera. With all ten measurement positions acquired at once, the instrument is suitable for measurement of both CW and pulsed lasers down to single-shot rates. Beam diameters are obtained with NIST-traceable accuracy to better than 2% using the BeamPro. This translates to M² measurements with accuracy to ~5%. The FireWire system operates under Photon’s BeamPro in Microsoft Windows. The compactness of the system and the IEEE 1394a FireWire interface offers enhanced ease-of-use and portability. The ability to operate in any orientation allows for easy placement on any optical bench and saves valuable bench space. The CCD is sensitive from ~250nm to 1100nm wavelengths. The standard configuration is supplied with a glass OD 2.8 C-mount neutral density filter for wavelengths >360nm, and an OD 3.0 Fused Silica Inconel neutral density filter for wavelengths <360nm. Because of the limited usefulness of exposure control with pulsed lasers, the Photon Inc. Model ATP is recommended for use with pulsed lasers with repetition rate <~10kHz and wavelength >360nm. For pulsed lasers with wavelength <360nm, a variable UV filter or a combination of UV filters will generally be required. ModeScan 1780 ModeScan Model 1780 System Specifications 3.6.1.2 Beam Analysis Optical/Sensor/Detector Sensor Wavelength Pixel Array Pixel Size Array Dimension Scanning Mode CCD Cover Glass Beam Splitters Test Lenses UV: ~250 – 460nm Visible : 425 – 720nm VIS – NIR; 620 – 1080n Fixed Attenuator: Visible – NIR UV Computer/Electrical A / D Conversion Maximum Frame Rate Exposure range Gain Trigger External Trigger Specifications Trigger Connector Trigger Cable Interface IEEE 1394 Cabl Supply Voltage Supply Power Mechanical Filter/Lens Mount Mounting Dimensions in mm Weight Environmental Operating Temperature Humidity Conformity Si CCD 1/2" Format ~360nm – ~1100nm (Standard with OD 2.8 filter) ~250nm – ~1100nm with UV optics 780 (H) × 580 (V) 8.3µm × 8.3µm 6.49mm × 4.83mm Progressive Removed Fused Silica: <20/10 Scratch Dig, l/10 Flatness 200mm fl Fused Silica/250 – 460nm AR coated standard 200mm fl BK7/425 – 720nm AR coated standard 200mm fl BK7/620 – 1080nm AR coated standard other fl's optional for all wavelengths OD 2.8 Absorbing Glass >360nm OD 3.0 Fused Silica Inconel 250 – 450nm 12 Bit 35.8fps (full frame @ full resolution) 20µs–27.64ms (Software selectable via 1394 bus) 0–12dB (Software selectable via 1394 bus) Internal or External (Software selectable) 5V ±1V @ 10mA ±5mA (Positive transition) 10 pin RJ-45 Jack 10 pin RJ-45 to BNC 1.8m IEEE 1394a (FireWire) 1.8m +8V – +36V DC (+12V DC nominal), <1% ripple (supplied via IEEE 1394 cable); requires external powered hub with laptop PCs 3.5W max @ 12V DC (typical) C-mount (1" – 32 tpi) Gimbal Mount on ½" post; 12mm Metric post optional 62 H × 140 W × 210 L , + Gimbal Mount ~1.4kg O° – +50°C (+32° – 112F) 20% – 80%, relative, non-condensing CE; FCC; RoHS and WEEE 190 01.08.2013 For latest updates please visit our website: www.ophiropt.com/photonics Arrangement of Measurement Windows: Video Window Beam Propagation Mode; Beam Statistics Window; Horizontal and Vertical Caustics Window. Ordering Information Item ModeScan 1780 M2 System with Fire Wire BeamPro MS-1780 Description P/N ModeScan Model 1780, dedicated M² measurement system, with 12-bit FireWire (IEEE 1394a) CCD detector for single-shot, pulsed and CW lasers. System includes: ModeScan with gimbaled mount for alignment; FireWire CCD camera; Photon FireWire BeamPro Acquisition and Analysis Software standalone GUI with M² Analysis; Active X automation interface; 200mm lens coated for Visible range (400– 700nm); OD 2.8 glass filter for operation >360nm; Dimensions: 62mm x 140mm x 210mm; For use from 250–1100nm wavelengths - UV and NIR operation will require additional specifically coated optics. PH00096 MS 1780 Lens Kits All lens kits contain 200mm, 250mm, 400mm, 500mm, 750mm and 1m focal length coated lens with mounting hardware and MS-Tube Kit. Set of lenses coated for operation in NIR (700–1100nm) Set of lenses coated for operation in VIS (400–700nm) Set of lenses coated for operation in UV (250–400nm) Set of all the available lenses for all wavelengths (MS-NIR,VIS and UV Kits combined) and MS-Tube Kit Set of C-Mount tubes to mount lenses to the MS-1780. Includes 100mm, 50mm, 40mm, 25mm, 10mm and 50-90mm adjustable focusing tube ModeScan 1780 Accessories UV Lens Kit (MS-UV kit) UV200 UV250 UV350 UV500 UV750 UV1000 MS-VIS Lens Kit (MS-VIS kit) VIS200 VIS250 VIS400 VIS500 VIS750 VIS1000 MS-NIR Lens Kit (MS-NIR kit) NIR200 NIR250 NIR400 NIR500 NIR750 NIR1000 Extension and Focusing Tubes CM-EXT100 CM-EXT50 CM-EXT40 CM-EXT25 CM-EXT10 FOCTUBE20-30 FOCTUBE30-50 FOCTUBE50-90 MS-TUBE Kit PH00111 PH00104 PH00097 PH00118 PH00127 UV lenses are all fused silica plano-convex and coated for UV wavelengths 250-400nm 200mm focal length lens 250mm focal length lens 350mm focal length lens 500mm focal length lens 750mm focal length lens 1000mm focal length lens Visible (VIS) lenses are all BK 7 plano-convex and coated for visible wavelengths 450–650nm 200mm focal length lens 250mm focal length lens 400mm focal length lens 500mm focal length lens 750mm focal length lens 1000mm focal length lens NIR lenses are all BK-7 Plano-convex and coated for NIR wavelengths 700-1100nm 200mm focal length lens 250mm focal length lens 400mm focal length lens 500mm focal length lens 750mm focal length lens 1000mm focal length lens PH00097 PH00098 PH00099 PH00100 PH00101 PH00102 PH00103 PH00104 PH00105 PH00106 PH00107 PH00108 PH00109 PH00110 PH00111 PH00112 PH00113 PH00114 PH00115 PH00116 PH00117 100mm long C-Mount extension tube for mounting lenses outside ModeScan 1780 Box 50mm long C-Mount extension tube for mounting lenses outside ModeScan 1780 Box 40mm long C-Mount extension tube for mounting lenses outside ModeScan 1780 Box 25mm long C-Mount extension tube for mounting lenses outside ModeScan 1780 Box 10mm long C-Mount extension tube for mounting lenses outside ModeScan 1780 Box C-Mount fine thread focus tube with 20–30mm adjustable length for focus of lenses mounted to extension tubes C-Mount fine thread focus tube with 30–50mm adjustable length for focus of lenses mounted to extension tubes C-Mount fine thread focus tube with 50–90mm adjustable length for focus of lenses mounted to extension tubes Tube Kit for MS-1780 PH00119 PH00120 PH00121 PH00122 PH00123 PH00124 3.6.1.2 Beam Analysis MS-NIR Kit MS-VIS Kit MS-UV Kit MS-YAG Kit MS-TUBE Kit PH00125 PH00126 PH00127 191 For latest updates please visit our website: www.ophiropt.com/photonics 01.08.2013 3.6.2 Slit - Based Beam Propagation Analyzer M2 NanoModeScan The NanoModeScan combines the flexibility and speed of the NanoScan with dedicated M2 measurement hardware and software. The NanoModeScan provides an automated measurement of M2 using either the ISO 11146 or the Rayleigh method. The ISO Method software and hardware report the ISO 11146 parameters: ֺֺ ֺֺ ֺֺ ֺֺ ֺֺ ֺֺ Times diffraction limit: M2 Beam propagation factor: K Beam waist size: d0 Beam waist location: Z0 Divergence: θ Rayleigh range: Zr By adding the capabilities of the NanoScan to the ModeScan, the range of possible measurable lasers is greatly expanded and the speed of the measurements dramatically improved. The NanoScan’s software controlled variable scan speed allows the measurement of NanoModeScan both CW and kHz pulsed lasers with any NanoScan scan head, covering the entire wavelength range from UV to FIR. The NanoScan’s rapid beam finding and autoranging speed up the total M2 measurement to ~20 seconds for CW lasers. Both 200mm and 400mm lenses are available to generate the proper artificial waist for the laser source under test. For ease of alignment, there is an entrance iris on the optical axis of the NanoModeScan and a precision alignment stage for horizontal and vertical positioning. 3.6.2 Beam Analysis The ISO 11146 Method The ISO 11146 method for measuring the propagation of a laser source calls for the measurement of the beam diameter for at least 10 positions through the waist created by a test lens inserted in the beam path. Five locations should be within ±1 Rayleigh range of the artificial waist and at least five more points beyond two Rayleigh ranges from this waist. These measurements are then used to compute the laser propagation parameters. Once points are selected properly, the ISO Method is the fastest measurement method and best for volume testing of lasers. The Rayleigh Method The ISO method requires the user to manually select the measurement points, and changing one or two of the selected points can yield different M2 values. The Rayleigh method is completely automated, selecting its own measurement points based on mapping the Rayleigh range of the beam waist. This method is fully discussed in Application Note 230, Fast M2(k-factor) Measures with Photon Beam Profilers. In addition, the Rayleigh method can yield more consistent results for M2 values for lasers that are not exactly like those for which the ISO standard was written, such as fiber lasers, lensed diode lasers, and VCSELs. The NanoScan Difference With the NanoScan-equipped NanoModeScan, all scan heads can measure pulsed beams with repetition frequencies down to 10kHz. Measuring pulsed beams in discussed in the application note Measuring Pulsed Beams with a Slit-Based Profiler. The silicon and germanium detectors will measure less than a milliwatt of power. The pyroelectric detector-equipped NanoScan head can analyze higher power lasers at all wavelengths. The increased dynamic range of the NanoScan enhances the signal to noise ratio of the system and allows a much broader range of laser powers to be analyzed with one instrument setup. 192 01.08.2013 For latest updates please visit our website: www.ophiropt.com/photonics Real-Time Divergence Measurement By monitoring the divergence angle θ, it is possible to make a measurement that will be directly proportional to M2. This enables the adjustment of the laser performance in real time at the NanoScan’s rapid update rate (up to 20Hz). To use this feature, the scan head is moved to a position one geometric focal length from the test lens. Divergence is the beam diameter divided by the focal length, and the measured divergence is equal to M times the embedded divergence. Therefore when the beam diameter at this location is minimized, the divergence is at its minimum and the M2 of the laser should then be optimized. After this real-time adjustment, the full M2 measurement can be done to generate the required parameter values. This method makes the NanoModeScan an even more valuable tool for the final setup of lasers on the manufacturing floor by decreasing the time it takes both to adjust the laser system and to make the measurements required for quality control documentation. NanoModeScan Specifications Optional Lens Minimum Spot Size Computer/Electrical Source Power File Saving and Data Logging AC Power Communication Mechanical (Dimensions in mm) NanoModeScan Linear Stage Photon Motion Controller Removable Light Shield Weight NanoModeScan Linear Stage Photon Motion Controller 500mm 140-170mm 200mm EFL, BK-7 plano-convex, Broadband AR Coated 400mm EFL, BK-7 plano-convex, Broadband AR Coated; UV through long IR lenses available 200mm FL fused silica for UV coated for wavelength of use 350mm FL fused silica for UV coated for wavelength of use 190mm FL IR lens for 10.6μm wavelength See scan head specifications See scan head specifications Data files, ASCII Files 110V, 60Hz standard 220V, 50Hz optional RS-232 Interface or USB to RS-232 adapter required 812 × 102 × 78 273 × 89 × 57 787 × 777 × 110 8.4kg 1.5kg Alignment screen in ModeScan software 3.6.2 Beam Analysis Sensor/Detector Scan head Travel Optical Axis Height Standard Lenses Measurement results screen in ModeScan software 193 For latest updates please visit our website: www.ophiropt.com/photonics 01.08.2013 Ordering Information - NanoModeScan M² Systems All NanoModeScan Systems include (unless otherwise noted): ֺֺ High-resolution scanhead with rotation mount. ֺֺ Two BK 7 lenses and mounts. Standard are 200 and 400mm focal length. ֺֺ Lens coating Choices: - VIS Visible: 430–700nm (not for use with Germanium detector) - NIR Near IR: 650–1000nm - LIR Long IR: 1000–1550nm (not for use with Silicon detector) ֺֺ VLIR: Very long infrared >1550nm. The two glass lenses will not be included but instead credited toward the very long wavelength IR lens or lenses that will require an optional charge (for use with MSP-NS-Pyro/9/5 only). ֺֺ OPTIONAL UV: If ultraviolet application, the two glass lenses will not be included; instead we will send one 200 mm focal length lens coated for wavelength of use. Be sure to specify XXX wavelength when ordering. Item NanoModeScan M2 Systems USB MSP-NS-Si/9/5 USB MSP-NS-Ge/9/5 USB MSP-NS-Pyro/9/5 MSP-NS-Pyro/20/25 3.6.2 3.0 Beam Analysis USB MSP-HPNS/10/5 NanoModeScan Accessories LENS 200 UV-XXX LENS 400 UV-XXX LENS 190 10.6 LENS 100 VIS LENS 100 NIR LENS 100 LIR 1740 LENS MNT CUSTOM LENS Model 1740 1740 LENS PREP 1740 TRNG Lens 400 2um Lens 200mm VIS Lens 400mm VIS Lens 200mm NIR Lens 400mm NIR Lens 200mm LIR lens 400mm LIR Description P/N Model 1740 ModeScan with NanoScan Silicon (Si ) Detector 9mm aperture 5μm slits Si detector, 63.5mm diameter head, 9mm entrance aperture, and matched pair of 5.0μm wide slits. Use from 190 to 1000nm wavelengths. Model 1740 ModeScan with NanoScan Germanium (GE) Detector 9mm aperture 5.0μm slits. Germanium detector, 63.5mm diameter head, 9mm entrance aperture, and matched pair of 5.0μm wide slits. Use from 700nm to 1.8μm wavelength. Model 1740 ModeScan with NanoScan Pyroelectric Detector 9.0mm aperture 5μm slits. Pyroelectric detector, 63.5mm diameter head, 9mm entrance aperture, and matched pair of 5µm wide slits. Model 1740 ModeScan with large aperture NanoScan scanhead with 20mm Pyroelectric Detector, 25um slits 100mm diameter head, 20mm entrance aperture and matched pair of 25um wide slits. Model 1740 ModeScan with HP NanoScan scanhead with 9mm Pyroelectric Detector 5μm slits,100mm diameter head, 9 mm entrance aperture, and matched pair of 5μm wide slits; scanhead is fancooled. PH00233 Optional 200mm quartz lens for use between 190–400nm wavelengths. Optional 400mm quartz lens for use between 190–400nm wavelengths. Optional 7.5-inch focal length lens for use at 10.6µm wavelength. Optional 100 mm focal length lens for use 400–700nm wavelength. Optional 100 mm focal length lens for use 650–1000 nm wavelength. Optional 100 mm focal length lens for use 1000–1550nm wavelength. Lens mount for users wanting to use their own 25mm diameter lens. Specify wavelength, focal length ModeScan Rail w/o scan head ModeScan custom lens ModeScan onsite operation training Optional 400mm focal length lens for use at @2µm wavelength Optional 200mm focal length lens for use 400-700nm wavelength Optional 400mm focal length lens for use 400-700nm wavelength Optional 200mm focal length lens for use 650-1000nm wavelength Optional 400mm focal length lens for use at 650-1000nm wavelength Optional 200mm focal length lens for use at 1000-1550nm wavelength Optional 400mm focal length lens for use at 1000-1550nm wavelength PH00090 PH00091 PH00092 PH00093 PH00094 PH00095 PH00075 PH00088 PH00074 PH00076 PH00077 PH00224 PH00237 PH00238 PH00239 PH00240 PH00241 PH00242 194 01.08.2013 For latest updates please visit our website: www.ophiropt.com/photonics PH00234 PH00235 PH00218 PH00236 3.7 Integrated Laser Performance Measurements 3.7.1Beam Cube - Beam Profiling/Power/Focus Spot Position/Temporal Pulse Shape Features ֺֺ Monitor all important beam parameters to keep tight control over process ֺֺ Beam Cube measures beam profile, focal spot position, temporal pulse shape and power, up to 150W ֺֺ Portable - can be moved from laser to laser to monitor all lasers in plant ֺֺ For measuring at or near focal spot 3.7.1 Beam Analysis Beam Cube 195 For latest updates please visit our website: www.ophiropt.com/photonics 01.08.2013 An integrated laser beam measurement/profiler system for pulsed and CW lasers. System contains an SP620 camera with variable attenuator for beam profiling. A thermopile power head for power measurement and a high speed photodiode for temporal pulse width measurement. Includes BeamGage Standard beam profiling software, and a USBI power meter w/StarLab software. An optional USB digital oscilloscope is available for temporal measurement of pulsed lasers, order p/n SPE10008. Or a standard laboratory oscilloscope can be used. Diagnostic Capabilities: Spatial Beam Profile The Beam Cube shows you the intensity profile of your beam in real time and allows you to adjust your laser resonator and beam delivery optical system for optimum beam quality on line. You can also measure the cross section at any point as shown. The illustration shows the intensity distribution of a pulsed Nd:YAG laser where the X and Y profiles are taken at the cursor lines which can be placed anywhere on the beam. This data can be saved, brought back and manipulated at any time so you can compare the present profile with a reference. The system has an exclusive optical design making it easy for you to adjust the intensity to get the optimum picture by just pushing and pulling the attenuating filter adjustment levers. The beam profile can also be shown in a three-dimensional form which can be rotated to different angles and elevations. 3.7.1 Beam Analysis Temporal Pulse Shape The temporal profile of laser pulses, important in obtaining consistent process results, can now be easily monitored. Shown to the right is the pulse shape of the same pulsed Nd:YAG laser with 2ms pulses. It is being measured with a PC oscilloscope available as an accessory. You can display the pulse shape alone or together with the beam profile on your PC. Plug the Beam Cube output into an oscilloscope to observe the temporal pulse shape of your laser beam. 196 01.08.2013 For latest updates please visit our website: www.ophiropt.com/photonics Average Laser Power With the Ophir USB Interface between the Beam Cube unit and your PC or laptop, you can measure the average power of your laser to an accuracy of ± 3%. Energy per Pulse and Frequency Energy sensor inside the Beam Cube is able to measure the energy per pulse and the frequency of the laser to high accuracy. With the USB Interface you can display this on your PC or laptop screen. Statistics The Beam Cube with USB Interface is able to record and store an unlimited number of points in your PC. The software provided has a number of ways of displaying the statistics of the data. Schematic setup of a Beam Cube system USB Interface Laptop or desktop PC screen showing spatial beam profile, temporal profile, power, energy and frequency PC scope unit (optional) Simplified Schematic of Beam Cube System Host Laser System 3.7.1 Beam Analysis USB2 port Input from laser bending mirror and focusing lens Beam Cube Beam Cube Input lens Adjustment rods CCD beam profiler Beam splitter assembly (simplified) Variable attenuator Optical trigger for automatic synch with pulsed lasers and temporal profile RP power/energy/temporal profile head 197 For latest updates please visit our website: www.ophiropt.com/photonics 01.08.2013 Specifications General Max and min average power Maximum average power density (a), (c) Max and min energy Maximum energy density pulse width and repetition rate at 10ms entrance window vs. pulse 2ms width 0.5ms Cooling System Dimensions Spectral Range Beam profiler unit Camera PC interface Shutter speeds Gain control Frame rate at 640x480 pixel ROI Software features 3.7.1 Beam Analysis Minimum PC system requirements Intensity adjustment System optical performance Field of view Maximum beam size Beam reduction or expansion Resolution Power / energy / temporal profile unit Temporal pulse shape response time into oscilloscope Software functions with USB Interface connected to PC or laptop Data logging Beam Cube 1W to 100W continuous and to 150W for up to 1 min 4kW/cm2 at entrance window 20mJ (b) to 100Joules max energy density 20J/cm2 5J/cm2 1.5J/cm2 Conduction cooled 22cm L x 16cm W x 14cm H 400 - 1100nm (calibrated for 1064nm) SP620U 1600x1200 pixel camera with 4.4µm spacing USB2 Continuously variable 1/frame rate to 1/6,000, manual or automatic 0dB to 27dB in ~700 steps (each step is ~0.035dB). Manual or automatic control. Std Beam Cube: 60Hz. Auto synch with laser Beam Cube 620: 20Hz. Auto synch with laser Automatic gain and shutter control. Peak and Centroid position tracking. 2D and 3D contour map. Sophisticated noise and background control. Best fit to gaussian or top hat profile 3D display viewable from any angle or elevation. Store and recall screens in single or video fashion. 3 different measures of beam width, of peak, 4 sigma and 90/10 knife edge. Save numerical data files of profiles. Log data with time. Full on line instructions and help. Fully flexible screen format. Pentium-4 2GHz, 256 MB Memory, Operating system, Windows XP Service Pack 2 or Vista 32. Continuously variable filters actuated from outside the unit. ±6° Ø22mm at entrance for converging beam, Ø7mm for collimated beams Expanded 2-3X . With no lens 1X ~5µm 200µs resp. time. Maximum peak power 1000W. average power, statistics Can send unlimited number of points in real time to PC via USB Interface at >1000 point/s. Windows software provided for data analysis. Notes: (a) The power density limitation applies to any surface that the beam hits. For Beam Cube, since the object plane is outside the instrument, focal spots of much higher power density can be imaged as long as the power density limit on the optical surfaces is not exceeded. Notes: (b) The Beam Cube will not resolve pulses of energy below 20mJ unless the pulse rate is high. If the energy deposited in 1/50th of a second exceeds 20mJ, then the unit will be able to show the pulses even though the individual energies are below 20mJ. Notes: (c) If the beam power or energy density on the entrance window exceeds specifications, the window can be removed and not used, assuming that the power and energy density on the first beam splitter is below the damage threshold. Ordering Information Item Beam Cube 620 -50mm lens assembly Optional PC oscilloscope Description BeamCube system for beam profiling and power and energy. Optional PC oscilloscope for measuring pulse change for pulsed lasers. Comes with 100mm lens assembly. Uses SP620 beam profiling camera. Optional -50mm lens assembly for Beam Cube 1MHz virtual oscilloscope for Beam Cube or BA500 to turn your PC into an oscilloscope displaying the temporal pulse shape. Uses PC or laptop USB port 198 01.08.2013 For latest updates please visit our website: www.ophiropt.com/photonics Ophir P/N SP90323 SPZ08255 SPE10008 3.8 High-Power Applications 3.8.1 High-Power NanoScan Photon’s High-Power NanoScan can measure focused CO2 laser beams up to 5 kilowatts. The High-Power NanoScan is equipped with a pyroelectric detector with copper slits and drum. A cooling fan mounted on the scan head body provides additional heat management. With the new “peak connect” algorithm and the software controlled variable scan speed, the High-Power NanoScan is ideal for measuring lasers operating with pulse width modulation (PWM) power control. Measurement of Q-switched lasers and other higher frequency pulsed lasers is also possible using this feature. What Can be Measured? Measuring high-power beams can be tricky. The lasers have the potential to damage the scan head, and any reflected light can be dangerous to both the operator and the surroundings. The High-Power NanoScan can measure these beams because it uses a combination of highly reflective components with high thermal dissipation capability. It is important to manage the reflected beam so that it neither reenters the laser cavity nor sends stray beams into the surrounding area. The scan head is designed to make short duration measurements to avoid excessive heating of components. The head should be only in the incident beam for 10 to 60 seconds depending on the power levels to prevent excessive heating of the components. The High-Power NanoScan scan head has been shown to be able to handle power densities of 3.2MWcm-2 at 10.6µm, the power density of a 200µm beam at 1kW. At the shorter wavelengths of the other common industrial lasers, Nd:YAG and DPSS, the upper limits are a little less, due to the slightly lower reflectivity of the components at wavelengths around 1000nm. Visible and UV lasers can also be measured, but these will have lower limits yet. The chart below shows the damage thresholds for pulsed beam energies for the three wavelength regimes. The lines represent the maximum energies per pulse for various spot sizes that correspond to 5J/cm2 for the 3µm to 100µm wavelengths, 2.5J/cm2 for the 700nm to 3µm range, and 250mJ/cm2 for the UV-Visible range from 190nm to 700nm. When operating with pulsed lasers, calculate the energy per pulse to ensure that the values fall below these lines for the wavelength of the laser. Operation above these values will likely cause damage to the scan head apertures. NanoScan Rotation Rate (Hz) Slit Speed (µm/msec) Data Points per Profile Pulse Frequency (kHz) 0.5 1 2 3 4 5 6 7 8 9 10 11 12 13 14 15 16 17 18 19 20 21 22 23 24 25 50 100 150 Large Drum (HP) 1.25 2.50 5.00 233.25 466.50 933.01 15 15 15 Minimum Beam Diameter in μm 6998 13995 N/A 3499 6998 13995 1749 3499 6998 1166 2333 4665 875 1749 3499 700 1400 2799 583 1166 2333 500 1000 1999 437 875 1749 389 778 1555 350 700 1400 318 636 1272 292 583 1166 269 538 1077 250 500 1000 233 467 933 219 437 875 206 412 823 194 389 778 184 368 737 175 350 700 167 333 666 159 318 636 152 304 608 146 292 583 140 280 560 70 140 280 35 70 140 23 47 93 3.8.1 Beam Analysis Minimum Beam Size per Pulse Frequency 10.00 1866.01 15 N/A N/A 13995 9330 6998 5598 4665 3999 3499 3110 2799 2545 2333 2153 1999 1866 1749 1646 1555 1473 1400 1333 1272 1217 1166 1120 560 280 187 High-Power NanoScan with cooling fan 199 For latest updates please visit our website: www.ophiropt.com/photonics 01.08.2013 High-Power NanoScan Configurations Detector Type Power Range Wavelength Aperture Slits Scan Head Size Pyroelectric ~1W - ~5W upper limit dependent on wevelength ~1W - ~5W upper limit dependent on wevelength 190nm - > 100μm 9mm 5μm 100mm 190nm - > 100μm 20mm 10μm 100mm Pyroelectric Large Aperture High-Power NanoScan Ordering Information - High-Power NanoScan All High-Power NanoScan Systems Include: Fan cooled scanhead. For use at wavelengths from 200nm to greater than 20μm. Maximum power capacity is dependent on wavelength and spot size. Refer to operating space charts for more information. Slits and scan drum are highly reflective and user must send reflected energy into appropriate dump. A direct back reflection may cause laser cavity to oscillate or if not properly directed may cause damage. User must handle all back-reflected energy from laser. NanoScan Integrated Software package. Software for use with NanoScan under Microsoft Windows (32 Bit version only) 2000 Professional, XP Professional, Vista and windows 7 (32/64) operating systems. Measurements include: spot size, position and position difference information and laser profiles. Includes “peak connect” and software control of scan speed for measurement of pulsed and pulse width modulated (PWM). Software includes ability to capture and record bursts of data and ActiveX automation. USB 2.0 controller replaces the PCI bus card and allows NanoScan to interface to USB 2.0 port of laptop or desktop PC. Performance of Certificate of Calibration traceable to National Institute of Standards and Testing (NIST) to better than ±3%. 3.8.1 Beam Analysis Pyroelectric Detectors Item Description NanoScan Pyroelectric Detector 9mm aperture 5micron slits. High-resolution head featuring pyroelectric detector, 63.5mm diameter head with rotation mount, 9mm entrance aperture, and matched pair of 5µm wide slits. Use for wavelengths from 190nm to >20µm. This model does not include a cooling fan USB PH00025 USB NS-PYRO/9/25 NanoScan Pyroelectric Detector 9mm aperture 25micron slits. High-resolution head featuring pyroelectric detector, 63.5mm diameter head with rotation mount, 9mm entrance aperture, and matched pair of 25μm wide slits. Use for wavelengths from 190nm to >20μm. This model does not include a cooling fan. PH00228 USB NS-PYRO/20/25 NanoScan Large Area Pyroelectric Detector 20mm aperture 25micron slits. High-resolution head featuring pyroelectric detector, 100mm diameter head with rotation mount, 20mm entrance aperture, and matched pair of 25micron wide slits. Use for wavelengths from 190nm to >20micron. This model does not include a cooling fan. USB PH00026 USB NS-PYRO HP/20/10 High-Power NanoScan scanhead with 20mm Pyroelectric Detector 10μm slits for use with higher power beams. High-resolution profiler featuring pyroelectric detector, 100mm diameter scanhead with rotation mount, 20 mm entrance aperture, and matched pair of 10-μm wide slits. Can measure spots 50 μm and larger (1/e2 diameter) directly. Works with CW and pulsed beams with rates greater than 2kHz. Actual minimum pulse rate is dependent on beam size and scan rate. USB High-Power NanoScan scanhead with 9mm Pyroelectric Detector 5μm slits for use with higher power beams. High-resolution profiler featuring pyroelectric detector, 100mm diameter scanhead with rotation mount and matched pair of 5-μm wide slits. Use to measure spots 20μm and larger (1/e2 diameter) directly. Works with CW and pulsed beams with rates greater than 2kHz. Actual minimum pulse rate is dependent on beam size and scan rate. USB PH00027 Head only NanoScan-Pyro 9mm aperture 5µm slits Head only NanoScan-Pyro 9mm aperture 25μm slits Head only NanoScan-Pyro 20mm aperture 25µm slits Head only High-Power NanoScan 20mm aperture 10µm slits Head only High-Power NanoScan 9mm aperture 5µm slits PH00041 PH00243 PH00042 PH00043 PH00044 USB NS-PYRO HP/9/5 NH-PYRO/9/5 NH-PYRO/9/25 NH-PYRO/20/25 NH-HP-NS/20/10 NH-HP-NS/9/5 200 01.08.2013 P/N USB NS-PYRO/9/5 For latest updates please visit our website: www.ophiropt.com/photonics PH00028 3.8.2 High Power - Laser Profiler Kits for Nd:YAG ֺֺ ֺֺ ֺֺ ֺֺ ֺֺ ֺֺ A portable solution for medium power lasers Up to 500W Nd:YAG Up to 31mm beam widths (16mm 1/e2 width) Easy operation - level, set and shoot Optimize beams in real-time Diagnose problems quickly The LPK-YAG Beam Profiler Kit consist of an A/R coated reflecting wedge, ND filters, beam telescope to reduce larger beams, a CCD camera, and BeamGage software. The kit is designed to be conveniently placed in a horizontal beam, or under a down directed beam, to measure raw beam characteristics & stability. The user must safely handle the 90 to 98% of the beam that passes through the wedge. A PC style computer is required but not included. See the BeamGage section for software features and calculations. See the camera section for specifications. Model Beam Reduction Beam Sizes Wavelength Type of Attenuator Camera LPK-YAG-2.5-FW, LPK-YAG-2.5-USB LPK-YAG-7-FW, LPK-YAG-7-USB LPK-YAG-16-FW, LPK-YAG-16-USB PK-YAG-16-18200 1X 3X 10X 10X 0.1 - 2.5mm 1.0 - 7.0mm 3.0 - 16mm 3.0 - 16mm 1064nm 1064nm 1064nm 1064nm 1% beam splitter + assorted attenuators 1% beam splitter + assorted attenuators 1% beam splitter + assorted attenuators 1% beam splitter + assorted attenuators Si CCD Si CCD Si CCD Si CCD Ordering Information Item LPK-YAG-2.5-USB LPK-YAG-7-USB LPK-YAG-16-USB LPK-YAG-16-18200 Description BeamGage software, SP620U camera, LBS-100-YAG beam splitter/attenuator, base plate, miscellaneous hardware. Suitable for beams 0.1 to 2.5mm.* BeamGage software, SP620U camera, LBS-100-YAG beam splitter/attenuator, 3X telescope, base plate, miscellaneous hardware. Suitable for beams 1.0 to 7mm.* BeamGage software, SP620U camera, LBS-100-YAG beam splitter/attenuator, 10X telescope, base plate, miscellaneous hardware. Suitable for beams 3.0 to 16mm.* BeamGage software, Gige 18200 camera bundled with BeamGage Enterprise , LBS-100-YAG beam splitter/ attenuator, 10X telescope, base plate, miscellaneous hardware. Suitable for beams 3.0 to 16mm.* P/N SP90168 SP90169 SP90170 3.8.2 3.0 Beam Analysis LPK-YAG-16 SP90328 * Maximum beam size assumes zero diffraction from the wings of the beam. Beams of up to 1.5X the maximum size can be applied with minimal diffraction. Beams of up to 2X the above size can be applied, but noticeable diffraction will occur. 201 For latest updates please visit our website: www.ophiropt.com/photonics 01.08.2013 3.8.3 High Power - Laser Profiler Kits for CO2 ֺֺ ֺֺ ֺֺ ֺֺ A portable solution for medium power lasers Up to 1000W CO2 Up to 31mm beam widths (16mm 1/e2 width) Level, set and shoot - Easy operation The LPK-CO2 Beam Profiler Kits consist of an A/R coated reflecting wedge, CaF2 filters, beam telescope to reduce larger beams, Firewire Pyrocam camera, BeamGage software computer and interface card if required. The kit is designed to be conveniently placed in a horizontal beam, or under a down directed beam, to measure raw beam characteristics & stability. The user must safely handle the 95 to 99.5% of the beam that passes through the wedge. A PC style computer is required but not included. See the BeamGage Software section for software features and calculations. See the table below for specifications. 3.8.3 3.0 Beam Analysis LPK-CO2-16 Model Beam Reduction Beam Sizes Wavelength Type of Attenuator Camera LPK-CO2-6.4-0.5 LPK-CO2-6.4-5.0 LPK-CO2-16-0.5 LPK-CO2-16-5.0 1X 1X 3X 3X 1.0 - 6.4mm 1.0 - 6.4mm 3.0 - 16mm 3.0 - 16mm 10.6µm 10.6µm 10.6µm 10.6µm 0.5% beam splitter + assorted attenuators 5% beam splitter + assorted attenuators 0.5% beam splitter + assorted attenuators 5% beam splitter + assorted attenuators Pyrocam III Pyrocam III Pyrocam III Pyrocam III Ordering Information Item LPK-CO2-6.4-0.5 LPK-CO2-6.4-5.0 LPK-CO2-16-0.5 LPK-CO2-16-5.0 Description BGS-PC-PIII software, Pyrocam III with chopper (PY-III-C-B-10.6), LBS-100-IR-0.5 beam splitter/attenuator, base plate, miscellaneous hardware. Suitable for beams 1.0 to 6.4mm.* BGS-PC-PIII software, Pyrocam III with chopper (PY-III-C-B-10.6), LBS-100-IR-5.0 beam splitter/attenuator, base plate, miscellaneous hardware. Suitable for beams 1.0 to 6.4mm.* BGS-PC-PIII software, Pyrocam III with chopper (PY-III-C-B-10.6), LBS-100-IR-0.5 beam splitter/attenuator, 3X telescope, base plate, miscellaneous hardware. Suitable for beams 3.0 to 16mm.* BGS-PC-PIII software, Pyrocam III with chopper (PY-III-C-B-10.6), LBS-100-IR-5.0 beam splitter/attenuator, 3X telescope, base plate, miscellaneous hardware. Suitable for beams 3.0 to 16mm.* P/N SP90075 SP90076 SP90077 SP90078 * Maximum beam size assumes zero diffraction from the wings of the beam. Beams of up to 1.5X the maximum size can be applied with minimal diffraction. Beams of up to 2X the above size can be applied, but noticeable diffraction will occur. 202 01.08.2013 For latest updates please visit our website: www.ophiropt.com/photonics 3.8.4 High Power - ModeCheck® - A New Method to Assure the Performance of High Power CO2 Lasers ֺֺ ֺֺ ֺֺ ֺֺ ֺֺ ֺֺ Beam Profiler for collimated 50W-500KW, 10.6um wavelength, beam width up to 30mm. Quality Cutting, Marking, Drilling & Ablating Require More Than Consistent Laser Power Instantaneously “see” and measure the beam - reduce set-up time between jobs Real-time “mode burns” - eliminate hazardous acrylic vapors Optimize laser efficiency - reduce cost per part Predict laser preventative maintenance - increase manufacturing efficiency ModeCheck is designed for the industrial parts manufacturer to reduce the time it takes to change over between different jobs. The user can quickly place the ModeCheck in front of the laser and see and measure, in real-time, the laser beam profile to confirm optimal laser performance. In addition, and when used periodically, the user can compare measurement changes from the same set-up and make necessary laser adjustments, keeping the laser output constant for the same job from day-to-day. Over time the user will be able to see and measure laser degradation to predict and advance schedule down-time needed for periodic maintenance. Laser Beam In Pass-Through Beam Out Measurements: In addition to both 2D and 3D graphical image display and save, the following measurements are made from each image: ֺֺ Beam Widths and Diameters ֺֺ Beam Position Stability ֺֺ Power Density Peak ֺֺ Beam Centroid Location ֺֺ Elliptical Analysis with Major Axis Orientation It’s just this easy. 1. Remove Focusing optic 2. Locate the beam center with pointing beam or similar device 3. Place ModeCheck in beam center 4. Turn on Laser 5. Instantly see, measure and electronically store the beam characteristics Optional Accessories One must manage the pass-through laser beam by collecting the beam using either a power meter or beam dump. We recommend using a power meter as the additional measurement information will assist in managing laser optimization. Note that any beam dump or power meter large enough to handle 5kW will require water cooling. There are holes on the bottom of ModeCheck for mounting the Power Meter Head or Beam Dump. 3.8.4 3.0 Beam Analysis ModeCheck eliminates operator exposure to acrylic mode burn hazards while improving product quality and manufacturing efficiency. A ruggedized storage/carrying case is highly recommended for safe and efficient handling. The ModeCheck Lens Adapter (MLA) is an option that will enable a ModeCheck to recollimate a focused CO2 laser beam. The advantage of using this adapter is that the focusing head of the machine does not have to be removed, which is the normal case for a ModeCheck without this adapter. The disadvantage is that the ModeCheck must be positioned further from the output head in order to properly recreate the collimated beam profile. The recollimating lens must be supplied by the user and must be the same lens that is used on the lasers cutting head. (See application note: SP90329). ModeCheck makes instantaneous beam measurements along with graphically displaying both the 2D and 3D power density distribution A PC is required to run the ModeCheck imaging software. The camera is powered over the USB cable that connects the computer to ModeCheck. 203 For latest updates please visit our website: www.ophiropt.com/photonics 01.08.2013 Specifications Model ModeCheck Laser Input Power Input Clear Aperture Beam Width Pick-off Percent Damage Threshold Camera 50-5000 Watts 50mm (~2”) 5mm - 30mm 0.5%, 1%, 2%, 4%, 10% sampling wands; user replaceable 27 - 36 W/cm2; See graph 1/3” format CMOS, 640x480, 6µm pixel, 8bit, CS-mount, USB2 25mm C-mount Built in Fan (water required for the optional beam dump or optional power meter sensor) LED array ModeCheck v5.0 Input: 100-240 Vac, 50-60Hz, 1.5A Output: 12Vdc, 5.0A, w/power jack, UL listed and CE compliant universal power supply included Camera is powered over the USB port 9.5” x 13” x 6.7” 242mm x 330mm x 171mm Not including handle and cabling or any options ~8 lbs 3.6kg Water cooled and rated for 5kW total power 5000W-SH; up to 5kW total power 10kW-SH-V2; up to 10kW total power Provided by user; Vista-32 or Windows 7 is required Unit meets CE and RoHS requirements Lens Cooling UV Light Source Software Power Requirements Dimensions Weight Beam Dump (optional) Power Meter (optional) Laptop Computer Compliance The optional rugged case is recommended for safe storage in an industrial facility SamplingWand Wand % % Sampling 5000 0.5% 4750 4500 4500 1% 2% 4% Damage Region 4250 4000 4000 3500 3250 3000 2750 2500 2250 10% 2000 1750 1500 1250 1000 3750 3500 Beam Power in Watts 3750 3250 3000 2750 2500 2250 10% 2000 1750 1500 1250 1000 750 750 500 500 Safe Operation 250 0 0.5% 4750 4% Beam Power in Watts Beam Power in Watts Beam Power in Watts 2% Damage Region 4250 3.8.4 3.0 Beam Analysis 1% Sampling % SamplingWand Wand % 5000 0 5 10 15 20 25 30 35 Beam Diameter in mm Damage and Saturation Power vs Beam in Dia mm Beam Diameter Safe Operation is to the Right of the Solid line. Damage and Saturation Power vs Beam Dia Image Saturation is approximately the Dashed line. Chose a sampling Wand that contains your beams maximum power and minimum diameter to be Safe Operation 250 40 0 0 5 10 15 20 25 Beam Diameter in mm 30 35 40 Damage and Saturation Beam Diameter in mm Power vs Beam Dia Damage and Saturation Power vs Beam Dia near but belowis theto dashed for safe best Safe Operation the line Right ofand the Solid line. Image Saturation beam viewing. is approximately the Dashed line. Chose a sampling Wand that contains your beams maximum power and minimum diameter to be near but below the dashed line for safe and best beam viewing. Ordering Information Item MODECHECK CO2-5kW Description ModeCheck, CO2 sampler for 10.6µm beams up to 5kW, beam width up to 30mm; includes 2 user selectable wands from selection below 0.5% wand 0.5% beam wand sampler, see damage and saturation chart 1% wand 1% beam wand sampler, see damage and saturation chart 2% wand 2% beam wand sampler, see damage and saturation chart 4% wand 4% beam wand sampler, see damage and saturation chart 10% wand 10% beam wand sampler, see damage and saturation chart Beam Dump; 5kW Beam dump for up to 5kW continuous, includes mounting bracket, requires continuous water flow. 5000W-SH Power sensor, measure CO2 power up to 5000W; water cooling needed Mounting Hardware, 5000W detector Mounting hardware for 5kW power sensor. Required when ordering the 5000W-SH sensor 10kW-SH-V2 Power sensor, measure CO2 power up to 10,000W; water cooling needed Mounting Hardware, 10,000W detector Mounting hardware for 10KW power sensor. Required when ordering the 10kW-SH-V2 sensor ModeCheck storage/carrying case Ruggedized ModeCheck storage/carrying case Collimating 2” Lens Adapter ModeCheck Lens Adapter (MLA) enables a ModeCheck to recollimate a focused CO2 laser beam. MLA should be ordered with the ModeCheck so that it can be factory installed. 204 01.08.2013 For latest updates please visit our website: www.ophiropt.com/photonics P/N SP90211 SP90324 SP90325 SP90326 SP90327 SP90283 SP90224 7Z02119 SP90212 7Z02645 SP90213 SP90227 SP90329 3.8.5 High Power - In-Line Industrial Beam Monitoring 3.8.5.1 II-VI-CO2 Series ֺֺ ֺֺ ֺֺ ֺֺ ֺֺ II-VI-CO2-BS-35 An in-line industrial laser beam monitoring solution Rapidly tune lasers for best performance for each job Monitor fluctuations while processing Optimize beams in real-time Diagnose faults quickly The II-VI-CO2-BS-35 Profiler Beam Sampler was developed by II-VI, a leading industrial optics supplier, specifically to enable measurement and viewing of high power industrial CO2 beams. Spiricon and II-VI have teamed up to provide solutions to vexing laser beam stability, alignment, tuning, and optimizing difficulties. The II-VI-CO2-58 series Profiler consists of a set of turning mirrors that direct the beam to a sampling beam splitter, and then returns it to the original in-line path. After passing through the splitter, the sampled beam passes through additional attenuation and a beam telescope to size the beam for a Pyrocam III infrared camera. The camera is connected to a PC computer through a Firewire interface. A Basic Image Viewer presents 3D isometric plots, 2D color contour plots and grayscale, among other views. Add BGS-PC-PIII beam analyzer software to access many quantitative analysis, computations and charting functions. The II-VI-CO2-58 Series Profiler is similar to the BS model but the original beam is not returned "in-line". Both a horizontal and vertical entry model are available. The Pyrocam III with BGS-PC software must be ordered separately. II-VI-CO2-58-D8-WC-V Top View 3.8.5.1 3.0 Beam Analysis II-VI-CO2-58 II-VI-CO2-58-D8-WC-V Side View Model Wavelength Power Beam Width Beam Input Cooling II-VI-CO2-BS-35 II-VI-CO2-58-D8-WC-H II-VI-CO2-58-D8-WC-V 10.6µm 10.6µm 10.6µm up to 8kW up to 10kW up to 10kW 20mm 29mm 29mm Vertical or Horizontal Horizontal Vertical Requires external water Requires external water Requires external water Ordering Information Item II-VI-CO2-BS-35 II-VI-CO2-58-D8-WC-H II-VI-CO2-58-D8-WC-V Description II-VI-CO2 in-line sampler, for 10.6µm beams up to 8 kW. Beam width up 20 mm. Pyrocam III Beam Profiler System required (ordered separately). Recommended model: PY-III-C-A or PY-III-C-B with a Germanium 10.6μm window. BGS-PC-PIII laser beam analyzer software included with Pyrocam system CO2 laser beam sampler for lasers up to 10kW. Input Clear Aperture is 58mm. Requires cooling water. Horizontal entry. Built-in 8X beam reducer and adapters for Pyrocam III. Order Pyrocam III separately. BGS-PC-PIII laser beam analyzer software included with Pyrocam system Same as above but with Vertical Entry P/N SP90062 SP90160 SP90161 205 For latest updates please visit our website: www.ophiropt.com/photonics 01.08.2013 3.9 Goniometric Radiometers LD 8900, LD 8900R Far-Field Profilers Profiling divergent light sources presents many challenges, but Photon’s far-field profilers characterize the angular radiation intensity of light simply and accurately in real time. Both the LD 8900 and LD 8900R (wide dynamic range Goniometric Radiometer) provide full 3-dimensional measurements of the far-field pattern in m inutes or less, with far better resolution than a CCD camera. The LD 8900 farfield profiler provides direct real-time far-field measurements with >24dB dynamic range, while the wide dynamic range LD 8900R has a dynamic range of >36dB, which provides greater detail in the “tails” of the far-field pattern. Both models have an angular sampling resolution of 0.055º and a field-of-view of ±72° (144°), and are ideal for characterizing the light flux from many sources, including VCSELs, laser diodes (LDs), optical fibers, optical waveguides, and more. With the LD 8900R, measurement of the mode field d iameter of optical fiber is possible in real time with greater than 5% accuracy. The LD 8900 and the LD 8900R are available with either a silicon or InGaAs detector and have a standard entrance aperture of 2mm, with an optional 10mm entrance aperture for use with larger sources such as LEDs and LD bars. LD 8900 and LD 8900R complete systems include: ֺֺ ֺֺ ֺֺ ֺֺ ֺֺ ֺֺ The Scan Unit The Motion Control Module Goniometric Radiometer Acquisition and Analysis Software for Microsoft Windows operating systems PCI Interface Box Power and instrument cables An optional semi-custom source mount, specifically designed to meet your application needs, can be quoted upon request for either the LD 8900 or the LD 8900R 3.9 Beam Analysis Mode Field Diameter in Real Time with LD 8900R The LD 8900R allows for real-time measurements of Mode Field Diameter (MFD) with an accuracy of ±5%* for a nominal 10µm single-mode fiber. Mode Field Diameter (MFD) of single-mode optical fiber is measured using the methodology described in the Telecommunication Industry Association/ Electronic Industries Association (TIA/EIA) Standard FOTP-191. Specifically, the MFD is calculated using the Petermann II integral, with data sampled at angular resolution of 0.055° and collected over an angular extent of ±72° (144° viewing angle). *If greater accuracy is required, Photon’s LD 8900HDR is specifically designed to measure MFD and Aeff to greater than 0.5% Polar View (left); 3D View (top); Beam Statistics (bottom) with LD 8900R Windows Showing Unifomity of a Laser Diode Topographical View - LD 8900R Laser Diode Diffraction Rings 206 01.08.2013 For latest updates please visit our website: www.ophiropt.com/photonics LD 8900/LD 8900R System Specifications Communications 84mm 1000µm (options available) 2mm standard (optional 1cm) ±72° (144 degrees) 1, 2, 10, 20, 50, 100, or 200 0.055 degrees, 3241points/scan 320-1100nm 800-1700nm 190-~1100nm 900 W/cm² 1 J/cm² 10’s of µW to 10’s of W* 1µW to 1W** Contact Factory Contact Factory CW or Pulsed (rep rates >10kHz) FWHM, 5%, 13.5%, 2 user-specified clip levels FWHM, 5%, 13.5%, 2 user-specified clip levels FWHM, 5%, 13.5%, 2 user-specified clip levels Centroid, Peak Centroid, Peak, 2 user-specified locations LD 8900R only Relative Power in user-specified cone angles about an arbitrary axis ~ 5Hz ~ 0.5Hz * Times are PC dependent ~7s ~14s ~35s ~70s ~140s Program Data and Setup Configuration Files ASCII file Profiles and Summary Parameters Raw 3D Scan Data in binary format Screen Captures: BMP, JPG, GIF, TIFF, PNG Log to Files and COM Ports RS-232 Serial COM port required ActiveX Automation Electrical/Mechanical AC Power Required Main supply voltage fluctuations: Dimensions mm Scanning Unit Scanner Motion Controller Environmental Conditions Temperature Altitude Maximum relative humidity 110V ~ 60Hz standard, 220V ~ 50Hz optional (Installation Category: Class II) Not to exceed ±10% of the nominal voltage; Transient overvoltage according to Installation Category II; Pollution Degree 1 or 2 in accordance with IEC 664. 318 × 228 × 241 203 × 165 × 165 51 × 89 × 248 3.9 Beam Analysis Sensor/Detector Scan Radius Pinhole Size Entrance Aperture Field of View Azimuthal Scans Spatial Sampling Resolution Spectral Range Silicon detector InGaAs detector Optional UV Source Input Power for >400nm Mirror Damage Threshold CW Mirror Damage Threshold Pulsed LDs, multi-mode fiber w/ NA >0.5 Single-mode fiber For wavelengths <400nm Higher power options available Source Output Parameters Measured Angular Widths Numerical Apertures Angular Width Ratios Angular Position Intensity or Amplitude Mode-Field Diameter Relative Integrated Power Data Update Rates Single scan updates: Perpendicular Scan updates 3D Profile Acquisition Time* 10 azimuthal scans 20 azimuthal scans 50 azimuthal scans 100 azimuthal scans 200 azimuthal scans File Saving and Data Logging Indoor use 5°C – 40°C Up to 2000m 80% for temperature up to 31°C decreasing linearly to 50% relative humidity at 40°C 207 For latest updates please visit our website: www.ophiropt.com/photonics 01.08.2013 Ordering Information - Goniometric Radiometer Far-Field Profilers All Goniometric Radiometer LD 8900 Far-Field Profiler Systems include the Scan Unit, PCI Controller Interface, Current MS Windows software, including ActiveX Automation commands. All LD 8900R systems include the above as well as a dynamic range >36dB with 0dB source. System incorporates 16-bit digitizer, light scatter control and special amplifiers to achieve higher dynamic range than standard LD8900. For pulsed operation, please consult the factory. Item LD8900/InGaAs Description Goniometric Radiometer for characterizing the angular radiation intensity from a laser diode between 800nm and 1700nm wavelength. Entrance aperture 2mm. Goniometric Radiometer for characterizing the angular radiation intensity from a laser diode between 320nm and 1100nm wavelength. Entrance aperture 2mm. Full 3D capability. Features dynamic range >36dB with 0 dB source. Wide Dynamic Range Goniometric Radiometer for characterizing the angular radiation irradiance from a fiber optic, wave guide, laser diode, VCSEL, or LED between 800nm and 1700nm wavelength. Wide Dynamic Range Goniometric Radiometer for characterizing the angular radiation irradiance from a fiber optic, waveguide, laser diode, VCSEL or LED between 320nm and 1100nm wavelength. Full 3D capability. LD8900/Si LD8900R/InGaAs LD8900R/Si 3.9 Beam Analysis Options WL-O Pulsed InGaAs Option Wavelength option Failsafe operation for pulsed sources operating at repetition rates >10kHz with pulse widths >500ns. For operation below 10kHz, there are possible gain saturation states, dependent on repetition rate, pulse width, and source power. Consult the factory when operating under these conditions for failure mode assessment. When questionable, pulsed source operation should be verified against CW operation. Pulsed Pulsed Upgrade Option to an existing Goniometric Radiometer InGaAs system. Failsafe operation for InGaAs Upgrade Option pulsed sources operating at repetition rates >10kHz with pulse widths >500ns. For operation below 10kHz, there are possible gain saturation states, dependent on repetition rate, pulse width, and source power. Consult the factory when operating under these conditions for failure mode assessment. When questionable, pulse source operation should be verified against CW operation. Includes software upgrade. Contact Factory for details. PCI Controller Upgrade Interface to allow use with standard PCI interface of desktop PC. Includes an interface box for 9180 controller card, PCI Interface card and cable, and factory calibration and realignment. System should be returned to Photon for installation. Includes software upgrade. Optional Mount of User Device Photon will provide one semi-custom mount of customer’s laser diode device. Submit device -LD 8900 Mount particulars for specific quote. With this option, the instrument can be used immediately and provides one example test fixture. LD8900 Software Viewer Goniometric Radiometer Software Viewer for LD8900 models (8-bit). Allows users to open, review and re-analyze files that are saved using any PC computer. The Viewer has all the data processing features of the software. You can read files saved. LD8900R Software Viewer Fiber Mount - /FC Fiber Mount - /SC Fiber Mount - /ST Fiber Mount -/BF Option to Fiber Mount /BF - / Ribbon Extended Cable Option - EXT Cable NIST Reference Standard PH00174 PH00175 PH00176 PH00183 PH00185 PH00186 PH00187 PH00181 PH00181 PH00439 Plate and mount for a single mode fiber with FC connector. Label on plate includes reference distance between source and datum plane. Plate and mount for a single mode fiber with SC connector. Label on plate includes reference distance between source and datum plane. Plate and mount for a single mode fiber with ST connector. Label on plate includes reference distance between source and datum plane. Plate and mount for a single mode fiber without connector. Label on plate includes reference distance between source and datum plane. Optional 4-Fiber Ribbon Cartridge for the Fiber Mount /BF (Bare Fiber). Requires /BF. PH00193 Cable lengths extended. PH00184 N.A. Reference Standard: traceable to NIST for use with Goniometric Radiometer/Far-Field profilers; i.e. LD8900 and/or LD8900R. Data provided: N.A. and Angular Widths at 50%, 13.5% and 5% clip levels, with standard deviation [with a recorded, exact source to aperture distance]. NIST reference standard includes: LD source Single Mode Test Fiber Required Mounting Plate in a storage case. PH00188 208 01.08.2013 P/N PH00173 For latest updates please visit our website: www.ophiropt.com/photonics PH00189 PH00190 PH00191 PH00192 LD 8900HDR Far-Field Profiler The photonics community needs a method for very high dynamic range measurements of optical fiber, waveguide and other optical components. Advances in DWDM technology, deployment of standard fibers, and the development of specialty fibers all require more accurate characterization. These high-dynamic-range measurements of irradiant light flux have been very difficult to obtain. Photon has the solution: our Goniometric Radiometer, the LD 8900HDR Far-Field Profiler. Measurement Parameters The LD 8900HDR Far-Field Profiler uses g oniometric methodology to m easure true 3-dimensional profiles of optical c omponents with up to 93 dB dynamic range. All measurements are taken with the e mitting fiber, planar waveguide, laser diode or LED inserted directly into the center of the instrument’s radial measurement area. For optical fiber, the far-field d istribution pattern is acquired without bending the fiber. Bending the fiber can cause analysis and reporting inaccuracies. Parameters measured for optical fiber are: ֺֺ ֺֺ ֺֺ Mode Field Diameter (MFD) – used to evaluate losses due to mismatch at connections of fibers and fiber components. Effective Area (Aeff ) – used to assess non-linear effects Numerical Aperture (NA) – a measure of the angular width of the fiber output. NA is equal to the sine of the half angle (sin θ/2) at a specified percentage of the peak value. The Model LD 8900HDR analysis software calculates these optical fiber parameters from the far-field profile, the method described in the TIA/EIA FOTP-191 standard for MFD requiring a minimum of 50dB for proper measurement. The TIA/EIA FOTP-132 standard for A requires a minimum of 50dB for proper measurements as well. This wider dynamic range provides greater signal-to-noise detail in the tails of the far-field p attern. Real-time data gathering and reporting of sample optical fibers or other sources is valuable for manufacturing and quality assurance evaluation. The LD 8900HDR is a modular system that allows either one-dimensional or three-dimensional measurements. The 3D module is easily exchanged with the 1D hardware, and the system can be p urchased with the 1D hardware, the 3D hardware or both. There are specially designed fiber mounting clips available for both the 1D and 3D configurations with a specially modified fiber cleaver and clip that guarantees proper fiber alignment. In addition, custom mounting devices are available for high dynamic range measurements of waveguides, laser diodes and LEDs. The controller comprises the PC microprocessor, data acquisition card, scan-control card and LD 8900HDR acquisition and analysis software. A reference calibration standard (NIST traceable), 1310nm, 0dBm LD Light Source is also available. This is the measured reference at the time of original manufacture that can be used for unit verification by the user at a later date. For high dynamic range measurements in the visible spectrum, a silicon detector can be substituted with a spectral range of 320-1100nm and even higher 103dB dynamic range. Maximum light source unit size for direct measurements is approximately 12.7mm by 12.7mm. In the 3D configuration the LD 8900HDR includes the 3D Motion Control Module and is capable of full 3D measurements with up to 200 azimuthal planes through the source. 3D profile of a SMF-28 optical fiber using the LD 8900HDR 3D polar view of LED light emission 3.9 Beam Analysis Hardware and Computer LD 8900 HDR 209 For latest updates please visit our website: www.ophiropt.com/photonics 01.08.2013 3.9 Beam Analysis LD 8900HDR Specifications Specifications 1D Single-Scan Data 3D Multi-Scan Data Parameters measured MFD; NA; Aeff Accuracy Scan range Scan radius Scan time Dynamic range MFD; NA; Aeff; Angular Width; Angular Centroid; Angular Aspect Ratios, Angular Peak Position, Relative Integrated Power, Relative Power in userspecified cone angles (NA), Cone Angles (NA) in user-specified % Relative Power MFD: ±0.5% (for nominal 9mm diameter fiber) NA: <±1% Aeff: <±1% ±90° 13.26(cm); 5.22(in.) <20 seconds >93dB InGaAs (103dB Si); input power and distribution dependent; 0 dBm (1mW) minimum for >50dB dynamic range Spatial sampling resolution Spectral range Software Software views Single scan rectangular profile plot; Fields for operator name, fiber type, date, and user comments Scan unit dimensions Scan unit weight Maximum light source unit size for direct measurements Ordering Information Item LD8900 HD 1P CC FFC REF BFC 3D CFP Case MfgSoft 1W Mount 3W Mount 1CustomFxt LED Profiler LED profiler w/3180 3D(LED) 3LED Mount 3CustomFxt UV PO Description Very high dynamic range Goniometric Radiometer designed to measure Mode Field Diameter (MFD) and Effective Area (Aeff ) of single mode fiber. Mount for fiber cartridges Interface plate that mounts to the Scan Unit. Accepts all Photon Fiber Cartridges. The cartridges insert into an opening in the plate and are held in the proper meas. Photon Fiber Clip and Clip Cartridge. The Photon Fiber Clip mounts in a modified Fitel Furukawa Cleaver. The fiber is cleaved and positioned simultaneously. Cartridge inserts into the 1D Cartridge. Fiber Cleaver for use with the Photon Fiber Clip. Standard reference cartridge Includes a Photon Standard SMF-28 Reference Cartridge and a 1310nm-0dBm LD Light Source. Bare fiber connector for LD8900HDR Cartridge has a v-groove and clamp for holding fiber. Fiber is positioned manually to a visual reference position. Intended for use with specialty fibers that canno. 3-D scan module for HDR Interchangeable accessory adds full 3-dimensional measurement capability with up to 200 cuts through the fiber. Includes a 3D Scan Module and Motion Controller. Connectorized fiber mount for HDR Adapter plate for mounting connectorized fibers. Standard ST, FC, and SC connectors are held by the ferrule tip. Call for other types. Rugged shipping case for LD8900HDR. Software interface designed for manufacturing. Simple interface screen shows the high dynamic range 1D profile and reports MFD, Aeff, and NA. Includes fields for time stamps, serial numbers, and notes. 1-D waveguide mount Waveguide mount for use with 1D Interface Plate. 3-D waveguide mount Waveguide mount for use with 3D Scan Accessory. Custom mnt for 1-D vers of HDR/LED Prof Custom designed fixtures for mounting novel sources for 1D scans. A goniometric profiler designed to rapidly measure true 3-dimensional profiles of LEDs providing a ±130 degree measurement around the source, with 0.05-degree resolution. Same as above but includes state-of-the- art PC running Microsoft Windows operating system with Photon LED Software installed. Configuration required for international sales. 3-D scan module for LED Profiler. Standard LED mount for use with packaged LEDs. Price dependent on configuration. (Must be quoted for specific device.) Photon can provide custom and semi custom device mounts for LED devices, including TE-cooled vacuum chucks for bare chip testing. Mounts are designed to take advantage of the 260 degree field-of-view available in the LED Profiler. Mounting hardware that is compatible with automated test operations can also be designed and supplied by Photon. Allows the use of the LED Profiler with sources emitting at wavelengths below 380nm. Pulsed Operation for LED Profiler. 210 01.08.2013 0.055° InGaAs detector: 800-1700nm / Silicon available (350-800nm) Windows 2000/XP Professional; ActiveX Automation server capability Polar profile plot - single or dual orthogonal scans; Rectangular profile plot - single or dual orthogonal scans 3D Polar view; 3D Rectangular View; 2D Topographic View; Beam parameter statistics; Time statistics charts; Relative angular power distribution; Notes window for appending user comments 267 H x 305 W x 362 L (mm); 10.5 x 12 x 14.25 (in.) ~13.6kg; 30lbs. ~12.7 × 12.7(mm); 0.5 × 0.5(in.) For latest updates please visit our website: www.ophiropt.com/photonics P/N PH00198 PH00201 PH00202 PH00203 PH00204 PH00205 PH00206 PH00208 PH00209 PH00210 PH00215 PH00216 PH00217 PH00199 PH00200 PH00207 PH00211 PH00214 PH00212 PH00213 Product index Product 1CustomFxt 1P 1st Wedge Beam Splitter 1W Mount 1X UV image converter 2nd Wedge Beam Splitter 3A 3A-FS 3A-FS-StarLink 3A-IS 3A-IS-IRG 3A-P 3A-P-FS-12 3A-P-QUAD 3A-P-StarLink 3A-P-THz 3A-QUAD 3A-QUAD-StarLink 3A-StarLink 3CustomFxt 3D 3D (LED) 3LED Mount 3W Mount 4mm spacer 4X reducing UV image converter 4X reimaging beam expander 4X reimaging beam reducer 5mm spacer 6X expanding microscope objective 8mm spacer 10A 10A-P 10A-PPS 10A-PPS-StarLink 10A-StarLink 10K-W 10kW-SH-V2 10X 12A 12A-P 12X expanding microscope objective 15(50)A-PF-DIF-18 20C-A 20C-SH 20C-UAU 20mm diameter UV imaging plate 20X 22X expanding microscope objective 25mm focal length CCTV lens kit 30(150)A-BB-18 30(150)A-BB-18-StarLink 30(150)A-HE-17 30(150)A-HE-DIF-17 30(150)A-LP1-18 30(150)A-SV-17 30A-BB-18 30A-BB-18-StarLink 30A-N-18 30A-P-17 30mm diameter UV imaging plate 40X 50(150)A-BB-26 P/N PH00217 PH00201 SPZ17015 PH00215 SPZ17023 SPZ17026 7Z02621 7Z02628 767002 7Z02404 7Z02403 7Z02622 7Z02687 7Z07935 787001 7Z02742 7Z07934 787203 787000 PH00214 PH00206 PH00207 PH00211 PH00216 SPG01698 SPZ17024 SPZ17022 SPZ17017 SPG02106 SPZ08257 SPG02067 7Z02637 7Z02649 7Z07904 787202 787004 7Z02645 7Z02645 SP90295 7Z02638 7Z02624 SPZ08259 7Z02740 Consult Ophir representative 7Z02602 Consult Ophir representative SPF01177 SP90294 SPZ08260 SP90085 7Z02699 787007 7Z02722 7Z02729 7Z02721S 7Z02724 7Z02692 787006 7Z02695 7Z02693 SPF01150 SP90293 7Z02696 Page 210 210 177 210 181 177 28 28 28, 42 27 27 28 28 56 28, 42 28 56 42, 56 28, 42 210 210 210 210 210 180 181 178 179 180 178 180 30 31 56 42, 56 30, 42 40 204 183 29 29 178 31 49 49 49 181 183 178 180 32 32, 42 33 33 32 33 30 30, 42 31 31 181 183 30 211 For latest updates please visit our website: www.ophiropt.com/photonics 01.08.2013 Product 50(150)A-BB-26-PPS 50(150)A-BB-26-PPS-StarLink 50A-PF-DIF-18 50mm focal length CCTV lens kit -50mm lens assembly 50mm X 50mm UV imaging plate 60X 100C-SH 100C-UA 100C-UAU 100mm X 100mm UV imaging plate 150C-SH 150C-UA 150C-UAU 150W-UA 150W-UAU 1000-1300nm lens 1000W 1000W-LP 1000W-StarLink 1394a/b Adapter Cable 1394b FireWire Cable 1394b FireWire Power Supply 1740 LENS MNT 1740 LENS PREP 1740 TRNG 5000W 5000W-LP 5000W-SH Additional beam splitter ATP-K Battery Pack for LaserStar Battery Pack for Nova Battery Pack for Vega, Nova II, Quasar BC20 BD10K-W BD-040-A BD-500-W BD5000W-BB-50 BDFL500A-BB-50 BFC Beam Cube 620 Beam Dump; 5kW Beam Deflector Assembly BeamMic to BGE Upgrade BeamMic to BGP Upgrade BeamMic to BGS Upgrade Beam Splitter Assembly Beam splitter for 1X UV image converter Beam splitter for 4X UV image converter Beam splitter for expanders BEAMSTAR TO BGE UPGRADE BEAMSTAR TO BGP UPGRADE BEAMSTAR TO BGS UPGRADE BGE-FWB-GRAS20-1550-DESK BGE-FWB-GRAS20-1550-LAPTP BGE-FWB-GRAS20-DESKTOP BGE-FWB-GRAS20-LAPTOP BGE-GigE-OSI182000 BGE-GigE-OSI182000-1550 BGE-USB-L11059 BGE-USB-SP503 BGE-USB-SP503-1550 BGE-USB-SP620 BGE-USB-SP620-1550 P/N 7Z07900 787200 7Z02738 SP90038 SPZ08255 SP90082 SP90292 7Z02680 Consult Ophir representative Consult Ophir representative SP90083 77023 Consult Ophir representative Consult Ophir representative Consult Ophir representative Consult Ophir representative 11402-001 7Z02664 7Z02668 787005 SP90207 SP90166 SP90167 PH00075 PH00076 PH00077 7Z02119 7Z02255 7Z02119 SPZ17026 PH00128 7Z14006A 7Z11200 7E14007 7Z02422A 7Z17202 SP90192 SP90193 7Z17201 7Z17200 PH00205 SP90323 SP90224 SP90263 SP90230 SP90229 SP90219 7Z17001 SPZ17015 SPZ17007 SPZ17027 SP90230 SP90229 SP90219 SP90253D SP90253L SP90252D SP90252L SP90269 SP90272 SP90321 SP90246 SP90247 SP90248 SP90249 212 01.08.2013 For latest updates please visit our website: www.ophiropt.com/photonics Page 57 42, 57 31 180 198 181 183 51 51 51 181 52 52 52 52 52 189 39 39 39, 42 134 134 134 194 194 194 40 40 204 178 172 94 96 90, 92, 103 26 45 156, 173 156, 173 45 45 210 198 204 173 139 139 139 76 181 181 178 134 134 134 134 134 134 134 133 133 133 133 133 133 133 Product BGE-USB-XC130 BGP TO BGE UPGRADE BGP-FWB-GRAS20-1550-DESK BGP-FWB-GRAS20-1550-LAPTP BGP-FWB-GRAS20-DESKTOP BGP-FWB-GRAS20-LAPTOP BGP-USB-L11059 BGP-USB-SP503 BGP-USB-SP503-1550 BGP-USB-SP620 BGP-USB-SP620-1550 BGP-USB-XC130 BGS TO BGE UPGRADE BGS TO BGP UPGRADE BGS-FWB-GRAS20,DESKTOP BGS-FWB-GRAS20,LAPTOP BGS-FWB-GRAS20-1550,DESKTOP BGS-FWB-GRAS20-1550,LAPTOP BGS-USB-SP503 BGS-USB-SP503-1550 BGS-USB-SP620 BGS-USB-SP620-1550 BM-USB-SP503 BM-USB-SP503-1550 BM-USB-SP620 BM-USB-SP620-1550 Bracket for PD10-C, PD10-pJ-C, PD10-IR-pJ-C Bracket for PE9-C, PE10-C, PE10BF-C, PE25-C, PE25BF-C Bracket for PE50-C, PE50BF-C BT-I BT-II BT-I-YAG BT-II-YAG Cable-x Carrying Case for Vega, Nova II, Nova and StarLite Case CC CFP CM-EXT10 CM-EXT25 CM-EXT40 CM-EXT50 CM-EXT100 C-Mnt C-NFP Assy COL-FXT 250 COL-FXT 250 TEL-X COL-FXT CO2 Comet 1K Comet 10K Comet 10K-HD CUSTOM LENS Damage Threshold Test Plates BF type Damage Threshold Test Plates Metalic type DPFSA Extended Cable Option - EXT Cable F100A-PF-DIF-18 F100A-PF-DIF-33 F150A-BB-26 F150A-BB-26-PPS FC, FC/APC fiber adapter Female SM1 to SM1 Adapter FFC Fiber adapter bracket for 4X beam expander Fiber adapter mounting bracket for 30(150)A-BB-18, 30(150)A-LP1-18 P/N SP90251 SP90235 SP90243D SP90243L SP90242D SP90242L SP90320 SP90236 SP90237 SP90238 SP90239 SP90241 SP90234 SP90233 SP90202D SP90202L SP90203D SP90203L SP90197 SP90198 SP90199 SP90200 SP90279 SP90280 SP90281 SP90282 7Z08275 7Z08269 7Z08270 SP90135 SP90133 SP90173 SP90172 PH00049 1J02079 PH00209 PH00202 PH00208 PH00123 PH00122 PH00121 PH00120 PH00119 PH00051 SP90291 PH00070 PH00071 PH00072 7Z02702 7Z02705 7Z02706 PH00088 7E06031D 7E06031A PH00053 PH00184 7Z02741 7Z02744 7Z02727 7Z07901 7Z08229 1G02260 PH00203 SPG01649 7Z08211 Page 133 134 133 133 133 133 133 133 133 133 133 133 134 134 133 133 133 133 133 133 133 133 139 139 139 139 66 66 76 176 176 176 176 167 90,92,96,98,99 210 210 210 191 191 191 191 191 167 183 167 167 167 41 41 41 194 76 76 167 208 36 36 36 57 44, 76, 78 44 210 178 44 213 For latest updates please visit our website: www.ophiropt.com/photonics 01.08.2013 Product Fiber adapter mounting bracket for 30A-BB-18, 30A-N-18 Fiber adapter mounting bracket for 30A-P-17, 30(150)A-SV-17, 30(150)A-HE-17 Fiber adapter mounting bracket for 3A-IS, 3A-IS-IRG Fiber adapter mounting bracket for 50(150)A-BB-26, 50(150)A-BB-26-PPS, F150A-BB-26, F150A-BB-26-PPS Fiber adapter mounting bracket for FL250A-BB-35, FL250A-BB-35-PPS, FL250A-LP1-35 Fiber adapter mounting bracket for FL400A-BB-50, FL250A-BB-50 Fiber adapter mounting bracket for L40(150)A, L40(150)A-LP1, L50(150)A Fiber adapter mounting bracket for L50(150)A-BB-35, L50(150)A-LP1-35, L50(150)A-PF-35 Fiber adapter mounting bracket for PD300R series and FPS-1 with SM1 thread Fiber Mount - /BF Fiber Mount - /FC Fiber Mount - /SC Fiber Mount - /ST Filter for 1300nm Filter for 355nm-V2; give an undistorded image of the 355nm light Filter holder and 50x50 filter set (for 4X beam reducer) FL250A-BB-35 FL250A-BB-50 FL250A-BB-50-PPS FL250A-BB-50-PPS-StarLink FL250A-LP1-35 FL250A-LP1-DIF-33 FL250A-RP FL400A-BB-50 FL400A-LP-50 FL500A FL500A-LP1 FOCTUBE20-30 FOCTUBE30-50 FOCTUBE50-90 FPS-1 fast photodiode FSA-50Y FSA-100Y FSA-125Y FSA-150Y FSA-200Y Heat Sink H-I 100X H-I 980-VIS w/lens H-I 1550 w/lens H-I High energy IR H-I LA HP-266 HP-355 HP-450 HP-600 HP-800 HP-1064 HP-ND1 350 thru 399nm HP-ND1 400 thru 700nm HP-ND2 400 thru 700nm HP-ND3 400 thru 700nm HP-ND1 750 thru 890nm HP-ND2 750 thru 890nm HP-ND3 750 thru 890nm HP-ND1 900 thru 1100nm HP-ND2 900 thru 1100nm HP-ND3 900 thru 1100nm HP-ND1 1150 thru 1600nm HP-ND2 1150 thru 1600nm HP-ND3 1150 thru 1600nm II-VI-CO2-58-D8-WC-H II-VI-CO2-58-D8-WC-V II-VI-CO2-BS-35 P/N 7Z08211 7Z08230 7Z08213 Page 44 44 44 7Z08210 44 7Z08265 7Z08212 7Z08238 7Z08265 1G02259 PH00192 PH00189 PH00190 PH00191 SPZ08242 SPZ08246 SPZ08240 7Z02728 7Z02739 7Z07902 787201 7Z02731S 7Z02733 7Z02921 7Z02734 7Z02735 7Z02648 7Z02667S PH00124 PH00125 PH00126 7Z02505 SP90187 SP90188 SP90189 SP90190 SP90191 7Z08267 PH00148 PH00146 PH00081 PH00147 PH00082 PH00129 PH00130 PH00131 PH00132 PH00133 PH00134 PH00370 PH00371 PH00372 PH00373 PH00374 PH00375 PH00376 PH00377 PH00378 PH00379 PH00380 PH00381 PH00382 SP90160 SP90161 SP90062 44 44 44 44 44 208 208 208 208 172 172 172, 179 36 37 58 42, 58 36 36 73 37 37 37 37 191 191 191 78 156 156 156 156 156 76 167 167 167 167 167 167 172 172 172 172 172 167 167 167 167 167 167 167 167 167 167 167 167 167 205 205 205 214 01.08.2013 For latest updates please visit our website: www.ophiropt.com/photonics Product IR Phosphor Card Juno L30A-10MM L30C-SH L30C-UA L30C-UAU L40(150)A L40(150)A-EX L40(150)A-LP1 L50(150)A L50(150)A-BB-35 L50(150)A-LP1-35 L50(150)A-PF-35 L50(150)A-StarLink L50(300)A L50(300)A-IPL L50(300)A-LP1 L50(300)A-PF-65 L150C-UA L150C-UAU L250W L250W-UA L250W-UAU L300W-LP L300W-UA L300W-UAU L1500W L1500W-LP L1500W-LP1-RP Large aperture 1st Wedge Beam Splitter Large C-mount Wedge Splitter LaserStar Dual Channel LaserStar IEEE Option LaserStar Single Channle LBA TO BGE UPGRADE LBA TO BGP UPGRADE LBA TO BGS UPGRADE LBF-50 filter set LBS-100 LBS-100 IR 0.5 LBS-100 IR 5.0 LBS-100 to 4X beam reducer adapter LBS-100 YAG LBS-300-BB LBS-300-NIR LBS-300-UV LBS-300-VIS LD8900 HD LD8900/InGaAs LD8900/Si LD8900R/InGaAs LD8900R/Si LD8900 Software Viewer LD8900R Software Viewer LED Profiler LED profiler w/3180 Legacy Software LENS 100 LIR LENS 100 NIR LENS 100 VIS LENS 190 10.6 Lens 200mm LIR Lens 200mm NIR Lens 200mm VIS LENS 200 UV-XXX P/N 7F01235A 7Z01250 7Z02273 773434 Consult Ophir representative Consult Ophir representative 7Z02626 7Z02614 7Z02685S 7Z02633 7Z02730 7Z02726S 7Z02737 787003 7Z02658 7Z02651 7Z02641S 7Z02743 Consult Ophir representative Consult Ophir representative 7Z02688 Consult Ophir representative Consult Ophir representative 7Z02689 Consult Ophir representative Consult Ophir representative 7Z02661 7Z02665 7Z02919 SPZ17025 SP90273 7Z01601 78300 7Z01600 SP90232 SP90231 SP90210 SP90081 SP90061 SP90058 SP90059 SPZ17029 SP90057 SP90186 SP90185 SP90183 SP90184 PH00198 PH00173 PH00174 PH00175 PH00176 PH00181 PH00439 PH00199 PH00200 PH00420 PH00095 PH00094 PH00093 PH00092 PH00241 PH00239 PH00237 PH00090 Page 44, 77 87, 101 30 50 50 50 34 34 34 34 32 32 32 34, 42 35 35 35 35 53 53 38 53 53 38 53 53 39 39 73 177 173 86, 94 94, 99 86, 94 134 134 134 172 174 174 174 174, 179 174 139, 173 156, 173 173 173 210 208 208 208 208 208 208 210 210 166 194 194 194 194 194 194 194 194 215 For latest updates please visit our website: www.ophiropt.com/photonics 01.08.2013 Product Lens 400 2um lens 400mm LIR Lens 400mm NIR Lens 400mm VIS LENS 400 UV-XXX LPK-CO2-6.4-0.5 LPK-CO2-6.4-5.0 LPK-CO2-16-0.5 LPK-CO2-16-5.0 LPK-YAG-2.5-USB LPK-YAG-7-USB LPK-YAG-16-USB M2-200s-FW M2-200s-FW-A M2-200sM-FW M2-200sM-FW-A Mfgsoft MODECHECK CO2-5kW ModeCheck storage/carrying case Model 1740 Model USB NFP-980(NS) Model USB NFP-1550(NS) Model USB NFP-Pyro Model USB NFP-VIS(NS) Mounting Hardware, 5000W detector Mounting Hardware, 10,000W detector MS-1780 MS-NIR Kit MS-NIR Lens Kit MS-TUBE Kit MS-UV Kit MS-VIS Kit MS-VIS Lens Kit MS-YAG Kit MSP-NS-Pyro/20/25 ND1 nom. x10 attenuator ND1 stackable filter (red housing) ND2 nom. x50 attenuator ND2 stackable filter (black housing) ND3 stackable filter (green housing) NH NS-Ge/3.5/1.8-PRO NH NS-Ge/3.5/1.8-STD NH NS-Ge/9/5-PRO NH NS-Ge/9/5-STD NH NS-Ge/9/25-PRO NH NS-Ge/9/25-STD NH NS-Ge/12/25-PRO NH NS-Ge/12/25-STD NH NS-Si/3.5/1.8-PRO NH NS-Si/3.5/1.8-STD NH NS-Si/9/5-PRO NH NS-Si/9/5-STD NH NS-Si/9/25-PRO NH NS-Si/9/25-STD NH NS-Si/25/25-PRO NH NS-Si/25/25-STD NH-HP-NS/9/5 NH-HP-NS/20/10 NH-PYRO/9/5 NH-PYRO/9/5-PRO NH-PYRO/9/5-STD NH-PYRO/9/25 NH-PYRO/9/25-PRO NH-PYRO/9/25-STD NH-PYRO/20/25 P/N PH00224 PH00242 PH00240 PH00238 PH00091 SP90075 SP90076 SP90077 SP90078 SP90168 SP90169 SP90170 SP90144 SP90145 SP90146 SP90147 PH00210 SP90211 SP90227 PH00074 PH00230 PH00229 PH00232 PH00231 SP90212 SP90213 PH00096 PH00111 PH00111 PH00127 PH00097 PH00104 PH00104 PH00118 PH00218 7Z08200 SPZ08234 7Z08201 SPZ08235 SPZ08253 PH00036 PH00407 PH00039 PH00410 PH00038 PH00409 PH00040 PH00411 PH00031 PH00402 PH00034 PH00405 PH00033 PH00404 PH00035 PH00406 PH00044 PH00043 PH00041 PH00041 PH00412 PH00243 PH00243 PH00416 PH00042 216 01.08.2013 For latest updates please visit our website: www.ophiropt.com/photonics Page 194 194 194 194 194 202 202 202 202 201 201 201 189 189 189 189 210 204 204 194 185 185 185 185 204 204 191 191 191 191 191 191 191 191 194 78 172 78 172 172 166 166 166 166 166 166 166 166 166 166 166 166 166 166 166 166 200 200 200 166 166 200 166 166 200 Product NH-PYRO/20/25-PRO NH-PYRO/20/25-STD NIR200 NIR250 NIR400 NIR500 NIR750 NIR1000 NIST Reference Standard Nova Nova II Nova PE-C Adapter Nova RS232 Assembly- 2m cable Nova RS232 Assembly- 5m cable NS-USB NS-YE NSEC NSv1 to NSv2 PRO Upgrade NSv1 to NSv2 STD Upgrade NSv2 STD to NSv2 PRO Upgrade Optical Trigger for FX and SP Cameras Option to Fiber Mount /BF -/Ribbon Optional Mount of User Device -LD 8900 Mount Optional PC oscilloscope P200 Power Option PCI Controller Upgrade PCI-Express FireWire 1394a/b Desktop Card PD10-C PD10-IR-pJ-C PD10-pJ-C PD300 PD300 F.O. Adapter FC, FC/APC type PD300 F.O. Adapter SC type PD300 F.O. Adapter SMA type PD300 F.O. Adapter ST type PD300-1W PD300-3W PD300-BB PD300-BB-50mW PD300-CDRH PD300-CIE PD300-IR PD300-IRG PD300-IRG F.O Adapter FC, FC/APC type PD300-IRG F.O Adapter SMA type PD300R PD300R-3W PD300R-IR PD300R-UV PD300-StarLink PD300-TP PD300-UV PE9-C PE9-F PE10BF-C PE10-C PE10-C-StarLink PE10-S PE10-S-Q PE25-A-DIF-XXX-YYY PE25BB-S PE25BB-S-DIF PE25BF-C PE25BF-C-StarLink PE25BF-DIF-C P/N PH00042 PH00413 PH00112 PH00113 PH00114 PH00115 PH00116 PH00117 PH00188 7Z01500 7Z01550 7Z08272 78105 781052 PH00030 PH00050 PH00252 PH00419 PH00418 PH00417 SPZ17005 PH00193 PH00181 SPE10008 PH00046 PH00187 SP90164 7Z02944 7Z02946 7Z02945 7Z02410 7Z02213 7Z08221 7Z02212 7Z02210 7Z02411A 7Z02426 7Z02405 7Z02440 7Z02418 7Z02406 7Z02412 7Z02402 7Z08216 7Z08222 7Z02436 7Z02437 7Z02439 7Z02438 787100 7Z02424 7Z02413 7Z02933 7Z02882 7Z02938 7Z02932 787152 Consult Ophir representative Consult Ophir representative Consult Ophir representative Consult Ophir representative Consult Ophir representative 7Z02935 787154 7Z02941 Page 166 166 191 191 191 191 191 191 208 86, 96 86, 92 77, 96 96, 99 96, 99 166 167 167 166 166 166 134, 139 208 208 198 146 208 134 65 65 65 22 43 43 43 43 22 22 26 26 43 26 23 23 44 44 25 25 25 25 22, 42 22 23 66 59 66 66 66, 75 81 81 82 82 82 67 67, 75 69 217 For latest updates please visit our website: www.ophiropt.com/photonics 01.08.2013 Product PE25-C PE25-C-StarLink PE25-S PE50BB-DIF-C PE50BB-S PE50BF-C PE50BF-C-StarLink PE50BF-DIF-C PE50BF-DIF-C-StarLink PE50BF-DIFH-C PE50-C PE50-C-StarLink PE50-DIF-C PE50-DIF-C-StarLink PE50-DIF-ER-C PE50-S PE100BF-DIF-C PE-C to PE Size Adapter PFSA PO Pulsar-1 Pulsar-2 Pulsar-4 Pulsed InGaAs Option Pulsed InGaAs Upgrade Option PY-III-C-A PY-III-C-B PY-III-P-A PY-III-P-B PY-III-W-BK7-1.064 PY-III-W-Ge-10.6 PY-III-W-Ge-3-5.5 PY-III-W-Ge-8-12 PY-III-W-Poly-THz PY-III-W-Si-1.05-2.5 PY-III-W-Si-2.5-4 PY-III-W-ZnSe-10.6 PY-III-W-ZnSe-2-5 Quasar RAL-FXT REF RS232 Cable for LaserStar RS232 Cable for Vega and Nova II RSP100 RSP200 RSP500 SC fiber adapter Scope Adapter SH to BNC Adapter Shock Absorbing Mounting Post SMA fiber adapter Spacer assy for objectives ST fiber adapter StarLite USB A-B Cable USB A-mini B Cable USB Cable for Juno USB Cable for Vega and Nova II USB Interface (legacy) USB-MSP-HPNS/10/5 USB MSP-NS-Ge/9/5 USB MSP-NS-Pyro/9/5 USB MSP-NS-Si/9/5 USB NS-Ge/3.5/1.8-PRO USB NS-Ge/3.5/1.8-STD P/N 7Z02937 787156 Consult Ophir representative 7Z02947 Consult Ophir representative 7Z02934 787153 7Z02940 787158 7Z02943 7Z02936 787155 7Z02939 787157 7Z02948 Consult Ophir representative 7Z02942 7Z08273 PH00052 PH00213 7Z01203 7Z01202 7Z01201 PH00185 PH00186 SP90092 SP90093 SP90090 SP90091 SP90101 SP90105 SP90104 SP90106 SP90208 SP90102 SP90103 SP90107 SP90108 7Z01300 PH00073 PH00204 7E01121 7E01206 PH00078 PH00079 PH00080 7Z08227 1Z11012 7Z11010 7Z08268 1G01236 SPZ08261 7Z08226 7Z01565 SP90204 SP90205 7E01217 7E01205 7Z01200 PH00236 PH00234 PH00235 PH00233 PH00020 PH00391 218 01.08.2013 For latest updates please visit our website: www.ophiropt.com/photonics Page 67 67, 75 82 70 82 68 68, 75 70 70, 75 70 68 68,75 69 69, 75 72 82 72 77 167 210 87, 102 87, 102 87, 102 208 208 154 154 154 154 154 154 154 154 154 154 154 154 154 87, 103 167 210 94 90, 92 167 167 167 44, 76, 78 76 44 77 44, 76, 78 178 44, 76, 78 86,98 134 134 101 90, 92 102 194 194 194 194 165 165 Product USB NS-Ge/9/5-PRO USB NS-Ge/9/5-STD USB NS-Ge/9/25-PRO USB NS-Ge/9/25-STD USB NS-Ge/12/25-PRO USB NS-Ge/12/25-STD USB NS-PYRO/9/5 USB NS-PYRO/9/5-PRO USB NS-PYRO/9/5-STD USB NS-PYRO/9/25 USB NS-PYRO/9/25-PRO USB NS-PYRO/9/25-STD USB NS-PYRO/20/25 USB NS-PYRO/20/25-PRO USB NS-PYRO/20/25-STD USB NS-PYRO HP/9/5 USB NS-PYRO HP/20/10 USB NS-Si/3.5/1.8-PRO USB NS-Si/3.5/1.8-STD USB NS-Si/9/5-PRO USB NS-Si/9/5-STD USB NS-Si/9/25-PRO USB NS-Si/9/25-STD USB NS-Si/25/25-PRO USB NS-Si/25/25-STD USB- Pass/Fail Cable USB to Bluetooth adapter USBI UV UV converter assembly for 4X beam expander UV Lens Kit UV ND Filters UV200 UV250 UV350 UV500 UV750 UV1000 Uview, Accessory for C-mnt Cameras Variable filter Vega VIS200 VIS250 VIS400 VIS500 VIS750 VIS1000 WL-O WVF-300 P/N PH00023 PH00394 PH00022 PH00393 PH00024 PH00395 PH00025 PH00025 PH00396 PH00228 PH00228 PH00400 PH00026 PH00026 PH00397 PH00028 PH00027 PH00015 PH00386 PH00018 PH00389 PH00017 PH00388 PH00019 PH00390 SP90060 7E10039 7Z01200 PH00212 SPZ17019 PH00097 SP90228 PH00098 PH00099 PH00100 PH00101 PH00102 PH00103 SP90322 SPZ17012 7Z01560 PH00105 PH00106 PH00107 PH00108 PH00109 PH00110 PH00183 SP90195 Page 165 165 165 165 165 165 200 166 166 200 166 166 200 166 166 200 200 165 165 165 165 165 165 165 165 134 103 87 210 178, 181 191 172 191 191 191 191 191 191 182 172 86, 90 191 191 191 191 191 191 208 156, 173 219 For latest updates please visit our website: www.ophiropt.com/photonics 01.08.2013 Part number index P/N 11402-001 77023 78105 78300 773434 781051 781052 787000 787001 787002 787003 787004 787005 787006 787007 787100 787152 787153 787154 787155 787156 787157 787158 787200 787201 787202 787203 1G01236 1G02259 1G02260 1J02079 1Z11012 7E01121 7E01205 7E01206 7E01217 7E06031A 7E06031D 7E10039 7E14007 7F01235A 7Z01200 7Z01201 7Z01202 7Z01203 7Z01250 7Z01300 7Z01500 7Z01550 7Z01560 7Z01565 7Z01600 7Z01601 7Z02119 7Z02210 7Z02212 7Z02213 7Z02255 7Z02273 7Z02402 7Z02403 7Z02404 7Z02405 7Z02406 7Z02410 Page 189 52 96, 99 94, 99 50 96, 99 96, 99 28, 42 28, 42 28, 42 34, 42 30, 42 39, 42 30, 42 32, 42 22, 42 66, 75 68, 75 67, 75 68, 75 67, 75 69, 75 70, 75 42, 57 42, 58 42, 56 42, 56 44, 76, 78 44, 78 44 90, 92, 96 98, 99 76 94 90, 92 90, 92 101 77 77 103 90, 92, 103 44, 77 87, 102 87, 102 87, 102 87, 102 87, 101 87, 103 86, 96 86, 92 86, 90 86, 98 86, 94 86, 94 40, 204 43 43 43 40 30 23 27 27 26 26 22 P/N 7Z02411A 7Z02412 7Z02413 7Z02418 7Z02422A 7Z02424 7Z02426 7Z02436 7Z02437 7Z02438 7Z02439 7Z02440 7Z02505 7Z02602 7Z02614 7Z02621 7Z02622 7Z02624 7Z02626 7Z02628 7Z02633 7Z02637 7Z02638 7Z02641S 7Z02645 7Z02648 7Z02649 7Z02651 7Z02658 7Z02661 7Z02664 7Z02665 7Z02667S 7Z02668 7Z02680 7Z02685S 7Z02687 7Z02688 7Z02689 7Z02692 7Z02693 7Z02695 7Z02696 7Z02699 7Z02702 7Z02705 7Z02706 7Z02721S 7Z02722 7Z02724 7Z02726S 7Z02727 7Z02728 7Z02729 7Z02730 7Z02731S 7Z02733 7Z02734 7Z02735 7Z02737 7Z02738 7Z02739 7Z02740 7Z02741 7Z02742 7Z02743 Page 22 23 23 43 26 22 22 25 25 25 25 26 78 49 34 28 28 29 34 28 34 30 29 35 40, 204 37 31 35 35 39 39 39 37 39 51 34 28 38 38 30 31 31 30 32 41 41 41 32 33 33 32 36 36 33 32 36 36 37 37 32 31 37 31 36 28 35 P/N 7Z02744 7Z02919 7Z02921 7Z02932 7Z02933 7Z02934 7Z02935 7Z02936 7Z02937 7Z02938 7Z02939 7Z02940 7Z02941 7Z02942 7Z02943 7Z02944 7Z02945 7Z02946 7Z02947 7Z02948 7Z07900 7Z07901 7Z07902 7Z07904 7Z07934 7Z07935 7Z08200 7Z08201 7Z08210 7Z08211 7Z08212 7Z08213 7Z08216 7Z08221 7Z08222 7Z08226 7Z08227 7Z08229 7Z08230 7Z08238 7Z08265 7Z08267 7Z08268 7Z08269 7Z08270 7Z08272 7Z08273 7Z08275 7Z11010 7Z11200 7Z14006A 7Z17001 7Z17200 7Z17201 7Z17202 PH00015 PH00017 PH00018 PH00019 PH00020 PH00022 PH00023 PH00024 PH00025 PH00026 PH00027 220 01.08.2013 For latest updates please visit our website: www.ophiropt.com/photonics Page 36 73 73 66 66 68 67 68 67 66 69 70 69 72 70 65 65 65 70 72 57 57 58 56 56 56 78 78 44 44 44 44 44 43 44 44, 76, 78 44, 76, 78 44, 76, 78 44 44 44 76 77 76 76 77, 96 77 76 44 96 94 76 45 45 45 165 165 165 165 165 165 165 166 166, 200 166, 200 200 P/N PH00028 PH00030 PH00031 PH00033 PH00034 PH00035 PH00036 PH00038 PH00039 PH00040 PH00041 PH00042 PH00043 PH00044 PH00046 PH00049 PH00050 PH00051 PH00052 PH00053 PH00070 PH00071 PH00072 PH00073 PH00074 PH00075 PH00076 PH00077 PH00078 PH00079 PH00080 PH00081 PH00082 PH00088 PH00090 PH00091 PH00092 PH00093 PH00094 PH00095 PH00096 PH00097 PH00098 PH00099 PH00100 PH00101 PH00102 PH00103 PH00104 PH00105 PH00106 PH00107 PH00108 PH00109 PH00110 PH00111 PH00112 PH00113 PH00114 PH00115 PH00116 PH00117 PH00118 PH00119 PH00120 PH00121 Page 200 166 166 166 166 166 166 166 166 166 166, 200 166, 200 200 200 167 167 167 167 167 167 167 167 167 167 194 194 194 194 167 167 167 167 167 194 194 194 194 194 194 194 191 191 191 191 191 191 191 191 191 191 191 191 191 191 191 191 191 191 191 191 191 191 191 191 191 191 P/N PH00122 PH00123 PH00124 PH00125 PH00126 PH00127 PH00128 PH00129 PH00130 PH00131 PH00132 PH00133 PH00134 PH00146 PH00147 PH00148 PH00173 PH00174 PH00175 PH00176 PH00181 PH00183 PH00184 PH00185 PH00186 PH00187 PH00188 PH00189 PH00190 PH00191 PH00192 PH00193 PH00198 PH00199 PH00200 PH00201 PH00202 PH00203 PH00204 PH00205 PH00206 PH00207 PH00208 PH00209 PH00210 PH00211 PH00212 PH00213 PH00214 PH00215 PH00216 PH00217 PH00218 PH00224 PH00228 PH00229 PH00230 PH00231 PH00232 PH00233 PH00234 PH00235 PH00236 PH00237 PH00238 PH00239 PH00240 PH00241 PH00242 Page 191 191 191 191 191 191 172 172 172 172 172 172 172 167 167 167 208 208 208 208 208 205 205 205 205 205 205 205 205 205 205 205 210 210 210 210 210 210 210 210 210 210 210 210 210 210 210 210 210 210 210 210 194 194 166, 200 185 185 185 185 194 194 194 194 194 194 194 194 194 194 P/N PH00243 PH00252 PH00370 PH00371 PH00372 PH00373 PH00374 PH00375 PH00376 PH00377 PH00378 PH00379 PH00380 PH00381 PH00382 PH00386 PH00388 PH00389 PH00390 PH00391 PH00393 PH00394 PH00395 PH00396 PH00397 PH00400 PH00402 PH00404 PH00405 PH00406 PH00407 PH00409 PH00410 PH00411 PH00412 PH00413 PH00416 PH00417 PH00418 PH00419 PH00420 PH00439 SP90038 SP90057 SP90058 SP90059 SP90060 SP90061 SP90062 SP90075 SP90076 SP90077 SP90078 SP90081 SP90082 SP90083 SP90085 SP90090 SP90091 SP90092 SP90093 SP90101 SP90102 SP90103 SP90104 SP90105 SP90106 SP90107 SP90108 Page 166 167 167 167 167 167 167 167 167 167 167 167 167 167 167 165 165 165 165 165 165 165 165 166 166 166 166 166 166 166 166 166 166 166 166 166 166 166 166 166 166 205 180 174 174 174 134 174 205 202 202 202 202 172 181 181 180 154 154 154 154 154 154 154 154 154 154 154 154 P/N SP90133 SP90135 SP90144 SP90145 SP90146 SP90147 SP90160 SP90161 SP90164 SP90166 SP90167 SP90168 SP90169 SP90170 SP90172 SP90173 SP90183 SP90184 SP90185 SP90186 SP90187 SP90188 SP90189 SP90190 SP90191 SP90192 SP90193 SP90195 SP90197 SP90198 SP90199 SP90200 SP90202D SP90202L SP90203D SP90203L SP90204 SP90205 SP90207 SP90208 SP90210 SP90211 SP90212 SP90213 SP90219 SP90224 SP90227 SP90228 SP90229 SP90230 SP90231 SP90232 SP90233 SP90234 SP90235 SP90236 SP90237 SP90238 SP90239 SP90241 SP90242D SP90242L SP90243D SP90243L SP90246 SP90247 SP90248 SP90249 SP90251 Page 176 176 189 189 189 189 205 205 134 134 134 201 201 201 176 176 173 173 156, 173 139, 173 156 156 156 156 156 156, 173 156, 173 156, 173 133 133 133 133 133 133 133 133 134 134 134 154 134 204 204 204 134, 139 204 204 172 134, 139 134, 139 134 134 134 134 134 133 133 133 133 133 133 133 133 133 133 133 133 133 133 P/N SP90252D SP90252L SP90253D SP90253L SP90263 SP90269 SP90272 SP90273 SP90279 SP90281 SP90282 SP90291 SP90292 SP90293 SP90294 SP90295 SP90320 SP90321 SP90322 SP90323 SPE10008 SPF01150 SPF01177 SPG01649 SPG01698 SPG02067 SPG02106 SPZ08234 SPZ08235 SPZ08240 SPZ08242 SPZ08246 SPZ08253 SPZ08255 SPZ08257 SPZ08259 SPZ08260 SPZ08261 SPZ17005 SPZ17007 SPZ17012 SPZ17015 SPZ17017 SPZ17019 SPZ17022 SPZ17023 SPZ17024 SPZ17025 SPZ17026 SPZ17027 SPZ17029 Page 134 134 134 134 173 133 133 173 139 139 139 183 183 183 183 183 133 133 182 198 198 181 181 178 180 180 180 172 172 172, 179 172 172 172 198 178 178 178 178 134, 139 181 172 177, 181 179 178, 181 178 181 181 177 177, 178 178 174, 179 221 For latest updates please visit our website: www.ophiropt.com/photonics 01.08.2013 Ophir Photonics sites Country USA Japan Israel Germany Company Ophir-Spiricon, LLC Ophir Japan Ophir Optronics Ltd Ophir Spiricon Europe Telephone (435) 753-3729 81-48-646-4150 972-2-5484444 49-4102-6671-802 E-mail [email protected] [email protected] [email protected] or [email protected] [email protected] Distributors list Ophir Spiricon Beam Profilers Ophir Photon Beam Profilers Country Company Telephone E-mail Australia & N.Z 612-9979-7646 [email protected] ● 612-9319-0122 49-4102-6671-802 54-11-4816-4585 49-4102-6671-802 [email protected] [email protected] [email protected] [email protected] ● ● ● ● ● ● ● ● ● ● ● 55-11-2910-6852 [email protected] ● ● ● 55-11-3862-2099 359-29-587-885 /86/89 [email protected] [email protected] ● ● ● ● ● ● 86-10-6263-4840 [email protected] ● ● ● Colombia Cyprus Czech Republic Denmark Finland France Georgia Germany Greece Hong Kong Hungary India Indonesia Ireland Raymax Applications Pty Ltd Warsash Scientific Ophir Spiricon Europe Sirex Medica S.A. Ophir Spiricon Europe Photonics Comércio e Importação Ltda Lynx Com. Imp. Ltda. ASTEL Titan Electro Optics Co. Ltd. Reyes Puyana Ltda. Vosimcon Medical Ltd. MIT s.r.o. Ophir Photonics Cheos Oy Ophir Spiricon Europe Intermet Ltd. Ophir Spiricon Europe Acta Ltd Titan Electro Optics Quantum Lasertech New Age Inno-V Global Ophir Spiricon Europe 57-7-643-53-07 357-2463-3621 420-241-712-548 972-2-5487414 358-201-98-64-64 49-4102-6671-802 995-32-518-303 49-4102-6671-802 30-210-600-3302 86-755-8320-5020 36-30-539-1501 91-124-408-6513 65-6296-1217 49-4102-6671-802 ● ● ● ● ● ● ● ● ● ● ● ● ● ● ● ● ● ● ● ● ● ● ● ● Israel New Technology 972-3-679-2054 ● ● Israel Ophir Optronics Ltd. 972-2-5484444 Italy Korea Korea Latvia Lithuania Malaysia Malta Norway Poland Portugal Romania Russia Singapore Slovakia Slovenia South Africa Spain Sweden Switzerland Taiwan Taiwan Ophir Photonics SOLEO CO., LTD. Jinsung Laser Optilas Ltd. Vildoma Inno-V Global Suratek Ltd Ophir Photonics Lasotronix Ophir Photonics Electro-Total. Crystaltechno Ltd. Inno-V Global Kvant spol. s r.o. EXTREME d.o.o. Hitech Laser Systems Ophir Photonics Ophir Photonics Ophir Spiricon Europe Unice E-O Services Inc. Titan Electro Optics Co. 972-2-5487414 82-31-420-2742 82- 42-823-5300 371-29-781-582 370-5-236-3656 65-6296-1217 35-621-574-385 972-2-5487414 48-50-010-0131 972-2-5487414 40-21-252-5781 7-495-234-5952 65-6296-1217 421-2-6541-1344 386-1-500-7113 27-12-349-1250 972-2-5487414 972-2-5487414 49-4102-6671-802 886-3-462-6569 886-2-2655-2200 ● ● ● ● ● ● ● ● ● ● ● ● ● ● ● ● ● ● ● ● ● ● ● ● ● ● ● ● ● ● ● ● ● ● ● ● ● ● ● ● ● ● ● ● ● ● ● ● ● ● ● ● ● ● ● ● ● ● ● ● Thailand Hakuto (Thailand) 662-259 -6244 ● ● ● Thailand Turkey UK Filtech Mitra A.S. Ophir Spiricon Europe 66-2880-1646 90-212-347-4740 49-410-2667 1802 [email protected] [email protected] [email protected] [email protected] [email protected] [email protected] [email protected] [email protected] [email protected] [email protected] [email protected] [email protected] [email protected] [email protected] [email protected] or [email protected] [email protected] or [email protected] [email protected] [email protected] [email protected] [email protected] [email protected] [email protected] [email protected] [email protected] [email protected] [email protected] [email protected] [email protected] [email protected] [email protected] [email protected] [email protected] [email protected] [email protected] [email protected] [email protected] [email protected] Choothong _wisuth@ hakutothailand.com [email protected] [email protected] [email protected] ● ● ● ● ● ● ● ● ● Australia & N.Z Austria Argentina BeNeLux Brazil Brazil Bulgaria China 222 01.08.2013 Ophir Photonics Power Meters For latest updates please visit our website: www.ophiropt.com/photonics ● ● ● ● ● ● ● ● ● ● ● ● ● ● ● ● ● ● ● See our website at: www.ophiropt.com/photonics ISO 9001:2008