1
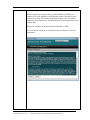
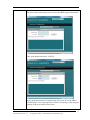
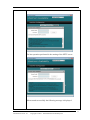
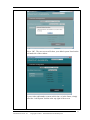
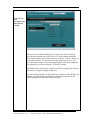
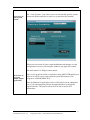
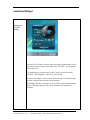
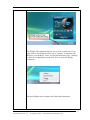
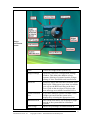
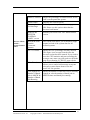
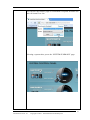
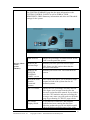
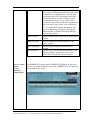
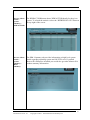
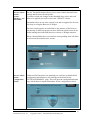
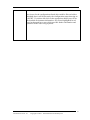
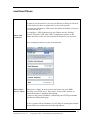
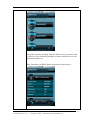
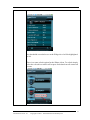
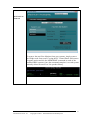
The SYSTEM SUMMARY page has the same information as the SYSTEM CONTROL PANEL as well as WRKACTJOB, WRKSYSSTS, IBM i Summary information and Alert and Threshold settings for the system. Browser Client Details – System Summary DISK POOLS Shows the percentage of DASD utilised for the ASP’s on the particular system. Return to the Previous Page Returns you to the previous browser page. Return to the ‘SYSTEM CONTROL PANEL’ screen Returns you to maxView Lite initial browser screen. Refresh the Data from the Connected Systems The refresh icon allows you to initiate a single manual refresh of the system data for all defined systems. CPU % Utilised Shows the CPU percentage currently utilised. This figure is an average from the time the browser session has been started. If you wish to reset the CPU statistics and start recording the averages once more you will need to refresh the page by performing a CTRL F5 page refresh. CFG Status Display Shield If you had one of Maxava’s HA products installed and were running the maxView Monitor product the greyed out shield wouold show the highest warning status of any of the Document Version: 1.0 NB: Please use this option rather than the browser back button. maxView Lite Guide Copyright 2000 – 2010 Maximum Availability Ltd. 23