1
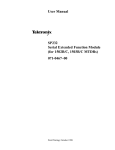
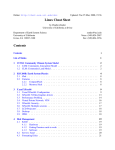
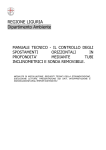
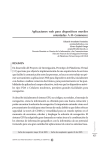
Submitted for Publication in:
"ENGINEERING GEOLOGY PRACTICE IN NORTHERN CALIFORNIA"
Association of Engineering Geologists
INSTRUMENTATION PRACTICE FOR SLOPE MONITORING
William F. Kane
President and Principal Engineer
KANE GeoTech, Inc.
P.O. Box 7526
Stockton, CA 95267-0526
Timothy J. Beck
Associate Engineering Geologist
California Department of Transportation
Transportation Laboratory
5900 Folsom Boulevard
P.O. Box 19128-0128
Sacramento, CA 95819
ABSTRACT
Remote monitoring of slope movement using electronic instrumentation can be an effective
approach for many unstable or potentially unstable slopes. Water levels can be observed
using vibrating wire piezometers. Movements and deformation can be determined with
electrolytic bubble “in-place” inclinometers and tiltmeters, extensometers, and time domain
reflectometry (TDR). All of these instruments can be attached to a programmed on-site
datalogger. The datalogger can collect readings at selected intervals and trigger an alarm
or initiate a telephone message or page if pre-determined movement intervals are exceeded.
These systems are self-contained using cellular telephone communications and batteries
charged by solar panels. Case studies in Central and Northern California illustrate the use
and flexibility of this technology in monitoring slope stability problems.
INTRODUCTION
Many options are available for monitoring unstable, and potentially unstable, slopes. These
range from inexpensive, short-term solutions to more costly, long-term monitoring programs.
The remote location of many unstable slopes has created a need for systems that can be
accessed remotely and provide immediate warning in case of failure. Advances in electronic
instrumentation and telecommunications now make it possible to monitor these slopes
economically.
Kane and Beck - 1/20
Slope stability and landslide monitoring involves selecting certain parameters and observing
how they change with time. The two most important parameters are groundwater levels and
displacement. Slope displacement can be characterized by depth of failure plane(s),
direction, magnitude, and rate. One or all of these variables may be monitored. Conventional
slope monitoring utilizes a single method or a combination of methods. Piezometers allow
the determination of water levels; surveying fixed surface monuments, extensometers,
inclinometers, and tiltmeters allow determination of direction and rate of slope movement and
depth and areal extent of the failure plane; extensometers provide an indication of
displacement magnitude. Manually operated probe inclinometers are the most common
means of long-term monitoring of slopes.
Available electronic instrumentation includes vibrating wire piezometers, electrolytic bubble
inclinometers and tiltmeters, and time domain reflectometry (TDR) for sensing changes in
slope conditions. This instrumentation can be monitored by technicians in the field, or
remotely by dataloggers and telemetry. By combining instrumentation types, a full array of
stability parameters can be observed. Computer software is available to quickly plot data,
allowing immediate assessment of slope conditions.
Critical facilities (dams, quarries, highways, housing developments, etc.) adjacent to unstable
slopes have created a need for monitoring systems which can provide immediate warning if
movement occurs. Advances in telecommunications and electronic instrumentation now make
it possible to economically monitor slope movements remotely. Many types of sensors and
data transmission systems are available. The case studies described in this paper are
monitoring systems installed in Central and Northern California. These systems used one or
more of the following types of electronic sensors: extensometers, tiltmeters, inclinometers,
and TDR. Telemetry was by either cell phone or hard wire phone. Power was provided by
rechargeable lead/acid batteries and solar panels.
INSTRUMENTATION FOR LANDSLIDE MONITORING
The critical data that are required from a slope monitoring program are the water level(s) in
Kane and Beck - 2/20
the slope and the depth and rate of movement.
Water Levels
The simplest method of monitoring water levels in a slope is to drill and case a borehole. The
water surface is located by dropping a measuring tape down the boring. While useful for
simple water table situations and where monitoring is required on an infrequent basis, other
methods may be more desirable. These methods involve the use of more sophisticated
instruments which may be mechanical or electrical.
Vibrating Wire Piezometers. A vibrating wire piezometer, Figure 1, works on the same
principle as tuning a guitar or piano (SINCO, 1994). A steel wire is stretched over a distance.
The wire is set to vibrating by “plucking” it with an electromagnetic field. The natural frequency
of the wire is a function of the tension in it. By reducing or increasing tension in the wire, the
frequency becomes lower or higher. The frequency of vibration can be sensed by the
electromagnetic coil and is transmitted to a readout device.
One end of the sensing wire is attached to a diaphragm that can be deformed by water
pressure entering through a porous tip. An increase in water pressure from elevated
piezometric levels reduces the tension in the wire by deforming the diaphragm inward. The
magnetic coil in the piezometer “plucks” the wire to vibrate it. The wire is plucked using
variable excitation frequencies and then allowed to return to its natural frequency.
The
magnetic coil then acts as a sensor which is used to “count” the number of vibrations. The
output signal is then converted into units of pressure or head.
Two piezometers are required to make accurate groundwater measurements. One should
read atmospheric pressure and the other downhole pressure. By subtracting the atmospheric
from the downhole pressure, the true water level can be obtained.
Vibrating wire piezometers should be considered at sites where frequent groundwater
measurements are required. For example, a site where rapid groundwater fluctuations are
suspected or where measurements are required during a critical event (rainfall, dam release,
etc.) Is ideal for using the device. Vibrating wire piezometers cost approximately US $350
Kane and Beck - 3/20
to $500 each.
Displacement/Movement Measurement
Probe inclinometers, “in-place” inclinometers, tiltmeters, extensometers, and TDR can be
used alone or in combination to monitor slope movement (Dunnicliffe, 1993). Probe
inclinometers require manual operation while the other sensors can be read electronically.
The electronic sensors can be coupled with a datalogger for automated data collection. These
automated systems also can be combined with telemetry to allow remote data collection.
Additional programming of the remote data collection system can be used to trigger a warning
of critical situations.
“In-Place” Inclinometers and Tiltmeters. “In-place” inclinometers and tiltmeters can detect
new movement, an acceleration of movement, and the direction of movement. “In-place”
inclinometers are installed in a borehole cased with inclinometer casing. The wiring for the
inclinometer can be buried and the boring covered with a locking cap to vandal-proof the
installation. Tiltmeters are mounted at the ground surface. They are an option for those sites
that are too steep for a drill rig or if the project budget does not allow for drilling. Tiltmeters
also can be covered with a vandal-proof enclosure and wires can be buried.
Electrolytic bubbles are used in tiltmeters and “in-place” inclinometers. An electrolytic bubble
is similar to an ordinary “bull’s eye” level, Figure 2. The fluid in this level, however, is an
electrical conductor which moves between three electrical nodes. One node is located at the
base of the vial (B), and two are located on the top (A and C) at an equal distance from Node
B. An electrical current is applied to the nodes and the resistance through the fluid is
measured. As the vial tilts clockwise, the resistance between A and B increases and the
resistance between B and C decreases. The change in resistance can be measured, and is
directly proportional to the angle of tilt. Prices for tiltmeters and “in-place” inclinometers range
from US $400 to $1000.
Extensometers. Simple mechanical extensometers use a steel wireline firmly connected to
a fixed location on the slope face on one end and to a track-mounted weight, located off the
Kane and Beck - 4/20
slide, on the other end. Movement of the slope pulls the weight along the graduated track.
The amount and rate of movement can then be measured manually. They are very
inexpensive, but critical events can be missed if readings are not taken in a timely fashion.
These installations are also susceptible to vandalism and animal damage.
Extensometers can also use potentiometers to measure movement. Much like the rheostat
controls of a model electric train, the extensometer uses a variable resistance mechanism to
measure the amount of displacement. A moveable arm makes an electrical contact along the
fixed resistance strip as shown in Figure 3. The circuit’s resistance is based on the position
of the slider arm on the resistance strip. A regulated DC current is applied and the output
voltage corresponds to the amount of displacement along the resistor due to ground
movement. The wiring and sensor can be buried to make it vandal and animal proof.
Potentiometer extensometers cost approximately US $800.
Time Domain Reflectometry (TDR). Time domain reflectometry (TDR) is a relatively new
approach to monitoring slope movement (Beck and Kane, 1996; Kane and Beck, 1994,
1996a, 1996b; Mikkelsen,1996; O’Connor and Dowding, 1999). Originally developed to
locate breaks and faults in communication and power lines, its first geotechnical use was
around 1980 to locate shear zones in underground coal mines (Wade and Conroy, 1980).
This technology uses coaxial cable and a cable tester. Some of the advantages of TDR over
probe inclinometers are:
1.
Coaxial cable costs less than inclinometer casing.
2.
TDR readings take several minutes versus inclinometer readings that can take
over an hour to complete.
3.
The coaxial cable can be extended to a convenient reading location off the
slope or away from a highway.
4.
TDR readings can easily be automated.
5.
Slope movement can be determined immediately during data collection rather
than waiting until data is plotted on computer.
TDR does have some disadvantages as well:
1.
TDR cannot determine the actual amount of movement. Relative amounts can
Kane and Beck - 5/20
be estimated.
2.
The direction of movement cannot be ascertained from a TDR signature.
3.
The cable must be deformed before movement can be located. Simple
bending of the cable, without damage, will not indicate any movement.
4.
If water infiltrates a TDR cable, it will change the cable’s electrical properties
and may make signatures difficult to interpret.
Coaxial cable costs from US $0.20 to $2.50 per foot. Cable testers, for reading cable
signatures vary from about US $6000, for a used tester, to about $10,000 for a new one.
The basic principle of TDR is similar to that of radar. The cable tester sends an electrical
pulse down a coaxial cable grouted in a borehole, Figure 4. When the pulse encounters a
break or deformation in the cable, it is reflected. The reflection shows as a “spike” in the cable
signature. The relative magnitude and rate of displacement, and the location of the zone of
deformation can be determined immediately and accurately. The size of the spike increase
correlates roughly with the magnitude of movement, although there is limited research on exact
correlations (O’Connor and Dowding, 1999) . A laptop computer is connected to the tester
and cable signatures are transferred to disk for future reference.
TDR may also be used as a piezometer to monitor water levels by allowing water to enter the
cable through holes drilled in the cable. Experience to date is limited and it appears that it
cannot measure deformation beneath the water surface. This is because of changes in the
cable’s electrical properties due to water infiltration (Kane and Parkinson, 1998).
AUTOMATED AND REMOTE DATA ACQUISITION
Automated data acquisition can be done with a datalogger and electronic sensors. This type
of system requires periodic visits to the site to download the data. Remote data acquisition
equipment includes a datalogger, multiplexer, communication devices, and a power source.
In addition, software is necessary to program and interact with the datalogger.
Datalogger
A datalogger is essentially a small computer and voltmeter with memory. It is programmed
Kane and Beck - 6/20
to do certain tasks. The Campbell Scientific CR10X logger used for this work can be
programmed to output specified voltages over certain durations, read voltages, and store
values (CSI, 1991a, 1991b). It can also be programmed to do calculations and store the
results, for example, converting the readings of a piezometer to feet of head. Dataloggers
cost about US $1200.
Instruments are wired to connections, or “ports,” on the logger. Control ports and excitation
ports can be programmed to transmit voltages at certain times to turn on peripheral
equipment, such as cell phones or cable testers. Other ports are wired to the sensors and are
used to measure output voltages.
By far, the greatest advantage in using electronic instrumentation is the fact that dataloggers
can be programmed to perform different tasks automatically. For example, a threshold
magnitude of sensor movement can be programmed into the datalogger. If this threshold is
exceeded, then the datalogger can trigger an action, such as activating a siren and/or flashing
light alarm. In most cases, this action is a phone call using an automatic telephone dialer.
These dialers are commonly used for home security systems. They are readily available and
cost around US $400. They can be programmed to deliver a recorded message or page to
multiple telephone numbers.
Multiplexer
A multiplexer allows many sensors to be attached to a single datalogger. A single multiplexer
can have as many as sixteen instruments attached to it, and multiplexers can be wired to one
another for a theoretically unlimited number of instrument hook-ups. The multiplexer is wired
to a single set of ports on the datalogger. A set of contacts in the multiplexer switches
between each sensor attached to it. The data is collected sequentially by the logger.
Multiplexers can be multiplexed to each other creating the ability to read a large array of
instruments. Multiplexers can be purchased for about US $600.
Communications
Communications with the datalogger can be by several means. “Hardwired” telephone lines
Kane and Beck - 7/20
are the most reliable, but not always available. Cellular and satellite telephones can be used
as well as radio transceivers. A telephone line only requires a modem to transmit data and
receive instructions. The other methods require modems and cell phones and/or radio
transceivers. Modems cost around US $400 while cellular telephones with antennas can be
purchased for about US $750 plus monthly service fees. Radio and satellite systems can run
about US $2000 and $5000 respectively.
Power
Power requirements vary depending on the number of instruments and the communication
device. Ideally, power is available at the site but that is often not the case. A small system
with a phone line and one or two sensors requires only a small rechargeable gel-type battery.
A larger system with cellular phone and cable tester requires a 12V deep cycle marine battery.
The battery is recharged by regulated solar panels.
Regulated solar panels cost
approximately US $250. Batteries run from US $25 to $100.
Software
Specialized software is required to process the raw data. When TDR cables are read,
signatures can be digitized and downloaded to a laptop computer when using Tektronix, Inc.
software (Tektronix, 1994). Plotting several TDR signatures on the same plot requires the
user either write a specialized spreadsheet or use a commercially available program such as
TDRPlot (Huang et al., 1993; Kane and Parkinson, 1998). Piezometer data is best viewed
with a spreadsheet. Electrolytic bubble tiltmeters and inclinometers used in the work
described here were plotted using TBASEII (AGI, 1997).
To program and communicate with the datalogger, programs such as Campbell Scientific’s
PC208W were developed (CSI, 1997). The program allows the user to write code for
datalogger control; contact the remote station, either automatically or manually; monitor
instrument readings; and download data.
Security
Another consideration is instrument security. Weather and vandalism destroy equipment.
Kane and Beck - 8/20
Weatherproofing the instrumentation can be done using a fiberglass enclosure that is sealed
to the elements. These are available from instrument manufacturers at prices ranging from
US $200 up to around $800. A protective enclosure often is necessary to prevent vandalism.
An enclosure can be as simple as a 2-ft (0.6-m) corrugated metal pipe (CMP) with a steel
plate lid. However, steel traffic signal control boxes, costing about US $800, provide excellent
protection.
INSTRUMENTATION CASE STUDIES
The 1998 El Niño storms of January and February caused a large number of landslides in
California (CDMG, 1998; USGS, 1998; Bedrossian and Etzold, 1999). Repair of these
landslides required immediate action in often hazardous conditions. At some locations, the
relative ease and cost-effectiveness of TDR allowed the determination of the depth to the
shear plane. At other locations, remote automated monitoring/warning systems were required
during slope reconstruction to assure the safety of workers and the general public. The
locations of the sites described below are shown in Figure 5.
Mussel Rock Landslide, San Mateo County
Continued long-term movement of the Mussel Rock Landslide necessitated its repair before
construction of a park and golf course complex. Repair measures required determining the
location of the depth to the failure. Initial plans called for a site investigation of five borings and
the installation of a single inclinometer to monitor movement.
Because of the cost
advantages of TDR, it was decided to use TDR cables in all five borings. The TDR was
monitored periodically for a fraction of the cost of monitoring the single inclinometer hole.
Because five borings were monitored, instead of a single inclinometer casing, the depth and
areal extent of the slide plane was able to be determined, as shown in Figure 6. TDR was
used in this case to locate the depth and determine the extent of the shear surface.
Figure 7 contains an example of TDR signatures from two cables. Note that failure began at
the lowest of the two, B-15 and then progressed to B-18. Cable B-19 showed a similar
pattern indicating progressive movement along the slide plane up the slope. Cables B-16 and
B-17 showed no change, thus locating the head and toe of the slide as shown in Figure 7.
Kane and Beck - 9/20
Highway 1, Mendocino County
A portion of California Highway 1 crosses a landslide complex approximately 200-m (650-ft)
wide, just north of the town of Elk. The depth to the failure plane was required to design the
fix for this slide. In November 1997, a TDR cable was grouted in a borehole drilled in the
center of the southbound lane. The cable was extended in a groove in the pavement off the
shoulder of the road. This allowed readings to be taken without stopping traffic. This saved
a significant amount of labor cost and increased worker safety. The slide complex was
activated as the winter rains infiltrated into the slide mass. The cable deformed at a depth of
6.4-m (21-ft), as shown in Figure 8, accurately locating the depth to the shear zone at the
soil/rock interface. A second cable was installed in the slide later that winter. It failed to detect
any movement, indicating that the slide had stopped moving for the year.
Interstate 15, Riverside County, California
The California Department of Transportation (Caltrans) installed a monitoring system in oversteepened slopes in a sand pit adjacent to Interstate 15 in Riverside County. Two TDR
cables, 52-m (170-ft) deep, and two vibrating wire piezometers were installed between
Interstate 15 and the pit. A remote data collection system was also installed. It included a
datalogger, piezometer signal conditioner, a multiplexer connected to the TDR cables, and
a cell phone and modem for data transmission. Power was supplied by a 12 volt deep cycle
marine battery and 20 watt regulated solar panel. Because the cell phone required significant
current, it could not be kept on at all times without draining the battery completely. Instead, it
was turned on for intervals during the day for automated data acquisition.
The system was programmed to read the two piezometers every morning, calculate the head
of water present in the slope, and store the values in memory. It then turned on the cable tester
and sequentially accessed and digitized the cable signatures from the TDR installations.
After data collection, the cell phone was turned on and a computer in Sacramento, about 560km (350-mi) away, dialed the cell phone number and downloaded the data. The piezometer
data was plotted using a spreadsheet program and the TDR data with TDRPlot. Data was
collected for over a year before the system was removed for installation at another site. The
data showed no change in slope conditions during the monitoring period.
Kane and Beck - 10/20
State Highway 17, Santa Cruz County, California
In January 1998, a landslide/debris flow destroyed a small Santa Cruz County road adjacent
to California Highway 17. Caltrans constructed a soldier pile wall at the head of the slide to
protect Highway 17 from future movement. Caltrans was concerned that progressive failure
at the head scarp would jeopardize the stability of the wall.
A monitoring system consisting of a datalogger, cell phone, and phone dialer was installed.
The system monitored a tiltmeter attached to the wall, and an extensometer.
The
extensometer was attached to the wall at one end and anchored near the head scarp at the
other, similar to the diagram shown in Figure 3b. The datalogger was programmed to monitor
both instruments and determine if a threshold movement was reached. If the threshold was
exceeded, the phone dialer immediately notified personnel by means of pagers. The system
also was automated to download data everyday to an office computer. No significant
movement of the wall has occurred to date.
State Highway 1, Monterey County, California
Numerous slides along California Highway 1 in San Luis Obispo and Monterey Counties
closed portions of the road throughout the winter of 1998. Grandpa’s Elbow Landslide in
Monterey County was a reactivated an older landslide complex. To protect motorists and
clean-up crews, Caltrans instrumented the slide with four downhole, “in-place” electrolytic
bubble inclinometers attached to a coaxial cable in a 200-ft borehole. The inclinometers were
positioned at depths of 150-ft, 100-ft, 50-ft, and 10-ft, Figure 9. Any movement of the slide
changed the tilt of the inclinometers and triggered a warning by phone dialer and hard-wire
telephone line. The system could also be monitored remotely by computer and modem.
Soon after installation, slight movement of the inclinometers triggered the telephone dialer and
personnel were paged. TDR cable readings showed the development of a spike in the cable
at a depth of 9-m (30-ft) indicating movement, Figure 10. Observation of tension cracks in the
ground surface verified the fact that some movement had taken place. Because of the shallow
nature of the movement and its location relative to the roadway, there was no imminent danger
and no action has been taken to date.
Kane and Beck - 11/20
CONCLUSIONS
Sensors, including vibrating wire piezometers, electrolytic bubble inclinometers and tiltmeters,
and TDR are available to monitor groundwater and ground movement for slope stability.
Advances in electronic technology, coupled with economical prices, make remote monitoring
cost-effective and a powerful tool in slope stability work. This instrumentation will provide
much of the information necessary, not only to monitor slopes, but to obtain some of the
necessary parameters for mitigation and remediation.
There are many manufacturers of the various instruments described in this paper. The authors
do not specifically endorse any of these products. Design philosophies and suitability to
particular problems will dictate the appropriate method. Readers are urged to investigate all
opportunities before purchasing any instrumentation.
REFERENCES
AGI (Applied Geomechanics, Inc.), 1997, TBASEII user’s manual: Applied Geomechanics,
Inc. Santa Cruz, CA.
Bedrossian, T. L. and Etzold, R., 1999, The 1998 storm-related events, a response: California
Geology, v. 52, pp. 4-12.
Beck, T. J., and Kane, W.F., 1996, Current and potential uses of time domain reflectometry
for geotechnical monitoring: Proceedings, 47th Highway Geology Symposium, Cody, WY.,
Wyoming Department of Transportation, p. 94-103.
CSI (Campbell Scientific, Inc.), 1991a, CR10X measurement and control module operator’s
manual: Revised 5/97, Campbell Scientific, Inc., Logan, UT.
CSI (Campbell Scientific, Inc.), 1991b, Campbell Scientific TDR soil moisture measurement
system manual: Revised 2/92, Campbell Scientific, Inc., Logan, UT.
CSI (Campbell Scientific, Inc.), 1997. PC208W datalogger support software instruction
Kane and Beck - 12/20
manual: Revision: 5/97, Campbell Scientific, Inc., Logan, UT.
CDMG (California Division of Mines and Geology), 1998, Landslide reports from various state
offices between February 3,1998 and April 30,1998: California Division of Mines and
Geology Web Page, http://www.consrv.ca.gov/dmg/minerals/98landslide/24.htm.
Dunnicliff, J., 1993, Geotechnical instrumentation for monitoring field performance: John Wiley
& Sons, Inc., New York, 577 p.
Huang, F.-C., O'Connor, K. M., Yurchak, D. M., and Dowding, C. H., 1993, NUMOD and
NUTSA: software for interactive acquisition and analysis of time domain reflectometry
measurements: U. S. Bureau of Mines Information Circular 9346, 42 p.
Kane, W.F. and Beck, T. J., 1994, Development of a time domain reflectometry system to
monitor landslide activity: Proceedings, 45th Highway Geology Symposium, Portland, OR,
pp. 163-173.
Kane, W. F., and Beck, T. J., 1996a, Rapid slope monitoring: Civil Engineering, American
Society of Civil Engineers, New York, v. 66, pp. 56-58.
Kane, W. F., and Beck, T. J., 1996b, An alternative monitoring system for unstable slopes:
Geotechnical News, v. 143, pp. 24-26.
Kane, W. F., and Parkinson, W. A., 1998, Remote landslide monitoring including time domain
reflectometry: Short Course Manual, KANE GeoTech, Inc., Stockton, CA.
Mikkelsen, P. E., 1996, Field instrumentation: in Turner, A. K., and Schuster, R. L. (eds.),
Landslides. Investigation and Mitigation, Transportation Research Board, Special Report 247,
National Academy Press, Washington, DC, pp. 278-316.
O’Connor, K. M., and Dowding, C. H., 1999, Geomeasurements by pulsing TDR cables and
Kane and Beck - 13/20
probes, CRC Press, Boca Raton, FL, 402 p.
SINCO (Slope Indicator Company), 1994, Applications guide: Slope Indicator Company,
Bothell, WA 2 nd Edition.
Tektronix, 1994, 1502B metallic time domain reflectometer operator manual: Textronix, Inc.,
070-6266-01, Redmond, OR.
USGS (United States Geological Society), 1998, El Niño and recent landslides: United
States Geological Survey Web Page, http://geohazards.cr.usgs.gov/elnino/elninols.html.
Wade, L. V., and Conroy, P. J., 1980, Rock mechanics study of a longwall panel: Mining
Engineering, pp. 1728-1734.
Kane and Beck - 14/20
Figure 1. Schematic of vibrating wire piezometer.
Figure 2. Schematic of electrolytic bubble. See text
for explanation.
Kane and Beck - 15/20
Figure 3a
Figure 3b.
Figure 3. Schematic diagram (Figure 3a) of variable resistance potentiometer used in a slope to monitor
movement (Figure 3b). Sliding contact moves within joint to change voltage output of extensometer as
slope moves.
Figure 4. Deformed cable resulting in signature “spike” on cable tester
screen.
Kane and Beck - 16/20
Figure 5. Location map showing case studies.
Kane and Beck - 17/20
Figure 6. Relative location of TDR boreholes in Mussel Rock Landslide, San Mateo County.
KANE GeoTech, Inc.
San Mateo County Landslide
TDR Cable B-18
San Mateo County Landslide
TDR Cable B-15
5
5
B
C
D
C
D
E
E
Legend
A - 30 Jul 98
B - 6 Aug 98
C - 13 Aug 98
D - 28 Sep 98
E - 3 Nov 98
-5
-10
Legend
A - 30 Jul 98
B - 6 Aug 98
C - 13 Aug 98
D - 28 Sep 98
E - 3 Nov 98
-5
-10
-15
-20
-15
-25
Depth (Feet)
Depth (Feet)
B
A
0
A
0
-20
-25
-30
-35
-40
-45
-30
-50
-35
-55
-60
-40
-65
-45
-70
-75
-50
0
50
100
150
200
250
300
350
400
Relative Reflectance (millirhos)
0
50
100
150
200
250
300
350
400
Relative Reflectance (millirhos)
Figure 7. TDR cable signatures from Mussel Rock Landslide.
Kane and Beck - 18/20
Figure 8. TDR cable signatures from Mendocino County.
Figure 9. Schematic showing positions of electrolytic bubble inclinometers attached to
coaxial cable.
Kane and Beck - 19/20
Kane GeoTech, Inc.
California Highway 1
Grandpa's Elbow Landslide
20
A
0
B
-20
Depth (Feet)
-40
-60
-80
-100
-120
-140
-160
-180
Legend
A - 4 Apr 98
B - 23 Jun 98
-200
-220
0
15
30
45
60
75
90
105
120
135
150
Relative Reflectance (millirhos)
Figure 10. TDR cable signatures showing deformation
which activated alarm circuit.
Kane and Beck - 20/20