1
Infomat Manual
for version 100305
Magnus Rosell
March 5, 2010
Contents
1 Introduction
1.1 Infomat Basics . . . . . . . . . . . . . . . . . . . . . . . . . .
1.2 Bugs . . . . . . . . . . . . . . . . . . . . . . . . . . . . . . . .
2 Infomat as a Visualization and Exploration Tool
2.1 Interface overview . . . . . . . . . . . . . . . . . .
2.2 Matrix Visualization . . . . . . . . . . . . . . . .
2.3 Main View and the Overview . . . . . . . . . . .
2.4 Menu and Toolbar . . . . . . . . . . . . . . . . .
2.4.1 File . . . . . . . . . . . . . . . . . . . . . .
2.4.2 Image-menu and Toolbar . . . . . . . . . .
2.4.3 Views . . . . . . . . . . . . . . . . . . . .
2.4.4 Tools . . . . . . . . . . . . . . . . . . . . .
2.4.5 Algorithms . . . . . . . . . . . . . . . . .
2.4.6 Help . . . . . . . . . . . . . . . . . . . . .
2.5 Pixel View . . . . . . . . . . . . . . . . . . . . . .
2.5.1 The View button and the Current Lists . .
2.5.2 Selection . . . . . . . . . . . . . . . . . . .
2.5.3 Gathering . . . . . . . . . . . . . . . . . .
2.5.4 More . . . . . . . . . . . . . . . . . . . . .
2.6 Search . . . . . . . . . . . . . . . . . . . . . . . .
2.7 Stoplist . . . . . . . . . . . . . . . . . . . . . . .
2.8 Groupings and Groups . . . . . . . . . . . . . . .
2.8.1 Grouping Panel . . . . . . . . . . . . . . .
2.8.2 Grouping Edit Window . . . . . . . . . . .
2.8.3 Group Edit Window . . . . . . . . . . . .
2.9 Clustering Algorithms . . . . . . . . . . . . . . .
2.10 Standard Components . . . . . . . . . . . . . . .
2.10.1 Buttons . . . . . . . . . . . . . . . . . . .
2.10.2 Properties . . . . . . . . . . . . . . . . . .
2.10.3 Lists . . . . . . . . . . . . . . . . . . . . .
2.11 The Matrix – Grouping Concept . . . . . . . . . .
2.12 Example . . . . . . . . . . . . . . . . . . . . . . .
3 Infomat as a Processing Tool
3.1 Command Prompt Usage . . . . . . . .
3.1.1 ExampleClusterer . . . . . . . .
3.1.2 What Properties are Available?
3.1.3 Clusterer . . . . . . . . . . . . .
1
.
.
.
.
.
.
.
.
.
.
.
.
.
.
.
.
.
.
.
.
.
.
.
.
.
.
.
.
.
.
.
.
.
.
.
.
.
.
.
.
.
.
.
.
.
.
.
.
.
.
.
.
.
.
.
.
.
.
.
.
.
.
.
.
.
.
.
.
.
.
.
.
.
.
.
.
.
.
.
.
.
.
.
.
.
.
.
.
.
.
.
.
.
.
.
.
.
.
.
.
.
.
.
.
.
.
.
.
.
.
.
.
.
.
.
.
.
.
.
.
.
.
.
.
.
.
.
.
.
.
.
.
.
.
.
.
.
.
.
.
.
.
.
.
.
.
.
.
.
.
.
.
.
.
.
.
.
.
.
.
.
.
.
.
.
.
.
.
.
.
.
.
.
.
.
.
.
.
.
.
.
.
.
.
.
.
.
.
.
.
.
.
.
.
.
.
.
.
.
.
.
.
.
.
.
.
.
.
.
.
.
.
.
.
.
.
3
3
4
.
.
.
.
.
.
.
.
.
.
.
.
.
.
.
.
.
.
.
.
.
.
.
.
.
.
.
.
5
5
5
6
7
7
7
8
8
9
10
10
10
11
11
11
12
13
13
13
13
14
14
15
15
15
16
17
17
.
.
.
.
18
18
18
19
20
3.1.4 Experimentator
3.2 Program Structure . .
3.2.1 Properties . . .
3.2.2 Measures . . . .
.
.
.
.
.
.
.
.
.
.
.
.
.
.
.
.
2
.
.
.
.
.
.
.
.
.
.
.
.
.
.
.
.
.
.
.
.
.
.
.
.
.
.
.
.
.
.
.
.
.
.
.
.
.
.
.
.
.
.
.
.
.
.
.
.
.
.
.
.
.
.
.
.
.
.
.
.
.
.
.
.
.
.
.
.
.
.
.
.
21
24
24
25
Chapter 1
Introduction
Infomat is both a processing tool and a visualization tool. This manual will
(when it is complete) deal with both. The visualization will be covered in
Chapter 2 and the (non visual) processing will be covered in Chapter 3.
Please note! that this is work in progress: both program and manual.
This manual is definitely not complete and may in part be out of date as I
develop the program all the time. Still, I hope it will come to some use.
Further information can be found in the readme.txt file, the javadoc of
the program, which can be found in the doc subdirectory, and on the Infomat
website:
http://www.csc.kth.se/tcs/projects/infomat/infomat/
1.1
Infomat Basics
Infomat deals with objects that are called IObjects. Each IObject has a string
and an id number that uniquely identifies it. It also has, when applicable, a
reference to a location where the actual object is stored (like a actual text
file). In this manual they often will be called objects, for short.
Several IObjects can be stored in an IObjectGroup, and several IObjectGroups constitutes an IObjectGrouping. Through this manual these are also
called groups and groupings for short. Right now each IObject can belong
to only one IObjectGroup in every IObjectGrouping.
The main data structure in Infomat is a matrix, called an IMatrix. It is
an implementation of a sparse matrix1 . The objects along the axes of the
matrix, rows and columns, corresponds to IObjects. Each axes has a special
IObjectGroup called an IObjectSet. An IObjectGrouping can only contain
IObjects from one IObjectSet.
The IMatrix stores several IMatrixCells which holds information of the
relation between two IObjects, one from each IObjectSet. The basic information is a count, and a derived information is called a weight.
1
I am slowly developing a dense matrix structure, which might be useful sometimes.
However, for now all matrixes are handled as sparse. As the intended use of Infomat is
Information Retrieval it is not a problem. For the GUI to be really useful the objects
along the axes of the matrix has to be interpretable. When they are, the matrix is usually
sparse and/or small.
3
For a typical Information Retrieval scenario the row IObjects may constitute texts, with titles and locations in the file system, and the columns words
that appear in the texts. For each word that appear in a particular text an
IMatrixCell with the number of appearances is stored as the count. The
weight of the IMatrixCell can be calculated through a weighting scheme. An
IObjectGrouping of the texts (rows) could be a clustering or a categorization
of the texts.
Any information stored in a matrix may be investigated using Infomat.
1.2
Bugs
Though I have spent a considerable amount of time developing Infomat, there
are probably several bugs. When using the Infomat GUI it is a good idea
to keep an eye on the terminal window. Some trace text is printed there.
Also, if any of the internal functions do not work properly for some reason,
Infomat won’t shut down. It will only be indicated by the Exceptions that
are printed in the terminal. For many such Exceptions you will be able to
continue working, but that particular function did not have the desired effect.
4
Chapter 2
Infomat as a Visualization and
Exploration Tool
In this chapter Infomat as a visualization tool will be described. It allows
you to display a matrix, and group, order and alter it. You may do this along
the rows or columns. This chapter describes the GUI in an order that follow
the layout. It should be considered as a reference.
The last two sections are a bit different. Sections 2.2 and 2.11 describes
the most important concepts of the GUI and Section 2.12 describes the example matrix that is bundled with the program.
There is no undo function. Save your work!
2.1
Interface overview
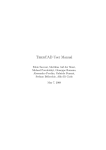
Figure 2.1 shows the interface. The main window (rightmost window) is
divided into five sections. At the top is the menu, below that the toolbar
and under that the grouping panel. The main view is the fourth section,
and the last section (the mouse pointer information panel) displays
information of the position of the mouse pointer (the picture position and
the corresponding (first) row and column object of the current matrix).
There are several other windows that appear in certain situations. From
the beginning the Overview (top left) is shown. The pixel window (bottom left) is vital for obtaining textual information for parts of the matrix.
Here the matrix elements for the pixel the mouse pointer is pointing to are
displayed.
In the following sections the main window sections and several other windows will be described briefly. Section 2.10 describes a few GUI components
that appear in several places. Finally, Section 2.12 describes a small example.
First, however, a short account of the visualization.
2.2
Matrix Visualization
Infomat stores a matrix, which is displayed in the main view and the overview. This picture is called a SparsePicture and consists of SparsePixels.
5
Figure 2.1: The Infomat interface. The overview window (above left) shows
a set of texts (rows) clustered into five clusters. The words (columns) are
clustered into five relative clusters (one word cluster per text cluster). A
rectangle indicates the part which is displayed in the main window (to the
right). The matrix elements represented by the pixel the mouse pointer is
pointing to are listed in the pixel window (below left). The non zero elements
are presented with their weight (w), and the row (r) and column (c) objects.
In this example texts have numbers as names. The bottom part of the main
window shows which pixel the mouse pointer is at and which is the first text
and word that it represent in the current ordering (both the order number
and the string).
If the matrix is bigger than the number of pixels in the main view, each
SparsePixel represents several matrix elements.
The opacity of the pixels are proportional to the weight of the matrix
elements they represent.
What is said in this Section is probably the most important thing to know
before you start using the tool. Almost as important is what is described
in Section 2.11. Before you read that you might benefit from learning a bit
more about the interface, especially about how Groupings are handled, as
described in Section 2.8.
2.3
Main View and the Overview
When you load a matrix, see Section 2.4.1, the whole matrix is displayed
in the main view and the overview, but many operations result in a partial
view. Which part is shown is decided thorough the Grouping Panel, see
6
Section 2.8.1. The Main view, further, may be zoomed in on any part of
the partial view. The Overview always displays all of it, and indicate by a
rectangle what part the main view shows.
The main view and the overview display a part of the matrix.
2.4
Menu and Toolbar
This sections contains a short account for the available menu options. As the
toolbar contains convenient short cuts to some of the options it is described
here as well.
The following subsections describes the content of the menus.
2.4.1
File
In the file menu you can save and load matrix files. It is also possible to
load a “token file”, which is a single file containing several texts. Look at the
example, Section 2.12, for the format.
It is also possible to save the picture in the main view as .png-file.
The Infomat Properties are some fundamental settings for the program.
They are displayed and altered through the Properties-GUI which recurs for
several settings through the program.
2.4.1.1
File Formats
The xml-formats are quite straight forward. You should be able to figure
them out by looking at the examples, see the "readme.txt".
2.4.2
Image-menu and Toolbar
The toolbar is divided into two sections, with two and five buttons. The five
first menu options on the Image menu corresponds to the five icons in the
second button section:
Pixel selection When the mouse is clicked on a pixel in the main view
information on it is displayed in the Pixel View window, see Section
2.4.3.
Drag For moving the selected zoom area.
Zoom selection By clicking, dragging and releasing the mouse within the
view that area is zoomed in.
Delete rows Click, drag and release to remove rows.
Delete columns Click, drag and release to remove columns.
7
The following two menu options corresponds to the leftmost two icons.
They toggle the group separators on/off. The last two options in the Image
menu toggles the guide lines (that helps with positions) on and off and resets
the zoom entirely.
All Image functions work in both the main view and the overview.
2.4.3
Views
The different Views are the main ways to get information. The options in the
Views menu are all toggle options: activating/deactivating the corresponding
view.
Pixel View The pixel view shows information on the pixel the mouse pointer
is currently pointing on and very much more. It is described in Section
2.5.
Selection View This part is not yet fully implemented and does not change
anything.
Similarity View In the similarity window you can change what similarity
measure is used for both rows and columns. You may also change the
Properties of the chosen similarity. The chosen similarities are applied
whenever appropriate: for many clustering algorithms and when sorting
IObjects according to similarity in different ways.
Overview The overview window shows the entire matrix and indicates which
part is currently visible in the main view.
Grouping Panel The grouping panel with all its functions is described in
its own section, Section 2.8.1.
Toolbar The toolbar is described in Section 2.4.2 on the Image menu.
Mouse Pointer Info The mouse pointer information panel (at the bottom
of the main window) gives direct feedback on which row and column
the mouse pointer is pointing to. The leftmost values gives the screen
coordinates for the pointer, while the rightmost present objects that
correspond to these coordinates in the compressed matrix. There is
always only one row and one column object presented. It the matrix is
large it is the first object. To get more information (all row and column
objects) you should use the pixel view, see Section 2.5.
2.4.4
Tools
There are several tools:
Evaluation Choose grouping to evaluate (and if you want to make an external evaluation a reference grouping) and press “Evaluate”. The measures can be saved and loaded in an xml-format.
Matrix Summary gives some basic matrix information.
8
Export to Text exports the currently selected grouping(s).
Search is a search tool similar to search engines. It is described in Section
2.6.
Stoplist is a rather complex tool that is described in Section 2.7.
Purge matrix removes all objects that are not displayed in the overview.
If you for instance have deleted certain uninteresting objects from a
grouping this function removes them from the matrix and from all other
groupings. Purge matrix is applied the moment you chose it from the
menu, whithot any options window.
Transpose matrix speaks for itself. This is applied directly.
2.4.5
Algorithms
The options in the algorithm menu are:
Clustering Algorithms Here you can choose between several clustering
algorithms. See Section 2.9.
Filter Matrix The Filter Matrix algorithm is straight forward: alter the
Properties and hit the apply-button.
Weight Matrix In the Weighting window you can choose between different
weighting schemes and alter their properties. When you are satisfied,
hit the apply-button. The weightings considered the rows to be the
objects, and the columns the representation.
Some things in the properties need explanations:
tf according to Croft 1983
tf i,j = c1 + (1 − c1 )
ni,j
maxi ni,j
(2.1)
idf according to Croft and Harper 1979
idf i = c2 + log
n − nword(i)
nword(i)
(2.2)
where ni,j is the number of times word i appears in document j (maxi ni,j
is the number of times the most frequent word in text j appears). In
the properties c1 is called (Local row/global column) weight importance
factor and c2 Global column weight belief factor.
Cluster Sorter The cluster sorter is work in progress. It allows you to
sort the clusters of the current clustering of the rows in order of their
value for a evaluation measure. Choose the reference grouping, choose
“ascending” or “descending” and hit “Sort by value”.
9
Description This is used to construct a description of a clustering of one
dimension in the other dimension. for text clustering groups of words
that consitute descriptions for the text clusters. Choose description
method (currently only the centroid description), choose wether to use
reduction and relative reduction. The two later are described below.
Here they are used to decide how many objects should be in the description groups, and (if choosen) to reduce the described clustering
accordingly.
Reduction This algorithm allows for reduction of all groups in a grouping.
There are two types: reduction and relative reduction (choose by clicking the button at the top). The reduction removes objects from each
group that are last in the list and/or not similar enough to the centroid
for the entire group. The relative reduction considers the groups of a
grouping of the other dimension as the centroids for the groups in the
grouping about to be reduced. For it to work the grouping along the
other dimension has to have the same number of groups.
2.4.6
Help
Try them! :)
2.5
Pixel View
Through the Pixel View you get textual information about the matrix as
ordered by the current groupings. This is a rather complex tool and is described in some detail here.
When you open it the first time it has just two panels. From the top
the main and current panels. When the mouse pointer points to a particular pixel the current panel displays all the matrix elements that the pixel
represents.
2.5.1
The View button and the Current Lists
The View -button in the main panel lets you choose between elements, rows
and columns. For elements the Elements-tab in the current panel displays
all the matrix elements that are represented by the pixel the mouse pointer
points to. They are presented as pairs, like: (row-object, column-object)
followed by a value, the weight of the matrix element. If you choose the
Rows(Columns)-tab the row(column)-objects for the matrix elements are
presented with the weight of the corresponding elements.
When the View -button is set to Rows(Columns) the Elements-tab does
not show anything. The Rows(Columns)-tab shows the row(column)-objects
associated with the picture row(column).
The selection (next section) is affected in the same way by the Viewbutton.
10
2.5.2
Selection
The Select-button in the main panel opens (and closes) two panels: the
select and selected panels. These panels allow you to study some objects
more thoroughly.
To select anything pixel selection has to be on. See Section 2.4.2.
The Select-button in the select panel lets you choose between Single and
All in area. If you click the mouse on a pixel when set to Single, the objects
in the current lists are stored in the selected lists. When set to All in area
you can select several objects by a click-drag-release procedure.
The objects stored in the selected lists are the recently selected. They
stay there when you move the mouse.
2.5.3
Gathering
The Gather -button in the main panel opens (and closes) two panels: the
Copy selected and Gathered panels. The gathered panel allow you to store
the addition of several sets of selected objects (as described in the previous
Section, 2.5.2).
The All, Elements, Rows and Columns buttons in the Copy selected panel
adds the corresponding list of the selected objects.
The How button lets you choose between three things. When it is set to
Accumulate if an object is already in the gathered list its value is increased
with the value it has in the selected list. When it is set to Add the latest
value for the object is stored, and when it is set to Set all previous objects
are removed and the selected ones are added.
2.5.4
More
The More-button in the main panel opens (and closes) three panels: the
Remove Gathered, Sort Gathered to Selected, and Select Gathered panels.
The Remove Gathered panels allow you to remove the gathered objects
from the matrix. The elements are removed from the matrix (it thus affects
all groupings), while the rows and columns are only removed from the current
shown groupings. To remove these from the matrix and all groupings you
need to use the purge matrix option in the Tools menu, see Section 2.4.4.
The Sort Gathered to Selected panel allows you to sort the gathered
row(column)-objects in order of similarity to the all row(column)-objects
of the selected lists:
RowRow The similarity of each gathered row to all the selected row. The
row similarity measure (see Section 2.4.3) is used to extract the representation and calculate the similarity.
RowCol The similarity of each gathered row to all the selected columns
considered as a representation, using the row similarity measure.
ColCol The similarity of each gathered column to all the selected columns,
using the column similarity measure.
11
ColRow The similarity of each gathered column to all the selected rows
considered as a representation, using the column similarity measure.
The Select Gathered panel lets you move the gathered objects to the selected panel. There are four straight forward buttons: All, Elements, Rows
and Columns sets the selected objects, overwriting the previous selected objects. The El for RC extracts the matrix elements that intersect with the
rows and columns of the gathered objects and sets them as selected objects.
The RC for El does the opposite.
The last row of the Select Gathered panel lets you extract the representation for the objects. With the C for R button you set the columns of the
selected list to the objects that represents the rows of the gathered list according to the row similarity. The C for R button uses the column similarity
analogously.
2.6
Search
The search tool works similarly to a search engine. You compose a query
and then get the resulting list of objects that correspond to that query. It is
possible to search for both rows and columns.
The tool consists of three panels. The left one lets you formulate a query;
the list of rows and/or columns at the bottom. Enter space separated strings
in the text field and press one of the buttons below. You could also import any
list using the “Load” button (as usual). The search strings can be formulated
in javas syntax for regular expressions if you start with a left bracket ([).
An example: [\p{Alnum}]e[\p{Alnum}]* returns all objects with a string
beginning with one letter or number, followed by an e, and ending with with
any number of letters or numbers. This would give for instance: “team”, “see”
and “be”.
The right panel gets filled with the result for each query. It is sorted
according to similarity (using the current similarity measure) to the query
vector.
The middle panel is divided into three parts. In the top part, press the
“Search” button to get the result for the query in the result of the right
panel. You can choose wether to search from the list or the text field. You
can formulate a query in text and then generate a list query by pressing the
button below the text field.
The middle section of the middle panel contains some properties for the
search. So far, the only property is how many of the search terms must appear
in all objects. If you use the text field a term is a space separated character
string, meaning that a group of terms defined by a regular expression will be
considered as one term. This is very convenient sometimes.
The bottom part of the middle panel lets you disply the search result
graphically as a grouping in the main and overview. Choose wether to consider rows or columns, to display the result or the query, if the grouping
should consist of one group or one group with the rest in a rest group, and
whether the result should be displayed directly or as a coloring. Press “Apply”.
12
2.7
Stoplist
The stoplist tool is an implementation of the common notion of a stoplist in
information retrieval. It can do a little bit more though.
The stoplist window has four panels. The leftmost shows several Properties, that might be altered. The middle panel allows you to load and save a
list of ordinary strings from/to a simple text file.
The rightmost third of the stoplist window consists of two panels. The
top panel is a list of IObject:s that can be removed (stopped). These might
be loaded from an xml file (and saved as well).
The button From Strings to IO allows you to convert the strings into
IObject:s that can be removed from the matrix. Only IObject:s that exist
in the matrix are generated. IObjects may be converted into a list of strings
using the From IO to Strings button.
In rightmost bottom panel Main you choose which matrix dimension
that is considered. The Apply button removes the IObject:s currently in the
IObject list from the matrix and all groupings.
Using the “From IO to Strings” button you can save any list of objects in
a simple text format.
2.8
Groupings and Groups
Infomat stores a matrix. It is displayed in the main view and the overview in
order of a row and a column grouping. A grouping consists of one or several
groups, which together contain all or some of the IObjects in the matrix.
This sections describes how the groupings and groups are managed.
2.8.1
Grouping Panel
Through the grouping panel all handling of the groupings is devised. It is
divided into two sections, one for rows and one for columns. They work
similarly.
The topmost drop down menu displays the currently selected grouping.
When you choose the grouping here the order of the objects along the dimension (rows or columns) changes.
The bottom drop down menu selects the coloring grouping. For the rows
this leads to a coloring of the pixels, and for the columns a coloring of the
background columns. The pixels are averaged over the matrix elements they
represents, while the column coloring is averaged over the entire columns.
When the E -button beside each drop down menu is pressed a grouping
edit window is displayed. It is described in the next Section, 2.8.2.
2.8.2
Grouping Edit Window
The grouping edit window looks a little different depending on which of the
four groupings it concerns. They all have the following sections:
13
Name panel Here the name of the grouping is displayed. You can alter it.
Groups panel Here all the groups are displayed. For each group you can
alter the name and press the E -button, which opens up a group edit
window. It is described in Section 2.8.3.
Reordering panel By changing the order of the numbers in the text filed
and pressing the Apply button you can change the order of the groups
in the grouping. If you leave a group out it is deleted - a very convenient
way to remove one or more groups.
File panel Here you can load and save groupings. For either to work there
has to be a matrix loaded.
For coloring groupings you can change the color of each group in the
groups panel. The change does not take effect until you press the Apply
button in the coloring panel which (for coloring groupings) is located between
the reordering panel and the file panel. There you can also reset the coloring
to the default colors.
The opacity of the pixels can be altered in the “row show” grouping edit
window and the opacity of the column coloring in the “column coloring”
grouping settings window. By default the column coloring opacity has a
lower range than the pixel opacity.
2.8.3
Group Edit Window
The group edit window have the following sections:
Info panel Here the name of the grouping is displayed. You can alter it.
Main panel Here, you can apply any changes you make in the list panel to
the actual group, using the Apply List Order button.
List When you open a group edit window the list panel contains all the
IObjects in the group. You can alter it in many ways, using the list
manipulations. The similarity that is used is the row or column similarity from the Similarity View, see Section 2.4.3. For the manipulations
to affect the group you have to press the Apply List Order button.
You can open group edit windows from the main view: right click and
choose either the row or column cluster for the current pixel.
2.9
Clustering Algorithms
There is a Clustering Algorithm Window. In it you can decide if you want
to cluster rows or columns. You choose algorithm in a combo box. The
algorithms all have some properties that can be altered, like for instance the
number of clusters. The algorithm window explains these properties rather
well.
14
K-Means K-Means clustering
Bisecting K-Means Bisecting K-Means clustering
Relative Clusterer An algorithm that cluster the columns (or rows) relative the rows (columns). The column objects that have the highest
weight in the first row cluster is assembled into a first column cluster,
and so on.
Appearance Relative Clusterer An algorithm that cluster the columns
(rows) relative to the rows (columns). A column group is created for
each row group. Each column object is put in the column group corresponing to the row group in which it first appears (the first non-zero
matrix element in the column). The objects are ordered in the column
group according to the order in which they appear. Ties are broken by
their id number.
Random Clustering Just what it sounds like.
Location Grouper constructs a grouping based on the location of the objects in the file system, if this information is available.
The clustering algorithms are applied to the whole matrix, not just the
part that is displayed at the moment!
2.10
Standard Components
The GUI makes use of some standard components that appear in several
places. This section describes some of their functions in more detail.
2.10.1
Buttons
Most buttons have direct effect. There however, are several alternating buttons that only sets the contexts for actions. The typical example the Choose
rows or columns: button in the Clustering Algorithms window. It alternates
between the words Rows and Columns when you press it, the visible being
what you have chosen. Most alternating buttons has a leading text ending
with a colon and it should be rather obvious from the context.
2.10.2
Properties
A lot of functions could be applied in several different versions. Instead of
presenting all of them separately they have properties that you can alter.
These properties can be saved in an xml format and recalled. There is also
a default setting.
The properties gui is easy to understand. Each property has a value that
is displayed. You can alter it by typing in a new value and hitting enter. If
15
your new value is allowed the value of the property changes, if it is not it
does not.
Some property values are completely open, you can type in anything
you want. If you type something inappropriate here (like for instance -5
clusters in a clustering algorithm) and apply the function Infomat throws
java Exceptions.
2.10.3
Lists
Lists appear in several functions. They can display IObjects, and IMatrixCells and simple java Strings. Lists have many functions. Depending on the
context not all of them are available. It is for instance not possible to load
and save IMatrixCells.
The list gui consists of two parts: the list of objects and above that a few
functions. The objects are presented in a textual way, often accompanied by
a value indicating their order. If the name of the object appears like a button
you may open the object in a simple viewer by clicking it. The objects also
have a checkbox that you may tick.
The function part of the gui has at most three rows, from the top:
File The file row lets you load and save the list of objects. The loading
is usually restricted by a IObjectGroup, meaning that you will only
actually load those that is in that particular group. For the Group Edit
window it is the corresponding IObjectGroup. In most other cases it
is the IObjectSet of the IMatrix corresponding to the rows or columns
depending on the context.
Sel The selection row allows you to handle selected objects. The Sel button
selects all objects, the Desel button deselects all objects, the Rm button
removes all currently selected objects, and the Inf button inverses the
selection.
Order Here you can reorder the objects in the list. There are several possible
orderings. You choose between them in the combo box and applied
them on the objects by pressing the Apply button.
This has no other effect than the ordering in the list. For an ordering
to have effect on anything else you have to do more. On a group for
instance you have to hit the Apply List Order button, see Section 2.8.3.
The two first uses the similarity measure along the rows or columns
depending on the context. These are only available in some of the lists.
Sim. to Sel. Sorts all objects in order of similarity to the selected
objects.
Similarity Sorts the objects in order of similarity to all the objects in
the list.
Literal Sorts the object in literal order.
Random Makes a random permutation of the objects
Invert Inverts the order of the objects.
16
Original When the list is displayed for the first time it has a particular
order. Through this you can revert to it. There is one exception.
When hit the Apply List Order button in the Group Edit Window
the new order is set as the original.
To the right in the function part of the gui there is an indicator that shows
how many of the objects in the list that are displayed (“50/172”). There is
also a small text field in which you may alter the maximal number of objects
that should be displayed. Type a new number and press enter.
The gui only present a small part of the entire list for efficiency reasons.
2.11
The Matrix – Grouping Concept
Infomat is quite a complex tool. The single most important thing to keep
in mind when using it is that the view presents the matrix through a row
and a column grouping. The matrix may contain several objects that are not
visible. Some functions work on the visual groupings and some work directly
on the matrix behind them. This section describes some implications of this
fact.
Each grouping is a view of the matrix. Use the purge matrix option in
the tools menu to force the matrix to contain only the objects in the current
row and column groupings. The objects are also removed from all other
groupings simultaneously.
Some functions work on the groupings and some work on the matrix
directly. When you remove matrix elements you always remove them directly
from the matrix. Row or column objects, on the other hand, are removed
either from the current grouping or the matrix directly, depending on the
tool you use.
A list of functions that remove row and column objects from the groupings
and not from the matrix:
• Through the toolbar and image menu.
• Through the Pixel View window.
• Through the Group View window (after you have pressed the Apply
List Order button).
When you have removed objects and/or matrix elements (and purged
the matrix), remember to weight the matrix again, using the Weight Matrix
function in the algorithm menu.
2.12
Example
In the directory /Infomat/example/ you find a few files to start with. Read
more in the readme.txt file.
There is also a larger example available on the website.
17
Chapter 3
Infomat as a Processing Tool
This chapter explains some of the possibilities with Infomat when it is not
used with the graphical user interface as a visualization tool. It is divided into
two sections, that discuss the command prompt possibilities and the program
structure. The later to help programmers to use the Infomat classes for other
tasks.
3.1
Command Prompt Usage
The simplest class to use is the ExampleClusterer. It generates a clustering
of the example set that is distributed with Infomat. How to run it is described
in the readme.txt file and Section 3.1.1.
There are so many parameters to set that I have decided to not let the
user set all of them in the command prompt. Instead, for the other classes
described here you have to save Properties files for the different functions
of the program. Properties files are xml files with values. There is a lot of
functionality in Infomat that use them.
3.1.1
ExampleClusterer
How to run the ExampleClusterer is described in the readme.txt file. It
runs the K-Means algorithm on the English example. You can not alter
anything from the command prompt. This class does the same thing every
time, but the result may differ due to K-Means random initialization.
The result is essentially two xml-files, with names like:
• clustering.1222852580758.xml
• clusteringEvaluation.1222852580758.xml
• clusteringResult.1222852580758.xml
where the number is the system clock time. The first file contains a full
clustering result.
The second file is the index file for a textual presentation of the clustering
result. You may look at it in a browser and follow the links.
The third file contains an evaluation: a lot of measures. It can also be
viewed with a browser. It represents a Measures object corresponding to
18
such a class. Section 3.2.2 describes it in more detail, but you will be able
to use such files without reading that.
3.1.2
What Properties are Available?
The class WriteProperties helps with setting up default values for many
Properties.
..Infomat/>java infomat.WriteProperties <resultPath>
writes one Properties file each for several classes to the specified directory.
3.1.2.1
Altering Properties
You can open the xml files in an editor and change the values for the different
properties. The properties are rather self explaining. Each of them has a
name, a value and a description, that explains its purpose. A Property:
<p><n>Name</n><v>Value</v><d>Description</d></p>
Some of the Properties that are more difficult to understand have
PropertyValueDescriptions (<pvd> in the xml), that may help you as well.
If a Property has one or several PropertyValueDescriptions you have to
choose one of those values!
Some Properties are Strings. In order for that to work they have to have a
<str>-tag within the value field, for example: <v><str>a string</str></v>.
All files, and paths are treated as strings.
When you want to set a value to nothing it is accomplished like this:
<v>null</v>. This goes for Strings as well.
3.1.2.2
Some of the Properties
Here is a short list of some of the Properties files that are generated by the
WriteProperties class:
Dot_Product_Similarity_Properties.xml Properties for the dot product
similarity.
Evaluation_Properties.xml Properties for the evaluation.
IMatrixCell_Filter_Properties.xml Properties for removal of rows, columns
and matrix elements.
IObjectGrouping_Text_Result_Properties.xml Properties for exportation of results as browsable pages.
IObjectGroupingIO_Properties.xml Properties for exportation of full
clustering results. (Not browsable. The files you want if you want to
use the result somewhere else.)
KMeans_Properties.xml Properties for the K-Means algorithm.
19
Stoplist_Properties.xml Properties for the use of a stoplist. These properties are in addition to a file of stop objects (words most of the time),
when such a file is specified. If there is no file specified these properties
are applied alone. The stoplist file is not applied if this properties file
is not in the directory.
The stop file is usually specified in the Clusterer_Properties.xml or
Experimentator_Properties.xml file described below.
TFIDF_Weighter_Properties.xml Properties for the tf*idf-weighting
scheme.
3.1.3
Clusterer
The Clusterer runs one clustering, evaluates it and writes the clustering
result and the evaluation result to files:
..Infomat/>java infomat.Clusterer <properties path>
A toy example can be found in ...Infomat/examples/clusterer/. The
subdirectory properties/ contains properties that sets up a clustering.
..Infomat/>java infomat.Clusterer examples/clusterer/properties/
generates results in ...Infomat/examples/clusterer/result/. They consist of two files like for the ExampleClusterer.
You may alter the Properties in properties/, remove some, or substitute
them for others1 . The Clusterer will inform you if something is missing, or
if there are to many properties, making them ambiguous.
The properties path has to include several Properties files, the most
important being the Clusterer_Properties.xml file, which sets up the basics
for the clustering. Here is a description of the Property:s in it:
Result Path A string specifying where the result should be written.
Stoplist A string specifying a file with stop-objects (words for instance).
Opposite dimension to "Rows as Matrix Dimension". Combined with
stoplist Properties from file.
Rows as Matrix Dimension Whether rows or columns are regarded. Takes
one of two values: true and false. (Overrides the similarity measures
dimension.)
Matrix Source A group of Property:s that indicate how the IMatrix should
be loaded. One of the three has to have a value. The other two has to
have value null. The three possibilities:
Matrix File A string specifying an IMatrix file.
Token File A string specifying a Token file.
Inpath A string specifying a path from where files are read recursively.
1
Like for instance replacing the K-Means algorithm with the Bisecting K-Means algorithm.
20
Comparison Grouping A group of Property:s that indicate another grouping. If there is any the results will be compared to it in the Evaluation.
Anyone of the two could have a value, but only one. The two possibilities:
IObjectGrouping File A string specifying a file with a grouping that
works with the IMatrix.
LocationGrouper Construct a grouping by looking at the location
of the objects (true or false).
3.1.4
Experimentator
With the Experimentator class you can perform rather complicated experiments. The principles for running the experiments are the same as for the
Clusterer, see Section 3.1.4.1. The results may, however, become very hard
to overview. Section 3.1.4.2 explains how to generate convenient tables based
on the results.
3.1.4.1
Running an Experiment
The Experimentator class is very similar to the Clusterer:
..Infomat/>java infomat.Experimentator <properties path>
The difference is that the properties path now may contain a hierarchy of
directories that defines several clusterings. At the leaf directories all properties along the path from the root directory must define a clustering. If it
does not the Experimentator will abort and report this.
The results for each of the clusterings are written in a similar hierarchy
with the result path as the root. For each of these directories a subdirectory
properties/ is constructed. In it all properties for the corresponding properties path directory is saved, so it is easy to match results with properties.
In the root directory for the properties there has to be a Experimentator_Properties.xml file, which sets up the basics for all the clusterings. It
has the same Property:s as the Clusterer_Properties.xml file (see Section
3.1.3), plus one:
Number of Repetitions Number of times the clustering is done for each
set of properties.
So in each leaf directory of the result path hierarchy there will be Number
of Repetitions number of results, for clusterings as specified in the corresponding leaf directories of the properties path.
The Experimentator works most efficiently if the preprocessing is defined
(through Properties files) in the topmost directories, as it only keeps one
matrix in memory at the time2 .
There are two toy examples3 :
2
Actually two: the original from the Experimentator_Properties.xml file, and the current preprocessed one.
3
These and the following examples have line breaks for typographical reasons. They
should, however, of course, be written as a single line in the command prompt.
21
..Infomat/>java infomat.Experimentator
examples/experimentator/1/properties/
which generates results in examples/experimentator/1/results/, and
..Infomat/>java infomat.Experimentator
examples/experimentator/2/properties/
which generates results in examples/experimentator/2/results/. Looking at these should give you an idea of how to use the Experimentator.
Notice that the second example do not have any
IObjectGrouping_Text_Result_Properties.xml files, which leads to that
no textual result files are generated. This is very convenient when you run
large experiments with many repetitions, as the results otherwise tend to get
huge.
3.1.4.2
Extracting Results from an Experiment
The package mro.util.experimentation contains classes that helps you extract parts of the results generated by the Experimentator. This is actually
a very nice functionality for any kind of experiment, but it will described
here in the context of the Experimentator. The main objective is to calculate average values and standard deviations for the results in the result
directories.
You run the Experimentator like this:
..Infomat/>java
mro.util.experimentation.ExperimentResultGenerator <params>
If you give no parameters it displays some information. The possible parameter combinations are:
1. -resultPath <res-path> -averagePath <avg-path>
2. -structure <table-file.xml> -latex <res-file.tex>
3. -structure <table-file.xml> -matlab <res-file.m>
4. -structure <table-file.xml> -csv <res-file.csv>
We will deal with these in order here. The first generates a similar hierarchical directory structure as the one in the result path (<res-path>) in the
average path4 (<avg-path>). It will produce an average result file, called
average.xml, for every directory that has result files. It will also copy any
properties files. You can browse the average path hierarchy to compare average results.
Try this for the results for example one:
..Infomat/>java -cp classes/
mro.util.experimentation.ExperimentResultGenerator
-resultPath examples/experimentator/1/results/
-averagePath examples/experimentator/1/avg/
4
Do not choose the average path to be the same as the result path. If you do that twice
the averages from the first run will be included in the new averages.
22
The three other possible parameter combinations have a lot in common.
They all read a structure file in xml-format, that holds information on which
directories to process. There are examples on such structure files in both
tables/ directories in the Experimentator examples. There are lots of possibilities in the structure files. By looking at the DTD in the beginning of
the file you will be able to figure them out. Section 3.1.4.3 describes the
structure file in more detail.
The second possible parameter combination generates a latex table. It
reads a structure file (<table-file.xml>) in xml-format and writes a latex
file (<res-file.tex>) corresponding to this structure. Try this5 :
..Infomat/>java -cp classes/
mro.util.experimentation.ExperimentResultGenerator
-structure examples/experimentator/1/tables/structure.xml
-latex examples/experimentator/1/tables/table.tex
Compile the resulting latex file and you have a document you can look at.
It is a table with average results and (standard deviations). You may want
to alter some of the typography in the table, but is a good start when you
want to include results in a text of some sort.
The last two parameter combinations also reads the structure file, but
they disregard all row and column titles and generate two matrixes corresponding to the structure: one with the average values and one with the
corresponding standard deviations. Parameter combination three generates
two matlab matrixes in a file, that you can call from matlab to start working with the values. The last combination generates a similar csv -file (a
semi-colon-separated file) that can be read by for instance MS Excel.
There is one more example to try:
..Infomat/>java -cp classes/
mro.util.experimentation.ExperimentResultGenerator
-structure examples/experimentator/2/tables/structure.xml
-matlab examples/experimentator/2/tables/mat.m
This structure file use different settings for the extraction of values. Look
at the <pathtable>. For two values it rounds them to two decimals, for
one value to two significant figures, and for one value it keeps the whole
calculated value. The last is especially interesting if you will go on working
with the values in matlab or some other application!6
3.1.4.3
The Structure File
The previous section showed how to use the Experimentator. This section
describes the structure xml file that is used by the Experimentator.
The most complicated part of the structure file is:
<measureabbreviationtable>
5
For this and the following example to work you have to have run the Experimentator
examples in Section 3.1.4.1.
6
You would not want to work with rounded values!
23
<mae><abb>ASS</abb><n>Intrinsic Measures</n>
<n>Evaluated Grouping</n>
<n>Weighted Avereage Self Similarity</n></mae>
<mae><abb>NMI</abb><n>Extrinsic Measures</n>
<n>Global Extrinsic Measures</n><n>NMI</n></mae>
</measureabbreviationtable>
This table defines abbreviations (ASS and NMI in this example) for measures
that are used in the actual table. Each <mae> (measure abbreviation) consists
of an abbreviation and a number of names. The names specify a Measure
in a Measures xml file, by giving a series of names of MeasureGroup:s and
a name for a leaf Measure. The abbreviations are used further down in the
structure file, in the <pathtable>.
The <table>:s of the <columntitles> and the <rowtitles> allow you
to set up how the headers for both columns and rows should look like in the
latex file. <caption> defines a caption that will be used in the latex file.
Finally, the <pathtable> is where everything happens. here the values for
the measures specified in the <measureabbreviationtable> are extracted
from particular directories. The <commonpath> allows you to specify a start
for the path to the directories.
The <pathtable> consists of rows <ptr> and columns <ptc>. Each
column has the following structure:
<ptc><m>ASS</m><rd>3d</rd><p>KM/</p></ptc>
where <m> should contain a measure abbreviation, and <p> a path to a directory (which will be concatenated to the <commonpath>).
<rd> is optional. If it is not present the full value of the measure will be
extracted. This is useful when you like to continue working with the values.
If it is present, it should be a figure followed by a d or be an i. The first
leads to values rounded to the specified number of decimals, the second leads
to values rounded to integers.
3.2
Program Structure
This section deals with the programming issues of Infomat and aims at helping the developer use the different functions. More detailed information
about all classes can be found in the javadoc in the directory /Infomat/doc/.
The simplest example is the ExampleClusterer. How to run it is described in the readme.txt file. By looking at the code the programmer will
also get the first idea of how to use Infomat when writing own programs.
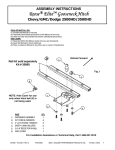
For now this section is very incomplete. As a first help I give a small
uml-diagram in Figure 3.1 for the most central data-structure classes used
by Infomat. These classes can all be found in the infomat.vectorspace
package and its subpackages.
3.2.1
Properties
This Section gives a short introduction to the Properties class.
24
«interface»
IVector
IVectorIndex
IObject
IMatrixCell
IObjectGroup
IMatrix
IObjectGrouping
IObjectSet
Figure 3.1: UML. Part of the Infomat data-structure
Objects of the Properties class contain a lot of Property:s that can be
grouped into PropertyGroup:s to provide more order. Groups can contain
groups in a hierarchy.
A short discussion on how to handle xml files representing Properties
objects can be found i Section 3.1.2.1.
3.2.2
Measures
This Section gives a short introduction to the Measures class.
Objects of the Measures class contains a lot of Measure:s that can be
grouped into MeasureGroup:s to provide more order. Groups can contain
groups in a hierarchy.
25