1
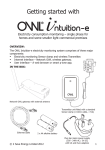
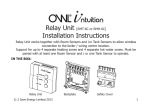
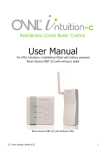
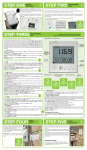
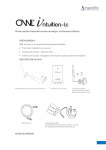
Getting started with
Electricity consumption monitoring – three phase
for larger homes and light commercial premises
OVERVIEW:
The OWL Intuition-lc electricity monitoring system comprises of three major
components:
• Electricity monitoring Sensor clamps and wireless Transmitter.
• Internet interface – Network OWL wireless gateway.
• User interface – A web browser or smart phone app.
IN THE BOX:
x3
WARNING
- RISK OF ELECTRICAL SHOCK
- Please Refer to User Manual.
MADE IN CHINA
MODEL : CMA116
Network OWL gateway with external antenna
Ethernet cable
Transmitter unit
3 channel
3 x plug-in large
Sensor clamps
(<17mm cable, <200A)
3 x AA alkaline battery
Plug top mains power supply
(100 - 240V AC / 5V DC)
with UK and Euro adaptors
© 2 Save Energy Limited 2012
1
BEFORE YOU START
Please locate and check that you have a spare
LAN port available on the back of your broadband
Internet router. You will need to plug in the
supplied Ethernet cable. If all of the ports are in
use, you can add more connections by purchasing
an Ethernet Switch / Hub.
You will also need a spare mains socket available
close by for the supplied Plug top mains power supply.
STEP ONE - Insert batteries into the
Transmitter
Slide back cover off of the Transmitter and insert
the batteries into the unit. Keep the Transmitter
with you alongside the Network OWL until Step
Six. You should NOT fit the Sensors at this time.
PART NO. CMR180i
MADE IN CHINA
INSERT 3 x AA BATTERY
STEP TWO - Power up Network OWL
• Ensure antenna is screwed, finger tight, onto brass connector on side of
the Network OWL.
• Select UK or Euro adaptor as required. Fit to the power supply and rotate
90° until it latches into place.
• Plug the power supply into the mains and insert the DC jack
connector into the base of the Network OWL.
• The green LED will flash rapidly. After about 30
seconds the blue LED will start a steady flash
indicating that it is in Pairing Mode.
• Quickly move to Step Three.
GREEN LED
CHECK FINGER
TIGHT
2
BLUE LED
PLUG IN DC POWER CONNECTOR
© 2 Save Energy Limited 2012
STEP THREE - Pair Transmitter to the Network OWL
• Ensure the Transmitter is next to the Network
OWL.
• Press the small “Check” button in the Transmitter
• • • • battery compartment until the red LED on the
front starts flashing.
The Transmitter is now in Check Mode and the
red LED on the front will start flashing every 2
seconds (for 30 seconds).
The pairing process will now take place and the
blue LED will start flashing a fraction of a second
after the red LED flashes.
When the Transmitter Check Mode finishes, if the
pairing was successful, the blue LED will flash
every time it receives data from the Transmitter
(every 12 to 60 seconds).
Replace battery compartment cover.
PART NO. CMR180i
MADE IN CHINA
PRESS
CHECK BUTTON
IMPORTANT Pairing Notes & Network OWL Factory Reset:
• If you don’t complete the pairing process within 60 seconds of the
Network OWL blue LED starting its steady flash, restart the process by
removing and re-inserting the DC power jack.
• You can quickly check for correct pairing at any time by pressing the
Transmitter “Check” button until the red LED starts flashing - if the
Transmitter red LED and Network OWL blue LED flash together they are
correctly paired.
• If you remove / change the Transmitter batteries you will need to remove
the existing pairing from the Network OWL and pair the Transmitter again.
To clear ALL pairings in the Network OWL including other paired devices
such as heating controls, carry out a full Factory Reset as follows:
• Factory Reset the Network OWL by pressing the reset button
while the power is on. Carefully insert a paperclip into the small
hole and hold the button pressed for a minimum of 10
seconds and release. The green LED will flash rapidly.
After about 30 seconds the blue LED will start a
steady flash indicating that it is in Pairing
Mode. After each Factory Reset you
must go through Step Seven,
the Web Dashboard “Create
Account” process again, but
ticking “Account Exists”.
RESET
BUTTON
PLUG IN ETHERNET CABLE
© 2 Save Energy Limited 2012
3
STEP FOUR - Connect Network OWL to the Internet
• Plug the Ethernet cable into the base of the Network OWL and a spare
LAN port on your existing broadband Internet router.
• Ensure the connector latches with an audible “click” at both ends and that
there is activity on the green & yellow LEDs above the Ethernet connector.
• Ensure so far as possible that there are no large metal objects in the radio
(direct) path between installed locations of the Network OWL and the
Transmitter. The wireless range is up to 30 metres (free space). Walls and
large objects will reduce this range.
Note: The table below describes the meanings of the LEDs visible on the
front face of the Network OWL.
Network OWL LED Meanings
LED
Pattern
Meaning
Blue
Steady flash following power up
N-OWL is in pairing mode
Blue
Flash every 12 to 60 seconds
Data received from paired Transmitter
Blue
Off for longer than 60 seconds
N-OWL is not paired or Transmitter is out of
radio range
Green
Rapid flashing
N-OWL is starting up
Green
Single blip
N-OWL is running
Green
Double blip
N-OWL is running &
Connected to LAN, DHCP IP address allocated
Green
Triple blip
N-OWL is running &
Connected to LAN, DHCP IP address allocated &
Connected to OWL servers (N-OWL Online)
Green
Single long flash
Connecting to OWL log servers
Green
Double long flash
Uploading logged data to OWL servers
STEP FIVE - Wait 2 mins for Network OWL to come online
• Once the Ethernet cable has been connected you should see the green
•
•
LED quickly progress from single blips to double blips.
It will now normally take up to 2 minutes for the Network OWL to securely
connect to the OWL servers, indicated by a triple blip on the green LED.
Do not progress to Step Six until the Network OWL is online.
IMPORTANT Internet Connection Notes:
• The Network OWL can normally connect to the OWL servers when
plugged into a normal domestic broadband router which has a default
security configuration.
• If the Network OWL does not connect within 5 minutes:
a. Ensure that your Internet connection is working by connecting to a
4
© 2 Save Energy Limited 2012
familiar site using your web browser.
b. Check Ethernet cable connections - remove cable and refit a few
times at both ends to remove any dust on the connections.
c. Try rebooting your broadband router by powering down for 10
seconds and then power back up. Allow 5 minutes for everything to
re-establish itself.
IMPORTANT Note for business users:
• If you wish to use a Network OWL connected to a business / commercial
LAN then please note that it is usual for the internal IT Security
Department to restrict which Internet ports are open for use.
• You will need to ensure that ports numbered 5004 and 5222 are opened
outbound. Without this the Network OWL will not be able to connect to
the OWL servers and your Intuition system will not function.
STEP SIX - Install Transmitter and attach Sensors
Industrial
Loads
Phase (Line)
Number
IEC 60446
Wire Colour
Pre 2004
IEE Colour
OWL Transmitter
Socket
1
Brown
Red
1 - Left
2
Black
Yellow
2 - Centre
3
Grey
Blue
3 - Right
Transmitter
Fuse Box /
Distribution Board
Ring Mains,
Lights,
Machines
etc
WARNING
- RISK OF ELECTRICAL SHOCK
- Please Refer to User Manual.
P1 / L1
Sensor
WARNING
- RISK OF ELECTRICAL SHOCK
- Please Refer to User Manual.
P2 / L2
Sensor
WARNING
- RISK OF ELECTRICAL SHOCK
- Please Refer to User Manual.
P3 / L3
Sensor
Neutral
P1 / L1
P2 / L2
P3 / L3
Blue
Brown
Black
Grey
Utility Meter
Alternative
Sensor
Locations
Electricity Grid
Intuition-lc Transmitter & Sensors
© 2 Save Energy Limited 2012
5
• Locate the supply cables between your electricity meter and mains distri•
bution board (fuse box). See diagram above.
Using the latch, clamp the 3 Sensors around the insulated Live cables going into the meter as per the table in the diagram – Live cables either side
of meter is acceptable.
The Sensors must be a loose fit onto the cables.
•
• Plug the Sensors into the associated Transmitter socket.
• The Transmitter should be hung on the wall in a free area as far from
large metal objects as possible.
STEP SEVEN - Create Intuition online account
• Using the web browser on your computer open up the following page:
https://www.owlintuition.com (this is a secure connection).
• Click “Create Account” and fill in the information requested (see following
• • • • table for explanation of the information required).
Ensure you correctly select the system type as Intuition-lc
Press the “Create Account” button.
Successful account creation and configuration will be confirmed.
Please keep a note of your details and press the “Finish” button.
Account Set Up Information Required
Item
Value
Username
Letters & digits Choose a memorable account username a minimum of 6 characters long. Not case sensitive.
Password
Letters & digits Choose a memorable password a minimum of 6
characters long. Password is case sensitive.
Email
Valid email address
Enter the email address you wish us to be able
to contact you on.
Network OWL
ID
12 characters
MAC ID can be found on back of the Network
OWL and starts 443719...... Enter the full 12
characters.
Country
Select from list
The country where this OWL Intuition system is
physically installed.
Timezone
Select from list
The time zone where this OWL Intuition system
is physically installed.
Use Daylight
Saving
Tick
Tick this box to enable automatic adjustment for
daylight saving. (Not available for all countries.)
Currency
Select from list
Select the currency symbols to be used by this
account.
6
Notes
© 2 Save Energy Limited 2012
Item
Value
Notes
Voltage
100 to 260
Enter the normal voltage of the system being
monitored. Default is 230 volts.
Postcode
Letters & digits UK only - enter just the first part of your
Town
Letters
Outside UK only - enter the name of the nearest
Town or City to where this OWL Intuition system
is physically installed.
System Type
Select from list
Intuition-lc
postcode eg. For RG24 9LR just enter RG24.
STEP EIGHT - Log in to your OWL Intuition account
You can now log in to your OWL Intuition account with your new username
and password at: https://www.owlintuition.com
IMPORTANT: Before progressing please check the signal strength of
the radio signal between your Transmitter and Network OWL. Also it
is recommended that you enter your own Tariff details which can be
accessed by pressing the Settings “gear wheels” icon on the Electricity widget.
Signal strength indicator
Settings icon
If the signal strength is only 1 or 2 bars, to reduce the chance of intermittent
/ inconsistent data reception it is suggested that you reposition the Network
OWL so that it is physically closer to the Transmitter.
The Network OWL should ideally be hung on the wall in a free area as far from
large metal objects as possible. Position the antenna in a vertical orientation.
If necessary you can replace the Ethernet cable with a longer cable (up to 100
meters long). If installing a long Ethernet cable is a problem, you can use a
“Powerline Range Extender” or “Wireless Range Extender” - please search for
these common products online.
© 2 Save Energy Limited 2012
7
INFORMATION & TROUBLE SHOOTING TIPS
• Unless the Transmitter is in Check Mode, the red LED does not flash, in
order to prolong battery life.
• Check that the blue LED on the Network OWL flashes every 12 seconds
•
•
•
if the monitored electricity supply consumption is varying, or every 60
seconds when at a steady state.
If the blue LED does not flash then the Transmitter signal is not being
received or the Transmitter Pairing has been lost. Disconnect the Transmitter’s Sensors and move it near to the Network OWL to confirm radio range
is not an issue.
For wireless range testing you can make the Transmitter send its signal
every 2 seconds (for 30 seconds) by pressing the “Check” button in the
battery compartment for 10 seconds. The red LED will flash with each
transmission, the Network OWL blue LED will flash to confirm the signal
has been received.
Network OWL Ethernet port LEDs have the following meanings: Green –
link ok / up; Yellow – data activity.
8
© 2 Save Energy Limited 2012
WEB BROWSER INTERFACE - All versions
Overview
Designed to be clear and easy to use, you are encouraged to explore the various information panels, called “Widgets”, that you have available. The Widgets
available will vary, depending upon the system options you have purchased.
Clicking on the arrows on the left and right of the screen will scroll between
your Widgets if required.
Messages
OWL Intuition system messages and EcoNudge™ (when available) will be
posted into your Inbox. A green numbered badge will appear next to this
menu bar item when you have unread messages. For maximum benefit please
read these messages as soon after they appear as possible.
Shop
Clicking this menu bar item will open a new tab within your web browser and
display the home page of the OWL online shop.
Logout
When you have finished using your OWL Intuition account please Logout by
clicking this menu bar item. Please note you can only log in one web browser
at a time. If you log in a second time then the first connection will be logged
out. If you or the browser refreshes the page, you will have to log in again.
Weather
Current weather conditions for your home / building location are displayed.
The location is defined by the part postcode or Town you gave during your
OWL Intuition account setup. Future OWL Intuition products will use current
and forecast weather to dynamically optimise energy saving.
System Status
In normal circumstances providing your broadband Internet connection is
working the System should always show as being Online with a recent “last
updated” time.
Widgets – General Information
There are normally 3 Widgets visible whenever you are logged into your OWL
Intuition account. You can view any additional Widgets you may have by
scrolling them with the arrows to the left and right of the screen. In general
the top section of each Widget provides you with appropriate high level / summary information. Trend arrows appear where appropriate next to data values
– if you hover your mouse point over the arrow a summary of the change will
appear in a pop-up. Above the Widget title bar is one or more “action icons”
that provide access to more detailed information and control options. If you
© 2 Save Energy Limited 2012
9
hover your mouse over one of these “action icons” a description of its function
will appear. If appropriate, the grey Widget title bar has a “gear wheels” icon
on the right. Clicking this icon will pop-up a window that will allow you to configure this part of the OWL Intuition system to match your specific installation.
Be sure to click the “Save” button before closing the window.
Widgets - Graphs
When you click on a Graphs “action icon”, a double size graph panel will appear next to the Widget.
Graph selections - Typically a graph will show relevant data for the last
7 days. You can select a shorter or longer “Time Frame” (1 day, 1 Week, 1
Month, 3 Months, 6 Months or All) by clicking the appropriate button at the
top of the graph. Select an appropriate “Group By” (None, Day, Week, Month,
Year), then chose the data you wish to “Display” (Energy or Cost). Finally,
to update the graph with your new selections, click on the “Reload” button.
Please note that not all permutations are possible and invalid options are
greyed out.
Hover over analysis – By moving your mouse pointer over the graph a
pop-up window will open, showing detailed values for the focus points marked
on the graph. Where appropriate, date and time information for the currently
displayed focus points will also be shown. Simply move the mouse pointer
from left to right and the focus points and information window will automatically update.
Zoom in – If you want to take a closer look at the graph you can zoom in to
the part that is of interest. Move your mouse pointer to the start of the area
of interest, click and hold, drag to the end of the area of interest and release.
The graph will automatically zoom in on the area selected. Click the “Reset
zoom” button when finished.
Print / Download buttons – If you want to keep a hard or soft copy of the
displayed graph then use the Print or Download buttons located just above
the graph on the right, the CSV option here will download a file containing the
data shown in the graph.
Closing the graph – After you have finished viewing the graph, simply press
the X (close) icon on the Graph Widget title bar (bottom right).
Electricity Widget
Live display of your current overall electrical energy consumption in Watts
/ kW together with the current overall cost per hour (based upon your Tariff
settings). The cost figure is adjusted for Solar PV generated power if applicable. Also shows electrical energy used / cost for Today (so far), Yesterday, Last
7 Days and Last 30 Days with trend information when available.
10
© 2 Save Energy Limited 2012
Action icons available:
• Electricity Data Export - Prompts for Start & End dates (up to 1 month
apart). Will then download a CSV file containing detailed data recorded for
this period. Download the Help file for full details.
• Electricity Graphs - Graphical views of historic Electricity usage
Status & Settings:
• Transmitter Battery - Displays “Good” or “Replace Soon”
• Transmitter Signal Strength - 1 bar (poor) to 4 bars (good)
• Settings - Tariff type, Tariff standing charge, Rate per kWh
Solar Widget
Live display of your current Solar PV electrical energy generation in Watts /
kW together with the current power you are exporting to the grid. Also shows
Solar PV electrical energy generated and exported for Today (so far), Yesterday, Last 7 Days and Last 30 Days with trend information when available.
Action icons available:
• Solar Graphs - Graphical views of historic Generated Solar Power, Exported
Solar Power and Imported Electricity.
Status & Settings:
• FITS Tariff settings - Generation Tariff, Export Tariff & Assumed Export %
3 Phase Electricity Widget
Live display of your current overall electrical energy consumption in Watts /
kW for each of your 3 individual phases. Also shows for each phase the electrical energy used for Today (so far), Yesterday, Last 7 Days and Last 30 Days.
Action icons available:
• 3 Phase Electricity Graphs - Graphical views of historic Electricity Usage for
each individual phase.
Status & Settings:
• None.
Overview Widget
Electricity Yesterday - Maximum, Minimum and Average recorded consumption
rates (kW).
CO2e - Calculated CO2 emissions in kg’s for Yesterday, Last Week and Last 30
Days. Adjusted for any Solar PV electrical energy generated and consumed.
Solar Yesterday - Maximum and Average recorded Solar PV generation rates
(kW) together with the amount of electrical energy (kWh) Imported from the
Grid (Consumption - Generated = Imported)
© 2 Save Energy Limited 2012
11
Solar Financials - Financial value of electricity generated Yesterday, Last Week,
Last 30 Days and Since PV system was installed.
News Widget
News and interesting articles relating to OWL products, company news and
energy saving in general.
Your OWL Intuition-lc system should now be set up and ready to
help save energy, CO2 emissions and money.
Please check out the other products in our OWL Intuition range, such as
heating controls, that extend the capability of your Intuition system.
Customer Support
If you have any further questions please check our frequently asked questions
at: http://www.theowl.com/faqs.html
You can also email us at: [email protected]
(please ensure you state your Network OWL MAC ID)
2 Save Energy Limited operate a policy of continuous development and improvement,
therefore the content of this document is subject to change without notice.
Document Version 1.5 - October 2012
12
© 2 Save Energy Limited 2012