1
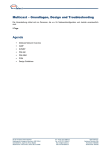
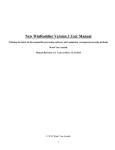
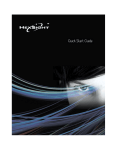
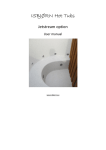
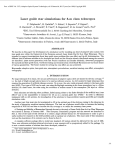
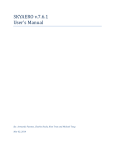
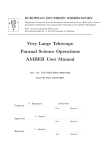
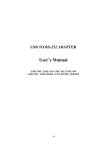
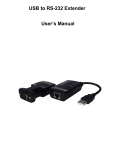
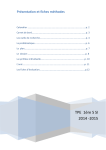
1
Solar Scintillation Monitor
User manual
Special thanks to M. Edward Joseph Seykora for his authorization to use his initial design and his kind wish of
success, and both Jean Pierre Brahic and Christian Viladrich for their extensive testing.
SSM ©2015 by Airylab. Reproduction restricted.
2
Quick start
Presentation
Thank you for buying Airylab’s Solar Scintillation Monitor (SSM). This device will allow you to
determine instantaneously the seeing value in ArcSec at your specific location by daylight for solar
observation and imaging. The SSM has been designed for three main applications:
-
Help you to find the best observation site for solar visual observation and imaging. The small
handheld form factor makes it very easy to bring to potential locations for a quick survey.
Determine the best seeing time for your observation location. Used with its data acquisition
software, you may collect data over the day to see the general seeing evolution over time.
Directly command image acquisition when used with Genika Astro. In that case, Genika Astro
connects to the SSM directly and trigs acquisition from the camera when the seeing goes
below a predefined value. For more information about this topic, please refer to Genika Astro
user manual.
Operating the SSM
SSM location
Be very careful about the location of the SSM during measurement. It should always be located
near the telescope entrance pupil, or its projected location.
If positioned too far from the telescope, the readings reflect only the seeing at the SSM actual
position rather at the telescope aperture. Both may be very different depending on the environment.
Example: when the SSM is placed upon a metallic or plastic table top, the seeing is deeply affected by
the very local turbulence caused by the table surface heating.
SSM ©2015 by Airylab. Reproduction restricted.
3
SSM standard edition
SSM standard edition has its sensor on the front surface.
When connected to a PC, you can use an USB cable up to 5m to optimize the SSM position near the
telescope entrance.
It is also possible to remove the photodiode from the SSM and connect it through a shielded
extension cable. Kindly pull up the photodetector; it is connected to a low insertion force connector.
The cable shield shouldn’t be in electrical contact with the telescope or the mount. The shield must
be connected only to the ground pin at the SSM end, not the photodiode (the ground is on the pin on
the side of the small metallic rectangle on the photodiode). Use a two wires connector + shield foil.
For short distances you may use an unshielded double conductor cable. Use the JP1 on the PCB to
connect the photodiode. It is accessible through the photodiode hole.
SSM remote edition
SSM remote edition has an external sensor connected by a RCA plug.
The sensor should be located next to the telescope entrance pupil. Use the provided plastic holder to
conveniently attach it.
SSM sensor installed on a HaT telescope
SSM ©2015 by Airylab. Reproduction restricted.
4
Use the provided cable to connect the sensor to the SSM RCA plug :
Power supply
The SSM standalone can be powered from its jack plug. It accepts 6 to 12V input. Note that if
powered from a car battery, the SSM should not be used for an extended period of time as the
battery delivers about 13,8V unloaded and the module may overheat. You may use a rechargeable
battery pack or a LIPO battery as the power consumption is below 100mA.
You may also power the SSM through its USB port when connected to a PC or to a generic USB power
supply.
Readings
The internal LCD screen gives two values updated twice per second.
Input
The input gives the level incoming light on an arbitrary scale. The photodiode sensor has an effective
operating angle of 180°. Depending on the SSM orientation and sun elevation, this value would
change along the time. The input value should be kept between 0.5 and 1 at all time. If the value
goes below 0.5, the SSM stops to calculate the seeing value. That can be the case when clouds pass
by. If the value goes over 1, seeing values are calculated but with less accuracy as the input amplifier
chain may clip some data. You may adjust the input back to less than 1 either changing the SSM
orientation, or using the internal rotating trimmer located next to the photosensor with a small flat
screwdriver.
Note that it is possible to set the trimmer in a position that allows to run a full sun cycle with input
between 0.5 and 1.
Seeing
This value gives the seeing in ArcSec. The value is calculated from the sun light high frequency
scintillation. Very small variations of the light reflect the actual low altitude turbulence that is
preponderant during daylight (Seykora 1993, Beckers 1993-2009). The SSM measures the incoming
light 1400 times twice per second and calculate the seeing value.
Seeing varies on a high frequency that explains de constant reading fluctuations. For short run high
speed imaging the fast refresh rate of the SSM allows to trig image acquisition at the proper time
when coupled with Genika Astro.
SSM ©2015 by Airylab. Reproduction restricted.
5
Using the SSM with its Windows application
Installation
Install the SSM software.
The SSM uses an Arduino module as a main CPU. The drivers are provided with the SSM application
in the drivers folder. The driver is automatically installed during the SSM software installation. You
may install it manually if needed. Depending on your operating system (x86 or x64), execute the
dpinst-amd64.exe (Windows 64 bits) or the dpinst-x86.exe (Windows 32 bits).
You may connect the SSM to the USB port and launch the SSM software:
The SSM create a new COM port on your PC. If you don’t have any other Arduino based system, you
may try the autodetect option. You may also manually select the COM port. Then press the connect
button. After a few moments, the readings from the SSM are display on the charts.
-
The upper right chart displays the input level evolution.
The lower large chart shows the instant seeing value evolution. Three scales and three chart
type are available from the button above the chart.
The upper center chart resumes the long term evolution from the average value on a full
minute.
SSM ©2015 by Airylab. Reproduction restricted.
6
You can log the seeing values in a text file by checking the result in log file checkbox. The file is
automatically created in the folder that may be selected with the button Select directory. A new file is
created if you uncheck/recheck this box.
You may also reset the main chart at anytime; this does not stop the data logging in the file.
General solar observation guidelines
As a general guideline, your solar telescope should be used at a position that minimizes the first
meters turbulence sources:
-
Avoid concrete, choose if possible grass ground.
Water surrounded locations shows minimal low layers turbulence.
Higher is better. If you have an elevated terrace, it could be a good location. Mountain site
are usually better, but avoid mid slope positions as they present ascending air currents.
Avoid concrete or stone walls close to the telescope.
The seeing also varies deeply during the day. Except on specific location such as high mountains top,
the best seeing is usually during the morning, and second part of the afternoon.
Understanding what the SSM measures
Scintillation from an extended object such as the Moon or the Sun is mainly caused by low layers up
as shown below. This is the exact opposite situation when considering stellar object. For those,
scintillation is rather due to higher atmospheric layers at the jetstream level.
From USING THE SCINTILLATION OF EXTENDED OBJECTS TO PROBE THE LOWER ATMOSPHERE, JACQUES M. BECKERS
For the sun, the scintillation level is about 7E-7 of the total light in the first ten meters, 1E-7 at 100m
and 5E-8 at 10km.
SSM ©2015 by Airylab. Reproduction restricted.
7
On the other hand according to the Hufnagel/valley model that is widely accepted, atmospheric
turbulence originates mostly from both the jet streams at the tropopause altitude (7-12km) and the
lower layers below 5 km:
The Hufnagel Valley model, Hufnagel/Valley, 1979
That is even truer when considering daytime turbulence. If you consider the integral of the
turbulence on both graphs below, you can see that most of it in due to the first kilometer by day.
Dotted line is daytime. Beckers, 1993
SSM ©2015 by Airylab. Reproduction restricted.
8
Dotted line is daytime, Roddier 1981
Scintillation analysis with a dynamic better than 107 as used in the SSM allows to measure
contribution to the turbulence from the lower layers that are the main contributor to daytime
seeing. Professional observatories are using photodetectors linear arrays SHABAR systems that can
spread out the contribution to the turbulence of the different layers of the atmosphere. The SSM is a
simplified low cost version for amateur solar astronomers using a single photodiode. Its dynamic is
able to show turbulence of the first couple of kilometers at least.
It is important to remember that this measurement is less sensitive to higher layers induced
turbulence (i.e. jetstrams). With the same seeing readings on two different days, the actual
turbulence may differ due to different jetstreams speeds.
Shortened bibliography
JACQUES M. BECKERS (2009) USING THE SCINTILLATION OF EXTENDED OBJECTS TO PROBE THE
LOWER ATMOSPHERE. Optical Turbulence: pp. 23-25.
Solar Scintillation and the Monitoring Of Solar Seeing, E. J. Seykora Solar Physics 145: 389 – 397, 1993
Using Scintillation Measurements to Achieve High Spatial Resolution in Photometric Solar
Observations, R. Coulter, J. R. Kuhn and T. Rimmele Solar Physics 163: 7 – 19, 1996
SSM ©2015 by Airylab. Reproduction restricted.