1
IT 11 019
Examensarbete 45 hp
April 2011
Displaying Query Results in
AMOS II Graphically using SVG
& X3D
Miran Ismaiel Nadir
Institutionen för informationsteknologi
Department of Information Technology
Abstract
Displaying Query Results in AMOS II Graphically using
SVG & X3D
Miran Ismaiel Nadir
Teknisk- naturvetenskaplig fakultet
UTH-enheten
Besöksadress:
Ångströmlaboratoriet
Lägerhyddsvägen 1
Hus 4, Plan 0
Postadress:
Box 536
751 21 Uppsala
Telefon:
018 – 471 30 03
Telefax:
018 – 471 30 00
Hemsida:
http://www.teknat.uu.se/student
There are a lot of tools and libraries on the internet that can represent data visually
from various database engines, but these tools or libraries are all commercial
products and they do not provide a way to customize the source code for your own
needs.
Add to that, none of these tools and libraries support representing data from AMOSII
which is a main memory object-relational database system developed by Uppsala
Database Laboratory (UDBL).
We thought it will be interesting to have a tool that can display the result of an
AMOSQL query graphically (e.g. Chart) that will help the viewer to better understand
the result of the query. It will also serve the purpose of aiding the teaching staff in the
University to better formulate course assignments for related courses.
Our work will certainly aid the faculty members and other students who may be
interested in continuing through this project and make it an extensive library which
can represent data results from AMOSII queries as other types of charts.
Through this project we have developed a java library that can take the result of any
AMOSQL query and display the results graphically in six different types of charts
(graphs). We have used SVG (Scalable Vector Graphics) and X3D (Extensible 3D
Graphics) for generating the graphs.
SVG is a specification language using XML (Extensible Markup Language) file format
for describing two-dimensional vector graphics. The SVG specification is an open
standard and the most recent version (1.1) is a World Wide Web Consortium
(W3C) recommendation. It is supported by all the major browsers; that mean the
query result can be displayed on any device that has an Internet browser.
X3D is the ISO standard XML-based file format for representing 3D computer
graphics, it is the successor to the Virtual Reality Modeling Language (VRML). It
supports the ability to encode the scene using XML syntax as well as the Open
Inventor-like syntax of VRML97, or binary formatting, and enhanced application
programming interfaces (APIs). However it requires plug-in for regular browsers to
be able to open X3D scene. The X3D has been used to generate the 3D Plot graph
function.
Handledare: Kjell Orsborn
Ämnesgranskare: Tore Risch
Examinator: Anders Jansson
IT 11 019
Tryckt av: Reprocentralen ITC
I would like to dedicate this work to my family and especially to the
great man whom I always proud to call my father.
Table of contents
1. Introduction ................................................................................................................ 1
2. Background ................................................................................................................ 2
2.1 AMOS II ................................................................................................................ 2
2.1.1 Data Model ...................................................................................................... 2
2.1.2 Types .............................................................................................................. 3
2.1.3 Functions ......................................................................................................... 3
2.1.4 Functions that apply to Bag of Values .................................................................. 4
2.1.5 Aggregate functions .......................................................................................... 5
2.1.6 AMOSQL .......................................................................................................... 5
2.2 AMOS II Interfaces ................................................................................................. 6
2.2.1 AMOS II C and Lisp interfaces ............................................................................ 6
2.2.2 AMOS II Java interfaces ..................................................................................... 6
2.3 Vector Graphics (SVG) and (X3D) ........................................................................... 10
2.3.1 about SVG ..................................................................................................... 10
2.3.2 About X3D ..................................................................................................... 10
2.3.3 Comparing SVG and X3D to other vector graphic formats .................................... 11
2.3.4 SVG file syntax ............................................................................................... 14
2.3.5 X3D file syntax ............................................................................................... 15
3. Displaying query results in AMOS II graphically ............................................................. 17
3.1 Setting up the environment ................................................................................... 17
3.2 The theory behind the work ................................................................................... 18
3.3 Helper functions ................................................................................................... 20
3.3.1 Tuple to Array converter .................................................................................. 20
3.3.2 The charter function ........................................................................................ 21
3.3.3 Minimum and Maximum values ......................................................................... 21
3.3.4 The Graph Labels ............................................................................................ 21
3.3.5 The initialization foreign function ...................................................................... 22
3.4 The main chart functions ....................................................................................... 23
3.4.1 Bar graph generator ........................................................................................ 23
3.4.2 Line graph generator ....................................................................................... 26
3.4.3 Extended bar graph generator .......................................................................... 29
3.4.4 Scatter plot graph generator ............................................................................ 31
3.4.5 Extended Line graph generator ......................................................................... 34
3.4.6 3D plotter graph generator .............................................................................. 37
4. Conclusion and future work......................................................................................... 41
References ................................................................................................................... 42
1. Introduction
Data visualization is the graphical representation of information. Bar charts, Scatter
graphs, and Maps are examples of simple data visualizations that have been used for
decades, Data visualization was actually developed more than 400 years ago [7].
Information technology combines the principles of visualization with powerful
applications and large data sets to create extensive images and animations. And as a
result for the advances in technology, data visualization is now rapidly becoming
sophisticated, and is destined to become an important part of the process of
understanding the data [6][7].
Language is a subjective coding system for ideas, realities and experiences. But,
through the last decade, the disadvantages of text-based language have become very
evident. Our text-based input/output through-rate just can't cope with the amounts of
information we deal with today [7].
Getting to the point, data which is presented graphically is easier to read and also take
less time to understand.
AMOS II is a main memory object-relational database system developed at Uppsala
Database Laboratory (UDBL). AMOS II is a mediator system, which integrates multiple
potentially different and distributed data sources. With a query language called
AMOSQL, users can execute object-oriented queries over these heterogeneous data
sources [1][4]; these query results can be huge for some databases. This large amount
of data results can be difficult to be understood as it is. Based on the point above it is
important to have a tool that can convert these query result to a form of presentation
that is more understandable than text-based.
So the project ahead will describe this tool which we developed that can generate
different types of charts from various query results and display the output as an SVG
image or X3D scene inside any Internet browser. The resulted html page can be saved,
searched, indexed, and compressed because it is text based data.
The aim of this report is to describe our project and give an overview of the main
functions in the Java library and the underlying theory behind each of the chart
presentations. Results of each function, how to integrate it into any database, and
differences between each function are discussed. We will also discuss why we used
(SVG and X3D), and we will compare them with other types of vector graphic
presentation that are available.
1
2. Background
This section gives an overview about the different parts of this project; it will help the
reader to get a picture of each of the related subjects separately from each other. This
will make it easier for the reader to link the different subjects together when we
discuss our work in more in-depth approach.
2.1 AMOS II
AMOS II is a descendant of AMOS, which has its roots in a main memory version of
Hewlett Packard’s DBMS IRIS. The whole database is stored in main memory and is
stored on disk only through specific commands. AMOS II can be used as a single user
database, a multi-user server, or as a collection of interacting AMOS II multi-database
peers [1].
AMOS II is an object-relational peer DBMS (database management system) having a
declarative query language which called AMOSQL. The AMOSQL is an object-relational
and functional query language that allows different kinds of distributed data sources to
be queried. Furthermore, wrappers can be defined for different kinds of data sources
and external storage managers accessed to make them accept these queries [1][4].
Please be advised that this report is not intended to teach you AMOS II, for proper
understanding of the AMOS II database system you should refer to the AMOS II
website [19], where you can find tutorial, in-depth user manual, and other important
information related to the AMOS II system.
This report will assume that you have sufficient knowledge about the AMOS II system
and its query language (AMOSQL). However, we will explain some sections in-depth if
they are related to the work which has been done in this project.
2.1.1 Data Model
Everything in an AMOS II database is represented as objects, both user-defined and
system objects. There are two types of objects, literal objects and surrogate objects.
Each surrogate object is assigned an OID, which are managed by the system. Literal
objects are objects that represent strings and numbers. Surrogate objects are more
complex and they usually represent something from the real world [3].
Meta-objects, like types and functions, are also surrogates. This gives the user the
possibility to query the system objects in AMOSQL, with the ability to get the structure
of a type defined in the system. Furthermore, allowing a user to query the whole
structure of a complete mediator server [1].
2
2.1.2 Types
Any object in AMOS II system is an instance of at least one type. The term type is
similar to class in object-oriented programming. The types are arranged in a hierarchy
(super types then subtype). This means that if an object is an instance of a type, it is
also an instance of all its super types. AMOS II also supports multiple inheritances [1].
The following types are available in AMOS II system (stored types, derived types,
proxy types and integration union types). The syntax for creating types is:
create type <typename>;
Example:
AMOS #>create type Tournament;
2.1.3 Functions
In AMOS II, queries on objects, attributes of objects, methods of objects and the
relationships between objects are represented by functions [1]. AMOS II functions can
be one of these categories:
2.1.3.1 Stored functions
A stored function represents characteristics of an object in the database. For example,
common properties of an object of type person are name and age. When calling the
function name on such an object returns the current value of the attribute name [1].
The general syntax for creating stored functions is:
create function <Function Name>(type) -> <return type> as stored;
Example:
AMOS #>create function year(Tournament)->Integer as stored;
2.1.3.2 Derived functions
They are functions defined with the use of other previously defined AMOSQL functions.
It is not mandatory for a function in AMOS II to have arguments and there is no upper
limit on the number of arguments that a function can have [1].
2.1.3.3 Foreign functions
Foreign functions are functions called from AMOS II that are defined in a programming
language usually Java. But there are other interfaces exist for the languages C and Lisp
too[2].
A foreign function which is written in Java is defined in AMOS II as:
create function <function name>(<type name> <variable name>) -> <type name>
<variable name> as foreign "JAVA:<JavaLibraryName>/<JavaFunctionName>";
3
Example:
AMOS #>create function sqroot(real x)-> real r as foreign
"JAVA:MyForeignFunctions/sqroot";
As (MyForeignFunctions) is the name of the previously compiled Java class library
which has the filename (MyForeignFunctions.java) and it is case sensitive.
The compiled class library (MyForeignFunctions.java) should have a method by the
name (sqroot) which should be defined like below:
public void sqroot(CallContext cxt, Tuple tpl) throws AmosException
{
……… <function content in Java language> ………
}
Foreign functions are important in our work, as a matter of fact all the work which is
done though this project is accomplished using foreign functions.
We will discuss the Java API in more detail in the upcoming sections.
2.1.3.4 Stored procedures
Stored procedures are functions having side effects, such as updating the database.
Stored procedures will not be discussed in this report.
2.1.4 Functions that apply to Bag of Values
In AMOS II, there are functions that return a bag (set) of values, if such a function is
called by another function; the caller function will be applied to each element of the
result from the set valued function [1].
For example, if function last_name is returning a bag of string and the function
get_first_name called it as below:
AMOS #>get_first_name(last_name(x));
Then the function get_first_name will be applied on each element of the resulting
strings which has been returned by the last_name function.
This is called ‘Daplex semantics’ because it was first invented in the functional query
language Daplex, which is an ancestor of AMOSQL.
4
2.1.5 Aggregate functions
Aggregate functions compute aggregate values over bags, For example:
sum(...) - returns the sum of a number of values.
count(...) - counts the number of values.
Aggregate functions have somewhat different semantics compared to ordinary AMOS II
functions in that they are not applied on each element of a bag as regular functions,
but on entire bags [1].
Consider the following example:
AMOS #>count(last_name(x));
In this case the function count is applied once on the entire bag of objects from
last_name(x), not once per result from last_name(x). The reason is that the count
function is defined to take a (bag of object) as argument [1]:
Example:
Create function count(Bag of Object x)->Integer r as ...
Note that nested queries can be used as arguments to aggregate functions.
2.1.6 AMOSQL
Similarly to SQL, AMOSQL is a combination of a DDL (Data Definition Language) and a
DML (Data Manipulation Language). The query part of the language is similar to SQL.
An AMOSQL expression can be entered in one or several lines. Every command in
AMOSQL should be terminated with semicolon (;).
We should note that the FROM clause in AMOSQL contain type declarations instead of
table names compared to SQL [1][4].
AMOSQL is not discussed in depth in this report; please refer to the AMOS II website
for more information [19].
5
2.2 AMOS II Interfaces
There are interfaces between the AMOS II system and the programming languages C,
Lisp, and Java.
2.2.1 AMOS II C and Lisp interfaces
While the Java interface is most convenient to write AMOS II applications and to make
simple extensions to the AMOS II system, The C and Lisp interfaces are better for time
critical application and more advanced system extensions [2].
There are some advantages for using the Java interface instead of the C language
interface:
1. Programming errors in the Java code won't cause AMOS II to crash. But,
programming errors in C can cause very bad system errors. In the other hand
The Lisp interfaces are safer than C, but not safer than the Java interfaces.
2. The garbage collector in Java will de-allocate memory automatically, but in C
memory de-allocation must be done manually and this is a very error prone
task. Lisp also has automatic garbage collection.
3. Java has extensive libraries for user interfaces and web access. Which they can
be used too by AMOS II through its Java interfaces.
The disadvantages of the Java interface is that it is slower and limited compared to the
C and Lisp interfaces [2].
2.2.2 AMOS II Java interfaces
There are two ways to communicate between a Java program and the AMOS II system,
the first one is called the (callin interface) and the second called the (callout interface).
Our work has been accomplished using the callout interface; however we will explain
both interfaces below:
2.2.2.1 The callin interface
The callin interface is similar to the call level interfaces for relational databases, such
as ODBC, JDBC, etc. it will be used when a Java program calls the AMOS II system.
The callin interface provides two ways to call AMOS II system from a Java program [2]:
1. The embedded query interface: there is a Java method provided that can pass
strings that contain AMOSQL statements to the AMOS II system to be evaluated
dynamically. There are other methods provided which they can access the
results from these dynamically evaluated AMOSQL statements. The embedded
query interface is slow because these AMOSQL statements are parsed and
compiled at runtime.
2. The fast-path interface: which AMOS II functions that have been predefined in
the AMOS II system are called as Java methods, this will remove the overhead
of dynamically parsing and executing AMOSQL statements. The fast-path is
much faster than the embedded query interface. So it is recommended to make
6
AMOS II derived functions and stored procedures for every operation performed
by the application and use the fast-path interface to call them directly.
There are also two ways to handle the connection between applications programs and
the AMOS II system [2]:
1. The tight connection: where AMOS II is linked directly with a Java application
program as an embedded database in the application. This will provide the
fastest possible interface between the application and the AMOS II system as
they are both run in the same address space. That mean they must run on the
same computer which is a disadvantage, another disadvantage of this
connection is that only a single Java application can be linked to AMOS II,
however many Java threads in the application can access the AMOS II system.
2. The client-server connection: The Java application runs as a client to an AMOS II
server, this connection allows several Java applications to connect to the same
AMOS II server concurrently. The Java application and the AMOS server run as
different programs, but the overhead for calling the AMOS II server from another
program is several hundred times slower than the tight connection.
2.2.2.2 The callout interface
With the callout interface AMOS II functions call methods written in Java language.
Each foreign AMOS II function can be implemented by one or several Java methods.
These foreign functions in AMOS II can be multi-directional which means that they can
have inverses that are separately defined, they can also be indexed. Furthermore these
foreign functions are allowed to use the callin interface to access the AMOS II system
again, this will gives great flexibility and will allow Java methods to act like stored
procedures [2].
The callout interface is implemented through a mechanism called the multi-directional
foreign function interface; this means that we can use Java to access external
databases and make these databases fully available in AMOS II [3].
Any program called through the callout interface always run in the same address space
as the AMOS II server, as these programs will be invoked from AMOS II.
With the Java callout interface it is easy to extend AMOS II with simple foreign AMOS II
functions written in Java.
Any foreign function written in Java when it is used inside an AMOSQL query should be
side-effect free (the foreign function should not update the database); the reason
behind that is the query optimizer may rearrange the calling sequence of the functions
used inside the query. Foreign functions with side effects are better be used as stored
procedures. However there is no mechanism in the AMOS II system to distinguish
between foreign function that have side effects or the ones that does not have side
effects [2].
Foreign functions in Java are methods of some user defined Java class stored in an
external file that have the same name as the class. When the class external file has
7
been compiled with the Java compiler it can be loaded dynamically into AMOS II by
creating a foreign function by specifying the file name and class of the method and the
method name that should be linked with the foreign function.
The AMOS II system will load the class when the foreign function is defined. The
defined foreign function is saved into the database image. When the AMSO II system is
started with an image that contain foreign functions, the system will try to load the
class that contain the method before calling the foreign Java function [2].
A simple foreign AMOS II function should have some parameters similar to any
ordinary subroutine; these parameters are represented as a tuple.
The driver program must contain the following parts to define foreign functions:
1. The Java method code that implement the function.
2. A definition in AMOSQL that link the foreign function to the Java method code.
3. An optional cost hint to estimate the cost of executing the Java method.
The Java method of the foreign function always has two arguments: a context and a
parameter tuple. The context is a data structure which is managed by the system to
pass information between the foreign functions and the other parts of the system. The
parameter tuple is a Tuple object that holds both the argument(s) and the result(s) of
the function. The foreign function implementation must get the arguments from their
actual argument positions in the parameter tuple and then compute the results and
store them back in the result positions of the parameter tuple [2].
The general syntax for defining a Java class that includes a Java method as a foreign
function is like below:
import callin.*;
import callout.*;
public class <ClassName>
{
public <ClassName>()
{
// initializations for the class goes here
}
public void <MethodName>(CallContext cxt, Tuple tpl) throws AmosException
{
// Method code goes here
}
}
8
The code must be placed in a file which should have the same name as the class name.
For example, if the class name is (MyForeignFunctions) then the file name should be
(MyForeignFunctions.java). Notice that the file name is case sensitive.
After that, the java source file should be compiled using Java compiler. This can be
done in different ways the simplest way for that is by executing the below command
from the command prompt:
>javac MyForeignFunctions.java
Pay attention that the path to the Java SDK directory should be defined in the system
paths for this to work in Windows operating systems. For more information about
compiling Java see the appropriate references [8][9].
The class is dynamically loaded to AMOS II with the below function resolvent by
executing the AMOSQL statement:
create function <Foreign Function Name>(<Argument Declaration>) ->
<Result Declaration> as foreign "JAVA:<Java Class Name>/<Method Name>";
For example:
AMOS #>create function sqroot(real x)-> real r as foreign
"JAVA:MyForeignFunctions/sqroot";
Where <Foreign Function Name> is the AMOSQL name of the foreign function,
<Argument Declaration> is the type and variable declaration of its argument(s),
<Result Declaration> is the type and variable declaration of its results, The string
JAVA: indicates that the foreign function is implemented in Java, <Java Class Name> is
the name of the class (file) where the function is implemented and it is case sensitive,
and finally the <Method Name> is the name of the method that is implementing the
foreign function (Pay attention that the <Foreign Function Name> is not necessarily be
the same as the <Method Name>). The definition can be done by an AMOSQL
command in the top loop or from Java by calling the method execute. The definition
needs to be done only one time. Then it can be saved in the database image file; the
system will dynamically load the definition again when the AMOS II system is initialized
with database image file [2][5].
For more information about the AMOS II Java interfaces you should read the proper
documentation of the AMOS II Java API [2][19].
9
2.3 Vector Graphics (SVG) and (X3D)
SVG is a markup language for describing two-dimensional graphics applications and
images, and a set of related graphics script interfaces which is developed and
maintained by the W3C SVG Working Group [10].
X3D is a royalty-free open standard file format and run-time architecture to represent
3D scenes and objects using XML. It is an ISO standard that provides a system for the
storage, retrieval and playback of real time graphics content embedded in applications,
all within an open architecture that support a wide range of domains and user
scenarios [21][22].
2.3.1 about SVG
SVG 1.1 is the most recent version of the full specification and it is a W3C
Recommendation; a second edition of SVG 1.1 which have some improvements and
clarifications based on developer feedback is currently in Last Call. There is also a
mobile devices' version which is a W3C Recommendation too, called (SVG Tiny 1.2).
SVG 2 is currently under development, and will add new ease-of-use features to SVG,
as well as more closely integrating with HTML, CSS, and the DOM (Document Object
Model).
The SVG platform is for two-dimensional graphics. It consists of two parts: an XMLbased file format and an API for programming with graphical applications. The most
important features of SVG include shapes, text and embedded raster graphics, with
many painting styles. It also supports scripting with languages such as ECMAScript and
has comprehensive support for animation [10].
SVG is used in many business areas such as user interfaces, printing and hardcopy
output, Web graphics, animation, mobile applications and many more.
SVG is a royalty-free, vendor-neutral, open standard, developed under the W3C
Process. It has strong industry support; Authors of the SVG specification include
Adobe, Agfa, Apple, Canon, Corel, Ericsson, HP, IBM, Kodak, Macromedia, Microsoft,
Nokia, Sharp and Sun Microsystems. SVG viewers are deployed to over 100 million
desktops, and there is a broad range of support in many authoring tools [10][13].
SVG builds upon many other successful standards such as XML (SVG graphics are textbased and thus easy to create) [11], JPEG and PNG for image formats, DOM for
scripting and interactivity, SMIL for animation and CSS for styling.
2.3.2 About X3D
X3D supports multi-stage and multi-texture rendering, it also supports shader with
lightmap and normalmap. In 2010 X3D supports deferred rendering architecture. X3D
also benefits from other open source standards like XML, DOM and XPath.
X3D has a rich set of componentized features (allows lightweight core 3D runtime
delivery engine) that can tailored for use in engineering and scientific visualization,
10
CAD and architecture, medical visualization, training and simulation, multimedia,
entertainment, education, and more.
X3D is an XML integrated which enable it to be integrated with web services,
distributed networks, and cross-platforms. X3D is also extensible (which means it
allows components to be added to extend functionality for vertical market applications
and services), evolutionary (easy to update and preserve VRML97 content as X3D),
and support real-time (graphics are high quality, interactive, and include audio and
video as well as 3D data).
2.3.3 Comparing SVG and X3D to other vector graphic formats
As we mentioned earlier, we are planning to visualize a query result and display the
result in a graphical format using vector graphic markup language. Therefore we have
to choose a preferable vector graphic format that is extendable and maintainable.
However, there is no limit in the Web specifications to the vector graphical formats that
can be used, but certain formats are more widely understood than others; certain
formats are more suited to one type of graphical data than another; so we have to
make an informative choice about what format to use for our project [20].
There are many vector graphics markup languages to chose from like 2D vector
graphic languages (Ex: XAML, MathML, Vector Markup Language, and Scalable Vector
Graphics) [27], and the 3D vector graphic languages (Ex: Xgl, 3DXML, VRML, X3D)
[27]. There are also graphic APIs that are used for 3D web graphics like WebGL. We
will describe some of those languages below:
2.3.3.1 Vector Markup Language (VML):
VML was submitted as a proposed standard to the W3C in 1998 by (Autodesk, HewlettPackard, Macromedia, Microsoft, and Visio). At the same time other competing W3C
submissions were received in the area of web vector graphics, such as PGML from
Adobe Systems, Sun Microsystems, and others. As a result of these submissions, a new
W3C working group was created, which produced Scalable Vector Graphics (SVG),
which became a W3C Recommendation in 2001 as a language for describing twodimensional vector and mixed vector/raster graphics in XML.
VML has been largely deprecated in favor of other formats, such as SVG.
2.3.3.2 Extensible Application Markup Language (XAML):
XAML is a declarative XML-based language created by Microsoft which is used to
initialize structured values and objects. It is available under Microsoft's Open
Specification Promise. XAML is used extensively in .NET Framework 3.0 & .NET
Framework 4.0 technologies, particularly Windows Presentation Foundation (WPF),
Silverlight, and Windows Workflow Foundation (WF). In WPF, XAML is used as a user
interface markup language to define UI elements, data binding, events, and other
features.
XAML files can be created and edited with visual design tools such as Microsoft
Expression Blend, and Microsoft Visual Studio. They can also be created and edited
11
with a standard text editor, a code editor such as XAMLPad, or a graphical editor such
as Vector Architect.
Anything that is created or implemented in XAML can be expressed using a more
traditional .NET language, such as C# or Visual Basic.NET. However, a key aspect of
the technology is the reduced complexity needed for tools to process XAML, because it
is based on XML. As a result, a variety of products are emerging, particularly in the
WPF space, which create XAML-based applications. As XAML is simply based on XML,
developers and designers can share and edit content freely among themselves without
requiring compilation [31].
XAML is generally used to create user interfaces for applications.
2.3.3.3 Virtual Reality Modeling Language (VRML):
VRML is also known as Virtual Reality Markup Language is a standard file format for
representing 3-dimensional (3D) interactive vector graphics, designed particularly with
the World Wide Web in mind.
The Web3D Consortium has been formed to further the collective development of the
format. VRML (and its successor, X3D), have been accepted as international standards
by the International Organization for Standardization (ISO).
The first version of VRML was specified in November 1994. This version was specified
from, and very closely resembled, the API and file format of the Open Inventor
software component, originally developed by SGI. The current and functionally
complete version is VRML97. VRML has now been superseded by X3D [29].
2.3.3.4 Scalable Vector Graphics (SVG):
SVG is used to define 2D vector-based graphics for the Web using XML format; below
are some of the advantages that made us use SVG for generating the 2D graphs.
SVG files can be modified by any text editor, as they are pure XML.
SVG files are much smaller than JPEG and GIF image formats and more
compressible.
SVG images are scalable and can be zoomed without degradation, and that
means that they can be printed in high quality at any resolution.
The text in SVG is selectable and searchable.
SVG is an open standard and it works easily with Java technology.
All browsers support SVG files nowadays, except for Internet Explorer, which
needs a plug-in that is available for free. The upcoming Internet Explorer 9 will
support SVG too.
Flash is the main competitor to SVG, but SVG has the advantage of compliance with
other standards like XSL (Extensible Stylesheet Language) and DOM (Document Object
Model). Meanwhile Flash relies on proprietary technology that is not open source
[10][12].
12
2.3.3.5 Extensible 3D Graphics (X3D):
X3D is the ISO standard XML-based file format for representing 3D computer graphics,
the successor to the Virtual Reality Modeling Language (VRML)[29]. X3D has many
features that made us use it for generating the 3D graphs in the project [22]:
XML integrated: this is a key to integration with web services.
Componentized: this allows lightweight core 3D runtime delivery engine.
Evolutionary: easily updated and preserve VRML97 content as X3D.
Broadcast/Embedded Application Ready: can work on mobile phones to
supercomputers.
Real-Time: graphics are high quality, real-time, interactive, and include audio
and video as well as 3D data.
Well-Specified: makes it easier to build conformant, consistent and bug-free
implementations.
It also supports 3D graphics and programmable shaders, 2D graphics,
animation, user interaction, navigation, and scripting.
X3D applet is a software program that runs within a web browser that displays
content in 3D, using OpenGL 3D graphics technology to display X3D content in
several different browsers (IE, Safari, Firefox) across several different operating
systems (Windows, Mac OS X, Linux)[21].
X3D strives to become the 3D standard for the Web, integrated in the HTML5 pages
like other XML dialects (MathML, SVG). X3DOM is a proposed syntax model and its
implementation as a script library that shows how this integration can be done without
a browser plugin, using only WebGL and JavaScript [21].
2.3.3.6 WebGL:
WebGL is a context of the canvas HTML element that provides a 3D graphics API
implemented in a web browser without the use of plug-ins. The WebGL specification
final draft has been released on 7 Feb 2011. It is based on OpenGL ES 2.0 and
provides a programmatic interface for 3D graphics. It uses the HTML5 canvas element
and is accessed using Document Object Model interfaces (DOM). And automatic
memory management is provided as part of the JavaScript language.
The WebGL has been implemented in Google Chrome 9 and in development release of
Mozilla Firefox 4 and Safari. It is managed by the non-profit technology consortium
(Khronos Group). The WebGL working group includes Apple, Google, Mozilla, and
Opera [23].
The WebGL would have been a considerable option for generating our 3D graphs, but
unfortunately the final draft has been released recently and only Google Chrome 9 has
a built-in support currently.
13
2.3.4 SVG file syntax
The below example is a simple SVG file. SVG files must be saved with the (.svg)
extension:
<?xml version="1.0" standalone="no"?>
<!DOCTYPE svg PUBLIC "-//W3C//DTD SVG 1.1//EN"
"http://www.w3.org/Graphics/SVG/1.1/DTD/svg11.dtd">
<svg width="100%" height="100%" version="1.1" xmlns="http://www.w3.org/2000/svg">
<circle cx="100" cy="50" r="40" stroke="black" stroke-width="2" fill="red"/>
</svg>
The first line contains the XML declaration. (standalone="no") means that the SVG
document has a reference to an external file - in this case, the DTD (Document Type
Definition). The second and the third line refer to the external SVG DTD. The DTD
resides at the W3C website and it contains all allowable SVG elements.
The SVG code begins with the SVG element opening tag <svg> and should end with
the svg closing tag </svg>, this represent the root element. The width and height
attributes set the width and height of the SVG document. The version attribute defines
the SVG version to be used and the xmlns attribute defines the SVG namespace.
Finally the simple SVG element <circle> is used to create a simple circle shape. And to
end the SVG file the </svg> closing tag should be placed to close the root SVG
element and the document. Take note that all opening tags MUST have closing tags.
There are three ways to embed SVG files into html pages:
1. Using the <embed> Tag: The <embed> tag is supported in all major browsers,
and allows scripting. But if you want to create valid XHTML, you cannot use the
<embed> tag as it is not listed in any HTML specification.
Below is an example of the syntax for using the <embed> tag:
<embed src="rect.svg" width="300" height="100" type="image/svg+xml"
pluginspage="http://www.adobe.com/svg/viewer/install/" />
2. Using the <object> Tag: The <object> tag is an HTML4 standard tag and is
supported in all newer browsers. But it does not allow scripting.
The syntax for using the <object> tag is below:
<object data="rect.svg" width="300" height="100" type="image/svg+xml"
codebase="http://www.adobe.com/svg/viewer/install/" />
3. Using the <iframe> Tag: this works in most browsers. Below is the syntax for
using the <iframe> tag:
<iframe src="rect.svg" width="300" height="100"> </iframe>
14
SVG has a lot of predefined shape elements that can be used and manipulated by
developers, it also have Filters that can add special effects to shapes and texts and
multiple effects can be used on each element. SVG also has two main types of
gradients (Linear Gradients, and Radial Gradients) they can smooth the transition from
one color to another. Again, several color transitions can be applied to the same
element.
For more information about the SVG elements, filters, and gradients, you can check the
SVG tutorial in the W3schools website [12]. For more information about the upcoming
SVG news and updates please go the SVG website [10].
2.3.5 X3D file syntax
The below example is a simple X3D file. X3D files must be saved with the (.x3d)
extension:
<?xml version="1.0" encoding="UTF-8"?>
<!DOCTYPE X3D PUBLIC "ISO//Web3D//DTD X3D 3.1//EN"
"http://www.web3d.org/specifications/x3d-3.1.dtd">
<X3D profile='Interchange' version='3.1' xmlns:xsd=
'http://www.w3.org/2001/XMLSchema-instance' xsd:noNamespaceSchemaLocation='
http://www.web3d.org/specifications/x3d-3.1.xsd '>
<head> </head>
<Scene>
<Background skyColor='1 1 1'/>
<Viewpoint description='Book View' position='0 0 3' fieldOfView='0.7854'/>
<Shape>
<Sphere/>
<Appearance>
<Material/>
</Appearance>
</Shape>
</Scene>
</X3D>
The first line contains the XML declaration. The second line defines the type of the
document and refer to the external X3D DTD link. The DTD resides at the Web3D.org
website and it contains all X3D specifications.
The X3D code begins with the X3D element opening tag <X3D> and should end with
the X3D closing tag </X3D>, this represent the root element. It also specifies the X3D
15
profile and version to be used and the xmlns attribute defines the X3D namespace. The
<head> tag is optional and can be used to include Meta data (meta tags). The
<Scene> tag is where we can start to define the properties of the scene including the
shapes, and it should be ended with close tag </Scene>. The <Background> tag can
specify the background sky color used, in the example above it is white as the colors in
X3D should be defined as RGB values which has three floating point values between (0
and 1) separated by white spaces. The <Viewpoint> tag determines where the camera
should be placed and the viewing angle.
The <Shape> tag determine that we are about to define a shape in the scene which is
a <Sphere/> tag that is closed straight away and then the <Appearance> tag specify
how the Sphere should be displayed (in the above example we specified a <Material/>
tag to be used for drawing the Sphere). Then the closing tags for both the
<Appearance/> tag and the <Shape/> tag.
The (.x3d) file above should be embedded into an html page to be displayed (the .x3d
file can be opened by its own if there is a program specified with such extension). The
html page should embed the (.x3d) file as object.
For example if we assume that we have an X3D file with the name (hello.x3d) we can
embed it into an html page as below:
<!DOCTYPE HTML PUBLIC "-//W3C//DTD HTML 4.01 Transitional//EN">
<html>
<head>
<title> TITLE OF THE HTML DOCUMENT </title>
</head>
<body>
<object data="hello.x3d" type="model/x3d+xml" height="600" width="800">
<param name="src" value="hello.x3d"/>
</body>
</html>
Take note that the object tag also specifies the height and width of the object inside
the html page.
16
3. Displaying query results in AMOS II graphically
The project work consisted of two main parts for the chart functions, the AMOS II part,
which is done by creating one foreign function definition for all of the charting
functions, and the Java method representing the foreign function in the Java class. We
will describe both parts for each of the charting functions separately and specify the
advantages for each one of the charting functions.
But before we get to the main chart function that intended to extend the AMOS II
system. We will first explain how to setup the AMOS II environment with Java language
interface, and we will also explain the theory behind our work.
3.1 Setting up the environment
We should follow these steps for setting up the AMOS environment:
Download the AMOS II system from their website [25].
Extract the downloaded archive folder to a directory for example (D:\amos2).
Go to the bin folder in the extracted files and you can lunch the AMOS II system
by running the executable file (amos2.exe).
But in order to allow the AMOS II system to use the Java interfaces we should be able
to run the AMOS system from the Java virtual machine. This is done by following the
below additional steps:
Download and setup the Java virtual machine from the oracle website [26] if you
don't have it yet.
Set the environment variables by going to the
(Control Panel) (System) (Advanced) page, and then click on the
Environment Variables button. Then in the user variables edit the (PATH)
variable and at the end of the other paths add the path to the AMOS II bin
folder. If the above directory was the AMOS II directory then you should add this
path at the end (;D:\amos2\bin), if you couldn't find the PATH variable then
create it.
Then edit or create new (CLASSPATH) variable in the user variables and include
the path to the (javaamos.jar) file in the path field. For example you should
include (D:\amos2\bin) in path field of the CLASSPATH variable.
Restart your system.
Now you can run AMOS from the Java virtual machine by calling the command
procedure:
> javaamos <database image file>
javaamos.bat requires as first parameter the exact path to a database image file
(default is 'amos2.dmp'). After that you will enter the AMOS II top loop as with
amos2.exe, but inside the Java virtual machine.
17
3.2 The theory behind the work
We learnt previously on AMOS II background section that by using the AMOS II callout
interface we can extend the AMOS II system with foreign functions that can perform
almost anything using user defined Java class (2.2.2.2 The callout interface).
The problem is that, for us to create charts from the result of a query, we need to pass
the whole query result to the foreign function that we will create. In other words, the
defined foreign function should accept any query as an input parameter.
For example, the below query is from the Demo database for the World Cup series that
is available with the AMOS II tutorial [1]. It will return a list of the years of the Football
World Cup tournaments, with the host name of each year and the number of teams
that have participated in that tournament:
AMOS #>select year(t), name(host(t)), count(participating_teams(t)) from
Tournament t;
We should be able to get the result from the above query as a displayed chart instead
of table of values. So if we assumed that we have created a foreign function that is
called (chart) which will do that for us. We should simply pass the above query as
argument to the foreign function like below:
AMOS #>chart(select year(t), name(host(t)), count(participating_teams(t)) from
Tournament t);
And this will make the results of the AMOSQL query be displayed as an SVG chart in
the default Internet browser on the used computer.
However, the result of this query is a bag of tuples, and if we defined the foreign
function in AMOS II to take a bag of tuples as argument, the foreign function will
simply be applied to every row in the output results from the original query separately.
This is absolutely will not be acceptable for us, as we want the whole result from the
query to be passed to the foreign function. The reason for that is simple, it is essential
to get the whole scope of the data result from the query so that the chart function can
identify the maximum values for the X-axis and the maximum values for all the other
column values in the result which will represent the Y-axis.
This will take us back again to the AMOS II background which we explained that only
the aggregate functions can take the whole result from a query, as they have different
semantics compared to ordinary AMOS II functions in that they are not applied on each
element of a bag as regular functions, but on entire bags. The reason for that is
because they take (bag of object) as their argument (2.1.5 Aggregate functions).
So our foreign function definition should be something like below:
AMOS #>create function chart(Bag of Object x) -> object as foreign
"JAVA:SVGenerator/charter";
18
As we see in the definition above the AMOS II foreign function (chart) takes the
argument (Bag of Object x) and will be linked to the Java method (charter) in the
(SVGenerator) Java class.
Now all the result from any AMOSQL query will be passed through to the corresponding
Java method linked with the foreign function. But that leave us with another problem.
According to the foreign function implementation which we mentioned in section
(2.1.3.3 Foreign functions); the definition for the above AMOS II foreign function
(chart) in Java should be like below:
public void charter(CallContext cxt, Tuple tpl) throws AmosException
{
// ..function code
}
And the argument (tpl) should hold all the query result from the AMOS II system. But
when we try to retrieve the data result from the query, we find that it is impossible to
find the type of the received data through the (tpl) argument. The reason is that we
didn't pass only the data from the query result. But we passed also an object structure
which cannot be identified by the (callin.*) and the (callout.*) java libraries included
with the AMOS II system.
So, we have to change the way we pass the data to the foreign function, for this we
implement a derived AMOS II function which convert the argument (Bag of Object) to a
(Vector) using the built-in function in AMOS II (vectorof). Now our foreign function
definition will look like this:
AMOS #>create function charter(Vector v)-> object as foreign
"JAVA:SVGenerator/charter";
AMOS #>create function display(Bag of Object x)-> object as select
charter(vectorof(x));
When we call the display derived function with any query as its argument, the result of
the query will be received as (Bag of Object x), it will be converted to a (Vector) by the
(vectorof) function and then pass the Vector argument to the implemented foreign
function.
This will allow the AMOS II Java interface libraries to be able to read the received
argument data and process it accordingly.
The first step of processing the data is to convert it to an array then sort the array by
the first column which will be the (X-axis). In order to make the process more efficient,
we can use the built-in sort functions in AMOS II [4] and sort the result from the query
before passing the result to the implemented foreign function. This will minimize one
step for us because the output from the built-in sort function in AMOS II is a Vector, so
we won't need to use the function (vectorof).
19
Instead we will use the sort function to make the conversion for us too. Then our
definition for the foreign function will be like below:
AMOS #>create function charter(Vector v)-> object as foreign
"JAVA:SVGenerator/charter";
AMOS #>create function display(Bag of Object x)-> object as select
charter(sort(x));
As the last step, we need a way to specify the chart type that we need our data results
from the AMOSQL query to be presented by. For specifying that, we need to add
another argument to the definition of the foreign function. This argument will let us
identify the chart type that we require. And it will also make it extremely easier to add
or develop more graph chart types to the implemented Java class.
Our final version of the foreign function definition in AMOS II system will be like below:
AMOS #>create function charter(object ct, Vector v) -> object as foreign
"JAVA:SVGenerator/charter";
AMOS #>create function display(object ct, Bag of Object x) -> object as select
charter(ct,sort(x));
The ct variable (ChartType) will identify the type of graph that we desire, simply by
passing an integer value that represent the equivalent chart type or by passing a string
that correspond to the chart type. We will describe the accepted ct variable values for
each of the chart functions later.
3.3 Helper functions
The main chart functions in the project are responsible for translating the data in the
query result to an appropriate SVG image data or to X3D Scene data which represent
the result of the query graphically. But for them to work in a reliable manner there are
other functions that facilitate the process for them, these helper functions are:
3.3.1 Tuple to Array converter
Now after we managed to get the result from any query to be sorted and passed to our
foreign function, there should be a special method in the Java class that can convert
this data which we received as a Tuple to a simple 2 dimensional array. This conversion
is important to make the processing of the data easier and error pron.
There are two functions in the Java class responsible to make this conversion:
public static double[][] bTupleToArray(Tuple tpl) throws AmosException
and
public static double[][] lTupleToArray(Tuple tpl) throws AmosException
20
The only difference between the functions is that the (bTupleToArray) convert the
received data to a 2-dimensional array of double type, and also retrieve any string data
in the query result to another one dimensional array of string type data as a possible
data to use for building a legend for the Bar chart function (BarChart).
3.3.2 The charter function
The charter function is responsible for receiving the foreign function argument data
from the AMOS II system (the chart type variable and the actual sorted result from the
AMOSQL query) and processes them accordingly.
It will resolve the first argument to determine the requested chart type that should be
used to display the query result graphically.
Then it will pass the data result from the AMOSQL query to the appropriate (Tuple to
Array converter) to get a 2-dimensional array as a result. Then it will pass that array
result to the requested chart type determined by the ct variable.
3.3.3 Minimum and Maximum values
There are two functions responsible for determining the Minimum and the Maximum
values in a one dimensional array; this will help the chart functions to calculate the
required scaling factors for the relevant axis. These two functions are:
public static double getMaxValue(double[] arr)
public static double getMinValue(double[] arr)
3.3.4 The Graph Labels
Every chart or statistical graph type needs a little explanation to be understood better
by the viewer. This explanation is really done through labeling the graph components
according to the data which is presented.
The function responsible about doing this is (getChartLabels), it simply returns an array
of string values which contain the chart title, the X-axis label, the Y-axis label, and the
legend marks. It is defined like below:
public static String [] getChartLabels()
When this function is called, it will search for a Comma Separated Values File called
(SVGTitles.csv), if it finds it then it will read the previously saved graph titles and
display them for the user. The user then can chose the number of the graph title which
he wants to be used for the displayed SVG chart image or the X3D scene, or he can
just press (Enter) to skip. The user can also choose to create a new title entry in the
file by entering zero (0).
The (SVGTitles.csv) file can be edited by any text editor or by any sheet editor like (MS
Excel) to edit the component values which are in the following order.
Graph title;X-axis label;Y-axis label;(Z-axis label;)legend componens 1;legend
componens 2;…etc
21
3.3.5 The initialization foreign function
Beside the main charter foreign function, there is also the (initvg) foreign function. This
function is responsible about initializing certain parameters in the SVGenerator class.
These parameters are important, because they control the way the graphs will appear.
The definition for the initialization function in AMOSQL is like below:
AMOS#> create function initsvg(object ct, Vector v) -> object as foreign
"JAVA:SVGenerator/initvg";
AMOS#> create function initvg(object ct,Bag of Object x) -> object as select
initsvg(ct,vectorof(x));
Below are parameters that you can change using the initvg foreign function and the
arguments that should be passed to it:
To change the default colors for the 2D graphs you can call:
AMOS#> initvg('2dcolor',bagof({Optional Group value,R,G,B},{}...));
examples:
AMOS#> initvg('2dcolor',bagof({255,255,255},{176,26,200},{0,0,0}));
This will change the first three default colors with above RGB colors.
AMOS#> initvg('2dcolor',bagof({0,255,255,255},{2,176,26,200},{4,0,0,0}));
This will change the first, third and fifth default colors with above RGB colors.
To change the default colors for the 3D graphs you can call:
AMOS#> initvg('3dcolor',bagof({Optional Group value,R,G,B},{}...));
examples:
AMOS#> initvg('3dcolor',bagof({255,255,255},{176,26,200},{0,0,0}));
This will change the first three default colors with above RGB colors.
AMOS#> initvg('3dcolor',bagof({0,255,255,255},{2,176,26,200},{4,0,0,0}));
This will change the first, third and fifth default colors with above RGB colors.
To change the sky background color for the 3D graphs you can call:
AMOS#> initvg('3dbackground',ST); ST = 'black' OR 'white'
default black
To change the opening destination of the generated graph you can call:
AMOS#> initvg('destination',ST); ST='browser' OR 'viewer' default browser
To assign a specific viewer path for SVG images you can call:
AMOS#> initvg('SVGviewer',ST); ST = 'default' OR 'VIEWER FILE PATH'
To assign a specific viewer path for X3D scenes you can call:
AMOS#> initvg('X3Dviewer',ST); ST = 'default' OR 'VIEWER FILE PATH'
To change the point radius for the 3D plot graphs you can call:
AMOS#> initvg('3DPointRadius',FL); FL = {0.02 - 0.002} default 0.01
To change the point radius for the 2D plot graphs you can call:
AMOS#> initvg('2DPointRadius',INT); INT = {1 - 5} default 3
To change the Line Width of the Line graphs you can call:
AMOS#> initvg('LineWidth',INT); INT = {1 - 3} default 2
For displaying the above syntax help inside AMOS II system just call the initvg foreign
function like below:
AMOS#> initvg('help','');
22
3.4 The main chart functions
The implemented (SVGenerator) Java class has six main graph functions, which they
will be called from AMOS II by one foreign function. These graphs represent the most
general chart types that are used to represent data graphically. They are (Bar graphs,
Line graphs, Extended Bar Graphs, Scatter Plot graphs, Extended Line graphs, and the
3D plotter graph). Each of which has its own advantages, disadvantages, and way of
presenting the data [15].
But we have to mention that for the SVGenerator class to work, the AMOS II system
should work inside the Java virtual machine. And the (SVGenerator.java) should be
compiled by the Java compiler and the generated class file (SVGenerator.class) should
be placed in the Java classes folder. This will allow the AMOS II system to load the
class when the foreign function is defined. After that the foreign function are ready to
be called.
There is only one foreign function definition in AMOS II system which will allow us to
call any of the charting functions that we desire. The only different is the chart type
(ct) variable that we will pass during the foreign function call. The definition for the
foreign function (display) in AMOS II is like below:
AMOS #>create function charter(object ct, Vector v) -> object as foreign
"JAVA:SVGenerator/charter";
AMOS #>create function display(object ct, Bag of Object x) -> object as select
charter(ct,sort(x));
And the Java class method definition for the foreign function is like below:
public void charter(CallContext cxt, Tuple tpl) throws AmosException
In the following sections we will describe each of the graph functions separately and
what should be passed as the ct variable to determine the requested graph function.
For displaying the syntax help for the display foreign function inside AMOS II system
just call it like below:
AMOS#> display('help','');
3.4.1 Bar graph generator
Bar graphs are good for showing how data change over time, as they can display
discrete data in separate columns. From there advantages is that they can show each
category of data in a frequency distribution, display proportions of multiple categories,
can summarize huge data in simple easy to understand visual form (visually strong),
show data trends better than tables, and they also grant a visual check of the accuracy
and reasonableness of the data. However they require additional information for
explaining, and they can't reveal causes, effects, or patterns.[15][16][18]
23
How to call from AMOS
It should be called by passing either an integer (1) or a string ("barchart") as the first
argument value and placing a query as a second argument of the (display) derived
function, the (display) function will sort and convert the result of the query to a Vector
type argument and pass both the arguments (ct and sorted vector query result) to the
(charter) foreign function. For example:
display('barchart',(select year(t), name(host(t)), count(participating_teams(t))
from Tournament t));
Or
display(1,(select year(t), name(host(t)), count(participating_teams(t)) from
Tournament t));
Note that the string "barchart" is NOT case sensitive. So as long as the characters are
the same it does not matter. It will be recognized by the charter foreign function.
Java method structure
public void barChart(double[][] temp)
{
// establishing a buffer writer for the output SVG file
// get the maximum value for the Y-axis and round it appropriately
// calculate the Y-axis scaling factor using the maximum value above
// start writing the header for the SVG file including the dimensions of
// the image, translate, and scaling parameters
// draw the axis with the appropriate axis styles
// divide the Y-axis by 4 gray lines for clarity
// define a new decimal format to use with the labels
// label the Y axis at each section by the right value using maximum Y
// start of drawing the bars on the X-axis by calculating the No. of rows
// calculate the bar height using the Y-axis scaling factor
// calculate the position of the bar on the X-axis
// now draw the bar in the calculated position
// now label under the bar with an appropriate value
// label inside the bar with the actual Y-axis value
// create a legend table for colors used
// close the SVG image file and send it to the default browser.
}
24
Pattern of display
The barChart function will take the sorted result of the query (a 2-dimensional array of
double) passed as argument from the charter function; and then translate the array
data to an SVG file format that contain the XML instructions for generating the graph
(Note that only the first and second column of the array will be used for generating the
graph, first column as the X-axis). It will also embed the generated SVG image into an
html page and call the default Internet browser to display the page.
The BarChart function cannot handle continues data, so it can only present up to 25
data elements at a time. And that means no scalability issues.
For example, the result from the query above will be displayed using the barChart
function in the browser like below:
Another example below that show a different type of dummy data converted to graph
using the barChart function.
25
3.4.2 Line graph generator
Line graphs are popular way to represent continues data; they are most used than all
other graphs combined. Their visual characteristics reveal data trends clearly and they
are easy to create. It is simply created by plotting continues data as points then join
them with a line. In line graphs multiple data sets can be used to be graphed together
but off course a key must exist between them. From their advantages is that they can
compare multiple data sets easily, they allow the viewer to make predictions about the
future results, and the interim data between the points can be inferred from the graph
line [16][17].
How to call from AMOS
It should be called by passing either an integer (2) or a string ("LineChart") as the first
argument value and placing a query as a second argument of the (display) derived
function, the (display) function will sort and convert the result of the query to a Vector
type argument and pass both the arguments (ct and sorted vector query result) to the
(charter) foreign function.
For example:
display('LineChart',(select spectators(m), count(participating_players(m)),
goals(m) from Match m where (year(played_in(m))=1958)));
Or
display(2,(select spectators(m), count(participating_players(m)), goals(m) from
Match m where (year(played_in(m))=1958)));
Note that the string "LineChart" is NOT case sensitive. As long as the characters are
the same it does not matter. It will be recognized by the charter foreign function.
Java method structure
public void lineChart(double[][] temp)
{
// establishing a buffer writer for the output SVG file
// get the maximum value for the Y-axis from all the columns and round it
// calculate the Y-axis scaling factor using the maximum value above
// calculate the X-axis scaling factor using the number of data rows
// start writing the header for the SVG file including the dimensions of
// the image file, translate, and scaling parameters
// draw the axis with the appropriate axis styles
// define a new decimal format to use with the labels
// divide the Y-axis by 4 gray lines for clarity
// divide the X-axis to sections by gray lines for clarity
// if the number of elements could not be presented on the graph then
26
// divide to the nearest possible presentation for the X-axis
// draw the gray line and put an appropriate label under it
// label the Y axis at each section by the right value using maximum Y
// calculate the number of points to be graphed and write the legend label
// start of drawing the line graph for each column of data
// initialize the first point with origin (0,0)
// for each row value in the column do the following
// calculate the new point position on the X-axis
// calculate the new point position on the Y-axis
// draw a colored line from the old point to the new point
// draw a colored circle in the place of the new point for clarity
// now assign the new point to the old point
// create a legend mark for the graphed column by the color
// close the SVG image file and send it to the default browser.
}
Pattern of display
The lineChart function will take the sorted result of the query (a 2-dimensional array of
double) passed as argument from the charter function; then translate the sorted array
data to an SVG file format that contain the XML instructions for generating the graph.
It will also embed the generated SVG image into an html page and call the default
Internet browser to display the page.
Note that the lineChart function can compare multiple columns of data over a shared
key column of data, which in this case should be the first column of the data passed to
the lineChart function. This first column will be presented as the X-axis.
The LineChart function can handle continues data, so it can present any scope of data
elements at a time. But concerning scalability testing, the AMOS database could handle
100000 data rows in less than a second, but the browser rendering for the SVG image
generated from that scope of data got noticeably slow.
As an example, the result from the query above will be displayed using the lineChart
function in the browser like below:
27
Another example below that show a different type of dummy data converted to graph
using the lineChart function.
28
3.4.3 Extended bar graph generator
Extended bar graphs are the same as the normal bar graphs but they can also compare
multiple data sets. They also share the same advantages, and disadvantages with the
bar graphs [17].
How to call from AMOS
It should be called by passing either an integer (3) or a string ("ExtBarChart") as the
first argument value and placing a query as a second argument of the (chart) derived
function, the (display) function will sort and convert the result of the query to a Vector
type argument and pass both the arguments (ct and sorted vector query result) to the
(charter) foreign function.
For example:
display('ExtBarChart',(select spectators(m), count(participating_players(m)),
goals(m) from Match m where (year(played_in(m))=1958)));
Or
display(3,(select spectators(m), count(participating_players(m)), goals(m) from
Match m where (year(played_in(m))=1958)));
Note that the string "ExtBarChart" is NOT case sensitive. As long as the characters are
the same it does not matter. It will be recognized by the charter foreign function.
Java method structure
public void eBarChart(double[][] temp)
{
// establishing a buffer writer for the output SVG file
// get the maximum value for the Y-axis from all the columns and round it
// calculate the Y-axis scaling factor using the maximum value above
// start writing the header for the SVG file including the dimensions of
// the image file, translate, and scaling parameters
// draw the axis with the appropriate axis styles
// divide the Y-axis by 4 gray lines for clarity
// define a new decimal format to use with the labels
// label Y-axis at each section by the right value according to maximum Y
// find the number of rows to be presented and calculate the bar width
// for each row of data do the following
// for each column of data do the following
// calculate the Bar Height by using the Y-axis Scale Factor
// calculate the Y-axis position of where we should place the bar
29
// calculate the position of the bar on the X-axis
// now draw the bar by the specified column color
// label the X-axis under the Bars with appropriate value
// create a legend table for colors
// close the SVG image file and send it to the default browser.
}
Pattern of display
The eBarChart function will take the sorted result of the query (a 2-dimensional array
of double) passed as argument from the charter function; and then translate the array
data to an SVG file format that contain the XML instructions for generating the graph.
It will also embed the generated SVG image into an html page and call the default
Internet browser to display the page.
The eBarChart function can compare multiple columns of data over a shared key
column of data, which in this case should be the first column of the data passed to the
eBarChart function. This first column will be presented as the X-axis.
The eBarChart function cannot handle continues data, so it can only present up to 40
data elements at a time (Data rows*Number of columns<=40). And that means no
scalability issues.
For example, the result from the query above will be displayed using the eBarChart
function in the browser like below:
30
Another example below that show a different type of dummy data converted to graph
using the eBarChart function.
3.4.4 Scatter plot graph generator
The scatter plot graph displays the relationship between two columns of the data; it
can also plot multiple data sets with shared key column. They can show a trend in the
relationships between the data, they also retain the exact data values and their sample
size. But they require the data to be continues on both axes, and can't visualize huge
data samples [16][18].
How to call from AMOS
There are three forms of plotter graphs, the first one can compare multiple datasets
over a shared key column, and it is called by passing either an integer (4) or a string
("PlotChart") as the first argument value.
The second form can plot separated 2D point groups, this form can be called by
passing either an integer (9) or a string ("SPlotChart") as the first argument.
The third form can plot stream 2D points (x,y), which can also be grouped by third
column to break the points stream to groups and compare them. This form can be
called by passing an integer (10) or a string ("PlotchartSP") as the first argument.
For all forms we should place a query as a second argument of the (display) derived
function, the (display) function will sort and convert the result of the query to a Vector
type argument and pass both the arguments (ct and sorted vector query result) to the
(charter) foreign function.
First form example:
31
display('PlotChart',(select spectators(m), count(participating_players(m)),
goals(m) from Match m where (year(played_in(m))=1958)));
Or
display(4,(select spectators(m), count(participating_players(m)), goals(m) from
Match m where (year(played_in(m))=1958)));
Second form example:
display('SPlotChart',(select spectators(m), count(participating_players(m)) from
Match m where (year(played_in(m))=1958)));
Or
display(9,(select spectators(m), count(participating_players(m)) from Match m
where (year(played_in(m))=1958)));
Third form example:
display('PlotChartSP',(select spectators(m), count(participating_players(m)) from
Match m where (year(played_in(m))=1958)));
Or
display(10,(select spectators(m), count(participating_players(m)) from Match m
where (year(played_in(m))=1958)));
Note that the strings "PlotChart", "SPlotChart" and "PlotChartSP" are NOT case
sensitive. As long as the characters are the same it does not matter. It will be
recognized by the charter foreign function.
Java method structure
public void plotChart(double[][] temp)
{
// establishing a buffer writer for the output SVG file
// get the maximum value for the X-axis and round it
// get the maximum value for the Y-axis from all the columns and round it
// calculate the both-axis scaling factors using the maximum values above
// start writing the header for the SVG file including the dimensions of
// the image file, translate, and scaling parameters
// draw the axis with the appropriate axis styles
// define a new decimal format to use with the labels
// divide the Y-axis by 4 or 8 sections by gray lines for clarity
// divide the X-axis to 4 or 8 sections by gray lines for clarity
// label the Y-axis at each section by the right values using maximum Y
32
// label the X-axis at each section by the right values using maximum X
// start plotting the dots on the plot graph for each Column of data
// for each row of data do the following
// calculate the point position on the X-axis
// calculate the point position on the Y-axis
// draw a colored circle in the calculated point position
// create a legend mark for the graphed column by the color
// close the SVG image file and send it to the default browser.
}
Pattern of display
The plotChart function will take the sorted result of the query (a 2-dimensional array of
double) passed as argument from the charter function; then translate the sorted array
data to an SVG file format that contain the XML instructions for generating the graph.
It will also embed the generated SVG image into an html page and call the default
Internet browser to display the page.
The plotChart function can plot multiple columns of data over a shared key column of
data, which in this case should be the first column of the data passed to the plotChart
function. This first column will be presented as continues X-axis.
The third form of the function can also plot negative data on both axes.
The plotChart function can handle continues data, so it can present any scope of data
elements at a time. But concerning scalability testing, the AMOS database could handle
100000 data rows in less than a second, but the browser rendering for the SVG image
generated from that scope of data got noticeably slow.
For example, the result from the query above will be displayed using the plotChart
function in the browser like below:
33
Another example below that show cluster data from the Data Mining 1 course plotted
using the third form:
3.4.5 Extended Line graph generator
Extended line graphs are the same as the normal line graphs but they can also display
negative values on the Y-axis and they are also scalable. They also share the same
advantages, and disadvantages with the line graphs [16][17].
How to call from AMOS
It should be called by passing either an integer (5) or a string ("ExtLineChart") as the
first argument value and placing a query as a second argument of the (display) derived
function, the (display) function will sort and convert the result of the query to a Vector
type argument and pass both the arguments (ct and sorted vector query result) to the
(charter) foreign function. For example:
display('extLineChart',(select i, i*2-(i/2), i*i/2, i*i/3 from Number i where i
in iota(1,2000)));
Or
display(5,(select i, i*2-(i/2),i*i/2,i*i/3 from Number i where i in
iota(1,2000)));
34
Note that the string "ExtLineChart" is NOT case sensitive. As long as the characters are
the same it does not matter. It will be recognized by the charter foreign function.
Java method structure
public void lineChart(double[][] temp)
{
// establishing a buffer writer for the output SVG file
// get the maximum value for the Y-axis from all the columns and round it
// get the minimum value for the Y-axis from all the columns and round it
// if the absolute minimum value is greater than the maximum value then
// make the maximum value equal to the absolute minimum value
// calculate the Y-axis scaling factor using the maximum value above
// calculate the X-axis scaling factor using the number of data rows
// start writing the header for the SVG file including the dimensions of
// the image file, translate, and scaling parameters
// draw the axis with the appropriate axis styles
// define a new decimal format to use with the labels
// divide the Y-axis by 8 gray lines for clarity
// divide the X-axis to sections by gray lines for clarity
// if the number of elements could not be presented on the graph then
// divide to the nearest possible presentation for the X-axis
// draw the gray line and put an appropriate label under it
// label the Y axis at each section by the right value using maximum Y
// calculate the number of points to be graphed and write the legend label
// if the number of points to be graphed are more than a specified number
then calculate a skip factor to skip between the points. This is done for
scalability issue.
// start of drawing the line graph for each column of data
// initialize the first point with origin (0,0)
// for each row value in the column do the following
// check the skip factor to determine if the point should be graphed
// calculate the new point position on the X-axis
// calculate the new point position on the Y-axis
// draw a colored line from the old point to the new point
35
// draw a colored circle in the place of the new point for clarity
// now assign the new point to the old point
// create a legend mark for the graphed column by the color
// close the SVG image file and send it to the default browser.
}
Pattern of display
The eLineChart function will take the sorted result of the query (a 2-dimensional array
of double) passed as argument from the charter function; then translate the sorted
array data to an SVG file format that contain the XML instructions for generating the
graph. It will also embed the generated SVG image into an html page and call the
default Internet browser to display the page.
Note that the eLineChart function can compare multiple columns of data over a shared
key column of data, which in this case should be the first column of the data passed to
the eLineChart function. This first column will be presented as the X-axis.
The eLineChart function can handle continues data and negative data, so it can present
any scope of data elements at a time. Concerning scalability testing, the AMOS
database could handle 100000 data rows in less than a second, and the browser
rendering for the SVG image generated from that scope of data is really fast because of
introducing a skip factor variable. It will basically try to graph certain interval points
and the line graph will connect between the gape. This is a very effective method and
can also be used in the regular lineChart function too. As an example, the result from
the query above will be displayed using the eLineChart function in the browser like
below:
36
Another example showing the result from graphing the query (select (i*0.01),
cos((i*0.01)),sin((i*0.01)) from Number i where i in iota(1,1000)) using the
eLineChart is below:
3.4.6 3D plotter graph generator
The 3D plotter graph generator is the same as the normal plotter graph but it can also
display negative values on all the three axes (X, Y, and Z axis) and it's also scalable.
We have used the X3D vector graphic language to generate the 3D scene, which allows
navigation through the generated graph. This chart function is very powerful tool for
comparing data columns over the three axes.
How to call from AMOS
There are three forms of 3D plotter graphs, the first one can compare multiple datasets
over two shared key columns, and it is called by passing either an integer (6) or a
string ("3dPlotChart") as the first argument value.
The second form can plot separated 3D point groups, this form can be called by
passing either an integer (7) or a string ("S3DPlotChart") as the first argument.
The third form can plot stream 3D points (x,y,z), which can also be grouped by fourth
column to break the points stream to groups and compare them. This form can be
called by passing an integer (8) or a string ("SP3DplotChart") as the first argument..
For all forms we should place a query as a second argument of the (display) derived
function, the (display) function will sort and convert the result of the query to a Vector
37
type argument and pass both the arguments (ct and sorted vector query result) to the
(charter) foreign function.
First form example:
display('3DPlotChart',(select (i*0.01), cos((i*0.01)),sin((i*0.01)) from Number i
where i in iota(1,1000)));
Or
display(6,(select (i*0.01), cos((i*0.01)),sin((i*0.01)) from Number i where i in
iota(1,1000)));
Second form examples:
display('S3DPlotChart',(select (i*0.01), cos((i*0.01)), (i*0.01), sin((i*0.01))
from Number i where i in iota(1,1000)));
Or
display(7,(select (i*0.01), cos((i*0.01)), (i*0.01), sin((i*0.01)) from Number i
where i in iota(1,1000)));
Third form examples:
display('SP3DPlotChart',(select (i*0.01), cos((i*0.01)) from Number i where i in
iota(1,1000)));
Or
display(8,(select (i*0.01),cos((i*0.01)) from Number i where i in iota(1,1000)));
Note that the strings "3dplotChart","S3dplotChart" and "SP3dplotChart" are NOT case
sensitive. As long as the characters are the same it does not matter. It will be
recognized by the charter foreign function.
Java method structure
public void plotChart3D(double[][] temp)
{
// establishing a buffer writer for the output X3D file
// get the maximum value for the X and Y axis
// get the minimum value for the X and Y axis
// if the absolute minimum value is greater than the maximum value then
make the maximum value equal to the absolute minimum value for both axis
// get the maximum value for the Z-axis from all the columns
// get the minimum value for the Z-axis from all the columns
// if the absolute minimum value is greater than the maximum value then
make the maximum value equal to the absolute minimum value for Z-axis
38
// calculate the X-axis scaling factor using the maximum value above
// calculate the Y-axis scaling factor using the maximum value above
// calculate the Z-axis scaling factor using the maximum value above
// start writing the header for the X3D file including the dimensions of
the image file, translate, and scaling parameters
// define the axes with the appropriate axes styles and labels
// define a new decimal format to use with the labels
// start of plotting the points on the plot graph for each column of data
// calculate the point position on the X-axis
// calculate the point position on the Y-axis
// calculate the point position on the Z-axis
// define a Sphere shape to represent the point using a specific
appearance and color.
// close the X3D scene and generate an html file that embed the X3D scene
and send it to the default browser.
}
Pattern of display
The plotChart3D function will take the sorted result of the query (a 2-dimensional array
of double) passed as argument from the charter function; then translate the sorted
array data to an X3D file format that contain the XML instructions for generating the
graph scene. It will also embed the generated X3D scene into an html page and call the
default Internet browser to display the page. We should mention that in order for the
browser to be able to display the X3D scene certain plug-in should be installed on the
computer. From the best freeware plug-ins that can be installed is the (Flux Studio)
[32] which can render any X3D scene in all the major browsers.
Note that the plotChart3D function can compare multiple columns of data over shared
key columns of data, which in this case should be the first and second column of the
data passed to the plotChart3D function. The first column will be presented as the Xaxis while the second column will be presented as the Y-axis.
The plotChart3D function can handle continues data and negative data, so it can
present any scope of data elements at a time. Concerning scalability testing, the AMOS
database could handle 100000 data rows in less than a second, but the browser plug-in
rendering for the X3D scene generated from that scope of data is slow.
As an example, the result from the query above will be displayed using the plotChart3D
function in the browser like below:
39
Other scene example using dummy data generated by the second calling form:
Other example using cluster data from the Data Mining 1 course plotted by third from:
40
4. Conclusion and future work
The (SVGenerator) java class can provide integrated basic graphing functions for the
AMOS II system. It can simply be used to generate six basic chart types from the data
results of any AMOSQL query. The integration with the AMOS II system is done in a
very effective way using the AMOS II java interfaces libraries.
The SVGenerator is generating the graph images using Scalable Vector Graphics (SVG)
and the 3D graph using (X3D).
SVG is a language for describing two-dimensional graphics and graphical applications in
XML, and it’s a W3C Recommendation. The SVG is supported by all the major internet
browsers nowadays.
X3D is the ISO standard XML-based file format for representing 3D computer graphics,
it has the ability to encode the scene using an XML syntax. X3D also benefits from
other open source standards like XML, DOM and XPath. Internet browsers need a plugin to be able to display X3D scenes.
This class can be a base for more advanced and sophisticated graphing types, as it
explains the theory behind the integration, and the way of handling the acquired data.
The class itself can be edited and the current graphing functions to be tailored
according to the needs. They can also display additional information that will help to
explain certain types of graphs and assist the viewer in understanding the graph. More
arguments can also be added to the main foreign function for specifying the X and the
Y axis in the result data.
The SVGenerator class code is time and processor efficient; it can dynamically generate
an SVG graph image for a range of 100000 data rows in less than a second. But the
real time consuming issue is when the browser is rendering the SVG image or the X3D
scene on the screen.
As a future work, we can develop other graph types. We can also integrate all the
graph functions using the X3D vector graphics. WebGL is also an option for generating
the graphs, however the final draft of its specifications have been released recently in
February 2011.
We can also try to implement such functionality into the AMOS II system using the C
language interface for more advanced control. And in this case it won't require running
AMOS II from inside the Java virtual machine.
41
References
[1].
[2].
[3].
[4].
[5].
[6].
[7].
[8].
[9].
[10].
[11].
[12].
[13].
[14].
[15].
[16].
[17].
[18].
[19].
[20].
[21].
[22].
[23].
[24].
[25].
[26].
[27].
[28].
[29].
[30].
[31].
[32].
Gustav Fahl and Tore Risch: "AMOS II Tutorial", Uppsala Database Laboratory, Uppsala
University, Sweden, September 2009.
Daniel Elin and Tore Risch: "AMOS II Java Interfaces", Uppsala Database Laboratory, Uppsala
University, Sweden, March 2005.
Tore Risch, Vanja Josifovski, and Timour Katchaounov: "Functional Data Integration in a
Distributed Mediator System", Uppsala University, Sweden 2004.
Staffan Flodin, Martin Hansson, Vanja Josifovski, Timour Katchaounov, Tore Risch, Martin Sköld,
and Erik Zeitler: "AMOS II User's Manual", Uppsala Database Laboratory, Uppsala University,
Sweden, March 2005.
Kjell Orsborn, Tore Risch, and Staffan Flodin: "Representing Matrices Using Multi-Directional
Foreign Functions", UDBL, Uppsala University, Sweden, 2004.
Educause Learning Initiative: "7 things you should know about Data Visualization",
www.educause.edu/eli , October 2007.
Oren Frank and Michael Miller: "Why Data Visualization Is About to Become Very Important",
"http://adage.com/digitalnext/post?article_id=145345", November 2010.
Oracle Technology Network: "Java SE 6 Documentation",
"http://download.oracle.com/javase/6/docs/".
Oracle Technology Network: "Java Programming Language",
"http://download.oracle.com/javase/6/docs/technotes/guides/language/".
The World Wide Web Consortium (W3C): "Scalable Vector Graphics (SVG) 1.1",
"http://www.w3.org/TR/SVG/", June 2010.
W3Schools: "Introduction to XML", "http://www.w3schools.com/xml/xml_whatis.asp".
David Duce, Ivan Herman, Bob Hopgood: "SVG Tutorial", Oxford Brookes University, and the
World Wide Web Consortium, "http://www.w3.org/2002/Talks/www2002-svgtut-ih/hwtut.pdf ".
The World Wide Web Consortium (W3C): "SVG Transforms 1.0", "http://www.w3.org/TR/SVGTransforms/", March 2009.
The World Wide Web Consortium (W3C): "Extensible Markup Language",
"http://www.w3.org/XML/".
SlideShare.net: "TID Chapter 5 Introduction to Charts and Graph",
"http://www.slideshare.net/wanbk/tid-chapter-5-introduction-to-charts-and-graph".
YoungZones.org: "Statistical Graphs", "http://math.youngzones.org/stat_graph.html".
Ncsu.edu: "Graphing Resources", "http://www.ncsu.edu/labwrite/res/gh/gh-linegraph.html".
University of Illinois: "Carolyn's Unit on Graphing",
"http://mste.illinois.edu/courses/ci330ms/youtsey/intro.html".
AMOS II website: "http://user.it.uu.se/~udbl/amos/".
W3C: "Graphics on the Web", "http://www.w3.org/Graphics/".
Wikipedia,"X3D", "http://en.wikipedia.org/wiki/X3D".
Web3D: "What is X3D", "http://www.web3d.org/about/overview/".
Wikipedia: "WebGL", "http://en.wikipedia.org/wiki/WebGL".
X3D graphics: "Learning X3D", "http://x3dgraphics.com/".
The AMOS II system download website: "http://user.it.uu.se/~udbl/amos/".
The Java virtual machine download website:
"http://www.oracle.com/technetwork/java/index.html".
Wikipedia: "List of vector graphics markup languages",
"http://en.wikipedia.org/wiki/List_of_vector_graphics_markup_languages".
W3C: "Vector Markup Language", "http://www.w3.org/TR/NOTE-VML".
Web3D: "Virtual Reality Modeling Language", "http://www.web3d.org/x3d/vrml/".
LightHouse3D: "VRML Interactive Tutorial", "http://www.lighthouse3d.com/vrml/tutorial/".
Wikipedia: "Extensible Application Markup Language",
"http://en.wikipedia.org/wiki/Extensible_Application_Markup_Language".
Media Machines: "Flux Player and Flux Studio",
"http://mediamachines.wordpress.com/flux-player-and-flux-studio/".
42


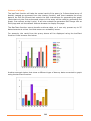


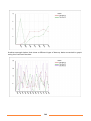


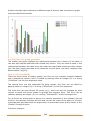


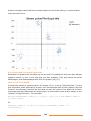


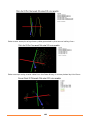


![Defining Event Handlers [Backbase Manual]](http://vs1.manualzilla.com/store/data/005692904_1-d6f01c41c66ce6049d8fb6a78592ae1b-150x150.png)