1
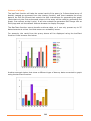
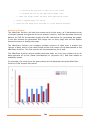
// calculate the X-axis scaling factor using the maximum value above // calculate the Y-axis scaling factor using the maximum value above // calculate the Z-axis scaling factor using the maximum value above // start writing the header for the X3D file including the dimensions of the image file, translate, and scaling parameters // define the axes with the appropriate axes styles and labels // define a new decimal format to use with the labels // start of plotting the points on the plot graph for each column of data // calculate the point position on the X-axis // calculate the point position on the Y-axis // calculate the point position on the Z-axis // define a Sphere shape to represent the point using a specific appearance and color. // close the X3D scene and generate an html file that embed the X3D scene and send it to the default browser. } Pattern of display The plotChart3D function will take the sorted result of the query (a 2-dimensional array of double) passed as argument from the charter function; then translate the sorted array data to an X3D file format that contain the XML instructions for generating the graph scene. It will also embed the generated X3D scene into an html page and call the default Internet browser to display the page. We should mention that in order for the browser to be able to display the X3D scene certain plug-in should be installed on the computer. From the best freeware plug-ins that can be installed is the (Flux Studio) [32] which can render any X3D scene in all the major browsers. Note that the plotChart3D function can compare multiple columns of data over shared key columns of data, which in this case should be the first and second column of the data passed to the plotChart3D function. The first column will be presented as the Xaxis while the second column will be presented as the Y-axis. The plotChart3D function can handle continues data and negative data, so it can present any scope of data elements at a time. Concerning scalability testing, the AMOS database could handle 100000 data rows in less than a second, but the browser plug-in rendering for the X3D scene generated from that scope of data is slow. As an example, the result from the query above will be displayed using the plotChart3D function in the browser like below: 39


![Defining Event Handlers [Backbase Manual]](http://vs1.manualzilla.com/store/data/005692904_1-d6f01c41c66ce6049d8fb6a78592ae1b-150x150.png)