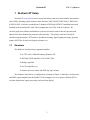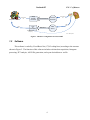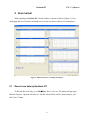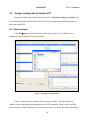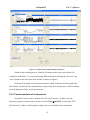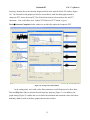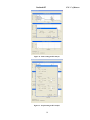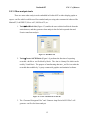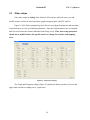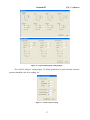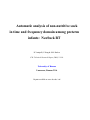
1
Automatic analysis of non-nutritive suck
in time and frequency domain among preterm
infants: NeoSuck RT
R Vantipalli, J Wang & S.M. Barlow
CNL Technical Research Report, 2006, 5:1-18.
University of Kansas
Lawrence, Kansas USA
Reprint available at www.ku.edu/~cnl
NeoSuck RT
CNL U of Kansas
Table of contents
1
2
NeoSuck RT Setup ......................................................................................................... 3
1.1
Hardware................................................................................................................ 3
1.2
Software ................................................................................................................. 4
1.3
Program installation............................................................................................... 5
User manual ................................................................................................................... 8
2.1
Record new data by NeoSuck RT.......................................................................... 8
2.2
Analyze existing data by NeoSuck RT ................................................................ 10
2.2.1
Basic analysis................................................................................................... 10
2.2.2
Fourier transform of suck pressure .................................................................. 12
2.2.3
Other analysis tools.......................................................................................... 15
2.3
3
Other setups ......................................................................................................... 16
References.................................................................................................................... 18
2
NeoSuck RT
CNL U of Kansas
1 NeoSuck RT Setup
NeoSuck RT (real time) is used to record and analyze data associated with the non-nutritive
suck (NNS), including signals related to Suck Pressure, EMG OOS-R, EMG OOS-L, EMG OOIR, EMG OOI-L, which are recorded from 5 channels of NI DAQ 6052E PCI multifunction board
installed in the acquisition PC with 3 kHz sampling rate on 16-bits vertical resolution. We
currently apply this software and hardware system to test and re-analyze the suck pressure and
signals from other channels for premature and term baby. The analysis tools in NeoSuck RT
include histogram analysis, FFT analysis, bad block screening, digital signal processing, generate
output ASCII files for time and frequency domain, etc.
1.1
Hardware
The Hardware for this testing equipment includes:
Æ A CPU with 1 GB RAM running Windows XP
Æ NI DAQ 6052E and BNC 2110 or BNC 2090
Æ Bridge Amplifier
Æ AC PreAmplifiers (4)
Æ Sensors: pressure sensor and EMG Ag/AgCl sensors
The hardware listed above is configured up according to Figure 1, and baby’s suck pressure
and EMG signal sampled from the Soothie™ silicon nipple receiver is input to NeoSuck RT for
real time digitization, signal processing, and waveform display.
3
NeoSuck RT
Suck Pressure
Ai3
Computer and DAQ
EMG
Ai4-7
Bridge
Amplifier
LPF 50Hz
Grass
AC
PreAmplifiers
CNL U of Kansas
Suck Pressure Ai3
Pressure
Transducer
Suck Pressure
Ai3
EMG
Ai4-7
EMG
Sensor
EMG Ai4-7
GND is connected
to baby leg
Dec 1, 2005 by Joan
Figure 1. Hardware configuration for NeoSuck RT
1.2
Software
This software is coded by Visual Basic.Net (17,265 coding lines) according to the structure
shown in Figure 2. The function of this software includes real-time data acquisition, histogram
processing, FFT analysis, ASCII file generation, and export desired data to .txt file.
4
NeoSuck RT
Structure Plot of NeoSuck
File
CNL U of Kansas
New
frmMain.vb mnuFileNew(): Name a new .dat file
Open
frmMain.vb mnuFileOpen():Open an existing .dat file
Page Setup frmMain.vb mnuFilePageSetup()
Print
Exit
frmPrintSelection.vb
dummy
frmMain.vb mnuPrintAmplitudeHist(), etc.
frmMain.vb mnuFilePageSetup()
DAQ
frmSettingsDAQ.vb
Graph
frmSettingsGraph.vb
8*AI calibration settings for DAQ board
Y Axis scale setting for 8*AI plots
Settings
Histgram
Suck Pr Analysis
frmSettingsHist.vb
scale setting for Histogram of Amplitude, Pause, and Burst Period
frmSettingsPeak.vb
Peak selection settings for suck pressure plot
NeoSuck
Select Baseline
frmMain.vb
Histogram
Tools
Amplitude
frmAmplitudeHist.vb Histogram plot of cumulative amplitude
Pause Period
frmBurstPauseHist.vb
Burst Period
frmDerivative.vb
Bad Block List frmAddRemoveBlocks.vb
Histogram plot of cumulative bust
Histogram plot of cumulative pause
Bad block list selection dialog
Filter frmSuckFFTSettingsFilter.vb
HPF
LPF
Graph frmSuckFFTSettingsGraph.vb
Scale
settings
Settings
SuckFFT
frmSuckFFT.vb
Create ASCII Blocks
Tools
Generate Composite
frmMain.vb mnuToolsCreateASCII():Create data file in .txt for every block
Generate Histogram Files
frmMain.vb mnuToolsGenHistFiles():Create data file in .txt for histogram of
amplitude, bust and pause
Generate Amp-Period ASCII File frmMain.vb mnuToolsGenAmpPeriodFile():Create data file in .txt for?
Convert Old Format to New Format frmMain.vb mnuToolsConvertOldToNew(): Create .txt file for?
Help
frmAbout.vb
Nov 17, 2005 by Joan
Figure 2. Coding structure plot for NeoSuck RT
1.3
Program installation
1.
Uninstall any previous installed versions of NeoSuck RT using Control Panel >
Add/Remove Programs.
2.
Install NeoSuck RT by running setup.exe from the installation package.
5
NeoSuck RT
CNL U of Kansas
Figure 3. BNC-2090
Note: Normally, it works with BNC-2090 interface (Figure 3).
To work with the BNC-2110 (Figure 4) please make the following change:
Figure 4. BNC-2110
For BNC-2110
To work with BNC-2110, the terminal configuration has to be in differential mode.
Terminal configuration can be set to differential mode by modifying the parameter value of
“terminalConfig” to “1” under <systemConstants> section in the file NeoSuckRT.exe.config
located in C:\Program Files\Neuro Logic\NeoSuck RT\. Here is the line from
NeoSuckRT.exe.config that shows this parameter value:
<add key=" terminalConfig" value="1" />
“terminalConfig” can have the following values:
6
NeoSuck RT
CNL U of Kansas
value="1" for Differential
value="2" for Referenced single ended
value="3" for Nonreferenced single ended
By default, the file NeoSuckRT.exe.config contains value="3" for “terminalConfig”. This
setting is used for the BNC-2090 signal interface. Here is the line from NeoSuckRT.exe.config
that shows this parameter value
<add key="terminalConfig " value="3" />
7
NeoSuck RT
CNL U of Kansas
2 User manual
When opening the NeoSuck RT, a blank window is shown as follows (Figure 5). User
could apply this set of software and hardware to record new data or analysis of existing data:
Figure 5. Blank window for recording and analysis
2.1
Record new data by NeoSuck RT
To Record data for a baby, go to FileÆNew, then a “Save As” file dialog will pop up as
shown in Figure 6. Input the file name as *.dat file which will be used for future analysis, and
click “Save” button.
8
NeoSuck RT
CNL U of Kansas
Figure 6. Recording new data
Then user can press the “Start” to begin the recording, or “Pause” button to halt it.
9
NeoSuck RT
2.2
CNL U of Kansas
Analyze existing data by NeoSuck RT
Based on the data collected (described in section 2.1, Record new data by NeoSuck), user
can systematically apply analysis tools in NeoSuck RT to investigate more detailed properties of
the human infant NNS.
2.2.1 Basic analysis
Click FileÆOpen, an open file dialogue will pop up (Figure 7) to enable the user to
designate the name and path of the target data file.
Figure 7. Opening an existing data file
Figure 8 shows the initial NeoSuck RT data analysis window. The three histogram
windows on the right display the histogram plots for NNS Amplitude, Pause Periods, and NNS
Burst Periods for each block that the user has selected. If the user is only interested in the analysis
10
NeoSuck RT
CNL U of Kansas
of data from 8 channels displayed in the main window, then these three histogram windows can be
closed by the user.
Figure 8. Open NeoSuck RT window for data analysis
The User can also call these windows by clicking desired window in ToolsÆHistogram as
shown in Figure 9. Furthermore, the displayed histograms can also be exported to *.txt file by
clicking ToolsÆGenerate Histogram Files for future analysis. Those files will be saved under
C:\Program Files\Neuro Logic\NeoSuck RT\Data.
11
NeoSuck RT
CNL U of Kansas
Figure 9. NeoSuck window without Histogram analysis
Similar to the recording process, NeoSuck RT analyzes data in successive blocks (30
seconds for each block). User can scroll among different blocks by clicking the “Previous” and
“Next” buttons in the lower part of the window as shown in Figure 9.
NeoSuck RT is mainly for suck pressure analysis, which is shown as the last graph in the
first column. NeoSuck RT can automatically recognize the peak in suck pressure, which is marked
by small diagonal red lines in suck pressure plot.
2.2.2 Fourier transform of suck pressure
NeoSuck RT can be used to calculate the FFT of suck pressure. In order to get the
frequency property of suck pressure, the user can click ToolsÆSuck FFT to call up the “FFTSuck Pressure” window. In this analysis window, the user will find the time domain and
12
NeoSuck RT
CNL U of Kansas
frequency domain plot of the currently displayed block in the main NeoSuck RT window (Figure
10). The first and second graphs are both for current block, while the third graph, named as
composite FFT, shows the mean FFT for all the blocks that have been analyzed by the FFT
subroutine. User could either click “Update FFT Plot/Save FFT” button, or go to
ToolsÆGenerate Composite in this window to periodically update the composite FFT.
Figure 10. Suck pressure FFT analysis
In the setting menu, user could set the filter parameters (cutoff frequencies for Low Pass
filter and High Pass filter) to plot the desired frequency property (Figure 11). In addition, the
graph setting (Figure 12) enables the user to define the minimum and maximum values for both xaxis and y-axis for each of the three graphs shown in this window.
13
NeoSuck RT
CNL U of Kansas
Figure 11. Filter setting in FFT analysis
Figure 12. Graph setting in FFT analysis
14
NeoSuck RT
CNL U of Kansas
2.2.3 Other analysis tools
There are some other analysis tools embedded in NeoSuck RT to either display graphs or
export *.txt files which could be used for extended analyses using other commercial software like
Minitab™, LabVIEW™, MATLAB™, MS Excel™, etc.
1. ToolsÆBad Block List (Figure 13) enables the user to delete bad blocks from the
entire data set, and thus generate clean analysis data for both exported data and
Fourier transform analysis.
Figure 13. Bad Block List
2. ToolsÆCreate ASCII Blocks (Figure 14) performs the function of exporting
recorded *.dat file to .txt file block by block. The *.dat is a binary file which can be
read by Visual Basic. The purpose of transforming data into *.txt file is to make the
recorded data readable by 3rd party commercial graphics and statistical software.
Figure 14. Create ASCII blocks for .dat file
3. The “Generate Histogram Files” and “Generate Amp-Period ASCII Files” will
generate *.txt files for future analysis.
15
NeoSuck RT
2.3
CNL U of Kansas
Other setups
Some other setups in Setting of the NeoSuck RT menu bar enable the user to set and
modify analysis criteria for data acquisition, graphs, histogram plots, and FFT analysis.
Figure 15 is the DAQ setting dialog where the user can adjust the minimum and maximum
acquisition limits, as well as calibration parameters. Once the DAQ parameters are set, sampled
data files will assume the format established in the DAQ set-up. Thus, these setup parameters
should not be modified unless the specific intent is to change file structure and sampling
rates.
Figure 15. DAQ board settings
The Graph and Histogram settings (Figure 16) include the dialog windows for lower and
upper limit selection according to user’s preference.
16
NeoSuck RT
CNL U of Kansas
Figure 16. Graph and Histogram setting dialogue
The “Suck Pr Analysis” setting (Figure 17) defines parameters for peak selection, and suck
pressure threshold value for recording, etc.
Figure 17. Suck Pr Analysis setting
17
NeoSuck RT
CNL U of Kansas
3 References
Estep, M., Barlow, S.M., Stumm, S. Fees, M., Finan, D., Seibel, L. Poore, M., Cannon, S. (2005).
Non-nutritive Suck Burst Parametrics in Preterm Infants, Society for Pediatric Research,
2141.
Seibel, L., Barlow, S.M., Vantipalli, R., Finan, D., Urish, M., Carlson, J. (2005). Spectral
Dynamics of Non-Nutritive Suck in Preterm Infants, Society for Pediatric Research, 2139.
Stumm, S., Barlow, S.M., Vantipalli, R. Finan, D., Estep, M., Seibel, L., Urish, M., & Fees, M.
(2005). Amplitude/Burst Dynamics of the Non-Nutritive Suck in Preterm Infants. Society
for Pediatric Research, 2632.
Zimmerman, E., Barlow, S.M., Seibel, L., Poore, M., Stumm, S., Estep, M., Chu, S., Fees, M.,
Urish, M., Gagnon, K., Cannon, S., Carlson, J. (2006). Pacifier stiffness alters the
dynamics of the suck central pattern generator. Society Pediatric Research, 5571:393.
Stumm S, Barlow S, Vantipalli R, Finan D, Estep M, Seibel L, Urish M, Fees M, Poore M, Chu S,
Zimmerman E, Cannon S, Gagnon K, Carlson J. (2006) Amplitude-Burst dynamics of the
non-nutritive suck in preterm infants. J Clinical Nursing, (under revision).
Estep M, Barlow SM, Stumm S, Fees M, Finan D, Seibel L, Poore M, Cannon S. (2006). Nonnutritive Suck Burst Parametrics in Preterm Infants with Respiratory Distress Syndrome.
Biol Neonate, submitted.
18