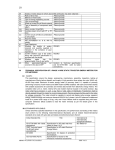
1
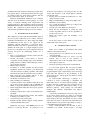
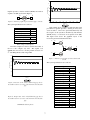
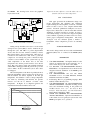
Flownet Nuclear Architecture, Implementation and Verification & Validation
WA Landman, E van Heerden, JP van Ravenswaay and GP Greyvenstein
Faculty of Engineering, Potchefstroom University for CHE
Private Bag X6001, Potchefstroom, 2520, South Africa
Tel: 27 (18) 2994022, Fax: 27 (18) 2991320
e-mail: [email protected]
Abstract – Flownet is a general network analysis code used by PBMR (Pty) Ltd for the thermalfluid design and analysis of the PBMR plant. It is based on an implicit pressure correction
method (IPCM) that solves the continuity, momentum and energy equations (including rotating
element dynamics) in large arbitrary structured networks for both steady-state and dynamic
analysis. In order to facilitate maximum code re-use and maintainability it was re-developed in
an object-oriented paradigm, using C++, within a strict quality system. This paper presents the
architectural design, model development, implementation, and verification and validation
philosophies used during the development of Flownet. Finally it comments on results obtained
with this software package.
development approach. In order to facilitate maximum
I. INTRODUCTION
code re-use and maintainability, Flownet was re-developed
in an object-oriented paradigm, using C++, within a strict
The interaction of various thermal-fluid components in
quality assurance system. Using classes and grouping
an arbitrary structured network is a complex problem to
classes together in packages, each with well-defined
analyse. Yet accurate modelling of these situations is
interfaces, enhanced encapsulation and improved
important and imperative in the design of a new power
maintainability. A persistence mechanism that maps the
plant, where the interactions cannot be optimised based on
object-oriented design onto a relational database was
passed experience or empirical data. To this end a
devised. Using a relational database has the benefit of
software package has been developed that can be used in
open-endedness and having a scientific view of the data.
the analysis of this type of network.
Model development, implementation, and verification
The solution algorithms in the previous procedural
and validation are based on three different processes that
version of Flownet were developed over an extended
have well defined interfaces to ensure a streamline system.
period of time and evolved into general network analysis
Technical teams that specialize either in model
software that can solve arbitrary structured networks for
development, implementation or verification and validation
both steady-state and transient cases. Shaft dynamics are
are responsible for the execution of these processes.
also solved as part of the overall solution to the energy,
In Flownet the approach used to design the classes and
mass and momentum equations 1.
the interaction among them, resulted in a code that was
Flownet’s capabilities include the simulation of
marginally slower than the procedural code that it was
networks such as the PBMR, a high-temperature gasbased on. The advantage of having an object-oriented code
cooled reactor (HTGR) plant based on a three-shaft
is that profiling can be done effectively. These profiling
Brayton cycle, currently under development by the South
results have the advantage that CPU intensive code can be
African utility Eskom. These dynamic simulations of the
easily identified and optimised. Using special techniques
complete power conversion unit (PCU) are fully integrated
to optimise the code, speed improvements of up to 40%
with core neutronics, turbo-machine power matching and
were achieved. These speed improvements, to an already
controller algorithms2. In order for a modelling tool to be
fast solving code enables Flownet to perform real time
used in the design of a nuclear power plant where safety is
dynamic analysis of large integrated thermal-fluid
of the essence, the code had to be rewritten within the
networks such as the PBMR.
framework of a stringent quality control system.
When working on a software package that is being
Redeveloping the software also provided an excellent
developed and used by a small but very active user base, it
opportunity to implement an object-oriented design and
is imperative that the configuration management is
1
streamlined and well structured. Practical procedures have
been put into place to ensure that anomalies that are logged
are addressed and new development continues with the
least possible adverse effect on one another.
Numerous thermal-fluid simulations were conducted
with the aid of the Flownet software package on a wide
variety of networks including both compressible and
incompressible flow. These included comparisons with the
PBMM (Pebble Bed Micro Model) that was designed using
Flownet. The comparisons between Flownet and both
analytical and experimental results proved to be excellent.
developed in procedural C code using text files for data
storage. The objectives of the redevelopment of Flownet
were the following:
• Develop the code within the framework of a strict
quality assurance system.
• Improve maintainability of a large and complex code.
• Maximize code re-usability.
• Use of relational database technology to improve the
data persistance mechanism.
• Give the code a real Windows look and feel.
• Based the new development on exactly the same
solution algorithm and have all the capabilities it
predecessor possessed.
• Retain the solution speed and flexibility of its
predecessor.
II. BACKGROUND TO FLOWNET
The complexity associated with the thermal-fluid design of
closed-loop cycles requires the use of a variety of analysis
techniques and simulation tools. These range from simple
one-dimensional models that do not capture all the
significant physical phenomena to large-scale threedimensional CFD codes that, for practical reasons, cannot
simulate the entire plant as a single integrated system.
Flownet is a code that provide a good compromise between
accuracy and speed. Its distinquising features are as
follows:
• Easy to use graphical user interface, where networks
can be created and edited.
• Flownet can handle a wide variety of network
component models including pipes, turbo-machines,
pumps and fans, a number of heat exchangers, orifices,
reactor models and valves.
• PID and other controllers.
• In addition to its fluid dynamics and heat transfer
capabilities, Flownet also features a one-dimensional
solid heat transfer modelling capability with which
heat transfer through solid structures can be modelled.
• Both steady-state and dynamic analysis of large
arbitrary structured thermal-fluid system.
• Gas mixture concentration solver.
• Turbo-machine power matching.
• A general external control interface which allows the
use of other software packages such as Simulink and
Matlab to design and simulate advanced plant control.
• Direct design functionality that can be used to perform
design analysis.
• Sensitivity analysis that is based on the Monte Carlo
algorithm.
• The code has been extensively verified and validated
in industry for a number of years.
• Very fast steady-state solution times.
• Perform real-time dynamic analysis of large arbitrary
structured thermal fluid system.3
In the next section a brief outline of some of the
architectural issues will be given.
III. ARCHITECTURAL DESIGN
There were a number of preconditions that existed
when the redevelopment started:
• The program was to be written in C++ in an objectoriented paradigm.
• A relational database had to be used to store the
network data as well as the repository of
characteristics such as fan and pump curves, turbine
and compressor maps, etc.
• The target operating system chosen was Windows®.
It soon became apparent that one large monolithic
executable was not going to be very practical. One large
program implied longer compile-debug cycles and longer
built times that impacted on the productivity of the
development group. The program was therefore divided
up into packages.
In object-oriented terminology a package is a
collection of classes collaborating to implement the
functionality that is associated with the package. Each
package represents a functional area in Flownet and is
mapped to a dynamically linked library (DLL) on the
Windows platform.
Each package has well-defined
interfaces that enhances encapsulation and improve
maintainability.
A persistence mechanism was devised to map classes
in the object-oriented design onto tables in a relational
database. A design pattern of mapping each class to a table
in the database, and every data member of a class to a field
in the table was adopted. Each class that needs interaction
with the database was given the responsibility of doing so
by implementing the appropriate methods.
Using a relational database for this kind of data is
somewhat of an overkill. It takes longer to save large
During the early stages of the PBMR project it was
decided to re-develop Flownet. Its predecessor was
2
implementation. A validation case is then formulated and a
benchmark is developed. The benchmark can consist of a
simple hand calculation, a numerical solution or
experimental data. In parallel with this, the various
documents required are developed. The next step is to
implement the new model into Flownet.
volumes of data to a relational database than it takes to
save the corresponding data to an ASCII file. However,
the relational technology provides a structured way to
organize data and to filter that data. The availability of
third party tools to view and edit the data gives the added
benefit of open-endedness. These benefits far outweigh the
mentioned drawback.
IV.B Model Implementation
IV. NEW MODEL DEVELOPMENT
The first step of the model implementation phase is to
investigate the impact the new model has on the existing
architecture and to update the architectural design
documentation, if needed. Next the detail design and
implementation documentation is generated.
Model development, implementation and verification
and validation form a integrated process, as part of the
quality assurance of Flownet, to ensure that the
development and implementation of new models into
Flownet are controlled and streamlined.
Flownet Model Inplementation
IV.A Model development
Implement into
Flownet
Updated Arch. Design
Documentation
Flownet Model Development
Need / Requirement
Definition (CR)
Project Planning
Develop Design
and Implementation
documentation
User Requirement
Spec
Develop and
implement Unit Test
Unit Test
Code
Project Plan
Theory Deriviation
Theory Manual
Design Review
(Verification)
D&I Documentation
User Manual
Implementation into
Flownet
Flownet
Source Code
Design Review of
implemented code
(Verifcation)
Design Review
Minutes
Training Material
Flownet Solver
Implementation Detail
Comparison with
benchmark
User Manual
Training Material
Validation case definition
(Incuding Boundaries
and Limitations)
Validation Manual
Theory Implementation
into benchmark code OR
experimental test set-up
planning
Benchmark
Program and
Data
Model / Benchmark
refinement
Acceptable?
Release for
Compliance Testing
(Validation)
Figure 2: Model implementation flow chart.
Implement into
Flownet
To ensure code integrity, unit tests for the new model
are already defined and implemented at this point. The next
step is the physical implementation of the new model into
the Flownet source code. Implemented code is submitted to
stringent design reviews to ensure that the derived models
have been correctly translated into computer code. At this
point a preliminary comparison with the stipulated
benchmark is performed. The outcome of this step could
Figure 1: Model development flow chart.
Model development consists of the process of refining
a user requirement into a theoretical model to be
implemented into Flownet.
During this process theory is derived for a new model
after which it is peer reviewed. The next step is to rewrite
the theory into the Flownet solver format for
3
result in refinements to the model or the benchmark.
Successful preliminary testing leads to the release of
Flownet for compliance testing (validation).
Increasing the performance of any computer program
can be broadly classified into two categories, namely
algorithm improvements and code tweaking.
Algorithm improvements should always be tried first
when code optimisation is considered. The reason for this
is that if one has an algorithm that has a complexity of
O(n3), and there is another algorithm available that
essentially solves the same problem but is of complexity
O(n2), then no amount of code tweaking will provide
comparable benefits to replacing the algorithm for large
enough problems (i.e. large enough n). Thus the first step
is to make sure that all the algorithms are as efficient as
possible.
When it comes to code performance enhancement
there are two schools of thought. The first is that one
designs with efficiency in mind from the outset. The
second is that one firstly designs for clarity and
maintainability and then improves performance of the
code. The code that should be considered for performance
improvements should be identified by actual measurement
in a representative size problem.
Donald Knuth4 observed that premature optimisation
is the root of all evil. Furthermore, it is generally accepted
that programmers have a very bad intuition for where
bottlenecks lurk within their code, thus frequently spending
hours optimising code that very rarely gets executed.
Heeding that warning, the approach that was preferred
in the redesign process was to firstly design for
maintainability and clarity. Code speed improvements
were only attempted on code where performance profiling
pointed to the existence of a bottleneck(s).
The first round of profiling pointed to the matrix
solver as the largest consumer of CPU cycles. The
calculation of pressure correction terms in the solution
algorithm requires the improved accuracy that is associated
with matrix methods.
Since a state of the art matrix solver for sparse
matrices is already used, and the fact that we could not use
an iterative approach for solving the pressure correction
equations, it was concluded that the code needed to be
optimised rather than changing the matrix solution
algorithm.
Guided by the profiling tool and zooming in on the
detail of the matrix algorithm, it was found that
considerable CPU time was spent on the setting up of the
connectivity of the matrix. This connectivity did not
change from one pressure correction calculation to the
next, but the same matrix code was used for solving the
temperatures in the energy conservation equations. So the
storage of the connectivity was therefore encapsulated into
a matrix class and an instance of the matrix class created
for each set of equations that needs to be solved. This
allowed for the storage of the connectivity data rather than
recalculation of it at each matrix solution.
IV.C Verification and Validation
Verification is performed during the model
development and implementation phases through the
design and peer review processes. The final step before
releasing Flownet to the client is to validate the newly
implemented model against the benchmark specified in the
model development phase.
Flownet Validation
Validation
Test against
Benchmarks - compile
Compliance test report
Anomally Report
Release Compliance test
report
Acceptable?
Update User
Documentation
Release Notes / User
Manual / Help System
Training Material
Release to Client
Installation V&V Plan
Installation Instructions
Delivery Note
Figure 3: Model validation and verification flow chart.
If the results obtained with Flownet are within the
specified tolerances from the benchmarks, the code is
deemed acceptable, all relevant documentation is updated
and Flownet is released to the client.
V. CODE OPTIMISATION
One of the intended end uses of the newly developed
code is as part of a simulator for training and engineering
analysis purposes.
It is imperative that real-time (or faster) simulations
can be achieved for training simulators. On currently
available “general purpose” hardware, simulation times are
marginally slower than real-time for a realistically sized
problem. For this reason an effort was made to increase
the performance of the program.
4
This approach led to a performance gain of 9.3% in a
typical large network.
As is the case with most
engineering solutions a compromise had to be made.
Using a technique of caching results, so that it can be used
again, uses more memory in order to gain some speed
advantage.
A second opportunity for performance
enhancement was identified as the calculation process of
Mach numbers at the nodes. Again the bottleneck was
identified by the use of a performance profiler.
In the original code, the Mach-numbers were
calculated at each node and after each iteration. There are
places in the solution algorithm where these Mach numbers
were used, and they were also printed as part of the results.
Here the solution was obvious. Instead of calculating the
Mach number upfront, the Mach number was invalidated
after each iteration and then re-calculated as needed. For
the majority of the nodes this resulted in the Mach number
being calculated only once during the printing of the
results.
This is a technique known as lazy-evaluation, and in
this case led to performance improvements of 8.9% for a
typical large network. Again there was a compromise of a
slightly more complex solution but with the benefit of
performance gains.
There were various additional situations, all identified
by actual performance profiling that led to various
performance gains. Almost without exception some
clarity, simplicity and code maintainability were lost for
the sake of performance. The benefit, however, is that the
changes have been introduced where it resulted in
undisputed benefits.
In Table 1 the results from a typical network is shown
before and after the performance enhancements were
made.
With
graphical
output
Without
graphical
output
improvement of 6% when the output is given and 13%
when the graphs are not plotted.
It should be pointed out that the graphs for the new
code is much more feature rich than the procedural code
that gave rise to a big performance concern. The
optimisation of the graphing functionality was not
discussed in the section on performance enhancements
since it relates to user interface issues and as such is
platform specific, but there was significant performance
gains introduced in the graphing functionality too.
At this point a realistic question is whether real-time
simulation have been achieved yet? The answer: “It
depends”. In this case it depends on the size of the
problem and the price of the hardware, but for a
representative sized problem with higher end generally
available hardware, real-time simulation can be achieved.
There is still scope for more performance
enhancements. Two options that come to mind are using
iterative matrix algorithms for the temperature solver and
parallelization of the code. These will be addressed in the
future as the need arises.
VI. CONFIGURATION MANAGEMENT
VI.A Code configuration management (SourceSafe)
The Flownet code configuration management is done
with the assistance of Visual SourceSafe®, a Microsoft®
product. For developers at different locations a web based
third party software product is used that allows these users
to access the Flownet source code on the SourceSafe
server. The software used has the following capabilities:
•
Provides the users with easy to use graphical user
interfaces for both the server and client applications.
It keeps advanced history tracing of all activities
related to Flownet source code under configuration
management.
It allows multiple user accounts with adjustable levels
of access rights assigned by the system administrator.
Procedural
program
Before
optimisation
After
optimisation
•
16.843
26.052
15.820
•
16.527
19.033
14.286
The Flownet release cycle is divided into major and
minor releases. Minor releases are usually associated with
bug fixes while major releases, on the other hand, are
associated with new model development. The duration
between major releases is usually in the order of four to six
months.
In order to ensure that new developments that are
currently underway do not introduce unwanted anomalies
into the released code the following system is used:
Directly after a major release the source code on the
SourceSafe server are branched into two different sets of
identical code. The one is labelled Production Code and
the other one is labelled Development Code.
The
Table 1: Optimisation comparison between procedural and
object oriented code.
From the table one can see that there has been a 25%
improvement in simulation times where the solver is
invoked without output, and a 40% improvement where
graph plotting is involved. Furthermore the difference in
performance between an equivalent procedural program is
also given.
After optimisation there is a speed
5
Complete
submission
Submit
Reject
Approval
Unapproved
Assigned person
transmission
production code is associated with bug fixes and the
development code is associated with the new
functionalities that will be introduced during the
development cycle leading up to the next major release.
During minor releases, after an anomaly was reported and
fixed on both the production and development code, the
production code is taken from the server, built and released
for testing. If the tests are successful it is released to the
client. By the end of a major release life cycle the
production code and development code are merged with
one another, built and released for testing. If these tests are
successful a major release is done to the client. The
development code on the server is then branched and a new
development/release cycle starts.
Prelim
Investigation
Received
Investigation and
Classification
Assigned
Classification
Software
Operator
Duplicate
Correcting
fault/error
Document
Operator
fault/error
Reference
Fault/Error
Corrected
Included in
Manual
Close
Internal
Review
Unsatisfactory
resolution
Released
Review
VI.B Anomaly Reporting (AR) and Change Requesting(CR)
Unsatisfactory
In order to streamline these supporting system for a
code with an international user base, a web based reporting
system was developed. This system has the advantage that
users can track either AR’s or CR’s as they move through
the system. The figures below present the flow path for
these processes.
Complete
submission
Generate
Anomaly report
data pack
Figure 5: Change requesting flow chart.
Submit
Change Request
VII. RESULTS
Approval
for
Investigation
Reject
Numerous thermal hydraulic simulations were
conducted with the aid of the Flownet software package on
a wide variety of networks including both compressible
and incompressible flow. These included comparisons
with the PBMM that was designed using Flownet.
The validation cases are presented as follows: Firstly a
short description of the problem that was modelled is
given. Secondly the results are compared to results
obtained with other codes or to experimental data. Finally
a short discussion of the results is given. In all the cases
the Flownet results are presented by the markers only and
the results of the validation case by the solid line.
Assigned person
transmission
Received
Investigation
and Analysis
of Change
Preliminary
Investigation
Classification and
Estimated Effort
Major
Change
Minor
Change
Revision
Complete
Requirement
specification
Implementation
Requirements
fixed
Internal
Review
Unsatisfactory
implementation
Released
Unsatisfactory
Review
Change
Complete
VII.A Pipe with pressure waves
Generate Change
Request report
data pack
This example shows a compressible pipe element with
an inlet pressure of 300 kPa and an outlet pressure of 100
kPa. During a transient event a valve at node 2 (outlet) is
closed instantaneously. The comparison between the
pressures and temperatures calculated with Flownet, an
Figure 4: Anomaly reporting flow chart.
6
70
Temperature [°C]
60
implicit pressure correction method (IPCM) and with an
explicit code (EX) are shown in Figure 7.
1
P
P
1
2
50
40
30
20
10
Figure 6: Flownet graphical presentation of pipe element.
0.0
0.5
1.0
1.5
2.0
The system specifications are as follows:
Pipe 1
Number of Increments
Length [m]
Diameter [mm]
Node 1
Pressure [kPa]
Node 2
Pressure [kPa]
IPCM
3.0
3.5
4.0
4.5
EX
This example shows a number of tanks that have been
pressurized to specific pressures. Starting at steady state,
valves at tanks 1, 3 and 4 are opened instantaneously and
the response of the system are modelled by both Flownet
(IPCM) and by a code based on an explicit solver (EX).
The figure below shows the graphical layout of the
network as presented in the Flownet GUI.
20
100
100
300
T
100
P
1
1
RS
Table 2: Pipe system inputs.
T
From the comparison it can be seen that the results of
the two codes compare very well. The explicit code
(XNET) that was used to solve the problem is based on a
4th order Runge Kutta solution algorithm.
3
P
2
RS
T
P
P
4
RS
2
3
RS
400
Figure 9: Flownet presentation of a blow down tank
system.
350
300
Pressure [kPa]
2.5
Time [s]
The system specifications are as follows:
250
Pipe 1
Number of Increments
Length [m]
Diameter [mm]
Pipe 2
Number of Increments
Length [m]
Diameter [mm]
Pipe 3
Number of Increments
Length [m]
Diameter [mm]
Node 1
Volume [m2]
Pressure [kPa]
Temperature [˚C]
Node 2
Volume [m2]
Pressure [kPa]
Temperature [˚C]
Node 3
Volume [m2]
200
150
100
0.0
0.5
1.0
1.5
2.0
2.5
3.0
3.5
4.0
4.5
Time [s]
IPCM
EX
Figure 7: Pressure at the end of a 100 m long pipe due to
the sudden closure of a valve at the downstream end of thr
pipe.
Figure 8: Temperature at the end of 100m long pipe due to
the sudden closure of a valve at the downstream end of the
pipe.
VII.B Tanks blowing down
7
20
100
100
20
100
100
20
100
100
10
300
100
10
150
15
10
Pressure [kPa]
Temperature [˚C]
Node 4
Volume [m2]
Pressure [kPa]
250
50
390
370
Temperature (°C)
10
100
Table 3:Blow down tank system inputs.
The graphs below shows the pressure and temperature
response of the system as calculated by both Flownet and
the explicit solver.
350
330
310
290
270
250
0
300
0.05
0.1
0.15
0.2
0.25
0.3
0.35
0.4
0.45
Time (s)
LW, Hot outlet
Pressure [kPa]
250
IPCM, Hot outlet
LW, Cold outlet
IPCM, Cold outlet
Figure 12: Recuperator exit temperature due to a
temperature step at the inlet of the hot stream for a counter
flow configuration.
200
Figure 12 shows the outlet temperatures with time of
the hot and cold streams for a counter flow arrangement.
The results of the IPCM are compared to that of the two-
150
100
0.0
1.0
2.0
3.0
4.0
5.0
Time [s]
IPCM N1
EX N1
IPCM N2
EX N2
410
IPCM N3
EX N3
IPCM N4
EX N4
390
Figure 10: Pressure transient in a blow down tank system.
Temperature (°C)
370
100
80
350
330
310
Temperature [°C]
290
270
60
250
0
40
0.05
0.1
0.15
0.2
0.25
0.3
0.35
0.4
0.45
Time (s)
LW, Hot outlet
20
IPCM, Hot outlet
LW, Cold outlet
IPCM, Cold outlet
step Lax-Wendroff (LW) method.
0
0.0
1.0
2.0
3.0
4.0
Figure 13: Recuperator exit temperature due to a
temperature step at the inlet of the hot stream for a
parallel flow configuration.
5.0
Time [s]
IPCM N1
EX N1
IPCM N2
EX N2
IPCM N3
EX N3
IPCM N4
EX N4
Figure 11: Temperature transient in a blow down tank
system.
The LW method shows a fluctuation in the hot outlet
temperature shortly after the beginning of the transient.
After about 0.03 s the curve becomes smooth with a very
good agreement between the IPCM and the LW method.
Figure 13 shows the outlet temperatures with time of
the hot and cold streams for a parallel flow arrangement.
Again the agreement between the IPCM and the LW
method is very good apart from the temperature fluctuation
of the LW method at the start of the transient5.
VII.C Temperature transient in a recuperator
In this example a recuperator with a total heat transfer
area of 300 m2 and a thermal capacitance of 9 kJ/K is
considered. The hydraulic diameter and cross flow area of
both conduits are 0.5 m and 0.1963 m2 respectively. Both
the hot and cold fluids are helium at an inlet pressure of
700 kPa and an outlet pressure of 670 kPa. Initially the
total inlet temperature of both streams is 300 ˚C. Starting at
steady-state conditions, the total inlet temperature of the
hot stream is stepped to 500 ˚C at time t = 0 s.5
VII.D Pebble Bed Micro Model start-up (PBMM)
This example presents the comparison of Flownet with
the pressure over the start-up blower during the start-up of
8
Figure 15: Pressure difference across the inline valve as a
function of the heater outlet temperature.
the PBMM. The drawing below shows the graphical
layout of the model.
VIII. CONCLUSION
Power Compressor
Electrical
Heater
High Pressure
Turbine
Low Pressure
Turbine
7
This paper presented the architectural design, new
model development and validation and verification
required during the redevelopment of Flownet, a thermal
fluid tool that is used to solve complex thermal fluid
systems. Advanced optimisation techniques was used to
improve the solution time to such an extent that real-time
simulation of realistic networks are possible. In order to
successfully manage a code based in a large development
team, a number of practical procedures needs to be used to
ensure proper configuration management. The newly
developed code was validated against a number of
benchmarks. These comparisons proved to be extremely
good.
9
Load rejection cooler
8
6
Power Turbine
2
4
High Pressure
Compressor
Low Pressure
Compressor
3
10
1
Inline
valve
Start up
Blower
Intercooler
5
Recuperator
Gas Cycle
By-Pass
Valve
Precooler
Figure 14: Pebble Bed Micro model graphical layout.
ACKNOWLEDGMENTS
During start-up the inline valve (IV) is closed and the
start-up blower system (SBS) is used to circulate the gas
through the cycle. The SBS is a positive displacement
device, thus the flow-rate remains essentially constant.
Heat is then added to the gas in the heater. This energy is
converted in the turbines into shaft work to power the
compressors. For start-up, the power to the heater is kept
constant at about 180kW. As the system heats up, the
outlet temperature of the heater rises as the inlet
temperature rises and the pressure increase across the IV
drops. The cycle spirals towards self sustained circulation
and the SBS is disengaged when the pressure drop over the
valve is 0 kPa. At this condition the cycle is said to have
bootstrapped.
The exit temperature of the heater is probably the most
important determinant of the bootstrap point as the energy
that the turbines can deliver, depends on the inlet gas
temperature. An estimation of the bootstrap temperature
was made by calculating with Flownet the pressure
increase over the IV as function of heater outlet
temperature. In Figure 14 a comparison between the
calculated and measured variables can be seen.6
This work is being carried out in association with M-Tech
Industrial (PTY) Ltd. on contract for the PBMR (PTY)
Ltd.
REFERENCES
1.
2.
3.
4.
5.
40
Pressure increase over IV [kPa]
35
30
6.
25
20
15
10
5
0
50
150
250
350
450
550
650
HPT inlet temperature [°C]
Measured
Predicted
9
G.P. GREYVENSTEIN, “An implicit method for the
analysis of transient flows in pipe networks”, Int. J.
Numer. Meth. Engrng., 53, 1127 – 1143 (2002).
C.G. DU TIOT, G.P. GREYVENSTEIN AND P.G.
ROUSSEAU, “A comprehensive reactor model for the
integrated network simulation of the PBMR power
plant”, To be published.
G.P. GREYVENSTEIN and C.G. DU TOIT,
FLOWNET Version 5.4 USER MANUAL, M-Tech
Industrial, Potchefstroom (2001).
B Stroustup, The C++ programming language, Third
Edition, Addison-Westley, 1997
G.P. GREYVENSTEIN, J.P. VAN RAVENSWAAY
AND P.G. ROUSSEAU, “Dynamic modeling of heat
mass and momentum transfer in the pebble bed
modular reactor”, Proc of 1st Int Conf on Heat
Transfer, Fluid Mechanics and Thermodynamics,
Kruger Park, South Africa (2002).
W.M.K VAN NIEKERK, G.P. GREYVENSTEIN
AND P.G. ROUSSEAU, “Operation and simulation of
a three shaft, closed loop, Breyton cycle model of the
PBMR power plant”, To be published.