1
HP A5820X & A5800 Switch Series
Network Management and Monitoring
Configuration Guide
Abstract
This document describes the software features for the HP A Series products and guides you through the
software configuration procedures. These configuration guides also provide configuration examples to
help you apply software features to different network scenarios.
This documentation is intended for network planners, field technical support and servicing engineers,
and network administrators working with the HP A Series products.
Part number: 5998-1636
Software version: Release 1211
Document version: 5W100-20110430
Legal and notice information
© Copyright 2011 Hewlett-Packard Development Company, L.P.
No part of this documentation may be reproduced or transmitted in any form or by any means without
prior written consent of Hewlett-Packard Development Company, L.P.
The information contained herein is subject to change without notice.
HEWLETT-PACKARD COMPANY MAKES NO WARRANTY OF ANY KIND WITH REGARD TO THIS
MATERIAL, INCLUDING, BUT NOT LIMITED TO, THE IMPLIED WARRANTIES OF MERCHANTABILITY
AND FITNESS FOR A PARTICULAR PURPOSE. Hewlett-Packard shall not be liable for errors contained
herein or for incidental or consequential damages in connection with the furnishing, performance, or
use of this material.
The only warranties for HP products and services are set forth in the express warranty statements
accompanying such products and services. Nothing herein should be construed as constituting an
additional warranty. HP shall not be liable for technical or editorial errors or omissions contained
herein.
Contents
System maintenance and debugging ························································································································· 1 Configuring ping ······························································································································································· 1 Configuring ping example ······································································································································ 1 Tracert ················································································································································································ 3 Configuring tracert ··················································································································································· 4 System debugging ···························································································································································· 5 Configuring system debugging ······························································································································· 6 Configuring ping and tracert example ··························································································································· 7 Configuring NQA ························································································································································ 9 NQA benefits···························································································································································· 9 Basic NQA concepts ············································································································································ 11 NQA probe operation procedure ······················································································································· 12 NQA configuration task list ·········································································································································· 12 Configuring the NQA server ········································································································································ 13 Enabling the NQA client ··············································································································································· 14 Creating an NQA test group ········································································································································ 14 Configuring an NQA test group ·································································································································· 14 Configuring ICMP echo tests ································································································································ 14 Configuring DHCP tests ········································································································································ 15 Configuring DNS tests ·········································································································································· 16 Configuring FTP tests ············································································································································· 17 Configuring HTTP tests ·········································································································································· 18 Configuring UDP jitter tests ·································································································································· 19 Configuring SNMP tests ······································································································································· 21 Configuring TCP tests ············································································································································ 22 Configuring UDP echo tests·································································································································· 23 Configuring voice tests ········································································································································· 24 Configuring DLSw tests ········································································································································· 26 Configuring the collaboration function ························································································································ 27 Configuring threshold monitoring ································································································································ 29 Configuring the NQA statistics collection function ····································································································· 30 Configuring the history records saving function ········································································································· 31 Configuring optional parameters for an NQA test group ························································································· 32 Scheduling an NQA test group ···································································································································· 33 Displaying and maintaining NQA ······························································································································· 34 Configuring NQA examples ········································································································································· 34 Configuring ICMP echo test example ················································································································· 34 Configuring DHCP test example ·························································································································· 36 Configuring DNS test example ···························································································································· 37 Configuring FTP test example ······························································································································ 38 iii
Configuring HTTP test example ···························································································································· 39 Configuring UDP jitter test example ···················································································································· 41 Configuring SNMP test example ························································································································· 44 Configuring TCP test example······························································································································ 45 Configuring UDP echo test example ··················································································································· 46 Configuring voice test example ··························································································································· 48 Configuring DLSw test example ··························································································································· 51 Configuring NQA collaboration example ·········································································································· 52 Configuring NTP ························································································································································ 55 NTP applications ··················································································································································· 55 NTP advantages ···················································································································································· 55 How NTP works ····················································································································································· 56 NTP message format ············································································································································· 57 NTP operation modes ··········································································································································· 58 Multiple instances of NTP ····································································································································· 60 NTP configuration task list············································································································································· 61 Configuring the operation modes of NTP ··················································································································· 61 Configuring NTP client/server mode ·················································································································· 61 Configuring the NTP symmetric peers mode ······································································································ 62 Configuring NTP broadcast mode ······················································································································ 63 Configuring NTP multicast mode ························································································································· 64 Configuring optional parameters of NTP ···················································································································· 64 Specifying the source interface for NTP messages ···························································································· 64 Disabling an interface from receiving NTP messages ······················································································· 65 Configuring the maximum number of dynamic sessions allowed ···································································· 65 Configuring access-control rights ································································································································· 66 Configuration prerequisites ·································································································································· 66 Configuration procedure ······································································································································ 66 Configuring NTP authentication ··································································································································· 66 Configuration prerequisites ·································································································································· 67 Configuration procedure ······································································································································ 67 Displaying and maintaining NTP ································································································································· 68 Configuring NTP examples ··········································································································································· 69 Configuring NTP client/server mode example ·································································································· 69 Configuring the NTP symmetric mode example································································································· 70 Configuring NTP broadcast mode example ······································································································· 72 Configuring NTP multicast mode example ········································································································· 73 Configuring NTP client/server mode with authentication example ································································· 76 Configuring NTP broadcast mode with authentication example ····································································· 77 Configuring MPLS VPN time synchronization in client/server mode example··············································· 79 Configuring MPLS VPN time synchronization in symmetric peers mode example ········································ 81 Configuring IPC ·························································································································································· 83 Enabling IPC performance statistics ····························································································································· 84 Displaying and maintaining IPC··································································································································· 85 iv
Configuring PoE ························································································································································· 86 Protocol specification ············································································································································ 87 PoE configuration task list ············································································································································· 87 Enabling PoE ·································································································································································· 88 Enabling PoE for a PoE interface ························································································································· 88 Detecting PDs·································································································································································· 89 Enabling the PSE to detect nonstandard PDs ····································································································· 89 Configuring a PD disconnection detection mode ······························································································ 89 Configuring the PoE power ··········································································································································· 90 Configuring the maximum PoE interface power ································································································ 90 Configuring PoE power management ·························································································································· 90 Configuring PoE interface power management ································································································· 90 Configuring the PoE monitoring function ····················································································································· 91 Configuring PSE power monitoring ····················································································································· 91 Monitoring PD························································································································································ 91 Configuring PoE interface through PoE profile ··········································································································· 92 Configuring PoE profile ········································································································································ 92 Applying PoE profile ············································································································································· 92 Upgrading PSE processing software in service ·········································································································· 93 Displaying and maintaining PoE ·································································································································· 94 Configuring PoE example ············································································································································· 94 Troubleshooting PoE ······················································································································································ 95 Configuring SNMP····················································································································································· 97 SNMP mechanism ················································································································································· 97 SNMP protocol version ········································································································································· 97 MIB overview ························································································································································· 98 Configuring SNMP ························································································································································ 98 Configuring network management-specific interface index ···················································································· 101 Switching the format of an NM-specific ifindex ······························································································· 101 Configuring SNMP logging ········································································································································ 102 Enabling SNMP logging ····································································································································· 102 Configuring SNMP trap ·············································································································································· 103 Enabling the trap function ·································································································································· 103 Configuring trap parameters······························································································································ 104 Displaying and maintaining SNMP ··························································································································· 105 Configuring SNMPv1/SNMPv2c example ··············································································································· 106 Configuring SNMPv3 example ·································································································································· 107 Configuring SNMP logging example ························································································································ 108 Configuring RMON ················································································································································ 110 Working mechanism ··········································································································································· 110 RMON groups ····················································································································································· 111 Configuring the RMON statistics function ················································································································· 112 Configuring the RMON Ethernet statistics function·························································································· 113 Configuring the RMON history statistics function ···························································································· 113 v
Configuring the RMON alarm function ····················································································································· 114 Configuration prerequisites ································································································································ 114 Configuration procedure ···································································································································· 114 Displaying and maintaining RMON ·························································································································· 115 Configuring Ethernet statistics group example ·········································································································· 116 Configuring history group example ··························································································································· 117 Configuring alarm group example ···························································································································· 119 Configuring CWMP ················································································································································ 121 CWMP network framework ······························································································································· 121 CWMP basic functions ················································································································································ 122 Automatic configuration file deployment ·········································································································· 122 CPE system file management ····························································································································· 122 CPE status and performance monitoring··········································································································· 122 CWMP mechanism ······················································································································································ 123 Auto-connection between the ACS and a CPE ································································································ 123 Configuration parameter deployment ··············································································································· 124 RPC methods ························································································································································ 124 Active and standby ACS switchover ················································································································· 125 CWMP configuration tasks ········································································································································· 126 Configuring the DHCP server ····························································································································· 126 Configuring the DNS server ······························································································································· 127 Configuring the ACS server ······························································································································· 127 Configuring CPEs ················································································································································ 127 Enabling CWMP ·························································································································································· 128 Configuring the ACS server ········································································································································ 128 Configuring the ACS URL ··································································································································· 128 Configuring the ACS username and password ······························································································· 128 Configuring CPE attributes ·········································································································································· 129 Configuring the CPE username and password ································································································ 129 Configuring the CWMP connection interface ·································································································· 130 Sending Inform messages ··································································································································· 130 Configuring the maximum number of attempts made to retry a connection ················································· 131 Configuring the close-wait timer of the CPE ····································································································· 131 Displaying and maintaining CWMP ·························································································································· 132 Configuring CWMP example ····································································································································· 132 Network requirements········································································································································· 132 Configuration procedure ···································································································································· 133 Configuring cluster management ··························································································································· 141 Roles in a cluster ·················································································································································· 141 How a cluster works ············································································································································ 142 Cluster configuration task list ······································································································································ 145 Configuring the management device ························································································································· 147 Enabling NDP globally and for specific ports ·································································································· 147 Configuring NDP parameters ···························································································································· 147 vi
Enabling NTDP globally and for specific ports ································································································ 148 Configuring NTDP parameters··························································································································· 148 Manually collecting topology information ········································································································ 149 Enabling the cluster function ······························································································································ 149 Establishing a cluster ··········································································································································· 149 Enabling management VLAN auto-negotiation ································································································ 150 Configuring communication between the management device and the member devices within a cluster151 Configuring cluster management protocol packets ························································································· 151 Cluster member management ···························································································································· 152 Configuring the member devices ······························································································································· 153 Enabling NDP ······················································································································································ 153 Enabling NTDP ···················································································································································· 153 Manually collecting topology information ········································································································ 153 Enabling the cluster function ······························································································································ 153 Deleting a member device from a cluster ········································································································· 153 Configuring access between the management device and its member devices ··················································· 154 Adding a candidate device to a cluster ···················································································································· 155 Configuring advanced cluster functions ···················································································································· 155 Configuring topology management ·················································································································· 155 Configuring interaction for a cluster·················································································································· 156 SNMP configuration synchronization function ································································································· 157 Configuring web user accounts in batches ······································································································ 158 Displaying and maintaining cluster management ···································································································· 158 Configuring cluster management example················································································································ 159 Configuring a sampler ············································································································································ 163 Creating a sampler ······················································································································································ 163 Displaying and maintaining sampler ························································································································· 163 Configuring sampler examples ··································································································································· 164 Configuring port mirroring ····································································································································· 165 Port mirroring types ············································································································································· 165 Implementing port mirroring ······························································································································· 165 Configuring local port mirroring ································································································································ 168 Local port mirroring configuration task list ······································································································· 168 Creating a local mirroring group ······················································································································ 168 Configuring mirroring ports for the local mirroring group·············································································· 169 Configuring mirroring CPUs for the local mirroring group ············································································· 169 Configuring the monitor port for the local mirroring group ············································································ 170 Configuring layer 2 remote port mirroring················································································································ 170 Layer 2 remote port mirroring configuration task list ······················································································ 170 Configuration prerequisites ································································································································ 172 Configuring a remote source mirroring group (on the source device) ·························································· 172 Configuring a remote destination mirroring group (on the destination device) ··········································· 174 Using the remote probe VLAN to enable local mirroring to support multiple destination ports ················· 176 Configuring layer 3 remote port mirroring················································································································ 178 vii
Layer 3 remote port mirroring configuration task list ······················································································ 178 Configuration prerequisites ································································································································ 179 Configuring local mirroring groups ··················································································································· 179 Configuring mirroring ports for a local mirroring group ················································································ 179 Configuring mirroring CPUs for a local mirroring group ················································································ 180 Configuring the monitor port for a local mirroring group ·············································································· 180 Displaying and maintaining port mirroring ··············································································································· 181 Configuring port mirroring examples ························································································································ 181 Configuring local port mirroring example ········································································································ 181 Configuring Layer 2 remote port mirroring example ······················································································ 182 Configuring local port mirroring with multiple monitor ports example ························································· 184 Configuring Layer 3 remote port mirroring example ······················································································ 186 Configuring traffic mirroring ·································································································································· 189 Mirroring traffic to an interface ························································································································· 189 Mirroring traffic to the CPU ································································································································ 190 Applying a QoS policy ······································································································································· 191 Displaying and maintaining traffic mirroring ············································································································ 192 Configuring traffic mirroring examples······················································································································ 192 Mirroring traffic to an interface example ········································································································· 192 Configuration procedure ···································································································································· 192 Configuring NetStream··········································································································································· 194 NetStream basic concepts ·········································································································································· 194 What is a flow ····················································································································································· 194 How NetStream works ········································································································································ 194 NetStream key technologies ······································································································································· 195 Flow aging ··························································································································································· 195 NetStream data export ······································································································································· 196 NetStream export formats ·································································································································· 197 Introduction to NetStream sampling and filtering ····································································································· 198 NetStream sampling ··········································································································································· 198 NetStream filtering ·············································································································································· 198 NetStream configuration task list································································································································ 198 Enabling NetStream····················································································································································· 200 Enabling NetStream on an interface ················································································································· 200 Configuring NetStream filtering and sampling ········································································································· 200 Configuring NetStream filtering························································································································· 200 Configuring NetStream sampling ······················································································································ 202 Configuring NetStream data export ·························································································································· 202 Configuring NetStream traditional data export ······························································································· 202 Configuring NetStream aggregation data export ··························································································· 203 Configuring attributes of NetStream export data ····································································································· 204 Configuring NetStream export format ·············································································································· 204 Configuring refresh rate for NetStream version 9 templates ·········································································· 206 Configuring NetStream flow aging ···························································································································· 207 viii
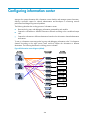
Flow aging approaches······································································································································ 207 Configuring NetStream flow aging ··················································································································· 207 Displaying and maintaining NetStream ···················································································································· 208 Configuring NetStream examples ······························································································································ 208 Configuring NetStream traditional data export example ··············································································· 208 Configuring NetStream aggregation data export example ··········································································· 209 Configuring IPv6 NetStream ·································································································································· 211 IPv6 NetStream basic concepts ·································································································································· 211 What is an IPv6 flow ·········································································································································· 211 How IPv6 NetStream works ······························································································································· 211 IPv6 NetStream key technologies ······························································································································· 212 Flow aging ··························································································································································· 212 IPv6 NetStream data export ······························································································································· 212 IPv6 NetStream export format···························································································································· 213 IPv6 NetStream configuration task list ······················································································································· 213 Enabling NetStream····················································································································································· 214 Enabling NetStream on an interface ················································································································· 214 Configuring IPv6 NetStream data export ·················································································································· 214 Configuring IPv6 NetStream traditional data export······················································································· 214 Configuring IPv6 NetStream aggregation data export ··················································································· 215 Configuring attributes of IPv6 NetStream data export ····························································································· 217 Configuring IPv6 NetStream export format ······································································································ 217 Configuring refresh rate for IPv6 NetStream version 9 templates ································································· 217 Displaying and maintaining IPv6 NetStream ············································································································ 218 Configuring IPv6 NetStream examples······················································································································ 218 Configuring IPv6 NetStream traditional data export example ······································································· 218 Configuring IPv6 NetStream aggregation data export example ··································································· 219 Configuring sFlow ··················································································································································· 221 sFlow operation ··················································································································································· 221 Configuring sFlow ························································································································································ 222 Configuring the sFlow agent and sFlow collector ···························································································· 222 Configuring flow sampling ································································································································· 223 Configuring counter sampling ··························································································································· 223 Displaying and maintaining sFlow ····························································································································· 223 Configuring sFlow example ········································································································································ 224 Troubleshooting sFlow configuration ························································································································· 225 The remote sFlow collector cannot receive sFlow packets ·············································································· 225 Configuring information center ······························································································································ 226 System information types ···································································································································· 227 Eight levels of system information ······················································································································ 227 Output destinations and channels of system information ················································································ 227 Outputting system information by source module ···························································································· 228 Default output rules of system information ········································································································ 228 System information format ·································································································································· 229 ix
Configuring information center··································································································································· 232 Information center configuration task list ·········································································································· 232 Outputting system information to the console ·································································································· 233 Outputting system information to a monitor terminal ······················································································ 234 Outputting system information to a log host ····································································································· 235 Outputting system information to the trap buffer ····························································································· 236 Outputting system information to the log buffer ······························································································· 236 Outputting system information to the SNMP module······················································································· 237 Outputting system information to the web interface ························································································ 238 Saving system information to a log file ············································································································· 239 Saving security logs into the security log file···································································································· 240 Configuring synchronous information output ··································································································· 243 Disabling a port from generating link up/down logging information··························································· 243 Displaying and maintaining information center ······································································································· 244 Configuring information center examples ················································································································· 245 Outputting log information to a Unix log host ································································································· 245 Outputting log information to a Linux log host································································································· 246 Outputting log information to the console ········································································································ 248 Saving security logs into the security log file···································································································· 249 Support and other resources ·································································································································· 253 Contacting HP ······························································································································································ 253 Subscription service ············································································································································ 253 Related information ······················································································································································ 253 Documents ···························································································································································· 253 Websites ······························································································································································ 253 Conventions ·································································································································································· 254 Index ········································································································································································ 256 x
System maintenance and debugging
You can use the ping command and the tracert command to verify the current network connectivity, and
use the debug command to enable debugging and to diagnose system faults based on the debugging
information.
Configuring ping
The ping command allows you to verify whether a device with a specified address is reachable, and to
examine network connectivity.
The ping function is implemented through the ICMP using the following workflow:
1.
The source device sends an ICMP echo request to the destination device.
2.
The source device determines whether the destination is reachable based on whether it receives an
ICMP echo reply; if the destination is reachable, the source device determines the link quality
based on the numbers of ICMP echo requests sent and replies received, determines the distance
between the source and destination based on the round trip time of ping packets.
To configure the ping function:
To do…
Check whether a specified
address in an IP network is
reachable.
Use the command…
Remarks
ping [ ip ] [ -a source-ip | -c count | -f | h ttl | -i interface-type interface-number | m interval | -n | -p pad | -q | -r | -s
packet-size | -t timeout | -tos tos | -v | vpn-instance vpn-instance-name ] * host
Required.
ping ipv6 [ -a source-ipv6 | -c count | -m
interval | -s packet-size | -t timeout ] *
host [ -i interface-type interface-number ]
Use either approach.
The ping command is
applicable in an IPv4 network;
the ping ipv6 command is
applicable in an IPv6 network.
Available in any view.
NOTE:
• For a low-speed network, set a larger value for the timeout timer—indicated by the -t parameter in
the command—when configuring the ping command.
• Only the directly connected segment address can be pinged if the outgoing interface is specified with
the -i argument
• For more information about the ping lsp command, see MPLS basics commands in the MPLS
Command Reference.
Configuring ping example
Network requirements
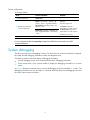
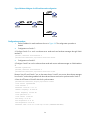
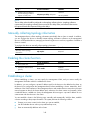
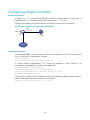
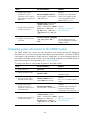
As shown in Figure 1, check whether Device A and Device C can reach each other. If they can reach
each other, get the detailed information of routes from Device A to Device C.
1
Figure 1 Ping network diagram
Configuration procedure
# Use the ping command to display whether Device A and Device C can reach each other.
<DeviceA> ping 1.1.2.2
PING 1.1.2.2: 56
data bytes, press CTRL_C to break
Reply from 1.1.2.2: bytes=56 Sequence=1 ttl=254 time=205 ms
Reply from 1.1.2.2: bytes=56 Sequence=2 ttl=254 time=1 ms
Reply from 1.1.2.2: bytes=56 Sequence=3 ttl=254 time=1 ms
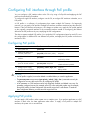
Reply from 1.1.2.2: bytes=56 Sequence=4 ttl=254 time=1 ms
Reply from 1.1.2.2: bytes=56 Sequence=5 ttl=254 time=1 ms
--- 1.1.2.2 ping statistics --5 packet(s) transmitted
5 packet(s) received
0.00% packet loss
round-trip min/avg/max = 1/41/205 ms
# Get the detailed information of routes from Device A to Device C.
<DeviceA> ping -r 1.1.2.2
PING 1.1.2.2: 56
data bytes, press CTRL_C to break
Reply from 1.1.2.2: bytes=56 Sequence=1 ttl=254 time=53 ms
Record Route:
1.1.2.1
1.1.2.2
1.1.1.2
1.1.1.1
Reply from 1.1.2.2: bytes=56 Sequence=2 ttl=254 time=1 ms
Record Route:
1.1.2.1
1.1.2.2
1.1.1.2
1.1.1.1
Reply from 1.1.2.2: bytes=56 Sequence=3 ttl=254 time=1 ms
Record Route:
1.1.2.1
1.1.2.2
1.1.1.2
2
1.1.1.1
Reply from 1.1.2.2: bytes=56 Sequence=4 ttl=254 time=1 ms
Record Route:
1.1.2.1
1.1.2.2
1.1.1.2
1.1.1.1
Reply from 1.1.2.2: bytes=56 Sequence=5 ttl=254 time=1 ms
Record Route:
1.1.2.1
1.1.2.2
1.1.1.2
1.1.1.1
--- 1.1.2.2 ping statistics --5 packet(s) transmitted
5 packet(s) received
0.00% packet loss
round-trip min/avg/max = 1/11/53 ms
The principle of ping –r is as shown in Figure 1.
1.
The source (Device A) sends an ICMP echo request with the RR option being empty to the
destination (Device C).
2.
The intermediate device (Device B) adds the IP address (1.1.2.1) of its outbound interface to the RR
option of the ICMP echo request and forwards the packet.
3.
Upon receiving the request, the destination device copies the RR option in the request and adds the
IP address (1.1.2.2) of its outbound interface to the RR option. Then the destination device sends an
ICMP echo reply.
4.
The intermediate device adds the IP address (1.1.1.2) of its outbound interface to the RR option in
the ICMP echo reply, and then forwards the reply.
5.
Upon receiving the reply, the source device adds the IP address (1.1.1.1) of its inbound interface
to the RR option. Finally, get the detailed information of routes from Device A to Device C: 1.1.1.1
<-> {1.1.1.2; 1.1.2.1} <-> 1.1.2.2.
Tracert
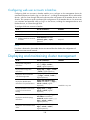
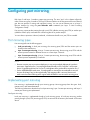
By using the tracert command, you can trace the Layer 3 devices involved in delivering an IP packet
from source to destination to check whether a network is available. This is useful for identification of
failed nodes in the event of network failure.
3
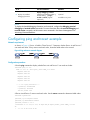
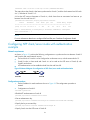
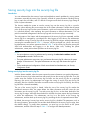
Figure 2 Tracert diagram
The tracert function is implemented through ICMP, as shown in Figure 2:
1.
The source (Device A) sends a packet with a TTL value of 1 to the destination (Device D). The UDP
port of the packet is a port number that will not be used by any application of the destination.
2.
The first hop (Device B) (the Layer 3 device that first receives the packet) responds by sending a TTLexpired ICMP error message to the source, with its IP address 1.1.1.2 encapsulated. In this way,
the source device can get the address (1.1.1.2) of the first Layer 3 device.
3.
The source device sends a packet with a TTL value of 2 to the destination device.
4.
The second hop (Device C) responds with a TTL-expired ICMP error message, which gives the
source device the address (1.1.2.2) of the second Layer 3 device.
5.
The process continues until the ultimate destination device is reached. No application of the
destination uses this UDP port. The destination replies a port unreachable ICMP error message with
the destination IP address 1.1.3.2.
6.
When the source device receives the port unreachable ICMP error message, it knows that the
packet has reached the destination, and it can get the addresses of all Layer 3 devices involved to
get to the destination device (1.1.1.2, 1.1.2.2, 1.1.3.2).
Configuring tracert
Configuration prerequisites
Before you configure tracert, complete the following tasks:
•
Enable sending of ICMP timeout packets on the intermediate device (the device between the source
and destination devices). If the intermediate device is an HP device, execute the ip ttl-expires
enable command on the device. For more information about this command, see IP performance
optimization commands in the Layer 3 - IP Services Command Reference.
•
Enable sending of ICMP destination unreachable packets on the destination device. If the
destination device is an HP device, execute the ip unreachables enable command. For more
information about this command, see IP performance optimization commands in the Layer 3 - IP
Services Command Reference.
4
Tracert configuration
To configure tracert:
To do…
Use the command…
Remarks
1. Enter system view.
system-view
—
tracert [ -a source-ip | -f first-ttl | -m
max-ttl | -p port | -q packet-number | vpn-instance vpn-instance-name | -w
timeout ] * host
Required.
2. Display the routes from
source to destination.
tracert ipv6 [ -f first-ttl | -m max-ttl | -p
port | -q packet-number | -w timeout ]
* host
Use either approach.
The tracert command is
applicable in an IPv4 network;
the tracert ipv6 command is
applicable in an IPv6 network.
Available in any view.
NOTE:
For more information about the tracert lsp command, see MPLS basics commands in the MPLS
Command Reference.
System debugging
The device provides various debugging functions. For the majority of protocols and features supported,
the system provides debugging information to help users diagnose errors.
The following switches control the display of debugging information:
•
Protocol debugging switch, which controls protocol-specific debugging information.
•
Screen output switch, which controls whether to display the debugging information on a certain
screen.
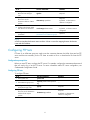
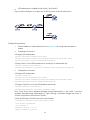
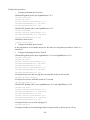
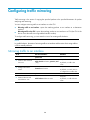
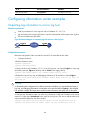
As Figure 3 illustrates, assume the device can provide debugging for the three modules 1, 2, and 3. The
debugging information can only be output on a terminal when both the protocol debugging switch and
the screen output switch are turned on.
5
Figure 3 The relationship between the protocol and screen output switch
1
3
Configuring system debugging
Output of the debugging information may reduce system efficiency. Administrators usually use the
debugging commands to diagnose network failure. After completing the debugging, disable the
corresponding debugging function, or use the undo debugging all command to disable all debugging
functions.
Output of debugging information depends on the configurations of the information center and the
debugging commands of each protocol and functional module. Displaying the debugging information
on a terminal—including console or VTY—is a common way to output debugging information. You can
also output debugging information to other destinations. For more information, see Information center
commands in the Network Management and Monitoring Command Reference. By default, you can
output debugging information to a terminal by following these steps:
To do…
Use the command…
Remarks
Optional.
3. Enable the terminal
monitoring of system
information.
terminal monitor
The terminal monitoring on the
console is enabled by default and
that on the monitoring terminal is
disabled by default.
Available in user view.
Required.
4. Enable the terminal display of
debugging information.
terminal debugging
5. Enable debugging for a
specified module.
debugging { all [ timeout time ] |
module-name [ option ] }
Disabled by default.
Available in user view.
6
Required.
Disabled by default.
Available in user view.
To do…
Use the command…
6. Display the enabled
debugging functions.
display debugging [ interface
interface-type interface-number ] [
module-name ] [ | { begin |
exclude | include } regularexpression ]
Remarks
Optional.
Available in any view.
NOTE:
To display the detailed debugging information on the terminal, configure the debugging, terminal
debugging and terminal monitor commands. For more information about the terminal debugging and
terminal monitor commands, see Information center commands in the Network Management and
Monitoring Command Reference.
Configuring ping and tracert example
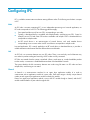
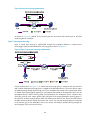
Network requirements
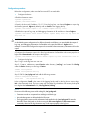
As shown in Figure 4, Device A failed to Telnet Device C. Determine whether Device A and Device C
can reach each other. If they cannot reach each other, locate the failed nodes in the network.
Figure 4 Ping and tracert network diagram
Configuration procedure
# Use the ping command to display whether Device A and Device C can reach each other.
<DeviceA> ping 1.1.2.2
PING 1.1.2.2: 56
data bytes, press CTRL_C to break
Request time out
Request time out
Request time out
Request time out
Request time out
--- 1.1.2.2 ping statistics --5 packet(s) transmitted
0 packet(s) received
100.00% packet loss
# Device A and Device C cannot reach each other. Use the tracert command to determine failed nodes.
<DeviceA> system-view
[DeviceA] ip ttl-expires enable
[DeviceA] ip unreachables enable
[DeviceA] tracert 1.1.2.2
traceroute to 1.1.2.2(1.1.2.2) 30 hops max,40 bytes packet, press CTRL_C to bre
ak
1
1.1.1.2 14 ms 10 ms 20 ms
7
2
* * *
3
* * *
4
* * *
5
<DeviceA>
The output shows that Device A and Device C cannot reach other, Device A and Device B can reach
each other, and an error occurred on the connection between Device B and Device C. Use the
debugging ip icmp command to enable ICMP debugging on Device A and Device C to check whether
the devices send or receive the specified ICMP packets, or use the display ip routing-table command to
display whether Device A and Device C can reach each other.
8
Configuring NQA
NQA can perform various types of tests and collect network performance and service quality parameters
such as delay jitter, time for establishing a TCP connection, time for establishing an FTP connection, and
file transfer rate.
With the NQA test results, you can diagnose and locate network faults, know network performance in
time and take proper actions.
NQA benefits
Supporting multiple test types
Ping can only use the ICMP to test the reachability of the destination host and the round-trip time. As an
enhancement to Ping, NQA provides more test types and functions.
NQA supports 11 test types: ICMP echo, DHCP, DNS, FTP, HTTP, UDP jitter, SNMP, TCP, UDP echo,
voice and DLSw.
NQA enables the client to send probe packets of different test types to detect the protocol availability
and response time of the peer. The test result helps you understand network performance.
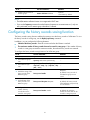
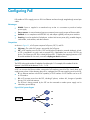
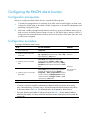
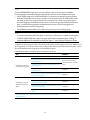
Supporting the collaboration function
Collaboration is implemented by establishing reaction entries to monitor the detection results of NQA
probes. If the number of consecutive probe failures reaches a limit, NQA informs the track module of the
detection result, and the track module triggers other application modules to take predefined.
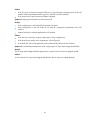
Figure 5 Implement collaboration
The collaboration comprises the following parts: the application modules, the track module, and the
detection modules.
•
A detection module monitors specific objects, such as the link status, and network performance,
and informs the track module of detection results.
•
Upon the detection results, the track module changes the status of the track entry and informs the
associated application module. The track module works between the application modules and the
detection modules. It hides the differences among detection modules from application modules.
•
The application module takes actions when the tracked object changes its state.
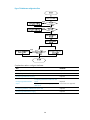
The following describes how a static route is monitored through collaboration.
1.
NQA monitors the reachability to 192.168.0.88.
2.
When 192.168.0.88 becomes unreachable, NQA notifies it to the track module.
9
3.
The track module notifies the state change to the static routing module
4.
The static routing module sets the static route as invalid.
NOTE:
For more information about the collaboration and the track module, see High Availability
Configuration Guide.
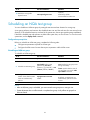
Supporting threshold monitoring
NQA supports threshold monitoring for performance parameters such as average delay jitter and packet
round-trip time. The performance parameters to be monitored are monitored elements. NQA monitors
threshold violations for a monitored element, and reacts to certain measurement conditions, for example,
sending trap messages to the network management server. This helps network administrators understand
the network service quality and network performance.
1.
Monitored elements
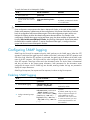
Table 1 describes the monitored elements and the NQA test types in which the elements can be
monitored.
Table 1 Monitored elements and NQA test types
Monitored elements
Test type supported
Probe duration
Tests excluding UDP jitter test and voice
test
Count of probe failures
Tests excluding UDP jitter test and voice
test
Packet round-trip time
UDP jitter test and voice test
Count of discarded packets
UDP jitter test and voice test
One-way delay jitter (source-to-destination and destination-tosource)
UDP jitter test and voice test
One-way delay (source-to-destination and destination-to-source)
UDP jitter test and voice test
ICPIF (see “Configuring voice tests”)
Voice test
MOS (see “Configuring voice tests”)
Voice test
2.
Threshold types
The following threshold types are supported:
•
average—Monitors the average value of monitored data in a test. If the average value in a test
exceeds the upper threshold or goes below the lower threshold, a threshold violation occurs. For
example, you can monitor the average probe duration in a test.
•
accumulate—Monitors total number of times the monitored data violates the threshold in a test. If
the total number of times reaches or exceeds a specified value, a threshold violation occurs.
•
consecutive—Monitors the number of consecutive times the monitored data violates the threshold
since the test group starts. If the monitored data violates the threshold consecutively for a specified
number of times, a threshold violation occurs.
10
NOTE:
The counting for the average or accumulate threshold type is performed per test, but that for the
consecutive type is performed since the test group is started.
3.
Triggered actions
The following actions may be triggered:
•
none—NQA only records events for terminal display; it does not send trap information to the
network management server.
•
trap-only—NQA records events and sends trap messages to the network management server.
NOTE:
NQA DNS tests do not support the action of sending trap messages. The action to be triggered in DNS
tests can only be the default one, none.
4.
Reaction entry
In a reaction entry, a monitored element, a threshold type, and the action to be triggered are configured
to implement threshold monitoring.
The state of a reaction entry can be invalid, over-threshold, or below-threshold. Before an NQA test
group starts, the reaction entry is in the state of invalid. After each test or probe, threshold violations are
counted according to the threshold type and range configured in the entry. If the threshold is violated
consecutively or accumulatively for a specified number of times, the state of the entry is set to overthreshold; otherwise, the state of the entry is set to below-threshold.
If the action to be triggered is configured as trap-only for a reaction entry, when the state of the entry
changes, a trap message is generated and sent to the network management server.
Basic NQA concepts
Test group
An NQA test group specifies test parameters including the test type, destination address, and destination
port. Each test group is uniquely identified by an administrator name and operation tag. You can
configure and schedule multiple NQA test groups to test different objects.
Test and probe
After the NQA test group starts, tests are performed at a specified interval. During each test, a specified
number of probe operations are performed. Both the test interval and the number of probe operations
per test are configurable. But only one probe operation is performed during one voice test.
Probe operations vary with NQA test types.
•
During a TCP or DLSw test, one probe operation means setting up one connection.
•
During a UDP jitter or a voice test, one probe operation means continuously sending a specified
number of probe packets. The number of probe packets is configurable.
•
During an FTP, HTTP, DHCP or DNS test, one probe operation means uploading or downloading a
file, obtaining a web page, obtaining an IP address through DHCP, or translating a domain name
to an IP address.
•
During an ICMP echo or UDP echo test, one probe operation means sending an ICMP echo request
or a UDP packet.
11
During an SNMP test, one probe operation means sending one SNMPv1 packet, one SNMPv2C
packet, and one SNMPv3 packet.
•
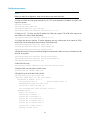
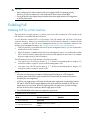
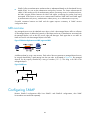
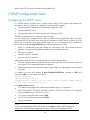
NQA client and server
A device with NQA test groups configured is an NQA client and the NQA client initiates NQA tests. An
NQA server makes responses to probe packets destined to the specified destination address and port
number.
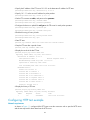
Figure 6 Relationship between the NQA client and NQA server
Not all test types require the NQA server. Only the TCP, UDP echo, UDP jitter, or voice test requires both
the NQA client and server, as shown in Figure 6.
You can create multiple TCP or UDP listening services on the NQA server. Each listens to a specific
destination address and port number. Make sure the destination IP address and port number for a
listening service on the server are the same as those configured for the test group on the NQA client.
Each listening service must be unique on the NQA server.
NQA probe operation procedure
An NQA probe operation involves the following steps:
1.
The NQA client constructs probe packets for the specified type of NQA test, and sends them to the
peer device.
2.
Upon receiving the probe packets, the peer sends back responses with timestamps.
3.
The NQA client computes the network performance and service quality parameters, such as the
packet loss rate and round-trip time based on the received responses.
NQA configuration task list
To enable the NQA server:
Task
Remarks
Configuring the NQA server
Required for TCP, UDP echo, UDP jitter and voice
tests
To perform NQA tests successfully, make the following configurations on the NQA client:
1.
Enable the NQA client.
2.
Create a test group and configure test parameters. The test parameters may vary with test types.
3.
Schedule the NQA test group.
To configure NQA client:
Task
Remarks
Enabling the NQA client
Required
Creating an NQA test group
Required
12
Task
Remarks
Configuring ICMP echo tests
Configuring DHCP tests
Configuring DNS tests
Configuring FTP tests
Configuring HTTP tests
Configuring an NQA test group
Required
Configuring UDP jitter tests
Use any of the approaches
Configuring SNMP tests
Configuring TCP tests
Configuring UDP echo tests
Configuring voice tests
Configuring DLSw tests
Configuring the collaboration function
Optional
Configuring Threshold Monitoring
Optional
Configuring the NQA statistics collection function
Optional
Configuring the history records saving function
Optional
Configuring optional parameters for an NQA test group
Optional
Scheduling an NQA test group
Required
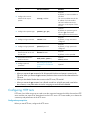
Configuring the NQA server
To perform TCP, UDP echo, UDP jitter, or voice tests, configure the NQA server on the peer device. The
NQA server responses to the probe packets sent from the NQA client by listening to the specified
destination address and port number.
To configure the NQA server:
To do…
Use the command…
Remarks
1. Enter system view.
system-view
—
2. Enable the NQA server.
nqa server enable
Required.
Disabled by default.
Required.
3. Configure the listening
service.
nqa server { tcp-connect | udpecho } ip-address port-number
13
The destination IP address and port
number must be the same as those
configured on the NQA client. A
listening service must be unique on
the NQA server.
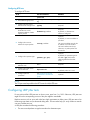
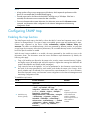
Enabling the NQA client
Configurations on the NQA client only take effect when the NQA client is enabled.
To enable the NQA client:
To do…
Use the command…
Remarks
1. Enter system view.
system-view
—
2. Enable the NQA client.
nqa agent enable
Optional.
Enabled by default.
Creating an NQA test group
Create an NQA test group before you configure NQA tests.
To do…
Use the command…
Remarks
1. Enter system view.
system-view
—
Required.
2. Create an NQA test group
and enter the NQA test group
view.
nqa entry admin-name operationtag
In the NQA test group view, you
can specify the test type.
You can use the nqa entry
command to enter the test type
view of an NQA test group with
test type configured.
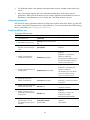
Configuring an NQA test group
Configuring ICMP echo tests
ICMP echo tests of an NQA test group are used to test reachability of a destination host according to the
ICMP echo response information. An ICMP echo test has the same function as the ping command but
provides more output information. In addition, you can specify the next hop for ICMP echo tests. ICMP
echo tests are used to locate connectivity problems in a network.
To configure ICMP echo tests:
To do…
Use the command…
Remarks
1. Enter system view.
system-view
—
2. Enter NQA test group view.
nqa entry admin-name operationtag
—
3. Configure the test type as
ICMP echo and enter test type
view.
type icmp-echo
Required.
4. Configure the destination
address of ICMP echo
requests.
Required.
destination ip ip-address
14
By default, no destination IP
address is configured.
To do…
Use the command…
5. Configure the size of the data
field in each ICMP echo
request.
data-size size
6. Configure the string to be
filled in the data field of each
ICMP echo request.
7. Apply ICMP echo tests to the
specified VPN.
8. Configure the source interface
for ICMP echo requests. The
requests take the IP address of
the source interface as their
source IP address when no
source IP address is specified.
Remarks
Optional.
100 bytes by default.
Optional.
data-fill string
By default, the string is the
hexadecimal number
00010203040506070809.
Optional.
vpn-instance vpn-instance-name
By default, ICMP echo tests apply
to the public network.
Optional.
source interface interface-type
interface-number
By default, no source interface is
configured for probe packets.
The specified source interface
must be up; otherwise, no ICMP
echo requests can be sent out.
Optional
By default, no source IP address is
configured.
9. Configure the source IP
address of ICMP echo
requests.
source ip ip-address
If you configure both the source ip
command and the source
interface command, the source ip
command takes effect.
The source IP address must be the
IP address of a local interface.
The local interface must be up;
otherwise, no ICMP echo requests
can be sent out.
Optional.
10. Configure the next hop IP
address of ICMP echo
requests.
next-hop ip-address
11. Configure optional
parameters.
See “Configuring optional
parameters for an NQA test
group”
By default, no next hop IP address
is configured.
Optional.
NOTE:
NQA ICMP echo tests are not supported in IPv6 networks. To test the reachability of an IPv6 address,
use the ping ipv6 command. For more information about the command, see “System maintenance and
debugging.”
Configuring DHCP tests
DHCP tests of an NQA test group are used to test if a DHCP server is on the network, and how long it
takes for the DHCP server to respond to a client request and assign an IP address to the client.
15
Configuration prerequisites
Before you start DHCP tests, configure the DHCP server. If the NQA (DHCP client) and the DHCP server
are not in the same network segment, configure a DHCP relay. For the configuration of DHCP server and
DHCP relay, see Layer 3—IP Services Configuration Guide.
Configuring DHCP tests
To configure DHCP tests:
To do…
Use the command…
Remarks
1. Enter system view.
system-view
—
2. Enter NQA test group view.
nqa entry admin-name operationtag
—
3. Configure the test type as
DHCP and enter test type
view.
type dhcp
Required.
Required.
4. Specify an interface to
perform DHCP tests.
operation interface interface-type
interface-number
5. Configure optional
parameters.
See “Configuring optional
parameters for an NQA test
group”
By default, no interface is
configured to perform DHCP tests.
The specified interface must be
up; otherwise, no probe packets
can be sent out.
Optional.
NOTE:
• The interface that performs DHCP tests does not change its IP address. A DHCP test only simulates
address allocation in DHCP.
• When a DHCP test completes, the NQA client sends a DHCP-RELEASE packet to release the obtained
IP address.
Configuring DNS tests
DNS tests of an NQA test group are used to test whether the NQA client can translate a domain name
into an IP address through a DNS server and test the time required for resolution.
Configuration prerequisites
Before you start DNS tests, configure the mapping between a domain name and an IP address on a
DNS server.
Configuring DNS tests
To configure DNS tests:
To do…
Use the command…
Remarks
1. Enter system view.
system-view
—
2. Enter NQA test group view.
nqa entry admin-name operation-tag
—
16
To do…
Use the command…
Remarks
3. Configure the test type as
DNS and enter test type
view.
type dns
Required.
4. Specify the IP address of the
DNS server as the
destination address of DNS
packets.
destination ip ip-address
5. Configure the domain name
that needs to be translated.
resolve-target domain-name
6. Configure optional
parameters.
See “Configuring optional
parameters for an NQA test group”
Required.
By default, no destination IP
address is configured.
Required.
By default, no domain name is
configured.
Optional.
NOTE:
A DNS test simulates the domain name resolution. It does not save the mapping between the domain
name and the IP address.
Configuring FTP tests
FTP tests of an NQA test group are used to test the connection between the NQA client and an FTP
server and the time necessary for the FTP client to transfer a file to or download a file from the FTP
server.
Configuration prerequisites
Before you start FTP tests, configure the FTP server. For example, configure the username and password
that are used to log in to the FTP server. For more information about FTP server configuration, see
Fundamentals Configuration Guide.
Configuring FTP tests
To configure FTP tests:
To do…
Use the command…
Remarks
1. Enter system view.
system-view
—
2. Enter NQA test group view.
nqa entry admin-name operationtag
—
3. Configure the test type as FTP
and enter test type view.
type ftp
Required.
4. Specify the IP address of the
FTP server as the destination
address of FTP request
packets.
destination ip ip-address
Required.
17
By default, no destination IP
address is configured.
To do…
Use the command…
Remarks
Required.
5. Configure the source IP
address of FTP request
packets.
By default, no source IP address is
specified.
source ip ip-address
The source IP address must be the
IP address of a local interface.
The local interface must be up;
otherwise, no FTP requests can be
sent out.
Optional.
6. Configure the operation type.
operation { get | put }
7. Configure a login username.
username name
By default, the operation type for
the FTP is get, which means
obtaining files from the FTP server.
Required.
By default, no login username is
configured.
Required.
8. Configure a login password.
password password
9. Specify a file to be transferred
between the FTP server and
the FTP client.
filename file-name
10. Set the data transmission
mode for FTP tests.
mode { active | passive }
11. Configure optional
parameters.
See “Configuring optional
parameters for an NQA test
group”
By default, no login password is
configured.
Required.
By default, no file is specified.
Optional.
active by default.
Optional.
NOTE:
• When you execute the put command, a file file-name with fixed size and content is created on the
FTP server. When you execute the get command, the device does not save the files obtained from the
FTP server.
• When you download a file that does not exist on the FTP server, FTP tests fail.
• When you execute the get command, use a file with a small size. A big file may result in test failure
due to timeout, or may affect other services for occupying too much network bandwidth.
Configuring HTTP tests
HTTP tests of an NQA test group are used to test the connection between the NQA client and an HTTP
server and the time required to obtain data from the HTTP server. HTTP tests enable you to detect the
connectivity and performance of the HTTP server.
Configuration prerequisites
Before you start HTTP tests, configure the HTTP server.
18
Configuring HTTP tests
To configure HTTP tests:
To do…
Use the command…
Remarks
1. Enter system view.
system-view
—
2. Enter NQA test group view.
nqa entry admin-name operationtag
—
3. Configure the test type as
HTTP and enter test type view.
type http
Required.
4. Configure the IP address of
the HTTP server as the
destination address of HTTP
request packets.
Required.
destination ip ip-address
By default, no destination IP
address is configured.
Optional.
5. Configure the source IP
address of request packets.
By default, no source IP address is
specified.
source ip ip-address
The source IP address must be the
IP address of a local interface.
The local interface must be up;
otherwise, no probe packets can
be sent out.
Optional.
6. Configure the operation type.
operation { get | post }
7. Configure the website that an
HTTP test visits.
url url
8. Configure the HTTP version
used in HTTP tests.
http-version v1.0
9. Configure optional
parameters.
See “Configuring optional
parameters for an NQA test
group”
By default, the operation type for
the HTTP is get, which means
obtaining data from the HTTP
server.
Required.
Optional.
By default, HTTP 1.0 is used.
Optional.
NOTE:
The TCP port must be port 80 on the HTTP server for NQA HTTP tests.
Configuring UDP jitter tests
Do not perform NQA UDP jitter tests on known ports, ports from 1 to 1023. Otherwise, UDP jitter tests
might fail or the corresponding services of this port might be unavailable.
Real-time services such as voice and video have high requirements on delay jitters. UDP jitter tests of an
NQA test group obtain uni/bi-directional delay jitters. The test results help you verify whether a network
can carry real-time services.
A UDP jitter test takes the following procedure:
1.
The source sends packets at regular intervals to the destination port.
19
2.
The destination affixes a time stamp to each packet that it receives, and then sends it back to the
source.
3.
Upon receiving the response, the source calculates the delay jitter, which reflects network
performance. Delay refers to the amount of time it takes a packet to be transmitted from source to
destination or from destination to source. Delay jitter is the delay variation over time.
Configuration prerequisites
UDP jitter tests require cooperation between the NQA server and the NQA client. Before you start UDP
jitter tests, configure UDP listening services on the NQA server. For more information about UDP listening
service configuration, see “Configuring the NQA server.”
Configuring UDP jitter tests
To configure UDP jitter tests:
To do…
Use the command…
Remarks
1. Enter system view.
system-view
—
2. Enter NQA test group view.
nqa entry admin-name operationtag
—
3. Configure the test type as
UDP jitter and enter test type
view.
type udp-jitter
Required.
Required.
4. Configure the destination
address of UDP packets.
destination ip ip-address
By default, no destination IP
address is configured.
The destination IP address must be
the same as that of the listening
service on the NQA server.
Required.
5. Configure the destination port
of UDP packets.
destination port port-number
6. Specify the source port
number of UDP packets.
source port port-number
7. Configure the size of the data
field in each UDP packet.
data-size size
8. Configure the string to be
filled in the data field of each
probe packet.
9. Configure the number of
probe packets to be sent
during each UDP jitter probe
operation.
By default, no destination port
number is configured.
The destination port must be the
same as that of the listening
service on the NQA server.
Optional.
By default, no source port number
is specified.
Optional.
100 bytes by default.
Optional.
data-fill string
By default, the string is the
hexadecimal number
00010203040506070809.
probe packet-number
Optional.
packet-number
10 by default.
20
To do…
Use the command…
Remarks
10. Configure the interval for
sending probe packets during
each UDP jitter probe
operation.
probe packet-interval packetinterval
Optional.
11. Configure the interval the
NQA client must wait for a
response from the server
before it regards the response
is timed out.
probe packet-timeout packettimeout
Optional.
20 milliseconds by default.
3000 milliseconds by default.
Optional.
By default, no source IP address is
specified.
12. Configure the source IP
address for UDP jitter packets.
source ip ip-address
13. Configure optional
parameters.
See “Configuring optional
parameters for an NQA test
group”
The source IP address must be the
IP address of a local interface.
The local interface must be up;
otherwise, no probe packets can
be sent out.
Optional.
NOTE:
The probe count command specifies the number of probe operations during one UDP jitter test. The
probe packet-number command specifies the number of probe packets sent in each UDP jitter probe
operation.
Configuring SNMP tests
SNMP tests of an NQA test group are used to test the time the NQA client takes to send an SNMP
packet to the SNMP agent and receive a response.
Configuration prerequisites
Before you start SNMP tests, enable the SNMP agent function on the device that serves as an SNMP
agent. For more information about SNMP agent configuration, see “Configuring SNMP.”
Configuring SNMP tests
To configure SNMP tests:
To do…
Use the command…
Remarks
1. Enter system view.
system-view
—
2. Enter NQA test group view.
nqa entry admin-name operationtag
—
3. Configure the test type as
SNMP and enter test type
view.
type snmp
Required.
21
To do…
Use the command…
4. Configure the destination
address of SNMP packets.
destination ip ip-address
5. Specify the source port of
SNMP packets.
source port port-number
Remarks
Required.
By default, no destination IP
address is configured.
Optional.
By default, no source port number
is specified.
Optional.
By default, no source IP address is
specified.
6. Configure the source IP
address of SNMP packets.
source ip ip-address
7. Configure optional
parameters.
See “Configuring optional
parameters for an NQA test
group”
The source IP address must be the
IP address of a local interface.
The local interface must be up;
otherwise, no probe packets can
be sent out.
Optional.
Configuring TCP tests
TCP tests of an NQA test group are used to test the TCP connection between the NQA client and a port
on the NQA server and the time for setting up a connection. The test result helps you understand the
availability and performance of the services provided by the port on the server.
Configuration prerequisites
TCP tests require cooperation between the NQA server and the NQA client. Before you start TCP tests,
configure a TCP listening service on the NQA server. For more information about the TCP listening
service configuration, see “Configuring the NQA server.”
Configuring TCP tests
To configure TCP tests:
To do…
Use the command…
Remarks
1. Enter system view.
system-view
—
2. Enter NQA test group view.
nqa entry admin-name operationtag
—
3. Configure the test type as TCP
and enter test type view.
type tcp
Required.
Required.
4. Configure the destination
address of TCP probe
packets.
By default, no destination IP
address is configured.
destination ip ip-address
22
The destination address must be
the same as the IP address of the
listening service configured on the
NQA server.
To do…
Use the command…
Remarks
Required.
5. Configure the destination port
of TCP probe packets.
destination port port-number
By default, no destination port
number is configured.
The destination port number must
be the same as that of the
listening service on the NQA
server.
Optional.
By default, no source IP address is
specified.
6. Configure the source IP
address of TCP probe
packets.
source ip ip-address
7. Configure optional
parameters.
See “Configuring optional
parameters for an NQA test
group”
The source IP address must be the
IP address of a local interface.
The local interface must be up;
otherwise, no probe packets can
be sent out.
Optional.
Configuring UDP echo tests
UDP echo tests of an NQA test group tests the connectivity and round-trip time of a UDP packet from the
client to the specified UDP port on the NQA server.
Configuration prerequisites
UDP echo tests require cooperation between the NQA server and the NQA client. Before you start UDP
echo tests, configure a UDP listening service on the NQA server. For more information about the UDP
listening service configuration, see “Configuring the NQA server.”
Configuring UDP echo tests
To configure UDP echo tests:
To do…
Use the command…
Remarks
1. Enter system view.
system-view
—
2. Enter NQA test group view.
nqa entry admin-name operationtag
—
3. Configure the test type as
UDP echo and enter test type
view.
type udp-echo
Required.
Required.
4. Configure the destination
address of UDP packets.
By default, no destination IP
address is configured.
destination ip ip-address
23
The destination address must be
the same as the IP address of the
listening service configured on the
NQA server.
To do…
Use the command…
Remarks
Required.
5. Configure the destination port
of UDP packets.
destination port port-number
6. Configure the size of the data
field in each UDP packet.
data-size size
7. Configure the string to be
filled in the data field of each
UDP packet.
8. Specify the source port of
UDP packets.
By default, no destination port
number is configured.
The destination port number must
be the same as that of the
listening service on the NQA
server.
Optional.
100 bytes by default.
Optional.
data-fill string
By default, the string is the
hexadecimal number
00010203040506070809.
Optional.
source port port-number
By default, no source port number
is specified.
Optional.
By default, no source IP address is
specified.
9. Configure the source IP
address of UDP packets.
source ip ip-address
10. Configure optional
parameters.
See “Configuring optional
parameters for an NQA test
group”
The source IP address must be that
of an interface on the device and
the interface must be up;
otherwise, no probe packets can
be sent out.
Optional.
Configuring voice tests
Voice tests of an NQA test group are used to test VoIP network status, and collect VoIP network
parameters so that users can adjust the network.
NOTE:
Do not perform voice tests on known ports, ports from 1 to 1023. Otherwise, the NQA test might fail or
the corresponding services of these ports might be unavailable.
A voice test takes the following procedure:
1.
The source (NQA client) sends voice packets of G.711 A-law, G.711 μ-law or G.729 A-law codec
type at regular intervals to the destination (NQA server).
2.
The destination affixes a time stamp to each voice packet that it receives and then sends it back to
the source.
3.
Upon receiving the packet, the source calculates results, such as the delay jitter and one-way delay
based on the packet time stamps. The statistics reflect network performance.
Voice test result also includes the following parameters that reflect VoIP network performance:
24
•
ICPIF—Measures impairment to voice quality in a VoIP network. It is decided by packet loss and
delay. A higher value represents a lower service quality.
•
MOS—Value can be evaluated by using the ICPIF value, ranging from 1 to 5. A higher value
represents a higher quality of a VoIP network.
The evaluation of voice quality depends on users’ tolerance to voice quality, which should be taken into
consideration. For users with higher tolerance to voice quality, use the advantage-factor command to
configure the advantage factor. When the system calculates the ICPIF value, this advantage factor is
subtracted to modify ICPIF and MOS values and both the objective and subjective factors are considered
when you evaluate the voice quality.
Configuration prerequisites
Voice tests require cooperation between the NQA server and the NQA client. Before you start voice
tests, configure a UDP listening service on the NQA server. For more information about UDP listening
service configuration, see “Configuring the NQA server.”
Configuring voice tests
To configure voice tests:
To do…
Use the command…
Remarks
1. Enter system view.
system-view
—
2. Enter NQA test group view.
nqa entry admin-name operationtag
—
3. Configure the test type as
voice and enter test type
view.
type voice
Required.
Required.
4. Configure the destination
address of voice probe
packets.
destination ip ip-address
By default, no destination IP
address is configured for a test
operation.
The destination IP address must be
the same as that of the listening
service on the NQA server.
Required.
5. Configure the destination port
of voice probe packets.
destination port port-number
6. Configure the codec type.
codec-type { g711a | g711u |
g729a }
7. Configure the advantage
factor for calculating MOS
and ICPIF values.
advantage-factor factor
By default, no destination port
number is configured.
The destination port must be the
same as that of the listening
service on the NQA server.
Optional.
By default, the codec type is
G.711 A-law.
Optional.
25
By default, the advantage factor is
0.
To do…
Use the command…
Remarks
Optional.
8. Specify the source IP address
of probe packets.
9. Specify the source port
number of probe packets.
By default, no source IP address is
specified.
source ip ip-address
The source IP address must be the
IP address of a local interface.
The local interface must be up;
otherwise, no probe packets can
be sent out.
Optional.
source port port-number
By default, no source port number
is specified.
Optional.
10. Configure the size of the data
field in each probe packet.
11. Configure the string to be
filled in the data field of each
probe packet.
data-size size
By default, the probe packet size
depends on the codec type. The
default packet size is 172 bytes
for G.711A-law and G.711 μ-law
codec type, and is 32 bytes for
G.729 A-law codec type.
Optional
data-fill string
By default, the string is the
hexadecimal number
00010203040506070809.
probe packet-number
Optional.
packet-number
1000 by default.
13. Configure the interval for
sending probe packets during
each voice probe operation.
probe packet-interval packetinterval
Optional.
14. Configure the interval the
NQA client must wait for a
response from the server
before it regards the response
times out.
probe packet-timeout packettimeout
Optional.
15. Configure optional
parameters.
See “Configuring optional
parameters for an NQA test
group"
12. Configure the number of
probe packets to be sent
during each voice probe
operation.
20 milliseconds by default.
5000 milliseconds by default.
Optional.
NOTE:
Only one probe operation is performed in one voice test.
Configuring DLSw tests
DLSw tests of an NQA test group are used to test the response time of a DLSw device.
Configuration prerequisites
Before you start DLSw tests, enable the DLSw function on the peer device.
26
Configuring a DLSw test
To configure DLSw tests:
To do…
Use the command…
Remarks
1. Enter system view.
system-view
—
2. Enter NQA test group view.
nqa entry admin-name operationtag
—
3. Configure the test type as
DLSw and enter test type
view.
type dlsw
Required.
4. Configure the destination
address of probe packets.
destination ip ip-address
Required.
By default, no destination IP
address is configured.
Optional.
By default, no source IP address is
specified.
5. Configure the source IP
address of probe packets.
source ip ip-address
6. Configure optional
parameters.
See “Configuring optional
parameters for an NQA test
group”
The source IP address must be the
IP address of a local interface.
The local interface must be up;
otherwise, no probe packets can
be sent out.
Optional.
Configuring the collaboration function
Collaboration is implemented by establishing reaction entries to monitor the detection results of a test
group. If the number of consecutive probe failures reaches the threshold, the configured action is
triggered.
To configure the collaboration function:
To do…
Use the command…
Remarks
1. Enter system view.
system-view
—
2. Enter NQA test group view.
nqa entry admin-name operationtag
—
3. Enter test type view of the test
group.
type { dhcp | dlsw | dns | ftp |
http | icmp-echo | snmp | tcp |
udp-echo }
The collaboration function is not
supported in UDP jitter and voice
tests.
Required.
4. Configure a reaction entry.
reaction item-number checkedelement probe-fail threshold-type
consecutive consecutiveoccurrences action-type triggeronly
5. Exit to system view.
quit
—
27
Not created by default.
You cannot modify the content of
an existing reaction entry.
To do…
Use the command…
Remarks
6. Configure a track entry and
associate it with the reaction
entry of the NQA test group.
track entry-number nqa entry
admin-name operation-tag
reaction item-number
Required.
28
Not created by default.
Configuring threshold monitoring
Configuration prerequisites
Before you configure threshold monitoring, complete the following tasks:
•
Configure the destination address of the trap message by using the snmp-agent target-host
command. For more information about the snmp-agent target-host command, see “SNMP
configuration commands.”
•
Create an NQA test group and configure related parameters.
Configuring threshold monitoring
To configure threshold monitoring:
To do…
Use the command…
Remarks
1. Enter system view.
system-view
—
2. Enter NQA test group view.
nqa entry admin-name operation-tag
—
3. Enter test type view of the test
group.
type { dhcp | dlsw | dns | ftp | http | icmpecho | snmp | tcp | udp-echo | udp-jitter |
voice }
—
• Configure the device to send
traps to the network
management server under
specified conditions.
• Configure a reaction entry for
monitoring the probe duration
of a test (not supported in UDP
jitter and voice tests)
• Configure a reaction entry for
monitoring the probe failure
times (not supported in UDP
jitter and voice tests)
• Configure a reaction entry for
monitoring packet round-trip
time (only supported in UDP
jitter and voice tests)
• Configure a reaction entry for
monitoring the packet loss in
each test (only supported in
UDP jitter and voice tests)
• Configure a reaction entry for
monitoring one-way delay
jitter (only supported in UDP
jitter and voice tests)
reaction trap { probe-failure consecutive-probefailures | test-complete | test-failure cumulateprobe-failures }
reaction item-number checked-element probeduration threshold-type { accumulate
accumulate-occurrences | average |
consecutive consecutive-occurrences } thresholdvalue upper-threshold lower-threshold [ actiontype { none | trap-only } ]
reaction item-number checked-element probefail threshold-type { accumulate accumulateoccurrences | consecutive consecutiveoccurrences } [ action-type { none | trap-only }
]
reaction item-number checked-element rtt
threshold-type { accumulate accumulateoccurrences | average } threshold-value upperthreshold lower-threshold [ action-type { none |
trap-only } ]
reaction item-number checked-element packetloss threshold-type accumulate accumulateoccurrences [ action-type { none | trap-only } ]
reaction item-number checked-element { jitter-ds
| jitter-sd } threshold-type { accumulate
accumulate-occurrences | average } thresholdvalue upper-threshold lower-threshold [ actiontype { none | trap-only } ]
29
Required.
Configure the device
to send traps.
No traps are sent to
the network
management server
by default.
To do…
• Configure a reaction entry for
monitoring the one-way delay
(only supported in UDP jitter
and voice tests)
• Configure a reaction entry for
monitoring the ICPIF value
(only supported in voice tests)
• Configure a reaction entry for
monitoring the MOS value
(only supported in voice tests)
Use the command…
Remarks
reaction item-number checked-element { owd-ds
| owd-sd } threshold-value upper-threshold
lower-threshold
reaction item-number checked-element icpif
threshold-value upper-threshold lower-threshold
[ action-type { none | trap-only } ]
reaction item-number checked-element mos
threshold-value upper-threshold lower-threshold
[ action-type { none | trap-only } ]
NOTE:
• NQA DNS tests do not support the action of sending trap messages. The action to be triggered in
DNS tests can only be the default one, none.
• Only the test-complete keyword is supported for the reaction trap command in a voice test.
Configuring the NQA statistics collection function
NQA groups tests completed in a time period for a test group, and calculates the test result statistics. The
statistics form a statistics group. To view information about the statistics groups, use the display nqa
statistics command. To set the interval for collecting statistics, use the statistics interval command.
When the number of statistics groups kept reaches the upper limit and a new statistics group is to be
saved, the earliest statistics group is deleted. To set the maximum number of statistics groups that can be
kept, use the statistics max-group command.
A statistics group is formed after the last test is completed within the specified interval. When its hold
time expires, the statistics group is deleted. To set the hold time of statistics groups for a test group, use
the statistics hold-time command.
To configure the NQA statistics collection function:
To do…
Use the command…
Remarks
1. Enter system view.
system-view
—
2. Enter NQA test group view.
nqa entry admin-name operationtag
—
3. Enter test type view of the test
group.
type { dlsw | dns | ftp | http |
icmp-echo | snmp | tcp | udpecho | udp-jitter | voice }
—
4. Configure the interval for
collecting the statistics of test
results.
statistics interval interval
Optional.
60 minutes by default.
Optional.
5. Configure the maximum
number of statistics groups
that can be kept.
statistics max-group number
30
2 by default.
To disable collecting NQA
statistics, set the maximum number
to 0.
To do…
Use the command…
6. Configure the hold time of
statistics groups.
statistics hold-time hold-time
Remarks
Optional.
120 minutes by default.
NOTE:
• The NQA statistics collection function is not supported in DHCP tests.
• If you use the frequency command to set the frequency between two consecutive tests to 0, only one
test is performed, and no statistics group information is collected.
Configuring the history records saving function
The history records saving function enables the system to save the history records of NQA tests. To view
the history records of a test group, use the display nqa history command.
In addition, you can configure the following elements:
•
Lifetime of the history records—Records are removed when the lifetime is reached.
•
The maximum number of history records that can be saved in a test group—If the number of history
records in a test group exceeds the maximum number, the earliest history records are removed.
To configure the history records saving function of an NQA test group:
To do…
Use the command…
Remarks
1. Enter system view.
system-view
—
2. Enter NQA test group
view.
nqa entry admin-name operation-tag
—
3. Enter NQA test type
view.
type { dhcp | dlsw | dns | ftp | http |
icmp-echo | snmp | tcp | udp-echo | udpjitter | voice }
—
4. Enable the saving of the
history records of the
NQA test group.
5. Set the lifetime of the
history records in an
NQA test group.
6. Configure the maximum
number of history
records that can be
saved for a test group.
Required.
history-record enable
By default, history records of
the NQA test group are not
saved.
Optional.
history-record keep-time keep-time
By default, the history records
in the NQA test group are kept
for 120 minutes.
Optional.
history-record number number
31
By default, the maximum
number of records that can be
saved for a test group is 50
Configuring optional parameters for an NQA test
group
Optional parameters for an NQA test group are only valid for tests in this test group.
Unless otherwise specified, the following optional parameters are applicable to all test types.
To configure optional parameters for an NQA test group:
To do…
Use the command…
Remarks
1. Enter system view.
system-view
—
2. Enter NQA test group view.
nqa entry admin-name operationtag
—
3. Enter test type view of a test
group.
type { dhcp | dlsw | dns | ftp |
http | icmp-echo | snmp | tcp |
udp-echo | udp-jitter | voice }
—
4. Configure the description for
a test group.
description text
Optional.
By default, no description is
available for a test group.
Optional.
5. Configure the interval
between two consecutive tests
for a test group.
frequency interval
By default, the interval between
two consecutive tests for a test
group is 0 milliseconds. Only one
test is performed.
If the last test is not completed
when the interval specified by the
frequency command is reached, a
new test does not start.
Optional.
6. Configure the number of
probe operations to be
performed in one test.
probe count times
By default, one probe operation is
performed in one test.
Not available for voice tests. Only
one probe operation can be
performed in one voice test.
Optional.
7. Configure the NQA probe
timeout time.
probe timeout timeout
By default, the timeout time is
3000 milliseconds.
Not available for UDP jitter tests.
8. Configure the maximum
number of hops a probe
packet traverses in the
network.
9. Configure the ToS field in an
IP packet header in an NQA
probe packet.
Optional.
ttl value
20 by default.
Not available for DHCP tests.
Optional.
tos value
0 by default.
Not available for DHCP tests.
32
To do…
10. Enable the routing table
bypass function.
Use the command…
Remarks
Optional.
route-option bypass-route
Disabled by default.
Not available for DHCP tests.
Scheduling an NQA test group
You can schedule an NQA test group by setting the start time and test duration for a test group.
A test group performs tests between the scheduled start time and the end time (the start time plus test
duration). If the scheduled start time is ahead of the system time, the test group starts testing immediately.
If both the scheduled start and end time are behind the system time, no test will start. To view the current
system time, use the display clock command.
Configuration prerequisites
Before you schedule an NQA test group, complete the following tasks:
•
Configure test parameters required for the test type.
•
Configure the NQA server for tests that require cooperation with the NQA server.
Scheduling an NQA test group
To schedule an NQA test group:
To do…
Use the command…
Remarks
1. Enter system view.
system-view
—
Required.
2. Schedule an NQA test group.
3. Configure the maximum
number of tests that the NQA
client can simultaneously
perform.
nqa schedule admin-name
operation-tag start-time {
hh:mm:ss [ yyyy/mm/dd ] | now
} lifetime { lifetime | forever }
now specifies the test group starts
testing immediately.
forever specifies that the tests do
not stop unless you use the undo
nqa schedule command.
Optional.
nqa agent max-concurrent
number
By default, an NQA client can
simultaneously perform two tests
at most.
NOTE:
• After an NQA test group is scheduled, you cannot enter the test group view or test type view.
• System adjustment does not affect started or completed test groups. It only affects test groups that
have not started.
33
Displaying and maintaining NQA
To do…
Use the command…
Display history records of NQA
test groups
display nqa history [ admin-name operationtag ] [ | { begin | exclude | include }
regular-expression ]
Display the current monitoring
results of reaction entries
display nqa reaction counters [ admin-name
operation-tag [ item-number ] ] [ | { begin |
exclude | include } regular-expression ]
Display the results of the last
NQA test
display nqa result [ admin-name operationtag ] [ | { begin | exclude | include }
regular-expression ]
Display statistics of test results for
the specified or all test groups
display nqa statistics [ admin-name
operation-tag ] [ | { begin | exclude |
include } regular-expression ]
Display NQA server status
display nqa server status [ | { begin |
exclude | include } regular-expression ]
Remarks
Available in any view
Configuring NQA examples
Configuring ICMP echo test example
Network requirements
As shown in Figure 7, configure NQA ICMP echo tests to test whether the NQA client (Device A) can
send packets through a specified next hop to a specified destination (Device B) and test the round-trip
time of the packets.
Figure 7 Network diagram for ICMP echo tests
Device C
10.1.1.2/24
10.2.2.1/24
NQA client
10.1.1.1/24
10.2.2.2/24
10.3.1.1/24
10.4.1.2/24
Device A
Device B
10.4.1.1/24
10.3.1.2/24
Device D
34
Configuration procedure
NOTE:
Before you make the configuration, make sure the devices can reach each other.
# Create an ICMP echo test group and specify 10.2.2.2 as the destination IP address for ICMP echo
requests to be sent.
<DeviceA> system-view
[DeviceA] nqa entry admin test
[DeviceA-nqa-admin-test] type icmp-echo
[DeviceA-nqa-admin-test-icmp-echo] destination ip 10.2.2.2
# Configure 10.1.1.2 as the next hop IP address for ICMP echo requests. The ICMP echo requests are
sent to Device C to Device B (the destination).
[DeviceA-nqa-admin-test-icmp-echo] next-hop 10.1.1.2
# Configure the device to perform 10 probe operations per test, perform tests at an interval of 5000
milliseconds. Set the NQA probe timeout time as 500 milliseconds.
[DeviceA-nqa-admin-test-icmp-echo] probe count 10
[DeviceA-nqa-admin-test-icmp-echo] probe timeout 500
[DeviceA-nqa-admin-test-icmp-echo] frequency 5000
# Enable the saving of history records and configure the maximum number of history records that can be
saved for a test group.
[DeviceA-nqa-admin-test-icmp-echo] history-record enable
[DeviceA-nqa-admin-test-icmp-echo] history-record number 10
[DeviceA-nqa-admin-test-icmp-echo] quit
# Start ICMP echo tests.
[DeviceA] nqa schedule admin test start-time now lifetime forever
# Stop the ICMP echo tests after a period of time.
[DeviceA] undo nqa schedule admin test
# Display the results of the last ICMP echo test.
[DeviceA] display nqa result admin test
NQA entry (admin admin, tag test) test results:
Destination IP address: 10.2.2.2
Send operation times: 10
Receive response times: 10
Min/Max/Average round trip time: 2/5/3
Square-Sum of round trip time: 96
Last succeeded probe time: 2007-08-23 15:00:01.2
Extended results:
Packet loss in test: 0%
Failures due to timeout: 0
Failures due to disconnect: 0
Failures due to no connection: 0
Failures due to sequence error: 0
Failures due to internal error: 0
Failures due to other errors: 0
Packet(s) arrived late: 0
35
# Display the history of ICMP echo tests.
[DeviceA] display nqa history admin test
NQA entry (admin admin, tag test) history record(s):
Index
Response
Status
Time
370
3
Succeeded
2007-08-23 15:00:01.2
369
3
Succeeded
2007-08-23 15:00:01.2
368
3
Succeeded
2007-08-23 15:00:01.2
367
5
Succeeded
2007-08-23 15:00:01.2
366
3
Succeeded
2007-08-23 15:00:01.2
365
3
Succeeded
2007-08-23 15:00:01.2
364
3
Succeeded
2007-08-23 15:00:01.1
363
2
Succeeded
2007-08-23 15:00:01.1
362
3
Succeeded
2007-08-23 15:00:01.1
361
2
Succeeded
2007-08-23 15:00:01.1
Configuring DHCP test example
Network requirements
As shown in Figure 8, configure NQA DHCP tests to test the time required for Device A to obtain an IP
address from the DHCP server (Device B).
Figure 8 Network diagram for DHCP test
Configuration procedure
# Create a DHCP test group and specify interface VLAN-interface 2 to perform NQA DHCP tests.
<DeviceA> system-view
[DeviceA] nqa entry admin test
[DeviceA-nqa-admin-test] type dhcp
[DeviceA-nqa-admin-test-dhcp] operation interface vlan-interface 2
# Enable the saving of history records.
[DeviceA-nqa-admin-test-dhcp] history-record enable
[DeviceA-nqa-admin-test-dhcp] quit
# Start DHCP tests.
[DeviceA] nqa schedule admin test start-time now lifetime forever
# Stop DHCP tests after a period of time.
[DeviceA] undo nqa schedule admin test
# Display the result of the last DHCP test.
[DeviceA] display nqa result admin test
NQA entry (admin admin, tag test) test results:
Send operation times: 1
Receive response times: 1
Min/Max/Average round trip time: 624/624/624
Square-Sum of round trip time: 389376
36
Last succeeded probe time: 2007-11-22 09:56:03.2
Extended results:
Packet loss in test: 0%
Failures due to timeout: 0
Failures due to disconnect: 0
Failures due to no connection: 0
Failures due to sequence error: 0
Failures due to internal error: 0
Failures due to other errors: 0
Packet(s) arrived late: 0
# Display the history of DHCP tests.
[DeviceA] display nqa history admin test
NQA entry (admin admin, tag test) history record(s):
Index
Response
Status
Time
1
624
Succeeded
2007-11-22 09:56:03.2
Configuring DNS test example
Network requirements
As shown in Figure 9, configure NQA DNS tests to test whether Device A can translate the domain
name host.com into an IP address through the DNS server and test the time required for resolution.
Figure 9 Network diagram for DNS tests
Configuration procedure
NOTE:
Before you make the configuration, make sure the devices can reach each other.
# Create a DNS test group.
<DeviceA> system-view
[DeviceA] nqa entry admin test
[DeviceA-nqa-admin-test] type dns
# Specify the IP address of the DNS server 10.2.2.2 as the destination address for DNS tests, and
specify the domain name that needs to be translated as host.com.
[DeviceA-nqa-admin-test-dns] destination ip 10.2.2.2
[DeviceA-nqa-admin-test-dns] resolve-target host.com
# Enable the saving of history records.
[DeviceA-nqa-admin-test-dns] history-record enable
[DeviceA-nqa-admin-test-dns] quit
# Start DNS tests.
[DeviceA] nqa schedule admin test start-time now lifetime forever
37
# Stop the DNS tests after a period of time.
[DeviceA] undo nqa schedule admin test
# Display the results of the last DNS test.
[DeviceA] display nqa result admin test
NQA entry (admin admin, tag test) test results:
Destination IP address: 10.2.2.2
Send operation times: 1
Receive response times: 1
Min/Max/Average round trip time: 62/62/62
Square-Sum of round trip time: 3844
Last succeeded probe time: 2008-11-10 10:49:37.3
Extended results:
Packet loss in test: 0%
Failures due to timeout: 0
Failures due to disconnect: 0
Failures due to no connection: 0
Failures due to sequence error: 0
Failures due to internal error: 0
Failures due to other errors: 0
Packet(s) arrived late: 0
# Display the history of DNS tests.
[DeviceA] display nqa history admin test
NQA entry (admin admin, tag test) history record(s):
Index
Response
Status
Time
1
62
Succeeded
2008-11-10 10:49:37.3
Configuring FTP test example
Network requirements
As shown in Figure 10, configure NQA FTP tests to test the connection with a specified FTP server and
the time required for Device A to upload a file to the FTP server. The login username is admin, the login
password is systemtest, and the file to be transferred to the FTP server is config.txt.
Figure 10 Network diagram for FTP tests
Configuration procedure
NOTE:
Before you make the configuration, make sure the devices can reach each other.
# Create an FTP test group.
<DeviceA> system-view
[DeviceA] nqa entry admin test
[DeviceA-nqa-admin-test] type ftp
38
# Specify the IP address of the FTP server 10.2.2.2 as the destination IP address for FTP tests.
[DeviceA-nqa-admin-test-ftp] destination ip 10.2.2.2
# Specify 10.1.1.1 as the source IP address for probe packets.
[DeviceA-nqa-admin-test-ftp] source ip 10.1.1.1
# Set the FTP username to admin, and password to systemtest.
[DeviceA-nqa-admin-test-ftp] username admin
[DeviceA-nqa-admin-test-ftp] password systemtest
# Configure the device to upload file config.txt to the FTP server for each probe operation.
[DeviceA-nqa-admin-test-ftp] operation put
[DeviceA-nqa-admin-test-ftp] filename config.txt
# Enable the saving of history records.
[DeviceA-nqa-admin-test-ftp] history-record enable
[DeviceA-nqa-admin-test-ftp] quit
# Start FTP tests.
[DeviceA] nqa schedule admin test start-time now lifetime forever
# Stop the FTP tests after a period of time.
[DeviceA] undo nqa schedule admin test
# Display the results of the last FTP test.
[DeviceA] display nqa result admin test
NQA entry (admin admin, tag test) test results:
Destination IP address: 10.2.2.2
Send operation times: 1
Receive response times: 1
Min/Max/Average round trip time: 173/173/173
Square-Sum of round trip time: 29929
Last succeeded probe time: 2007-11-22 10:07:28.6
Extended results:
Packet loss in test: 0%
Failures due to timeout: 0
Failures due to disconnect: 0
Failures due to no connection: 0
Failures due to sequence error: 0
Failures due to internal error: 0
Failures due to other errors: 0
Packet(s) arrived late: 0
# Display the history of FTP tests.
[DeviceA] display nqa history admin test
NQA entry (admin admin, tag test) history record(s):
Index
Response
Status
Time
1
173
Succeeded
2007-11-22 10:07:28.6
Configuring HTTP test example
Network requirements
As shown in Figure 11, configure NQA HTTP tests to test the connection with a specified HTTP server
and the time required to obtain data from the HTTP server.
39
Figure 11 Network diagram for the HTTP tests
Configuration procedure
NOTE:
Before you make the configuration, make sure the devices can reach each other.
# Create an HTTP test group.
<DeviceA> system-view
[DeviceA] nqa entry admin test
[DeviceA-nqa-admin-test] type http
# Specify the IP address of the HTTP server 10.2.2.2 as the destination IP address for HTTP tests.
[DeviceA-nqa-admin-test-http] destination ip 10.2.2.2
# Configure the device to get data from the HTTP server for each HTTP probe operation. (get is the
default HTTP operation type, and this step can be omitted.)
[DeviceA-nqa-admin-test-http] operation get
# Configure HTTP tests to visit website /index.htm.
[DeviceA-nqa-admin-test-http] url /index.htm
# configure the HTTP version 1.0 to be used in HTTP tests. (Version 1.0 is the default version, and this
step can be omitted.)
[DeviceA-nqa-admin-test-http] http-version v1.0
# Enable the saving of history records.
[DeviceA-nqa-admin-test-http] history-record enable
[DeviceA-nqa-admin-test-http] quit
# Start HTTP tests.
[DeviceA] nqa schedule admin test start-time now lifetime forever
# Stop HTTP tests after a period of time.
[DeviceA] undo nqa schedule admin test
# Display results of the last HTTP test.
[DeviceA] display nqa result admin test
NQA entry (admin admin, tag test) test results:
Destination IP address: 10.2.2.2
Send operation times: 1
Receive response times: 1
Min/Max/Average round trip time: 64/64/64
Square-Sum of round trip time: 4096
Last succeeded probe time: 2007-11-22 10:12:47.9
Extended results:
Packet loss in test: 0%
Failures due to timeout: 0
Failures due to disconnect: 0
40
Failures due to no connection: 0
Failures due to sequence error: 0
Failures due to internal error: 0
Failures due to other errors:
Packet(s) arrived late: 0
# Display the history of HTTP tests.
[DeviceA] display nqa history admin test
NQA entry (admin admin, tag test) history record(s):
Index
Response
Status
Time
1
64
Succeeded
2007-11-22 10:12:47.9
Configuring UDP jitter test example
Network requirements
As shown in Figure 12, configure NQA UDP jitter tests to test the delay jitter of packet transmission
between Device A and Device B.
Figure 12 Network diagram for UDP jitter tests
Configuration procedure
NOTE:
Before you make the configuration, make sure the devices can reach each other.
1.
Configure Device B
# Enable the NQA server and configure a listening service to listen to IP address 10.2.2.2 and UDP port
9000.
<DeviceB> system-view
[DeviceB] nqa server enable
[DeviceB] nqa server udp-echo 10.2.2.2 9000
2.
Configure Device A
# Create a UDP jitter test group.
<DeviceA> system-view
[DeviceA] nqa entry admin test
[DeviceA-nqa-admin-test] type udp-jitter
# Configure UDP jitter packets to use 10.2.2.2 as the destination IP address and port 9000 as the
destination port.
[DeviceA-nqa-admin-test-udp-jitter] destination ip 10.2.2.2
[DeviceA-nqa-admin-test-udp-jitter] destination port 9000
# Configure the device to perform UDP jitter tests at an interval of 1000 milliseconds.
[DeviceA-nqa-admin-test-udp-jitter] frequency 1000
[DeviceA-nqa-admin-test-udp-jitter] quit
41
# Start UDP jitter tests.
[DeviceA] nqa schedule admin test start-time now lifetime forever
# Stop UDP jitter tests after a period of time.
[DeviceA] undo nqa schedule admin test
# Display the result of the last UDP jitter test.
[DeviceA] display nqa result admin test
NQA entry (admin admin, tag test) test results:
Destination IP address: 10.2.2.2
Send operation times: 10
Receive response times: 10
Min/Max/Average round trip time: 15/32/17
Square-Sum of round trip time: 3235
Last succeeded probe time: 2008-05-29 13:56:17.6
Extended results:
Packet loss in test: 0%
Failures due to timeout: 0
Failures due to disconnect: 0
Failures due to no connection: 0
Failures due to sequence error: 0
Failures due to internal error: 0
Failures due to other errors: 0
Packet(s) arrived late: 0
UDP-jitter results:
RTT number: 10
Min positive SD: 4
Min positive DS: 1
Max positive SD: 21
Max positive DS: 28
Positive SD number: 5
Positive DS number: 4
Positive SD sum: 52
Positive DS sum: 38
Positive SD average: 10
Positive DS average: 10
Positive SD square sum: 754
Positive DS square sum: 460
Min negative SD: 1
Min negative DS: 6
Max negative SD: 13
Max negative DS: 22
Negative SD number: 4
Negative DS number: 5
Negative SD sum: 38
Negative DS sum: 52
Negative SD average: 10
Negative DS average: 10
Negative SD square sum: 460
Negative DS square sum: 754
One way results:
Max SD delay: 15
Max DS delay: 16
Min SD delay: 7
Min DS delay: 7
Number of SD delay: 10
Number of DS delay: 10
Sum of SD delay: 78
Sum of DS delay: 85
Square sum of SD delay: 666
Square sum of DS delay: 787
SD lost packet(s): 0
DS lost packet(s): 0
Lost packet(s) for unknown reason: 0
# Display the statistics of UDP jitter tests.
[DeviceA] display nqa statistics admin test
NQA entry (admin admin, tag test) test statistics:
NO. : 1
42
Destination IP address: 10.2.2.2
Start time: 2008-05-29 13:56:14.0
Life time: 47 seconds
Send operation times: 410
Receive response times: 410
Min/Max/Average round trip time: 1/93/19
Square-Sum of round trip time: 206176
Extended results:
Packet loss in test: 0%
Failures due to timeout: 0
Failures due to disconnect: 0
Failures due to no connection: 0
Failures due to sequence error: 0
Failures due to internal error: 0
Failures due to other errors: 0
Packet(s) arrived late: 0
UDP-jitter results:
RTT number: 410
Min positive SD: 3
Max positive SD: 30
Min positive DS: 1
Max positive DS: 79
Positive SD number: 186
Positive DS number: 158
Positive SD sum: 2602
Positive DS sum: 1928
Positive SD average: 13
Positive DS average: 12
Positive SD square sum: 45304
Positive DS square sum: 31682
Min negative SD: 1
Min negative DS: 1
Max negative SD: 30
Max negative DS: 78
Negative SD number: 181
Negative DS number: 209
Negative SD sum: 181
Negative DS sum: 209
Negative SD average: 13
Negative DS average: 14
Negative SD square sum: 46994
Negative DS square sum: 3030
One way results:
Max SD delay: 46
Max DS delay: 46
Min SD delay: 7
Min DS delay: 7
Number of SD delay: 410
Number of DS delay: 410
Sum of SD delay: 3705
Sum of DS delay: 3891
Square sum of SD delay: 45987
Square sum of DS delay: 49393
SD lost packet(s): 0
DS lost packet(s): 0
Lost packet(s) for unknown reason: 0
NOTE:
The display nqa history command does not show the results of UDP jitter tests. To know the result of a
UDP jitter test, use the display nqa result command to view the probe results of the latest NQA test, or
use the display nqa statistics command to view the statistics of NQA tests.
43
Configuring SNMP test example
Network requirements
As shown in Figure 13, configure NQA SNMP tests to test the time it takes for Device A to send an
SNMP query packet to the SNMP agent and receive a response packet.
Figure 13 Network diagram for SNMP tests
Configuration procedure
NOTE:
Before you make the configuration, make sure the devices can reach each other.
1.
Configurations on SNMP agent (Device B)
# Enable the SNMP agent service and set the SNMP version to all, the read community to public, and
the write community to private.
<DeviceB> system-view
[DeviceB] snmp-agent sys-info version all
[DeviceB] snmp-agent community read public
[DeviceB] snmp-agent community write private
2.
Configurations on Device A
# Create an SNMP test group and configure SNMP packets to use 10.2.2.2 as their destination IP
address.
<DeviceA> system-view
[DeviceA] nqa entry admin test
[DeviceA-nqa-admin-test] type snmp
[DeviceA-nqa-admin-test-snmp] destination ip 10.2.2.2
# Enable the saving of history records.
[DeviceA-nqa-admin-test-snmp] history-record enable
[DeviceA-nqa-admin-test-snmp] quit
# Start SNMP tests.
[DeviceA] nqa schedule admin test start-time now lifetime forever
# Stop the SNMP tests after a period of time.
[DeviceA] undo nqa schedule admin test
# Display the results of the last SNMP test.
[DeviceA] display nqa result admin test
NQA entry (admin admin, tag test) test results:
Destination IP address: 10.2.2.2
Send operation times: 1
Receive response times: 1
Min/Max/Average round trip time: 50/50/50
Square-Sum of round trip time: 2500
44
Last succeeded probe time: 2007-11-22 10:24:41.1
Extended results:
Packet loss in test: 0%
Failures due to timeout: 0
Failures due to disconnect: 0
Failures due to no connection: 0
Failures due to sequence error: 0
Failures due to internal error: 0
Failures due to other errors: 0
Packet(s) arrived late: 0
# Display the history of SNMP tests.
[DeviceA] display nqa history admin test
NQA entry (admin admin, tag test) history record(s):
Index
Response
Status
Time
1
50
Timeout
2007-11-22 10:24:41.1
Configuring TCP test example
Network requirements
As shown in Figure 14, configure NQA TCP tests to test the time for establishing a TCP connection
between Device A and Device B.
Figure 14 Network diagram for TCP tests
Configuration procedure
NOTE:
Before you make the configuration, make sure the devices can reach each other.
1.
Configure Device B
# Enable the NQA server and configure a listening service to listen to IP address 10.2.2.2 and TCP port
9000.
<DeviceB> system-view
[DeviceB] nqa server enable
[DeviceB] nqa server tcp-connect 10.2.2.2 9000
2.
Configure Device A
# Create a TCP test group.
<DeviceA> system-view
[DeviceA] nqa entry admin test
[DeviceA-nqa-admin-test] type tcp
# Configure TCP probe packets to use 10.2.2.2 as the destination IP address and port 9000 as the
destination port.
45
[DeviceA-nqa-admin-test-tcp] destination ip 10.2.2.2
[DeviceA-nqa-admin-test-tcp] destination port 9000
# Enable the saving of history records.
[DeviceA-nqa-admin-test-tcp] history-record enable
[DeviceA-nqa-admin-test-tcp] quit
# Start TCP tests.
[DeviceA] nqa schedule admin test start-time now lifetime forever
# Stop the TCP tests after a period of time.
[DeviceA] undo nqa schedule admin test
# Display the results of the last TCP test.
[DeviceA] display nqa result admin test
NQA entry (admin admin, tag test) test results:
Destination IP address: 10.2.2.2
Send operation times: 1
Receive response times: 1
Min/Max/Average round trip time: 13/13/13
Square-Sum of round trip time: 169
Last succeeded probe time: 2007-11-22 10:27:25.1
Extended results:
Packet loss in test: 0%
Failures due to timeout: 0
Failures due to disconnect: 0
Failures due to no connection: 0
Failures due to sequence error: 0
Failures due to internal error: 0
Failures due to other errors: 0
Packet(s) arrived late: 0
# Display the history of TCP tests.
[DeviceA] display nqa history admin test
NQA entry (admin admin, tag test) history record(s):
Index
Response
1
13
Status
Time
Succeeded
2007-11-22 10:27:25.1
Configuring UDP echo test example
Network requirements
As shown in Figure 15, configure NQA UDP echo tests to test the round-trip time between Device A and
Device B. The destination port number is 8000.
Figure 15 Network diagram for the UDP echo tests
46
Configuration procedure
NOTE:
Before you make the configuration, make sure the devices can reach each other.
1.
Configure Device B
# Enable the NQA server and configure a listening service to listen to IP address 10.2.2.2 and UDP port
8000.
<DeviceB> system-view
[DeviceB] nqa server enable
[DeviceB] nqa server udp-echo 10.2.2.2 8000
2.
Configure Device A
# Create a UDP echo test group.
<DeviceA> system-view
[DeviceA] nqa entry admin test
[DeviceA-nqa-admin-test] type udp-echo
# Configure UDP packets to use 10.2.2.2 as the destination IP address and port 8000 as the destination
port.
[DeviceA-nqa-admin-test-udp-echo] destination ip 10.2.2.2
[DeviceA-nqa-admin-test-udp-echo] destination port 8000
# Enable the saving of history records.
[DeviceA-nqa-admin-test-udp-echo] history-record enable
[DeviceA-nqa-admin-test-udp-echo] quit
# Start UDP echo tests.
[DeviceA] nqa schedule admin test start-time now lifetime forever
# Stop UDP echo tests after a period of time.
[DeviceA] undo nqa schedule admin test
# Display the results of the last UDP echo test.
[DeviceA] display nqa result admin test
NQA entry (admin admin, tag test) test results:
Destination IP address: 10.2.2.2
Send operation times: 1
Receive response times: 1
Min/Max/Average round trip time: 25/25/25
Square-Sum of round trip time: 625
Last succeeded probe time: 2007-11-22 10:36:17.9
Extended results:
Packet loss in test: 0%
Failures due to timeout: 0
Failures due to disconnect: 0
Failures due to no connection: 0
Failures due to sequence error: 0
Failures due to internal error: 0
Failures due to other errors: 0
Packet(s) arrived late: 0
47
# Display the history of UDP echo tests.
[DeviceA] display nqa history admin test
NQA entry (admin admin, tag test) history record(s):
Index
Response
Status
Time
1
25
Succeeded
2007-11-22 10:36:17.9
Configuring voice test example
Network requirements
As shown in Figure 16, configure NQA voice tests to test the delay jitter of voice packet transmission
and voice quality between Device A and Device B.
Figure 16 Network diagram for voice tests
Configuration procedure
NOTE:
Before you make the configuration, make sure the devices can reach each other.
1.
Configure Device B
# Enable the NQA server and configure a listening service to listen to IP address 10.2.2.2 and UDP port
9000.
<DeviceB> system-view
[DeviceB] nqa server enable
2.
[DeviceB] nqa server udp-echo 10.2.2.2 9000
3.
Configure Device A
# Create a voice test group.
<DeviceA> system-view
[DeviceA] nqa entry admin test
[DeviceA-nqa-admin-test] type voice
# Configure voice probe packets to use 10.2.2.2 as the destination IP address and port 9000 as the
destination port.
[DeviceA-nqa-admin-test-voice] destination ip 10.2.2.2
[DeviceA-nqa-admin-test-voice] destination port 9000
[DeviceA-nqa-admin-test-voice] quit
# Start voice tests.
[DeviceA] nqa schedule admin test start-time now lifetime forever
# Stop the voice tests after a period of time.
[DeviceA] undo nqa schedule admin test
# Display the result of the last voice test.
[DeviceA] display nqa result admin test
48
NQA entry (admin admin, tag test) test results:
Destination IP address: 10.2.2.2
Send operation times: 1000
Receive response times: 1000
Min/Max/Average round trip time: 31/1328/33
Square-Sum of round trip time: 2844813
Last succeeded probe time: 2008-06-13 09:49:31.1
Extended results:
Packet loss in test: 0%
Failures due to timeout: 0
Failures due to disconnect: 0
Failures due to no connection: 0
Failures due to sequence error: 0
Failures due to internal error: 0
Failures due to other errors: 0
Packet(s) arrived late: 0
Voice results:
RTT number: 1000
Min positive SD: 1
Max positive SD: 204
Min positive DS: 1
Max positive DS: 1297
Positive SD number: 257
Positive DS number: 259
Positive SD sum: 759
Positive DS sum: 1797
Positive SD average: 2
Positive DS average: 6
Positive SD square sum: 54127
Positive DS square sum: 1691967
Min negative SD: 1
Min negative DS: 1
Max negative SD: 203
Max negative DS: 1297
Negative SD number: 255
Negative DS number: 259
Negative SD sum: 759
Negative DS sum: 1796
Negative SD average: 2
Negative DS average: 6
Negative SD square sum: 53655
Negative DS square sum: 1691776
One way results:
Max SD delay: 343
Max DS delay: 985
Min SD delay: 343
Min DS delay: 985
Number of SD delay: 1
Number of DS delay: 1
Sum of SD delay: 343
Sum of DS delay: 985
Square sum of SD delay: 117649
Square sum of DS delay: 970225
SD lost packet(s): 0
DS lost packet(s): 0
Lost packet(s) for unknown reason: 0
Voice scores:
MOS value: 4.38
ICPIF value: 0
# Display the statistics of voice tests.
[DeviceA] display nqa statistics admin test
NQA entry (admin admin, tag test) test statistics:
NO. : 1
Destination IP address: 10.2.2.2
Start time: 2008-06-13 09:45:37.8
Life time: 331 seconds
Send operation times: 4000
Receive response times: 4000
Min/Max/Average round trip time: 15/1328/32
49
Square-Sum of round trip time: 7160528
Extended results:
Packet loss in test: 0%
Failures due to timeout: 0
Failures due to disconnect: 0
Failures due to no connection: 0
Failures due to sequence error: 0
Failures due to internal error: 0
Failures due to other errors: 0
Packet(s) arrived late: 0
Voice results:
RTT number: 4000
Min positive SD: 1
Max positive SD: 360
Min positive DS: 1
Max positive DS: 1297
Positive SD number: 1030
Positive DS number: 1024
Positive SD sum: 4363
Positive DS sum: 5423
Positive SD average: 4
Positive DS average: 5
Positive SD square sum: 497725
Positive DS square sum: 2254957
Min negative SD: 1
Min negative DS: 1
Max negative SD: 360
Max negative DS: 1297
Negative SD number: 1028
Negative DS number: 1022
Negative SD sum: 1028
Negative DS sum: 1022
Negative SD average: 4
Negative DS average: 5
Negative SD square sum: 495901
Negative DS square sum: 5419
One way results:
Max SD delay: 359
Max DS delay: 985
Min SD delay: 0
Min DS delay: 0
Number of SD delay: 4
Number of DS delay: 4
Sum of SD delay: 1390
Sum of DS delay: 1079
Square sum of SD delay: 483202
Square sum of DS delay: 973651
SD lost packet(s): 0
DS lost packet(s): 0
Lost packet(s) for unknown reason: 0
Voice scores:
Max MOS value: 4.38
Min MOS value: 4.38
Max ICPIF value: 0
Min ICPIF value: 0
NOTE:
The display nqa history command cannot show you the results of voice tests. To know the result of a
voice test, use the display nqa result command to view the probe results of the latest NQA test, or use
the display nqa statistics command to view the statistics of NQA tests.
50
Configuring DLSw test example
Network requirements
As shown in Figure 17, configure NQA DLSw tests to check the response time of the DLSw device.
Figure 17 Network diagram for the DLSw tests
Configuration procedure
NOTE:
Before you make the configuration, make sure the devices can reach each other.
# Create a DLSw test group and configure DLSw probe packets to use 10.2.2.2 as the destination IP
address.
<DeviceA> system-view
[DeviceA] nqa entry admin test
[DeviceA-nqa-admin-test] type dlsw
[DeviceA-nqa-admin-test-dlsw] destination ip 10.2.2.2
# Enable the saving of history records.
[DeviceA-nqa-admin-test-dlsw] history-record enable
[DeviceA-nqa-admin-test-dlsw] quit
# Start DLSw tests.
[DeviceA] nqa schedule admin test start-time now lifetime forever
# Stop the DLSw tests after a period of time.
[DeviceA] undo nqa schedule admin test
# Display the result of the last DLSw test.
[DeviceA] display nqa result admin test
NQA entry (admin admin, tag test) test results:
Destination IP address: 10.2.2.2
Send operation times: 1
Receive response times: 1
Min/Max/Average round trip time: 19/19/19
Square-Sum of round trip time: 361
Last succeeded probe time: 2007-11-22 10:40:27.7
Extended results:
Packet loss in test: 0%
Failures due to timeout: 0
Failures due to disconnect: 0
Failures due to no connection: 0
Failures due to sequence error: 0
Failures due to internal error: 0
Failures due to other errors: 0
51
Packet(s) arrived late: 0
# Display the history of DLSw tests.
[DeviceA] display nqa history admin test
NQA entry (admin admin, tag test) history record(s):
Index
Response
Status
Time
1
19
Succeeded
2007-11-22 10:40:27.7
Configuring NQA collaboration example
Network requirements
As shown in Figure 18, configure a static route to Device C on Device A, with Device B as the next hop.
Associate the static route, track entry, and NQA test group to verify whether static route is active in real
time.
Figure 18 Network diagram for NQA collaboration configuration example
Device B
Vlan-int3
10.2.1.1/24
Vlan-int3
10.2.1.2/24
Vlan-int2
10.1.1.1/24
Vlan-int2
10.1.1.2/24
Device A
Device C
Configuration procedure
1.
Assign each interface an IP address. (Omitted)
2.
On Device A, configure a unicast static route and associate the static route with a track entry.
# Configure a static route, whose destination address is 10.2.1.1, and associate the static route with
track entry 1.
<DeviceA> system-view
[DeviceA] ip route-static 10.1.1.2 24 10.2.1.1 track 1
3.
On Device A, create an NQA test group.
# Create an NQA test group with the administrator name being admin and operation tag being test.
[DeviceA] nqa entry admin test
# Configure the test type of the NQA test group as ICMP echo.
[DeviceA-nqa-admin-test] type icmp-echo
# Configure ICMP echo requests to use 10.2.1.1 as their destination IP address.
[DeviceA-nqa-admin-test-icmp-echo] destination ip 10.2.1.1
# Configure the device to perform tests at an interval of 100 milliseconds.
[DeviceA-nqa-admin-test-icmp-echo] frequency 100
# Create reaction entry 1. If the number of consecutive probe failures reaches 5, collaboration with
other modules is triggered.
[DeviceA-nqa-admin-test-icmp-echo] reaction 1 checked-element probe-fail threshold-type
consecutive 5 action-type trigger-only
52
[DeviceA-nqa-admin-test-icmp-echo] quit
# Configure the test start time and test duration for the test group.
[DeviceA] nqa schedule admin test start-time now lifetime forever
4.
On Device A, create the track entry.
# Create track entry 1 to associate it with Reaction entry 1 of the NQA test group (admin-test).
[DeviceA] track 1 nqa entry admin test reaction 1
5.
Verify the configuration.
# On Device A, display information about all track entries.
[DeviceA] display track all
Track ID: 1
Status: Positive
Notification delay: Positive 0, Negative 0 (in seconds)
Reference object:
NQA entry: admin test
Reaction: 1
# Display brief information about active routes in the routing table on Device A.
[DeviceA] display ip routing-table
[DeviceA] display ip routing-table
Routing Tables: Public
Destinations : 5
Destination/Mask
Routes : 5
Proto
Pre
Cost
NextHop
10.1.1.0/24
Static 60 0
10.2.1.1
Vlan3
10.2.1.0/24
Direct 0
0
10.2.1.2
Vlan3
10.2.1.2/32
Direct 0
0
127.0.0.1
Interface
InLoop0
127.0.0.0/8
Direct 0
0
127.0.0.1
InLoop0
127.0.0.1/32
Direct 0
0
127.0.0.1
InLoop0
The output shows that the static route with the next hop 10.2.1.1 is active, and the status of the track
entry is positive. The static route configuration works.
# Remove the IP address of VLAN-interface 3 on Device B.
<DeviceB> system-view
[DeviceB] interface vlan-interface 3
[DeviceB-Vlan-interface3] undo ip address
# On Device A, display information about all track entries.
[DeviceA] display track all
Track ID: 1
Status: Negative
Notification delay: Positive 0, Negative 0 (in seconds)
Reference object:
NQA entry: admin test
Reaction: 1
# Display brief information about active routes in the routing table on Device A.
[DeviceA] display ip routing-table
Routing Tables: Public
Destinations : 4
Routes : 4
53
Destination/Mask
Proto
10.2.1.0/24
Pre
Cost
NextHop
Interface
Direct 0
0
10.2.1.2
Vlan3
10.2.1.2/32
Direct 0
0
127.0.0.1
InLoop0
127.0.0.0/8
Direct 0
0
127.0.0.1
InLoop0
127.0.0.1/32
Direct 0
0
127.0.0.1
InLoop0
The output shows that the next hop 10.2.1.1 of the static route is not reachable, and the status of the
track entry is negative. The static route does not work.
54
Configuring NTP
Defined in RFC 1305, the NTP synchronizes timekeeping among distributed time servers and clients.
NTP runs over the UDP, using UDP port 123.
The purpose of using NTP is to keep consistent timekeeping among all clock-dependent devices within a
network so that the devices can provide diverse applications based on the consistent time.
For a local system that runs NTP, its time can be synchronized by other reference sources and can be
used as a reference source to synchronize other clocks.
NTP applications
An administrator is unable to keep time synchronized among all devices within a network by changing
the system clock on each station, because this is a huge amount of workload and cannot guarantee the
clock precision. NTP, however, allows quick clock synchronization within the entire network and it
ensures a high clock precision.
Use NTP when all devices within the network must be consistent in timekeeping, for example:
•
In analysis of the log information and debugging information collected from different devices in
network management, time must be used as reference basis.
•
All devices must use the same reference clock in a charging system.
•
To implement certain functions, such as scheduled restart of all devices within the network, all
devices must be consistent in timekeeping.
•
When multiple systems process a complex event in cooperation, these systems must use that same
reference clock to ensure the correct execution sequence.
•
For incremental backup between a backup server and clients, timekeeping must be synchronized
between the backup server and all clients.
NOTE:
• Clock stratum determines the accuracy of a server, ranging from 1 to 16. The stratum of a reference
clock ranges from 1 to 15. The clock accuracy decreases as the stratum number increases. A stratum
16 clock is in the unsynchronized state and cannot serve as a reference clock.
• The local clock of an switch cannot operate as a reference clock. It can only serve as an NTP server
after being synchronized.
NTP advantages
•
NTP uses a stratum to describe the clock precision, and is able to synchronize time among all
devices within the network.
•
NTP supports access control and MD5 authentication.
•
NTP can unicast, multicast, or broadcast protocol messages.
55
How NTP works
Figure 19 shows the basic workflow of NTP. Device A and Device B are connected over a network.
They have their own independent system clocks, which must be automatically synchronized through NTP.
For an easy understanding, assume the following conditions:
•
Prior to system clock synchronization between Device A and Device B, the clock of Device A is set
to 10:00:00 am while that of Device B is set to 11:00:00 am.
•
Device B is used as the NTP time server, and Device A synchronizes its clock to that of Device B.
•
It takes 1 second for an NTP message to travel from one device to the other.
Figure 19 Basic work flow of NTP
System clock synchronization includes the following process:
•
Device A sends Device B an NTP message, which is time stamped when it leaves Device A. The
time stamp is 10:00:00 am (T1).
•
When this NTP message arrives at Device B, it is time stamped by Device B. The timestamp is
11:00:01 am (T2).
•
When the NTP message leaves Device B, Device B timestamps it. The timestamp is 11:00:02 am
(T3).
•
When Device A receives the NTP message, the local time of Device A is 10:00:03 am (T4).
Up to now, Device A has sufficient information to calculate the following important parameters:
•
The roundtrip delay of NTP message: Delay = (T4–T1) – (T3-T2) = 2 seconds.
•
Time difference between Device A and Device B: Offset = ((T2-T1) + (T3-T4))/2 = 1 hour.
Based on these parameters, Device A can synchronize its own clock to the clock of Device B.
This is only a rough description of the work mechanism of NTP. For more information, see RFC 1305.
56
NTP message format
NTP uses two types of messages, clock synchronization message and NTP control message. An NTP
control message is used in environments where network management is needed. Because it is not a must
for clock synchronization, it is not described in this document.
NOTE:
All NTP messages mentioned in this document refer to NTP clock synchronization messages.
A clock synchronization message is encapsulated in a UDP message, in the format shown in Figure 20.
Figure 20 Clock synchronization message format
The following main fields are described below:
•
LI (Leap Indicator)—2-bit leap indicator. When set to 11, it warns of an alarm condition (clock
unsynchronized); when set to any other value, it is not to be processed by NTP.
•
VN (Version Number)—3-bit version number that indicates the version of NTP. The latest version is
version 3.
•
Mode—3-bit code that indicates the work mode of NTP. This field can be set to these values: 0 –
reserved; 1 – symmetric active; 2 – symmetric passive; 3 – client; 4 – server; 5 – broadcast or
multicast; 6 – NTP control message; 7 – reserved for private use.
•
Stratum—8-bit integer that indicates the stratum level of the local clock, with the value ranging from
1 to 16. The clock precision decreases from stratum 1 through stratum 16. A stratum 1 clock has
the highest precision, and a stratum 16 clock is not synchronized and cannot be used as a
reference clock.
•
Poll—8-bit signed integer that indicates the poll interval, namely the maximum interval between
successive messages.
•
Precision—8-bit signed integer that indicates the precision of the local clock.
57
•
Root Delay—Roundtrip delay to the primary reference source.
•
Root Dispersion—Maximum error of the local clock relative to the primary reference source.
•
Reference Identifier—Identifier of the particular reference source.
•
Reference Timestamp—Local time at which the local clock was last set or corrected.
•
Originate Timestamp—Local time at which the request departed from the client for the service host.
•
Receive Timestamp—Local time at which the request arrived at the service host.
•
Transmit Timestamp—Local time at which the reply departed from the service host for the client.
•
Authenticator—Authentication information.
NTP operation modes
Devices that run NTP can implement clock synchronization in one of the following modes:
•
Client/server mode
•
Symmetric peers mode
•
Broadcast mode
•
Multicast mode
You can select operation modes of NTP as needed. If the IP address of the NTP server or peer is
unknown and many devices in the network must be synchronized, adopt the broadcast or multicast
mode; while in the client/server and symmetric peer modes, a device is synchronized from the specified
server or peer, and clock reliability is enhanced.
Client/server mode
Figure 21 Client/server mode
Client
Server
Network
Clock
synchronization (Mode3)
Performs clock filtering and
selection, and synchronizes its
local clock to that of the
optimal reference source
Automatically works in
client/server mode and
sends a reply
message
Reply
( Mode4)
When working in client/server mode, a client sends a clock synchronization message to servers, with
the mode field in the message set to 3 (client mode). Upon receiving the message, the servers
automatically work in server mode and send a reply, with the Mode field in the messages set to 4 (server
mode). Upon receiving the replies from the servers, the client performs clock filtering and selection, and
synchronizes its local clock to that of the optimal reference source.
In client/server mode, a client can be synchronized to a server, but not vice versa.
58
Symmetric peers mode
Figure 22 Symmetric peers mode
Client
Server
Network
Clock
synchronization (Mode3)
Performs clock filtering and
selection, and synchronizes its
local clock to that of the
optimal reference source
Automatically works in
client/server mode and
sends a reply
message
Reply
( Mode4)
In symmetric peers mode, devices that work in symmetric active mode and symmetric passive mode
exchange NTP messages with the Mode field 3 (client mode) and 4 (server mode). Then the device that
works in symmetric active mode periodically sends clock synchronization messages, with the Mode field
in the messages set to 1 (symmetric active); the device that receives the messages automatically enters
symmetric passive mode and sends a reply, with the Mode field in the message set to 2 (symmetric
passive). By exchanging messages, the symmetric peer mode is established between the two devices.
Then, the two devices can synchronize, or be synchronized by each other. If the clocks of both devices
have been synchronized, the device whose local clock has a lower stratum level synchronizes the clock
of the other device.
Broadcast mode
Figure 23 Broadcast mode
In broadcast mode, a server periodically sends clock synchronization messages to broadcast address
255.255.255.255, with the Mode field in the messages set to 5 (broadcast mode). Clients listen to the
broadcast messages from servers. When a client receives the first broadcast message, the client and the
server start to exchange messages, with the Mode field set to 3 (client mode) and 4 (server mode) to
calculate the network delay between client and the server. Then, the client enters the broadcast client
mode and continues listening to broadcast messages, and synchronizes its local clock based on the
received broadcast messages.
59
Multicast mode
Figure 24 Multicast mode
In multicast mode, a server periodically sends clock synchronization messages to the user-configured
multicast address, or, if no multicast address is configured, to the default NTP multicast address
224.0.1.1, with the Mode field in the messages set to 5 (multicast mode). Clients listen to the multicast
messages from servers. When a client receives the first multicast message, the client and the server start
to exchange messages, with the Mode field set to 3 (client mode) and 4 (server mode) to calculate the
network delay between client and the server. Then, the client enters multicast client mode and continues
listening to multicast messages, and synchronizes its local clock based on the received multicast
messages.
NOTE:
In symmetric peers mode, broadcast mode and multicast mode, the client (the symmetric active peer)
and the server (the symmetric passive peer) can only work in the specified NTP working mode after they
exchange NTP messages with the Mode field being 3 (client mode) and the Mode field being 4 (server
mode). During this message exchange process, NTP clock synchronization can be implemented.
Multiple instances of NTP
The client/server mode and symmetric mode support multiple instances of NTP and support clock
synchronization within an MPLS VPN network. Network devices—CEs and PEs—at different physical
location can get their clocks synchronized through NTP, as long as they are in the same VPN. The
following functions are available:
•
NTP client on a CE can be synchronized to the NTP server on another CE.
•
NTP client on a CE can be synchronized to the NTP server on a PE.
•
NTP client on a PE can be synchronized to the NTP server on a CE through a designated VPN
instance.
•
NTP client on a PE can be synchronized to the NTP server on another PE through a designated
VPN instance.
•
NTP server on a PE can synchronize the NTP clients on multiple CEs in different VPNs.
60
NOTE:
• A CE is a device that has an interface directly connecting to the SP. A CE is not “aware of” the
presence of the VPN.
• A PE is a device directly connecting to CEs. In an MPLS network, all events related to VPN processing
occur on the PE.
NTP configuration task list
Complete the following tasks to configure NTP:
Task
Remarks
Configuring the operation modes of NTP
Required
Configuring optional parameters of NTP
Optional
Configuring access-control rights
Optional
Configuring NTP authentication
Optional
Configuring the operation modes of NTP
Devices can implement clock synchronization in one of the following modes:
•
Client/server mode
•
Symmetric mode
•
Broadcast mode
•
Multicast mode
For the client/server mode or symmetric mode, you must configure only clients or symmetric-active peers;
for the broadcast or multicast mode, you must configure both servers and clients.
NOTE:
A single device can have a maximum of 128 associations at the same time, including static
associations and dynamic associations.
• A static association refers to an association that a user has manually created by using an NTP
command.
• A dynamic association is a temporary association created by the system during operation. A dynamic
association is removed if the system fails to receive messages from it over a specific long time.
In client/server mode, for example, when you execute a command to synchronize the time to a server,
the system creates a static association, and the server just responds passively upon the receipt of a
message, rather than creating an association (static or dynamic). In symmetric mode, static associations
are created at the symmetric-active peer side, and dynamic associations are created at the symmetricpassive peer side. In broadcast or multicast mode, static associations are created at the server side, and
dynamic associations are created at the client side.
Configuring NTP client/server mode
For devices working in client/server mode, make configurations on the clients, but not on the servers.
61
To configure an NTP client:
To do…
Use the command…
Remarks
1. Enter system view.
system-view
—
2. Specify an NTP server for the
device.
ntp-service unicast-server [ vpninstance vpn-instance-name ] { ipaddress | server-name } [
authentication-keyid keyid |
priority | source-interface
interface-type interface-number |
version number ] *
Required.
No NTP server is specified by
default.
NOTE:
• In the ntp-service unicast-server command, ip-address must be a unicast address, rather than a
broadcast address, a multicast address or the IP address of the local clock.
• When the source interface for NTP messages is specified by the source-interface argument, the
source IP address of the NTP messages is configured as the primary IP address of the specified
interface.
• A device can only act as a server to synchronize the clock of other devices after its clock has been
synchronized. If the clock of a server has a stratum level higher than or equal to that of a client’s
clock, the client will not synchronize its clock to the server’s.
• You can configure multiple servers by repeating the ntp-service unicast-server command. The clients
will select the optimal reference source.
Configuring the NTP symmetric peers mode
For devices working in the symmetric mode, specify a symmetric-passive peer on a symmetric-active
peer.
To configure a symmetric-active device:
To do…
Use the command…
Remarks
1. Enter system view.
system-view
—
2. Specify a symmetric-passive
peer for the device.
ntp-service unicast-peer [ vpninstance vpn-instance-name ] { ipaddress | peer-name } [
authentication-keyid keyid |
priority | source-interface
interface-type interface-number |
version number ] *
62
Required.
No symmetric-passive peer is
specified by default.
NOTE:
• In symmetric mode, use any NTP configuration command in Configuring the operation modes of
NTP to enable NTP; otherwise, a symmetric-passive peer will not process NTP messages from a
symmetric-active peer.
• In the ntp-service unicast-peer command, ip-address must be a unicast address, rather than a
broadcast address, a multicast address or the IP address of the local clock.
• When the source interface for NTP messages is specified by the source-interface argument, the
source IP address of the NTP messages is configured as the primary IP address of the specified
interface.
• Typically, at least one of the symmetric-active and symmetric-passive peers has been synchronized;
otherwise, the clock synchronization will not proceed.
• You can configure multiple symmetric-passive peers by repeating the ntp-service unicast-peer
command.
Configuring NTP broadcast mode
The broadcast server periodically sends NTP broadcast messages to the broadcast address
255.255.255.255. After receiving the messages, the device working in NTP broadcast client mode
sends a reply and synchronizes its local clock.
For devices working in broadcast mode, configure both the server and clients. Because an interface
needs to be specified on the broadcast server for sending NTP broadcast messages and an interface
also needs to be specified on each broadcast client for receiving broadcast messages, the NTP
broadcast mode can only be configured in the specific interface view.
Configuring a broadcast client
To do…
Use the command…
Remarks
1. Enter system view.
system-view
—
2. Enter Layer 3 Ethernet
interface view or VLAN
interface view.
interface interface-type interfacenumber
3. Configure the device to work
in NTP broadcast client mode.
ntp-service broadcast-client
Required.
To do…
Use the command…
Remarks
1. Enter system view.
system-view
—
2. Enter Layer 3 Ethernet
interface view or VLAN
interface view.
interface interface-type interfacenumber
Enter the interface used to send
NTP broadcast messages.
3. Configure the device to work
in NTP broadcast server
mode.
ntp-service broadcast-server [
authentication-keyid keyid |
version number ] *
Required.
Required.
Enter the interface used to receive
NTP broadcast messages.
Configuring the broadcast server
63
NOTE:
A broadcast server can only synchronize broadcast clients when its clock has been synchronized.
Configuring NTP multicast mode
The multicast server periodically sends NTP multicast messages to multicast clients, which send replies
after receiving the messages and synchronize their local clocks.
For devices working in multicast mode, configure both the server and clients. The NTP multicast mode
must be configured in the specific interface view.
Configuring a multicast client
To do…
Use the command…
Remarks
1. Enter system view.
system-view
—
2. Enter Layer 3 Ethernet
interface view or VLAN
interface view.
interface interface-type interfacenumber
Enter the interface used to receive
NTP multicast messages.
3. Configure the device to work
in NTP multicast client mode.
ntp-service multicast-client [ ipaddress ]
Required.
To do…
Use the command…
Remarks
1. Enter system view.
system-view
—
2. Enter Layer 3 Ethernet
interface view or VLAN
interface view.
interface interface-type interfacenumber
Enter the interface used to send
NTP multicast message.
3. Configure the device to work
in NTP multicast server mode.
ntp-service multicast-server [ ipaddress ] [ authentication-keyid
keyid | ttl ttl-number | version
number ] *
Required.
Configuring the multicast server
NOTE:
• A multicast server can only synchronize broadcast clients when its clock has been synchronized.
• You can configure up to 1024 multicast clients, among which 128 can take effect at the same time.
Configuring optional parameters of NTP
Specifying the source interface for NTP messages
If you specify the source interface for NTP messages, the device sets the source IP address of the NTP
messages as the primary IP address of the specified interface when sending the NTP messages.
When the device responds to an NTP request received, the source IP address of the NTP response is
always the IP address of the interface that received the NTP request.
64
To specify the source interface for NTP messages:
To do…
Use the command…
Remarks
1. Enter system view.
system-view
—
Required.
2. Specify the source interface
for NTP messages.
ntp-service source-interface
interface-type interface-number
By default, no source interface is
specified for NTP messages, and
the system uses the IP address of
the interface determined by the
matching route as the source IP
address of NTP messages.
CAUTION:
• If you have specified the source interface for NTP messages in the ntp-service unicast-server or ntpservice unicast-peer command, the interface specified in the ntp-service unicast-server or ntpservice unicast-peer command serves as the source interface of NTP messages.
• If you have configured the ntp-service broadcast-server or ntp-service multicast-server command,
the source interface of the broadcast or multicast NTP messages is the interface configured with the
respective command.
• If the specified source interface for NTP messages is down, the source IP address for an NTP message
that is sent out is the primary IP address of the outgoing interface of the NTP message.
Disabling an interface from receiving NTP messages
When NTP is enabled, NTP messages can be received from all interfaces by default, and you can
disable an interface from receiving NTP messages through the following configuration.
To do…
Use the command…
Remarks
1. Enter system view.
system-view
—
2. Enter interface view.
interface interface-type interfacenumber
—
3. Disable the interface from
receiving NTP messages.
Required.
ntp-service in-interface disable
An interface is enabled to receive
NTP messages by default.
Configuring the maximum number of dynamic sessions allowed
To do…
Use the command…
Remarks
1. Enter system view.
system-view
—
2. Configure the maximum
number of dynamic sessions
allowed to be established
locally.
ntp-service max-dynamic-sessions
number
Required.
65
100 by default.
Configuring access-control rights
You can configure the NTP service access-control right to the local device. The following access control
rights are available:
•
query—Control query permitted. Permits the peer devices to perform control query to the NTP
service on the local device but does not permit a peer device to synchronize its clock to that of the
local device. The “control query” refers to query of some states of the NTP service, including alarm
information, authentication status, clock source information, and so on.
•
synchronization—Server access only. Permits a peer device to synchronize its clock to that of the
local device but does not permit the peer devices to perform control query.
•
server—Server access and query permitted. Permits the peer devices to perform synchronization
and control query to the local device but does not permit the local device to synchronize its clock to
that of a peer device.
•
peer—Full access. Permits the peer devices to perform synchronization and control query to the
local device and also permits the local device to synchronize its clock to that of a peer device.
From the highest NTP service access-control right to the lowest one are peer, server, synchronization,
and query. When a device receives an NTP request, it performs an access-control right match and uses
the first matched right.
Configuration prerequisites
Before you configure the NTP service access-control right to the local device, create and configure an
ACL associated with the access-control right. For more information about ACLs, see ACL and QoS
Configuration Guide.
Configuration procedure
To configure the NTP service access-control right to the local device:
To do…
Use the command…
Remarks
1. Enter system view.
system-view
—
2. Configure the NTP service
access-control right for a peer
device to access the local
device.
ntp-service access { peer | query
| server | synchronization } aclnumber
Required.
peer by default
NOTE:
The access-control right mechanism only provides a minimum degree of security protection for the
system running NTP. A more secure method is identity authentication.
Configuring NTP authentication
NTP authentication should be enabled for a system running NTP in a network where there is a high
security demand. It enhances the network security by means of client-server key authentication, which
prohibits a client from synchronizing with a device that has failed authentication.
66
Configuration prerequisites
The configuration of NTP authentication involves configuration tasks to be implemented on the client and
on the server.
When configuring NTP authentication:
•
For all synchronization modes, when you enable the NTP authentication feature, configure an
authentication key and specify it as a trusted key. The ntp-service authentication enable command
must work together with the ntp-service authentication-keyid command and the ntp-service reliable
authentication-keyid command. Otherwise, the NTP authentication function cannot be normally
enabled.
•
For the client/server mode or symmetric mode, associate the specified authentication key on the
client (symmetric-active peer if in the symmetric peer mode) with the NTP server (symmetric-passive
peer if in the symmetric peer mode). Otherwise, the NTP authentication feature cannot be normally
enabled.
•
For the broadcast server mode or multicast server mode, associate the specified authentication key
on the broadcast server or multicast server with the NTP server. Otherwise, the NTP authentication
feature cannot be normally enabled.
•
For the client/server mode, if the NTP authentication feature has not been enabled for the client, the
client can synchronize with the server regardless of whether the NTP authentication feature has
been enabled for the server or not. If the NTP authentication is enabled on a client, the client can
only be synchronized to a server that can provide a trusted authentication key.
•
For all synchronization modes, the server side and the client side must be consistently configured.
Configuration procedure
Configuring NTP authentication for a client
To do…
Use the command…
Remarks
1. Enter system view.
system-view
—
2. Enable NTP authentication.
ntp-service authentication enable
3. Configure an NTP
authentication key.
ntp-service authentication-keyid
keyid authentication-mode md5
value
4. Configure the key as a trusted
key.
ntp-service reliable authenticationkeyid keyid
Client/server mode:
5. Associate the specified key
with an NTP server.
ntp-service unicast-server { ipaddress | server-name }
authentication-keyid keyid
Symmetric peers mode:
ntp-service unicast-peer { ipaddress | peer-name }
authentication-keyid keyid
67
Required.
Disabled by default.
Required.
No NTP authentication key by
default.
Required.
By default, no authentication key
is configured to be trusted.
Required.
You can associate a non-existing
key with an NTP server. To enable
NTP authentication, you must
configure the key and specify it as
a trusted key after associating the
key with the NTP server.
NOTE:
After you enable the NTP authentication feature for the client, make sure that you configure for the
client an authentication key that is the same as on the server and specify that the authentication key is
trusted. Otherwise, the client cannot be synchronized to the server.
Configuring NTP authentication for a server
To do…
Use the command…
Remarks
1. Enter system view.
system-view
—
2. Enable NTP authentication.
ntp-service authentication enable
3. Configure an NTP
authentication key.
ntp-service authentication-keyid
keyid authentication-mode md5
value
4. Configure the key as a trusted
key.
ntp-service reliable authenticationkeyid keyid
5. Enter interface view.
interface interface-type interfacenumber
—
Broadcast server mode:
Required.
ntp-service broadcast-server
authentication-keyid keyid
You can associate a non-existing
key with an NTP server. To enable
NTP authentication, you must
configure the key and specify it as
a trusted key after associating the
key with the NTP server.
6. Associate the specified key
with an NTP server.
Multicast server mode:
ntp-service multicast-server
authentication-keyid keyid
Required.
Disabled by default.
Required.
No NTP authentication key by
default.
Required.
By default, no authentication key
is configured to be trusted.
NOTE:
The procedure of configuring NTP authentication on a server is the same as that on a client, and the
same authentication key must be configured on both the server and client sides.
Displaying and maintaining NTP
To do…
Use the command…
Remarks
Display information about NTP
service status
display ntp-service status [ | {
begin | exclude | include }
regular-expression ]
Available in any view
Display information about NTP
sessions
display ntp-service sessions [
verbose ] [ | { begin | exclude |
include } regular-expression ]
Available in any view
Display the brief information
about the NTP servers from the
local device back to the primary
reference source
display ntp-service trace [ | {
begin | exclude | include }
regular-expression ]
Available in any view
68
Configuring NTP examples
Configuring NTP client/server mode example
Network requirements
Perform the following configurations to synchronize the time between Switch B and Switch A:
•
As shown in Figure 25, the local clock of Switch A is to be used as a reference source, with the
stratum level of 2.
•
Switch B works in client/server mode and Switch A is to be used as the NTP server of Switch B.
Figure 25 Network diagram for NTP client/server mode configuration
Configuration procedure
1.
Set the IP address for each interface as shown in Figure 25. The configuration procedure is
omitted.
2.
Configuration on Switch B:
# View the NTP status of Switch B before clock synchronization.
<SwitchB> display ntp-service status
Clock status: unsynchronized
Clock stratum: 16
Reference clock ID: none
Nominal frequency: 64.0000 Hz
Actual frequency: 64.0000 Hz
Clock precision: 2^7
Clock offset: 0.0000 ms
Root delay: 0.00 ms
Root dispersion: 0.00 ms
Peer dispersion: 0.00 ms
Reference time: 00:00:00.000 UTC Jan 1 1900 (00000000.00000000)
# Specify Switch A as the NTP server of Switch B so that Switch B is synchronized to Switch A.
<SwitchB> system-view
[SwitchB] ntp-service unicast-server 1.0.1.11
# View the NTP status of Switch B after clock synchronization.
[SwitchB] display ntp-service status
Clock status: synchronized
Clock stratum: 3
Reference clock ID: 1.0.1.11
Nominal frequency: 64.0000 Hz
Actual frequency: 64.0000 Hz
Clock precision: 2^7
Clock offset: 0.0000 ms
69
Root delay: 31.00 ms
Root dispersion: 1.05 ms
Peer dispersion: 7.81 ms
Reference time: 14:53:27.371 UTC Sep 19 2005 (C6D94F67.5EF9DB22)
The output shows that Switch B has been synchronized to Switch A, and the clock stratum level of Switch
B is 3, while that of Switch A is 2.
# View the NTP session information of Switch B, which shows that an association has been set up
between Switch B and Switch A.
[SwitchB] display ntp-service sessions
source
reference
stra
reach
poll
now
offset
delay
disper
**************************************************************************
[12345] 1.0.1.11
127.127.1.0
2
63
64
3
-75.5
31.0
16.5
note: 1 source(master),2 source(peer),3 selected,4 candidate,5 configured
Total associations :
1
Configuring the NTP symmetric mode example
Network requirements
Perform the following configurations to synchronize time among devices:
•
The local clock of Switch A is to be configured as a reference source, with the stratum level of 2.
•
Switch B works in the client mode and Switch A is to be used as the NTP server of Switch B.
•
After Switch B is synchronized to Switch A , Switch C works in the symmetric-active mode and
Switch B will act as peer of Switch C. Switch C is the symmetric-active peer while Switch B is the
symmetric-passive peer.
Figure 26 Network diagram for NTP symmetric peers mode configuration
Configuration procedure
1.
Configure IP addresses for interfaces (omitted)
2.
Configuration on Switch B:
# Specify Switch A as the NTP server of Switch B.
<SwitchB> system-view
[SwitchB] ntp-service unicast-server 3.0.1.31
3.
View the NTP status of Switch B after clock synchronization.
70
[SwitchB] display ntp-service status
Clock status: synchronized
Clock stratum: 3
Reference clock ID: 3.0.1.31
Nominal frequency: 100.0000 Hz
Actual frequency: 100.0000 Hz
Clock precision: 2^18
Clock offset: -21.1982 ms
Root delay: 15.00 ms
Root dispersion: 775.15 ms
Peer dispersion: 34.29 ms
Reference time: 15:22:47.083 UTC Sep 19 2005 (C6D95647.153F7CED)
The output shows that Switch B has been synchronized to Switch A, and the clock stratum level of Switch
B is 3.
4.
Configuration on Switch C (after Switch B is synchronized to Switch A):
# Configure Switch C as a symmetric peer after local synchronization.
[SwitchC] ntp-service unicast-peer 3.0.1.32
The output shows that Switch B and Switch C are configured as symmetric peers, with Switch C in the
symmetric-active mode and Switch B in the symmetric-passive mode. Because the stratus level of Switch
C is 16 while that of Switch B is 3, Switch B is synchronized to Switch C.
# View the NTP status of Switch C after clock synchronization.
[SwitchC] display ntp-service status
Clock status: synchronized
Clock stratum: 4
Reference clock ID: 3.0.1.32
Nominal frequency: 100.0000 Hz
Actual frequency: 100.0000 Hz
Clock precision: 2^18
Clock offset: -21.1982 ms
Root delay: 15.00 ms
Root dispersion: 775.15 ms
Peer dispersion: 34.29 ms
Reference time: 15:22:47.083 UTC Sep 19 2005 (C6D95647.153F7CED)
The output shows that Switch C has been synchronized to Switch B and the clock stratum level of Switch
C is 4.
# View the NTP session information of Switch C, which shows that an association has been set up
between Switch B and Switch C.
[SwitchC] display ntp-service sessions
source
reference
stra reach poll
now offset
delay disper
********************************************************************************
[12345] 3.0.1.32
3.0.1.31
3
3
64
16
-6.4
4.8
note: 1 source(master),2 source(peer),3 selected,4 candidate,5 configured
Total associations :
1
71
1.0
Configuring NTP broadcast mode example
Network requirements
As shown in Figure 27, Switch C functions as the NTP server for multiple devices on a network segment
and synchronizes the time among multiple devices.
•
Switch C’s local clock is to be used as a reference source, with the stratum level of 2.
•
Switch C works in broadcast server mode and sends out broadcast messages from VLAN-interface
2.
•
Switch A and Switch B work in broadcast client mode, and listen to broadcast messages through
their VLAN-interface 2 respectively.
Figure 27 Network diagram for NTP broadcast mode configuration
Configuration procedure
1.
Set the IP address for each interface as shown in Figure 27. The configuration procedure is
omitted.
2.
Configuration on Switch C:
# Configure Switch C to work in broadcast server mode and send broadcast messages through VLANinterface 2.
[SwitchC] interface vlan-interface 2
[SwitchC-Vlan-interface2] ntp-service broadcast-server
3.
Configuration on Switch A:
# Configure Switch A to work in broadcast client mode and receive broadcast messages on VLANinterface 2.
<SwitchA> system-view
[SwitchA] interface vlan-interface 2
[SwitchA-Vlan-interface2] ntp-service broadcast-client
4.
Configuration on Switch B:
# Configure Switch B to work in broadcast client mode and receive broadcast messages on VLANinterface 2.
<SwitchB> system-view
[SwitchB] interface vlan-interface 2
72
[SwitchB-Vlan-interface2] ntp-service broadcast-client
Switch A and Switch B get synchronized upon receiving a broadcast message from Switch C.
# Take Switch A as an example. View the NTP status of Switch A after clock synchronization.
[SwitchA-Vlan-interface2] display ntp-service status
Clock status: synchronized
Clock stratum: 3
Reference clock ID: 3.0.1.31
Nominal frequency: 64.0000 Hz
Actual frequency: 64.0000 Hz
Clock precision: 2^7
Clock offset: 0.0000 ms
Root delay: 31.00 ms
Root dispersion: 8.31 ms
Peer dispersion: 34.30 ms
Reference time: 16:01:51.713 UTC Sep 19 2005 (C6D95F6F.B6872B02)
The output shows that Switch A has been synchronized to Switch C, and the clock stratum level of Switch
A is 3, while that of Switch C is 2.
# View the NTP session information of Switch A, which shows that an association has been set up
between Switch A and Switch C.
[SwitchA-Vlan-interface2] display ntp-service sessions
source
reference
stra
reach
poll
now
offset delay
disper
**************************************************************************
[1234] 3.0.1.31
127.127.1.0
2
254
64
62
-16.0
32.0
16.6
note: 1 source(master),2 source(peer),3 selected,4 candidate,5 configured
Total associations :
1
Configuring NTP multicast mode example
Network requirements
As shown in Figure 28, Switch C functions as the NTP server for multiple devices on different network
segments and synchronizes the time among multiple devices.
•
Switch C’s local clock is to be used as a reference source, with the stratum level of 2.
•
Switch C works in multicast server mode and sends out multicast messages from VLAN-interface 2.
•
Switch A and Switch D work in multicast client mode and receive multicast messages through
VLAN-interface 3 and VLAN-interface 2 respectively.
NOTE:
In this example, Switch B must be a Layer 3 switch supporting multicast routing.
73
Figure 28 Network diagram for NTP multicast mode configuration
Configuration procedure
1.
Set the IP address for each interface as shown in Figure 28. The configuration procedure is
omitted.
2.
Configuration on Switch C:
# Configure Switch C to work in multicast server mode and send multicast messages through VLANinterface 2.
[SwitchC] interface vlan-interface 2
[SwitchC-Vlan-interface2] ntp-service multicast-server
3.
Configuration on Switch D:
# Configure Switch D to work in multicast client mode and receive multicast messages on VLAN-interface
2.
<SwitchD> system-view
[SwitchD] interface vlan-interface 2
[SwitchD-Vlan-interface2] ntp-service multicast-client
Because Switch D and Switch C are on the same subnet, Switch D can receive the multicast messages
from Switch C without being enabled with the multicast functions and can be synchronized to Switch C.
# View the NTP status of Switch D after clock synchronization.
[SwitchD-Vlan-interface2] display ntp-service status
Clock status: synchronized
Clock stratum: 3
Reference clock ID: 3.0.1.31
Nominal frequency: 64.0000 Hz
Actual frequency: 64.0000 Hz
Clock precision: 2^7
Clock offset: 0.0000 ms
Root delay: 31.00 ms
Root dispersion: 8.31 ms
Peer dispersion: 34.30 ms
Reference time: 16:01:51.713 UTC Sep 19 2005 (C6D95F6F.B6872B02)
74
The output shows that Switch D has been synchronized to Switch C, and the clock stratum level of Switch
D is 3, while that of Switch C is 2.
# View the NTP session information of Switch D, which shows that an association has been set up
between Switch D and Switch C.
[SwitchD-Vlan-interface2] display ntp-service sessions
source
reference
stra
reach
poll
now
offset delay
disper
**************************************************************************
[1234] 3.0.1.31
127.127.1.0
2
254
64
62
-16.0
31.0
16.6
note: 1 source(master),2 source(peer),3 selected,4 candidate,5 configured
Total associations :
4.
1
Configuration on Switch B:
Because Switch A and Switch C are on different subnets, you must enable the multicast functions on
Switch B before Switch A can receive multicast messages from Switch C.
# Enable IP multicast routing and IGMP.
<SwitchB> system-view
[SwitchB] multicast routing-enable
[SwitchB] interface vlan-interface 2
[SwitchB-Vlan-interface2] pim dm
[SwitchB-Vlan-interface2] quit
[SwitchB] vlan 3
[SwitchB-vlan3] port gigabitethernet 1/0/1
[SwitchB-vlan3] quit
[SwitchB] interface vlan-interface 3
[SwitchB-Vlan-interface3] igmp enable
[SwitchB-Vlan-interface3] igmp static-group 224.0.1.1
[SwitchB-Vlan-interface3] quit
[SwitchB] interface gigabitethernet 1/0/1
[SwitchB-GigabitEthernet1/0/1] igmp-snooping static-group 224.0.1.1 vlan 3
5.
Configuration on Switch A:
<SwitchA> system-view
[SwitchA] interface vlan-interface 3
# Configure Switch A to work in multicast client mode and receive multicast messages on VLAN-interface
3.
[SwitchA-Vlan-interface3] ntp-service multicast-client
# View the NTP status of Switch A after clock synchronization.
[SwitchA-Vlan-interface3] display ntp-service status
Clock status: synchronized
Clock stratum: 3
Reference clock ID: 3.0.1.31
Nominal frequency: 64.0000 Hz
Actual frequency: 64.0000 Hz
Clock precision: 2^7
Clock offset: 0.0000 ms
Root delay: 40.00 ms
Root dispersion: 10.83 ms
Peer dispersion: 34.30 ms
75
Reference time: 16:02:49.713 UTC Sep 19 2005 (C6D95F6F.B6872B02)
The output shows that Switch A has been synchronized to Switch C, and the clock stratum level of Switch
A is 3, while that of Switch C is 2.
# View the NTP session information of Switch A, which shows that an association has been set up
between Switch A and Switch C.
[SwitchA-Vlan-interface3] display ntp-service sessions
source
reference
stra
reach
poll
now
offset delay
disper
**************************************************************************
[1234] 3.0.1.31
127.127.1.0
2
255
64
26
-16.0
40.0
16.6
note: 1 source(master),2 source(peer),3 selected,4 candidate,5 configured
Total associations :
1
NOTE:
For more information about how to configure IGMP and PIM, see IP Multicast Configuration Guide.
Configuring NTP client/server mode with authentication
example
Network requirements
As shown in Figure 29, perform the following configurations to synchronize the time between Switch B
and Switch A and ensure network security.
•
The local clock of Switch A is to be configured as a reference source, with the stratum level of 2.
•
Switch B works in client mode and Switch A is to be used as the NTP server of Switch B, with
Switch B as the client.
•
NTP authentication is to be enabled on both Switch A and Switch B.
Figure 29 Network diagram for configuration of NTP client/server mode with authentication
Configuration procedure
1.
Set the IP address for each interface as shown in Figure 29. The configuration procedure is
omitted.
2.
Configuration on Switch B:
<SwitchB> system-view
# Enable NTP authentication on Switch B.
[SwitchB] ntp-service authentication enable
# Set an authentication key.
[SwitchB] ntp-service authentication-keyid 42 authentication-mode md5 aNiceKey
# Specify the key as a trusted key.
[SwitchB] ntp-service reliable authentication-keyid 42
# Specify Switch A as the NTP server of Switch B.
76
[SwitchB] ntp-service unicast-server 1.0.1.11 authentication-keyid 42
Before Switch B can synchronize its clock to that of Switch A, enable NTP authentication for Switch A.
Perform the following configuration on Switch A:
# Enable NTP authentication.
[SwitchA] ntp-service authentication enable
# Set an authentication key.
[SwitchA] ntp-service authentication-keyid 42 authentication-mode md5 aNiceKey
# Specify the key as a trusted key.
[SwitchA] ntp-service reliable authentication-keyid 42
# View the NTP status of Switch B after clock synchronization.
[SwitchB] display ntp-service status
Clock status: synchronized
Clock stratum: 3
Reference clock ID: 1.0.1.11
Nominal frequency: 64.0000 Hz
Actual frequency: 64.0000 Hz
Clock precision: 2^7
Clock offset: 0.0000 ms
Root delay: 31.00 ms
Root dispersion: 1.05 ms
Peer dispersion: 7.81 ms
Reference time: 14:53:27.371 UTC Sep 19 2005 (C6D94F67.5EF9DB22)
The output shows that Switch B has been synchronized to Switch A, and the clock stratum level of Switch
B is 3, while that of Switch A is 2.
# View the NTP session information of Switch B, which shows that an association has been set up Switch
B and Switch A.
[SwitchB] display ntp-service sessions
source
reference
stra
reach
poll
now
offset
delay
disper
**************************************************************************
[12345] 1.0.1.11
127.127.1.0
2
63
64
3
-75.5
31.0
16.5
note: 1 source(master),2 source(peer),3 selected,4 candidate,5 configured
Total associations :
1
Total associations :
1
Configuring NTP broadcast mode with authentication example
Network requirements
As shown in Figure 30, Switch C functions as the NTP server for multiple devices on different network
segments and synchronizes the time among multiple devices.
•
Switch C’s local clock is to be used as a reference source, with the stratum level of 3.
•
Switch C works in broadcast server mode and sends out broadcast messages from VLAN-interface
2.
•
Switch D works in broadcast client mode and receives broadcast messages through VLAN-interface
2.
77
NTP authentication is enabled on both Switch C and Switch D.
•
Figure 30 Network diagram for configuration of NTP broadcast mode with authentication
Configuration procedure
1.
Set the IP address for each interface as shown in Figure 30. The configuration procedure is
omitted.
2.
Configuration on Switch C:
# Configure NTP authentication.
[SwitchC] ntp-service authentication enable
[SwitchC] ntp-service authentication-keyid 88 authentication-mode md5 123456
[SwitchC] ntp-service reliable authentication-keyid 88
# Specify Switch C as an NTP broadcast server, and specify an authentication key.
[SwitchC] interface vlan-interface 2
[SwitchC-Vlan-interface2] ntp-service broadcast-server authentication-keyid 88
3.
Configuration on Switch D:
# Configure NTP authentication.
<SwitchD> system-view
[SwitchD] ntp-service authentication enable
[SwitchD] ntp-service authentication-keyid 88 authentication-mode md5 123456
[SwitchD] ntp-service reliable authentication-keyid 88
# Configure Switch D to work in the NTP broadcast client mode.
[SwitchD] interface vlan-interface 2
[SwitchD-Vlan-interface2] ntp-service broadcast-client
Now, Switch D can receive broadcast messages through VLAN-interface 2, and Switch C can send
broadcast messages through VLAN-interface 2. Upon receiving a broadcast message from Switch C,
Switch D synchronizes its clock to that of Switch C.
# View the NTP status of Switch D after clock synchronization.
[SwitchD-Vlan-interface2] display ntp-service status
Clock status: synchronized
Clock stratum: 4
Reference clock ID: 3.0.1.31
Nominal frequency: 64.0000 Hz
78
Actual frequency: 64.0000 Hz
Clock precision: 2^7
Clock offset: 0.0000 ms
Root delay: 31.00 ms
Root dispersion: 8.31 ms
Peer dispersion: 34.30 ms
Reference time: 16:01:51.713 UTC Sep 19 2005 (C6D95F6F.B6872B02)
The output shows that Switch D has been synchronized to Switch C, and the clock stratum level of Switch
D is 4, while that of Switch C is 3.
# View the NTP session information of Switch D, which shows that an association has been set up
between Switch D and Switch C.
[SwitchD-Vlan-interface2] display ntp-service sessions
source
reference
stra
reach
poll
now
offset delay
disper
**************************************************************************
[1234] 3.0.1.31
127.127.1.0
3
254
64
62
-16.0
32.0
16.6
note: 1 source(master),2 source(peer),3 selected,4 candidate,5 configured
Total associations :
1
Configuring MPLS VPN time synchronization in client/server
mode example
Network requirements
As shown in Figure 31, two VPNs are present on PE 1 and PE 2: VPN 1 and VPN 2. CE 1 and CE 3
are devices in VPN 1. To synchronize the time between CE 1 and CE 3 in VPN 1, perform the following
configurations:
•
CE 1’s local clock is to be used as a reference source, with the stratum level of 1.
•
CE 3 is synchronized to CE 1 in the client/server mode.
NOTE:
MPLS VPN time synchronization can only be implemented in the unicast mode (client/server mode or
symmetric peers mode), but not in the multicast or broadcast mode.
79
Figure 31 Network diagram for MPLS VPN time synchronization configuration
Device
Interface
IP address
Device
Interface
IP address
CE 1
Vlan-int 10
10.1.1.1/24
PE 1
Vlan-int 10
10.1.1.2/24
CE 2
Vlan-int 20
10.2.1.1/24
Vlan-int 30
172.1.1.1/24
CE 3
Vlan-int 50
10.3.1.1/24
Vlan-int 20
10.2.1.2/24
CE 4
Vlan-int 60
10.4.1.1/24
Vlan-int 50
10.3.1.2/24
P
PE 2
Vlan-int 30
172.1.1.2/24
Vlan-int 40
172.2.1.2/24
Vlan-int 40
172.2.1.1/24
Vlan-int 60
10.4.1.2/24
Configuration procedure
NOTE:
Prior to performing the following configuration, be sure you have completed MPLS VPN-related
configurations and make sure of the reachability between CE 1 and PE 1, between PE 1 and PE 2, and
between PE 2 and CE 3. For information about configuring MPLS VPN, see MPLS Configuration Guide.
1.
Set the IP address for each interface as shown in Figure 31. The configuration procedure is
omitted.
2.
Configuration on CE 3:
# Specify CE 1 in VPN 1 as the NTP server of CE 3.
<CE3> system-view
[CE3] ntp-service unicast-server 10.1.1.1
# View the NTP session information and status information on CE 3 a certain period of time later. The
information should show that CE 3 has been synchronized to CE 1, with the clock stratum level of 2.
[CE3] display ntp-service status
Clock status: synchronized
Clock stratum: 2
Reference clock ID: 10.1.1.1
Nominal frequency: 63.9100 Hz
Actual frequency: 63.9100 Hz
80
Clock precision: 2^7
Clock offset: 0.0000 ms
Root delay: 47.00 ms
Root dispersion: 0.18 ms
Peer dispersion: 34.29 ms
Reference time: 02:36:23.119 UTC Jan 1 2001(BDFA6BA7.1E76C8B4)
[CE3] display ntp-service sessions
source
reference
stra reach poll
now offset
delay disper
**************************************************************************
[12345]10.1.1.1
LOCL
1
7
64
15
0.0
47.0
7.8
note: 1 source(master),2 source(peer),3 selected,4 candidate,5 configured
Total associations :
[CE3]
1
display ntp-service trace
server 127.0.0.1,stratum 2, offset -0.013500, synch distance 0.03154
server 10.1.1.1,stratum 1, offset -0.506500, synch distance 0.03429
refid 127.127.1.0
Configuring MPLS VPN time synchronization in symmetric peers
mode example
Network requirements
As shown in Figure 31, two VPNs are present on PE 1 and PE 2: VPN 1 and VPN 2. To synchronize the
time between PE 1 and PE 2 in VPN 1, perform the following configurations:
•
PE 1’s local clock is to be used as a reference source, with the stratum level of 1.
•
PE 2 is synchronized to PE 1 in the symmetric peer mode, and specifies that the VPN instance is
VPN 1.
Configuration procedure
1.
Set the IP address for each interface as shown in Figure 31. The configuration procedure is
omitted.
2.
Configuration on PE 2:
# Specify PE 1 in VPN 1 as the symmetric-passive peer of PE 2.
<PE2> system-view
[PE2] ntp-service unicast-peer vpn-instance vpn1 10.1.1.2
# View the NTP session information and status information on PE 2 a certain period of time later. The
information should show that PE 2 has been synchronized to PE 1, with the clock stratum level of 2.
[PE2] display ntp-service status
Clock status: synchronized
Clock stratum: 2
Reference clock ID: 10.1.1.2
Nominal frequency: 63.9100 Hz
Actual frequency: 63.9100 Hz
Clock precision: 2^7
Clock offset: 0.0000 ms
Root delay: 32.00 ms
Root dispersion: 0.60 ms
81
Peer dispersion: 7.81 ms
Reference time: 02:44:01.200 UTC Jan 1 2001(BDFA6D71.33333333)
[PE2] display ntp-service sessions
source
reference
stra reach poll
now offset
delay disper
**************************************************************************
[12345]10.1.1.2
LOCL
1
1
64
29
-12.0
32.0
15.6
note: 1 source(master),2 source(peer),3 selected,4 candidate,5 configured
Total associations :
1
[PE2] display ntp-service trace
server 127.0.0.1,stratum 2, offset -0.012000, synch distance 0.02448
server 10.1.1.2,stratum 1, offset 0.003500, synch distance 0.00781
refid 127.127.1.0
82
Configuring IPC
IPC is a reliable communication mechanism among different nodes. The following are the basic concepts
in IPC.
Node
An IPC node is an entity supporting IPC; it is an independent processing unit. In actual application, an
IPC node corresponds to one CPU. The following guidelines apply:
•
One centralized device only has one CPU, corresponding to one node.
•
Typically, a distributed device is available with multiple boards, each having one CPU. Some, for
example, service CPU and OAM CPU and are available with multiple CPUs. A distributed device
corresponds to multiple nodes.
•
An IRF virtual device is an interconnection of several devices, with each member device
corresponding to one or more nodes. An IRF virtual device corresponds to multiple nodes.
In actual application, IPC is mainly applied on an IRF virtual device or distributed device; it provides a
reliable transmission mechanism between different devices and boards.
Link
An IPC link is a connection between any two IPC nodes. There is one and only one link between any
two nodes for packet sending and receiving. All IPC nodes are fully connected.
IPC links are created when the system is initialized: When a node starts up, it sends handshake packets
to other nodes; a connection is established between them if the handshake succeeds.
The system identifies the link connectivity between two nodes using link status. An IPC node can have
multiple links, each having its own status.
Channel
A channel is a communication interface for an upper layer application module of a node to
communicate with an application module of a peer node. Each node assigns a locally unique channel
number to each upper layer application module to identify this module.
Data of an upper layer application module is sent to the IPC module through a channel, and the IPC
module sends the data to a peer node through the link.
83
Ch
a
nn
el
C
ha
nn
el
2
Figure 32 Relationship between a node, link and channel
1
Link
Packet sending modes
IPC supports three packet sending modes: unicast, multicast (broadcast is considered as a special
multicast), and mixcast, each having a queue. The upper layer application modules can select one as
needed.
•
Unicast—Packet sending between two single nodes.
•
Multicast—Packet sending between a single node and multiple nodes. To use the multicast mode, a
multicast group needs to be created first. Multicasts will be sent to all nodes in the multicast group.
An application can create multiple multicast groups. The creation and deletion of a multicast group
and multicast group members depend on the application module.
•
Mixcast—Both unicast and multicast are supported.
Enabling IPC performance statistics
When IPC performance statistics is enabled, the system collects statistics for packet sending and
receiving of a node in a specified time range, for example, in the past 10 seconds, or in the past 1
minute. When IPC performance statistics is disabled, statistics collection is stopped. At this time, if you
execute the display command, the system displays the statistics information at the time when IPC
performance statistics was disabled.
To enable IPC performance statistics:
To do…
Use the command…
Remarks
Required
Enable IPC performance statistics
ipc performance enable { node
node-id | self-node } [ channel
channel-id ]
84
Disabled by default
Available in user view
Displaying and maintaining IPC
To do…
Use the command…
Display IPC node information
display ipc node [ | { begin |
exclude | include } regularexpression ]
Display channel information of a
node
display ipc channel { node nodeid | self-node } [ | { begin |
exclude | include } regularexpression ]
Display queue information of a
node
display ipc queue { node node-id
| self-node } [ | { begin | exclude
| include } regular-expression ]
Display multicast group
information of a node
display ipc multicast-group { node
node-id | self-node } [ | { begin |
exclude | include } regularexpression ]
Display packet information of a
node
display ipc packet { node node-id
| self-node } [ | { begin | exclude
| include } regular-expression ]
Display link status information of
a node
display ipc link { node node-id |
self-node } [ | { begin | exclude |
include } regular-expression ]
Display IPC performance statistics
information of a node
display ipc performance { node
node-id | self-node } [ channel
channel-id ] [ | { begin | exclude
| include } regular-expression ]
Clear IPC performance statistics
information of a node
reset ipc performance [ node
node-id | self-node ] [ channel
channel-id ]
85
Remarks
Available in any view
Available in user view
Configuring PoE
PoE enables a PSE to supply power to PDs from Ethernet interfaces through straight-through twisted pair
cables.
Advantages
•
Reliable—Power is supplied in a centralized way so that it is convenient to provide a backup
power supply.
•
Easy to connect—A network terminal requires no external power supply except an Ethernet cable.
•
Standard—It is in compliance with IEEE 802.3af, and adopts a globally uniform power interface.
•
Promising—It can be applied to IP telephones, wireless LAN access points (APs), portable chargers,
card readers, web cameras, and data collectors.
Composition
As shown in Figure 33, a PoE system comprises PoE power, PSE, PI, and PD.
•
PoE power—The whole PoE system is powered by the PoE power.
•
PSE—A PSE supplies power for PDs. A PSE can be built-in (Endpoint) or external (Midspan). A builtin PSE is integrated in a switch, and an external PSE is independent from a switch. HP PSEs are
built in. The system uses PSE IDs to identify different PSEs. To display the mapping between a PSE
ID and the member ID of a switch, execute the display poe device command.
NOTE:
The PSE ID is the switch member ID multiplies 3 and then plus 1. For example, if the member ID of the
device is 3, the PSE ID of the device is 3 × 3 + 1 = 10.
A PSE can examine the Ethernet cables connected to PoE interfaces, search for PDs, classify them, and
supply power to them. When detecting that a PD is unplugged, the PSE stops supplying power to the PD.
•
PI—An Ethernet interface with the PoE capability is a PoE interface. A PoE interface can be an FE
or GE interface.
•
PD—A PD accepts power from the PSE, including IP phones, wireless APs, chargers of portable
devices, POS, and web cameras.
•
The PD that is being powered by the PSE can be connected to another power supply unit for
redundancy power backup.
Figure 33 PoE system diagram
86
Protocol specification
The protocol specification related to PoE is IEEE 802.3af.
PoE configuration task list
You can configure a PoE interface by using either of the following methods:
•
At the CLI.
•
Through configuring the PoE profile and applying the PoE profile to the PoE interface.
To configure a single PoE interface, configure it at the CLI; to configure PoE interfaces in batches, use the
PoE profile. For a PoE configuration parameter of a PoE interface, you can only select one mode
(including modification and removal of a PoE interface).
Complete these tasks to configure PoE:
Task
Remarks
Enabling PoE for a PoE
interface
Required
Enabling the PSE to detect
nonstandard PDs
Optional
Configuring a PD disconnection
detection mode
Optional
Configuring the PoE power
Configuring the maximum PoE
interface power
Optional
Configuring PoE power
management
Configuring PoE interface
power management
Optional
Configuring PSE power
monitoring
Optional
Enabling PoE
Detecting PDs
Configuring the PoE monitoring
function
Optional
Monitoring PD
The device automatically monitors PDs
when supplying power to them, so no
configuration is required.
Configuring PoE profile
Optional
Applying PoE profile
Optional
Configuring PoE interface
through PoE profile
Upgrading PSE processing software in service
Optional
87
CAUTION:
• Before configuring PoE, make sure that the PoE power supply and PSE are operating properly;
otherwise, you cannot configure PoE or the configured PoE function does not take effect.
• Turning off the PoE power supply during the startup of the device might cause the PoE configuration
in the PoE profile invalid.
Enabling PoE
Enabling PoE for a PoE interface
The system does not supply power to or reserve power for the PDs connected to a PoE interface if the
PoE interface is not enabled with the PoE function.
You are allowed to enable PoE for a PoE interface if the PoE interface will not result in PoE power
overload; otherwise, whether you can enable PoE for the PoE interface depends on whether the PoE
interface is enabled with the PoE power management function (for more information about the PoE
interface power management function, see “Configuring PoE interface power management.”).
•
If the PoE interface is not enabled with the PoE power management function, you are not allowed to
enable PoE for the PoE interface.
•
If the PoE interface is enabled with the PoE power management function, you are allowed to enable
PoE for the PoE interface (whether the PDs can be powered depends on other factors, for example,
the power supply priority of the PoE interface).
The PSE supplies power for a PoE interface in the following modes:
•
Over signal wires: The PSE uses the pairs (1, 2, 3, and 6) for transmitting data in category 3/5
twisted pair cables to supply DC power while transmitting data to PDs.
•
Over spare wires: The PSE uses the pairs (4, 5, 7, and 8) not transmitting data in category 3/5
twisted pair cables to supply DC power to PDs.
NOTE:
• When the sum of the power consumption of all powered PoE interfaces on a PSE exceeds the
maximum power of the PSE, the system considers the PSE overloaded (The maximum PSE power is
decided by the user configuration).
• A PSE can only supply power to a PD when the selected power supply mode is supported by both the
PSE and PD. If the PSE and PD support different power supply modes (for example, the PSE does not
support power over spare wires, but the PD supports power over spare wires), you have to change
the order of the lines in the twisted pair cable to supply power to the PD.
• The A5820X&A5800 Switch Series only supports the signal mode.
To enable PoE for a PoE interface:
To do…
Use the command…
Remarks
1. Enter system view.
system-view
—
2. Enter PoE interface view.
interface interface-type interfacenumber
—
88
To do…
Use the command…
3. Enable PoE for the PoE
interface.
poe enable
Remarks
Required.
Disabled by default.
Optional.
4. Configure a description for
the PD connected to the PoE
interface.
poe pd-description text
By default, no description for the
PD connected to the PoE interface
is available.
Detecting PDs
Enabling the PSE to detect nonstandard PDs
Two types of PDs are available: standard PDs and nonstandard PDs. The PSE can only detect standard
PDs and supply power to them. The PSE can only detect nonstandard PDs and supply power to them
after the PSE is enabled to detect nonstandard PDs.
To enable the PSE to detect nonstandard PDs:
To do…
Use the command…
Remarks
1. Enter system view.
system-view
—
Required.
2. Enable the PSE to detect
nonstandard PDs.
poe legacy enable pse pse-id
By default, the PSE can detect
standard PDs rather than non
standard PDs.
Configuring a PD disconnection detection mode
To detect the PD connection with PSE, PoE provides two detection modes: AC detection and DC
detection. The AC detection mode is energy saving relative to the DC detection mode.
To configure a PD disconnection detection mode:
To do…
Use the command…
Remarks
1. Enter system view.
system-view
—
2. Configure a PD disconnection
detection mode.
poe disconnect { ac | dc }
Optional.
The default PD disconnection
detection mode is ac.
CAUTION:
If you change the PD disconnection detection mode when the device is running, the connected PDs will
be powered off. Be cautious to do so.
89
Configuring the PoE power
Configuring the maximum PoE interface power
The maximum PoE interface power is the maximum power that the PoE interface can provide to the
connected PD. If the power required by the PD is larger than the maximum PoE interface power, the PoE
interface will not supply power to the PD.
To configure the maximum PSE power:
To do…
Use the command…
Remarks
1. Enter system view.
system-view
—
2. Enter PoE interface view.
interface interface-type interfacenumber
—
3. Configure the maximum
power for the PoE interface.
poe max-power max-power
Optional.
30000 milliwatts by default.
Configuring PoE power management
PoE power management involves PSE power management and PoE interface power management.
Configuring PoE interface power management
The power supply priority of a PD depends on the priority of the PoE interface. The priority levels of PoE
interfaces are critical, high and low in descending order. Power supply to a PD is subject to PoE
interface power management policies.
All PSEs implement the same PoE interface power management policies. When a PSE supplies power to
a PD, the following actions occur:
•
If the PoE interface power management is not enabled, no power will be supplied to a new PD
when the PSE power is overloaded.
•
If the PoE interface power management priority policy is enabled, the PD with a lower priority is
first powered off to guarantee the power supply to the PD with a higher priority when the PSE
power is overloaded.
NOTE:
• 19 watts guard band is reserved for each PoE interface on the device to prevent a PD from being
powered off because of a sudden increase of the PD power. When the remaining power of the PSE
where the PoE interface resides is lower than 19 watts and no priority is configured for the PoE
interface, the PSE does not supply power to the new PD; when the remaining power of the PSE where
the PoE interface resides is lower than 19 watts, but priority is configured for the PoE interface, the
interface with a higher priority can preempt the power of the interface with a lower priority to ensure
the normal working of the higher priority interface.
• If the sudden increase of the PD power results in PSE power overload, power supply to the PD on the
PoE interface with a lower priority will be stopped to ensure the power supply to the PD with a higher
priority.
90
If the guaranteed remaining PSE power (the maximum PSE power minus the power allocated to the
critical PoE interface, regardless of whether PoE is enabled for the PoE interface) is lower than the
maximum power of the PoE interface, you will fail to set the priority of the PoE interface to critical.
Otherwise, you can succeed in setting the priority to critical, and this PoE interface will preempt the
power of other PoE interfaces with a lower priority level. In the latter case, the PoE interfaces whose
power is preempted will be powered off, but their configurations will remain unchanged. When you
change the priority of a PoE interface from critical to a lower level, the PDs connecting to other PoE
interfaces will have an opportunity of being powered.
Configuration prerequisites
Enable PoE for PoE interfaces.
Configuration procedure
To configure PoE interface power management:
To do…
Use the command…
Remarks
1. Enter system view.
system-view
—
2. Configure PoE interface
power management priority
policy.
poe pd-policy priority
3. Enter PoE interface view.
interface interface-type interfacenumber
4. Configure the power supply
priority for a PoE interface.
poe priority { critical | high | low
}
Required.
Not configured by default.
—
Optional.
low by default.
Configuring the PoE monitoring function
With the PoE monitoring function enabled, the system monitors the parameter values related to PoE
power supply, PSE, PD, and device temperature in real time. When a specific value exceeds the limited
range, the system automatically takes some measures to protect itself.
Configuring PSE power monitoring
When the PSE power exceeds or drops below the specified threshold, the system sends trap messages.
To configure a power alarm threshold for the PSE:
To do…
Use the command…
Remarks
1. Enter system view.
system-view
—
2. Configure a power alarm
threshold for the PSE.
poe utilization-threshold
utilization-threshold-value pse pseid
Optional.
80% by default.
Monitoring PD
When a PSE starts or ends power supply to a PD, the system sends a trap message.
91
Configuring PoE interface through PoE profile
You can configure a PoE interface either at the CLI or by using a PoE profile and applying the PoE
profile to the specified PoE interfaces.
To configure a single PoE interface, configure it at the CLI; to configure PoE interfaces in batches, use a
PoE profile.
A PoE profile is a collection of configurations that contain multiple PoE features. On large-scale
networks, you can apply a PoE profile to multiple PoE interfaces, and these interfaces have the same PoE
features. If the PoE interface connecting to a PD changes to another one, apply the PoE profile applied
on the originally connected interface to the connected interface instead of reconfiguring the features
defined in the PoE profile one by one, simplifying the PoE configurations.
The device supports multiple PoE profiles. You can define PoE configurations based on each PD, save
the configurations for different PDs into different PoE profiles, and apply the PoE profiles to the access
interfaces of PDs.
Configuring PoE profile
To do…
Use the command…
Remarks
1. Enter system view.
system-view
—
2. Create a PoE profile, and
enter PoE profile view.
poe-profile profile-name [ index ]
Required.
3. Enable PoE for the PoE
interface.
poe enable
4. Configure the maximum
power for the PoE interface.
poe max-power max-power
5. Configure power supply
priority for the PoE interface.
poe priority { critical | high | low
}
Required.
Disabled by default.
Optional.
30000 milliwatts by default.
Optional.
low by default.
CAUTION:
• If a PoE profile is applied, it cannot be deleted or modified before you cancel its application.
• The poe max-power max-power and poe priority { critical | high | low } commands must only be
configured in one way, either at the CLI or by configuring PoE profile.
• A PoE parameter on a PoE interface must be only configured, modified, and deleted in one way. If a
parameter configured one way (for example, at the CLI) is then configured another way (for example,
through PoE profile), the latter configuration fails and the original one is still effective. To make the
latter configuration effective, you must cancel the original one first.
Applying PoE profile
You can apply a PoE profile in either system view or interface view. If you perform application to a PoE
interface in both views, the latter application takes effect. To apply a PoE profile to multiple PoE
interfaces, the system view is more efficient.
92
To apply the PoE profile in system view:
To do…
Use the command…
Remarks
1. Enter system view.
system-view
—
2. Apply the PoE profile to one
or multiple PoE interfaces.
apply poe-profile { index index |
name profile-name } interface
interface-range
Required
To apply the PoE profile in interface view:
To do…
Use the command…
Remarks
1. Enter system view.
system-view
—
2. Enter PoE interface view.
interface interface-type interfacenumber
—
3. Apply the PoE profile to the
current PoE interface.
apply poe-profile { index index |
name profile-name }
Required
CAUTION:
A PoE profile can be applied to multiple PoE interfaces but a PoE interface can only be applied with
one PoE profile.
Upgrading PSE processing software in service
You can upgrade the PSE processing software in service in either of the following two modes:
•
refresh mode—enables you to update the PSE processing software without deleting it. You can
upgrade the PSE processing software in the refresh mode through the command line.
•
full mode—deletes the PSE processing software and reloads it. If the PSE processing software is
damaged (you can execute none of PoE commands successfully), you can upgrade the PSE
processing software in full mode to restore the PSE function.
In-service PSE processing software upgrade may be unexpectedly interrupted (for example, an error
results in device reboot). If you fail to upgrade the PSE processing software in full mode after reboot, you
can power off the device and restart it before upgrading it in full mode again. After upgrade, the new
PSE processing software take effect.
To upgrade the PSE processing software in service:
To do…
Use the command…
Remarks
1. Enter system view.
system-view
—
2. Upgrade the PSE processing
software in service.
poe update { full | refresh }
filename pse pse-id
Required
93
Displaying and maintaining PoE
To do…
Use the command…
Display PSE information
display poe device [ | { begin | exclude
| include } regular-expression ]
Display the power supply state of
the specified PoE interface
display poe interface [ interface-type
interface-number ] [ | { begin | exclude |
include } regular-expression ]
Display the power information of
a PoE interfaces
display poe interface power [ interfacetype interface-number ] [ | { begin |
exclude | include } regular-expression ]
Display the power information of
the PoE power supply and all
PSEs
display poe power-usage [ | { begin |
exclude | include } regular-expression ]
Display the information of PSE
display poe pse [ pse-id ] [ | { begin |
exclude | include } regular-expression ]
Display the power supply states of
all PoE interfaces connected with
the PSE
display poe pse pse-id interface [ | {
begin | exclude | include } regularexpression ]
Display the power information of
all PoE interfaces connected with
the PSE
display poe pse pse-id interface power [ |
{ begin | exclude | include } regularexpression ]
Display all information of the
configurations and applications of
the PoE profile
display poe-profile [ index index | name
profile-name ] [ | { begin | exclude |
include } regular-expression ]
Display all information of the
configurations and applications of
the PoE profile applied to the
specified PoE interface
display poe-profile interface interfacetype interface-number [ | { begin |
exclude | include } regular-expression ]
Remarks
Available in any view
Configuring PoE example
Network requirements
As shown in Figure 34,
•
GigabitEthernet 1/0/1, GigabitEthernet 1/0/2, and GigabitEthernet 1/0/3 are connected to IP
telephones.
•
GigabitEthernet 1/0/11 and GigabitEthernet 1/0/12 are connected to APs.
•
The power supply priority of IP telephones is higher than that of the APs, for which the PSE supplies
power to IP telephones first when the PSE power is overloaded.
•
The maximum power of AP 2 connected to GigabitEthernet 1/0/12 does not exceed 9000
milliwatts.
94
Figure 34 Network diagram for PoE
PSE
GE1/0/1
AP 1
E1
/
GE1/0/11
G
/0
2
/1
1
GE
0 /2
AP 2
Configuration procedure
# Enable PoE on GigabitEthernet 1/0/1, GigabitEthernet 1/0/2, and GigabitEthernet 1/0/3, and set
their power supply priority to critical.
<Sysname> system-view
[Sysname] interface gigabitethernet 1/0/1
[Sysname-GigabitEthernet1/0/1] poe enable
[Sysname-GigabitEthernet1/0/1] poe priority critical
[Sysname-GigabitEthernet1/0/1] quit
[Sysname] interface gigabitethernet 1/0/2
[Sysname-GigabitEthernet1/0/2] poe enable
[Sysname-GigabitEthernet1/0/2] poe priority critical
[Sysname-GigabitEthernet1/0/2] quit
[Sysname] interface gigabitethernet 1/0/3
[Sysname-GigabitEthernet1/0/3] poe enable
[Sysname-GigabitEthernet1/0/3] poe priority critical
[Sysname-GigabitEthernet1/0/3] quit
# Enable PoE on GigabitEthernet 1/0/11 and GigabitEthernet 1/0/12, and configure the maximum
power of GigabitEthernet 1/0/12 to 9000 milliwatts.
[Sysname] interface gigabitethernet 1/0/11
[Sysname-GigabitEthernet1/0/11] poe enable
[Sysname-GigabitEthernet1/0/11] quit
[Sysname] interface gigabitethernet 1/0/12
[Sysname-GigabitEthernet1/0/12] poe enable
[Sysname-GigabitEthernet1/0/12] poe max-power 9000
When the configuration takes effect, the IP telephones and APs are powered and can work properly.
Troubleshooting PoE
Symptom 1: Unable to set the priority of a PoE interface to critical.
Analysis:
•
The guaranteed remaining power of the PSE is lower than the maximum power of the PoE interface.
•
The priority of the PoE interface is already set.
95
Solution:
•
In the first case, increase the maximum PSE power, or by reducing the maximum power of the PoE
interface when the guaranteed remaining power of the PSE cannot be modified.
•
In the second case, remove the priority already configured.
Symptom 2: Applying a PoE profile to a PoE interface fails.
Analysis:
•
Some configurations in the PoE profile are already configured.
•
Some configurations in the PoE profile do not meet the configuration requirements of the PoE
interface.
•
Another PoE profile is already applied to the PoE interface.
Solution:
•
In the first case, remove the original configurations of those configurations.
•
In the second case, modify some configurations in the PoE profile.
•
In the third case, remove the application of the undesired PoE profile to the PoE interface.
Symptom 3: Provided that parameters are valid, configuring an AC input under-voltage threshold fails.
Analysis:
The AC input under-voltage threshold is greater than or equal to the AC input over-voltage threshold.
Solution:
You can drop the AC input under-voltage threshold below the AC input over-voltage threshold.
96
Configuring SNMP
SNMP offers the communication rules between a management device and the managed devices on the
network; it defines a series of messages, methods and syntaxes to implement the access and
management from the management device to the managed devices. SNMP has the following
characteristics:
•
Automatic network management: SNMP enables network administrators to search and modify
information, find and diagnose network problems, plan for network growth, and obtain reports on
network nodes.
•
SNMP shields physical differences between various devices and realizes automatic management of
products from various vendors. Offering only the basic set of functions, SNMP makes the
management tasks independent of both the physical features of the managed devices and the
underlying networking technologies. SNMP achieves effective management of devices from
different vendors, especially in small, high-speed and low-cost network environments.
SNMP mechanism
An SNMP-enabled network comprises the following elements:
•
NMS—An NMS is a station that runs the SNMP client software. It offers a user-friendly interface,
facilitating network administrators to perform most network management tasks.
•
Agent—An agent is a program resides in the device. It receives and handles requests sent from the
NMS. Only under certain circumstances, such as interface state change, will the agent inform the
NMS.
An NMS is a manager in an SNMP enabled network, whereas agents are managed by the NMS. The
NMS and agents exchange management information through the SNMP protocol.
SNMP provides the following basic operations:
•
Get operation—NMS gets the value of one or more objects of the agent.
•
Set operation—NMS can reconfigure the value of one or more objects in the agent MIB
(Management Information Base) by means of this operation.
•
Trap operation—Agent sends traps to the NMS through this operation.
•
Inform operation—NMS sends traps to other NMSs through this operation.
SNMP protocol version
SNMP agents support the following protocol versions: SNMPv1, SNMPv2C and SNMPv3.
•
SNMPv1 uses community names for authentication, which defines the relationship between an
SNMP NMS and an SNMP agent. SNMP packets with community names that did not pass the
authentication on the device will simply be discarded. A community name performs a similar role
as a password to regulate access from the NMS to the agent.
•
SNMPv2c uses community names for authentication. Compatible with SNMPv1, it extends the
functions of SNMPv1. SNMPv2c provides more operation modes such as GetBulk and
InformRequest; it supports more data types such as Counter64 and provides various error codes,
being able to distinguish errors in more detail.
97
SNMPv3 offers an authentication mechanism that is implemented based on the User-based Security
Model (USM). You can set the authentication and privacy functions. The former authenticates the
validity of the sending end of the authentication packets, preventing access of unauthorized users;
the latter encrypts packets between the NMS and agents, preventing the packets from being
intercepted. USM ensures a more secure communication between SNMP NMS and SNMP agent
by authentication with privacy, authentication without privacy, or no authentication no privacy.
•
Successful interaction between an NMS and the agents requires consistency of SNMP versions
configured on them.
MIB overview
Any managed resource can be identified as an object, which is the managed object. MIB is a collection
of all managed objects. It defines the hierarchy of the objects and a set of characteristics associated with
the managed objects, such as the OID, access right and data type. Each agent has its own MIB. An
NMS can read or write the managed objects in the MIB.
Figure 35 Relationship between an NMS, agent and MIB
A MIB stores data by using a tree structure. Each node of the tree represents a managed object that can
be uniquely identified by a path starting from the root node. As illustrated in Figure 36, the managed
object B can be uniquely identified by a string of numbers {1.2.1.1}. This string is the OID of the
managed object B.
Figure 36 MIB tree
1
2
1
1
1
5
2
2
B
6
A
Configuring SNMP
Because SNMPv3 configurations differ from SNMPv1 and SNMPv2c configurations, their SNMP
functionalities are introduced separately.
98
To configure SNMPv3:
To do…
Use the command…
Remarks
1. Enter system view.
system-view
—
Optional.
Disabled by default.
2. Enable the SNMP agent.
You can enable the SNMP agent
through this command or any
command that begins with snmpagent.
snmp-agent
Optional.
The defaults are as follows:
3. Configure SNMP agent
system information.
snmp-agent sys-info { contact syscontact | location sys-location |
version { all | { v1 | v2c | v3 }* }
}
4. Configure a local engine ID
for an SNMP entity.
snmp-agent local-engineid
engineid
5. Create or update the MIB
view content for an SNMP
agent.
snmp-agent mib-view { excluded
| included } view-name oid-tree [
mask mask-value ]
6. Configure an SNMP agent
group.
snmp-agent group v3 group-name
[ authentication | privacy ] [ readview read-view ] [ write-view
write-view ] [ notify-view notifyview ] [ acl acl-number ]
Required.
7. Convert the user-defined plain
text password to a cipher text
password.
snmp-agent calculate-password
plain-password mode { 3desmd5
| 3dessha | md5 | sha } { localengineid | specified-engineid
engineid }
Optional.
Required.
8. Add a new user to an SNMP
agent group.
snmp-agent usm-user v3 username group-name [ [ cipher ]
authentication-mode { md5 | sha
} auth-password [ privacy-mode {
3des | aes128 | des56 } privpassword ] ] [ acl acl-number ]
9. Configure the maximum size
of an SNMP packet that can
be received or sent by an
SNMP agent.
snmp-agent packet max-size bytecount
Optional.
99
Hewlett-Packard Development
Company, L.P., and SNMPv1
SNMPv2c SNMPv3 for the
version.
Optional.
Company ID and device ID by
default.
Optional.
By default, the MIB view name is
ViewDefault and OID is 1.
If the cipher keyword is specified,
the arguments auth-password and
priv-password are considered as
cipher text passwords.
1,500 bytes by default.
To configure SNMPv1 and SNMPv2c:
To do…
Use the command…
Remarks
1. Enter system view.
system-view
—
Optional.
Disabled by default.
2. Enable the SNMP agent.
snmp-agent
3. Configure SNMP agent system
information.
snmp-agent sys-info {
contact sys-contact |
location sys-location |
version { { v1 | v2c | v3 }*
| all } }
4. Configure a local engine ID for an
SNMP entity.
snmp-agent local-engineid
engineid
5. Create or update MIB view content for
an SNMP agent.
snmp-agent mib-view {
excluded | included } viewname oid-tree [ mask maskvalue ]
Configure
directly.
6. Configure
SNMP
NMS
access
right.
Configure
indirectly.
Create an
SNMP
community.
snmp-agent community {
read | write } communityname [ acl acl-number |
mib-view view-name ]*
Configure an
SNMP group.
snmp-agent group { v1 |
v2c } group-name [ readview read-view ] [ writeview write-view ] [ notifyview notify-view ] [ acl aclnumber ]
Add a user to
an SNMP
group.
snmp-agent usm-user { v1
| v2c } user-name groupname [ acl acl-number ]
7. Configure the maximum size of an
SNMP packet that can be received or
sent by an SNMP agent.
snmp-agent packet maxsize byte-count
You can enable the SNMP
agent with this command or
any command that begins with
snmp-agent.
Required.
The defaults are as follows:
Hewlett-Packard Development
Company, L.P., and SNMPv1
SNMPv2c SNMPv3 for the
version.
Optional.
Company ID and device ID by
default.
Optional.
The MIB view name is
ViewDefault and OID is 1 by
default.
Use either approach.
Both commands configure
SNMP NMS access rights. The
second command was
introduced to be compatible
with SNMPv3.
The community name
configured on the NMS should
be consistent with the username
configured on the agent.
Optional.
1,500 bytes by default.
CAUTION:
• The validity of a USM user depends on the engine ID of the SNMP agent. If the engine ID generated
when the USM user is created is not identical to the current engine ID, the USM user is invalid.
• A MIB view is a subset of MIB and is uniquely identified by its view name and the MIB subtree
together. MIB views with the same view name but containing different subtrees are considered
different views. Except default MIB views, you can create at most 16 MIB views.
100
Configuring network management-specific interface
index
Interface index (ifindex) and network management (NM)-specific ifindex are both interface
identifications. ifindex is an internal parameter for software implementation of the device, and it uniquely
identifies an interface for internal resource allocation and management. NM-specific ifindex is a
parameter provided by the device to the NMS. It is the index for ifTable entries.
An NM-specific ifindex is in either of the following formats:
•
16-bit NM-specific ifindex—A 16-bit NM-specific ifindex value contains 16 bits and ranges from 1
to 65534. The NM-specific ifindex value of each interface is allocated dynamically and increased
sequentially. The 16-bit NM-specific ifindex is an index value without any syntax explanation, and
only uniquely identifies an interface.
•
32-bit NM-specific ifindex—A 32-bit NM-specific ifindex value contains 32 bits, as shown in Figure
37. The value is composed of the following parts: Chassis ID, Slot ID, interface type, and interface
offset.
Figure 37 32-bit NM-specific ifindex
•
Offset—16 bits in length and distinguishes different interfaces of the same type on the same
interface board.
•
Interface type—7 bits in length and is the enumerated value corresponding to the interface type. It
supports up to 128 different interface types and supports more than 80 interface types.
•
Slot ID—Number of the physical slot in which the interface resides, with the length of 5 bits.
•
Chassis ID—4 bits in length. For a distributed IRF virtual device, this field indicates the member ID
of the device to which the interface belongs; for other devices, this field has no meanings and the
value is 0.
Switching the format of an NM-specific ifindex
An NM-specific ifindex adopts the default format (16-bit format). When either of the following scenarios
appears, you must switch the format of the NM-specific ifindex using the following guidelines:
•
If the NMS requires a 32-bit NM-specific ifindex, switch the NM-specific ifindex format to 32-bit,
which carries interface information such as the number of the slot in which the interface resides. If
the NMS only supports 16-bit NM-specific ifindex values, the NMS cannot recognize 32-bit NMspecific ifindex values so make sure that the NM-specific ifindex values on the device are 16-bit.
•
If the network protocol operating on the device does not support 32-bit NM-specific ifindex values,
make sure that NM-specific ifindex values on the device are 16-bit. For example, each packet of
NetStream version 5 or version 8 only reserves 16 bits for the ifindex, and the NM-specific
ifindexes must be in the 16-bit format. Each packet of NetStream version 9 reserves 32 bits for the
ifindex, and the NM-specific ifindexes can be in either the 16-bit format or the 32-bit format.
101
To switch the format of an NM-specific ifindex:
To do…
Use the command…
Remarks
1. Enter system view.
system-view
—
2. Switch the format of an NMspecific ifindex from 16-bit to
32-bit.
snmp-agent ifmib long-ifindex
enable
Optional.
By default, an NM-specific ifindex
is in 16-bit format.
CAUTION:
Some configurations use parameters that relate to NM-specific ifindex, so the switch of NM-specific
ifindex causes temporary ineffectiveness of these configurations. If the format of the ifindex is switched
back, the configurations will become effective again. Perform the configurations again with the new
NM-specific ifindexes, and then the related configurations become effective. For example, in the
configuration of RMON alarm group and private alarm group, the alarm variables are presented in the
format of OID/variable-name.NM-specific-ifindex; the switching of NM-specific ifindex format makes
the RMON alarm variables ineffective. To monitor the affected nodes again, re-configure the alarm
groups with the new format of NM-specific ifindexes.
Configuring SNMP logging
SNMP logs the Get and Set operations that the NMS performs on the SNMP agent. When the GET
operation is performed, the agent logs the IP address of the NMS, node name of the GET operation and
OID of the node. When the SET operation is performed, the agent logs the IP address of the NMS, node
name of the SET operation, OID of the node, the value configured, and the error code and error index
of the SET response. These logs will be sent to the information center. The level of them is informational
and they are taken as the system prompt information. With parameters for the information center
configured, the output rules for SNMP logs are decided, meaning whether the logs are permitted to
display the output destinations.
SNMP logs Get requests, Set requests and Set responses, but does not log Get responses.
Enabling SNMP logging
To do…
Use the command…
Remarks
1. Enter system view.
system-view
—
2. Enable SNMP logging.
snmp-agent log { all | getoperation | set-operation }
Required.
3. Configure SNMP log output
rules.
info-center source { module-name
| default } channel { channelnumber | channel-name } [ debug
{ level severity | state state } * |
log { level severity | state state } *
| trap { level severity | state state
}*]*
102
Disabled by default.
Optional.
By default, SNMP logs are only
output to loghost and logfile. To
output SNMP logs to other
destinations such as the console
or a monitor terminal, you must
set the output destinations with
this command.
NOTE:
• A large number of logs occupy storage space of the device, which impacts the performance of the
device. HP recommends that you disable SNMP logging.
• The total output size for the node and value fields in each log entry is 1024 bytes. If this limit is
exceeded, the information center truncates the data in the fields.
• For more information about system information, the information center and the info-center source
command, see Information center configuration in the Network Management and Monitoring
Configuration Guide.
Configuring SNMP trap
Enabling the trap function
The SNMP agent sends traps to the NMS to inform the NMS of critical and important events, such as
reboot of a managed device. Two types of traps are available: generic traps and vendor-specific traps.
Generic traps supported on the device include: authentication, coldstart, linkdown, linkup and
warmstart. The others are self-defined traps, which are generated by different modules. As traps that
occupy large device memory affect device performance, do not enable the trap function for all modules
but for the specific modules as needed.
With the trap function enabled on a module, the traps generated by the module are sent to the
information center. The information center has seven information output destinations. By default, the
following rules apply:
•
Traps of all modules are allowed to be output to the console, monitor terminal (monitor), loghost,
and logfile; traps of all modules and with levels equal to or higher than warnings are allowed to be
output to the trapbuffer and SNMP module (snmpagent)
•
Traps cannot be sent to the logbuffer. You can set parameters for the information center based on
the levels of the traps generated by each module, and decide the output rules of traps, which
specify whether traps are allowed to be output and the output destinations. For more information
about the information center, see Information center configuration in the Network Management and
Monitoring Configuration Guide.
To enable the trap function:
To do…
Use the command…
Remarks
1. Enter system view.
system-view
—
2. Enable the trap
function globally.
snmp-agent trap enable [ acfp [ client | policy | rule
| server ] | arp rate-limit | bfd | bgp |
configuration | default-route | flash | mpls | ospf [
process-id ] [ ifauthfail | ifcfgerror | ifrxbadpkt |
ifstatechange | iftxretransmit |
lsdbapproachoverflow | lsdboverflow | maxagelsa
| nbrstatechange | originatelsa | vifcfgerror |
virifauthfail | virifrxbadpkt | virifstatechange |
viriftxretransmit | virnbrstatechange ] * | standard
[ authentication | coldstart | linkdown | linkup |
warmstart ]* | system | vrrp [ authfailure |
newmaster ] ]
103
Optional.
Only the trap function
of the default-route
module is disabled;
and the trap function of
other modules is
enabled.
To do…
Use the command…
Remarks
1. Enter interface view.
interface interface-type interface-number
—
2. Enable the trap
function of interface
state changes.
enable snmp trap updown
Optional.
Enabled by default.
CAUTION:
• To enable an interface to send linkUp/linkDown traps when its state changes, enable the trap
function on an interface and globally. To enable the trap function on an interface, use the enable
snmp trap updown command. To enable this function globally, use the snmp-agent trap enable [
standard [ linkdown | linkup ] * ] command.
• To make each module generate corresponding traps, enable the trap function with the snmp-agent
trap enable command. The generation of traps by a module may also depend on the configuration
of the module. For more information, see related descriptions of the modules.
Configuring trap parameters
Configuration prerequisites
Before you configure trap parameters:
•
Basic SNMP configurations are completed. These configurations include version configuration.
Community name is needed when SNMPv1 and v2c are adopted; username and MIB view are
needed if SNMPv3 is adopted. Configuration of these parameters must be the same with that on
the NMS.
•
A connection has been established between the device and the NMS, and they can operate each
other.
Configuration procedure
When traps are sent to the SNMP module, the SNMP module saves the traps in the trap queue. You can
set the size of the queue and the holding time of the traps in the queue, and send the traps to the
specified destination host, usually the NMS.
To configure trap parameters:
To do…
Use the command…
Remarks
1. Enter system view.
system-view
—
Optional.
2. Configure target host attribute
for traps.
snmp-agent target-host trap
address udp-domain { ip-address
| ipv6 ipv6-address } [ udp-port
port-number ] [ vpn-instance vpninstance-name ] params
securityname security-string [ v1 |
v2c | v3 [ authentication |
privacy ] ]
3. Configure the source address
for traps.
snmp-agent trap source interfacetype interface-number
104
The vpn-instance keyword is
applicable in an IPv4 network.
To send the traps to the NMS, this
command is required and you
must specify ip-address as the IP
address of the NMS.
Optional.
To do…
Use the command…
Remarks
Optional.
4. Extend the standard
linkUp/linkDown traps
defined in RFC.
snmp-agent trap if-mib link
extended
5. Configure the size of the trap
send queue.
snmp-agent trap queue-size size
6. Configure the holding time of
the traps in the queue.
snmp-agent trap life seconds
Standard linkUp/linkDown traps
defined in RFC are used by
default.
Optional.
100 by default.
Optional.
120 seconds by default.
NOTE:
• An extended linkUp/linkDown trap is the standard linkUp/linkDown trap—defined in RFC—
appended with interface description and interface type information. If the extended messages are not
supported on the NMS, disable this function to let the device send standard linkUp/linkDown traps.
• If the sending queue of traps is full, the system automatically deletes some oldest traps to receive new
traps.
• The system automatically deletes the traps whose holding time expires.
Displaying and maintaining SNMP
To do…
Use the command…
Display SNMP agent system
information, including the contact,
location, and version of the
SNMP
display snmp-agent sys-info [ contact | location |
version ]* [ | { begin | exclude | include } regularexpression ]
Display SNMP agent statistics
display snmp-agent statistics [ | { begin | exclude |
include } regular-expression ]
Display the SNMP agent engine
ID
display snmp-agent local-engineid [ | { begin |
exclude | include } regular-expression ]
Display SNMP agent group
information
display snmp-agent group [ group-name ] [ | { begin |
exclude | include } regular-expression ]
Display basic information of the
trap queue
display snmp-agent trap queue [ | { begin | exclude |
include } regular-expression ]
Display the modules that can send
traps and whether their trap
sending is enabled or not
display snmp-agent trap-list [ | { begin | exclude |
include } regular-expression ]
Display SNMPv3 agent user
information
display snmp-agent usm-user [ engineid engineid |
username user-name | group group-name ] * [ | {
begin | exclude | include } regular-expression ]
Display SNMPv1 or v2c agent
community information
display snmp-agent community [ read | write ] [ | {
begin | exclude | include } regular-expression ]
Display MIB view information for
an SNMP agent
display snmp-agent mib-view [ exclude | include |
viewname view-name ] [ | { begin | exclude | include
} regular-expression ]
105
Remarks
Available in
any view
Configuring SNMPv1/SNMPv2c example
Network requirements
•
As shown in Figure 38, the NMS connects to the agent through an Ethernet.
•
The IP address of the NMS is 1.1.1.2/24.
•
The IP address of the agent is 1.1.1.1/24.
•
The NMS monitors and manages the agent using SNMPv1 or SNMPv2c. The agent reports errors
or faults to the NMS.
Figure 38 Network diagram for SNMPv1/v2c
Configuration procedure
1.
Configuring the SNMP agent
# Configure the IP address of the agent as 1.1.1.1/24 and make sure that the agent and the NMS are
reachable to each other. (The configuration procedure is omitted here)
# Configure the SNMP basic information, including the version and community name.
<Sysname> system-view
[Sysname] snmp-agent sys-info version v1 v2c
[Sysname] snmp-agent community read public
[Sysname] snmp-agent community write private
# Configure the contact person and physical location information of the switch.
[Sysname] snmp-agent sys-info contact Mr.Wang-Tel:3306
[Sysname] snmp-agent sys-info location telephone-closet,3rd-floor
# Enable the sending of traps to the NMS with an IP address of 1.1.1.2/24, using public as the
community name.
[Sysname] snmp-agent trap enable
[Sysname] snmp-agent target-host trap address udp-domain 1.1.1.2 params securityname
public v1
Make sure that the SNMP version specified in the snmp-agent target-host command is the same as that
on the NMS; otherwise, the NMS cannot receive any trap.
2.
Configuring the SNMP NMS
With SNMPv1/v2c, the user needs to specify the read only community, the read and write community,
the timeout time, and number of retries. The user can inquire and configure the device through the NMS.
NOTE:
The configurations on the agent and the NMS must match.
3.
Verify the configuration
•
After the configuration, an SNMP connection is established between the NMS and the agent. The
NMS can get and configure the values of some parameters on the agent through MIB nodes.
106
•
Execute the shutdown or undo shutdown command to an idle interface on the agent, and the NMS
receives the corresponding trap.
Configuring SNMPv3 example
Network requirements
•
As shown in Figure 39, the NMS connects to the agent through an Ethernet.
•
The IP address of the NMS is 1.1.1.2/24.
•
The IP address of the agent is 1.1.1.1/24.
•
The NMS monitors and manages the interface status of the agent using SNMPv3. The agent reports
errors or faults to the NMS. The inbound port for traps on the NMS is 5000.
•
Authentication is required when the NMS and the agent establish an SNMP connection. The
authentication protocol is MD5 and the authentication key is authkey. The packets transmitted
between the NMS and the agent needs to be encrypted. The privacy protocol is DES and the
privacy password is prikey.
Figure 39 Network diagram for SNMPv3
Configuration procedure
1.
Configuring the agent
# Configure the IP address of the agent as 1.1.1.1/24 and make sure that the agent and the NMS can
reach each other. (The configuration procedure is omitted here)
# Configure the access right: the user can read and write the objects under the interface node with the
OID of 1.3.6.1.2.1.2, and cannot access other MIB objects. Set the user name to managev3user,
authentication protocol to MD5, authentication key to authkey, the privacy protocol to DES56, and the
privacy password to prikey.
<Sysname> system-view
[Sysname] undo snmp-agent mib-view ViewDefault
[Sysname] snmp-agent mib-view included test interfaces
[Sysname] snmp-agent group v3 managev3group read-view test write-view test
[Sysname] snmp-agent usm-user v3
authkey privacy-mode des56 prikey
managev3user
managev3group
authentication-mode
md5
# Configure the contact person and physical location information of the device.
[Sysname] snmp-agent sys-info contact Mr.Wang-Tel:3306
[Sysname] snmp-agent sys-info location telephone-closet,3rd-floor
# Enable sending of traps to the NMS with an IP address of 1.1.1.2/24, using managev3user as the
community name.
[Sysname] snmp-agent trap enable
[Sysname] snmp-agent target-host trap address udp-domain 1.1.1.2 params securityname
managev3user v3 privacy
107
2.
Configuring the SNMP NMS
SNMPv3 uses an authentication and privacy security model. On the NMS, the user needs to specify the
username and security level, and based on that level, configure the authentication mode, authentication
password, privacy mode, and privacy password. In addition, the timeout time and number of retries
should also be configured. The user can inquire and configure the device through the NMS.
NOTE:
The configurations on the agent and the NMS must match.
3.
Verify the configuration
•
After the configuration, an SNMP connection is established between the NMS and the agent. The
NMS can get and configure the values of some parameters on the agent through MIB nodes.
•
Execute the shutdown or undo shutdown command to an idle interface on the agent, and the NMS
receives the corresponding trap.
Configuring SNMP logging example
Network requirements
•
As shown in Figure 40, the NMS and the agent are connected through an Ethernet.
•
The IP address of the NMS is 1.1.1.2/24
•
The IP address of the agent is 1.1.1.1/24
•
Configure SNMP logging on the agent to record the operations performed by the NMS to the
agent
Figure 40 Network diagram for SNMP logging
Configuration procedure
NOTE:
For the configurations for the NMS and agent, see Configuring SNMPv1/SNMPv2c example and
Configuring SNMPv3 example.
# Enable logging display on the terminal. (This function is enabled by default so that you can omit this
configuration).
<Sysname> terminal monitor
<Sysname> terminal logging
108
# Enable the information center to output the system information with the severity level equal to or higher
than informational to the console port.
<Sysname> system-view
[Sysname] info-center source snmp channel console log level informational
# Enable SNMP logging on the agent to log the GET and SET operations of the NMS.
[Sysname] snmp-agent log get-operation
[Sysname] snmp-agent log set-operation
The following log information is displayed on the terminal when the NMS performs the Get
operation to the agent.
•
%Jan 1 02:49:40:566 2006 Sysname SNMP/6/GET:
seqNO = <10> srcIP = <1.1.1.2> op = <get> node = <sysName(1.3.6.1.2.1.1.5.0)> value=<>
The following log information is displayed on the terminal when the NMS performs the Set
operation to the agent.
•
%Jan 1 02:59:42:576 2006 Sysname SNMP/6/SET:
seqNO = <11> srcIP = <1.1.1.2> op = <set> errorIndex = <0> errorStatus =<noError> node =
<sysName(1.3.6.1.2.1.1.5.0)> value = <Sysname>
Table 2 Description on the output field of SNMP log
Field
Description
Jan 1 02:49:40:566 2006
Time when the SNMP log is generated.
seqNO
Serial number of the SNMP log. The system numbers the
recorded SNMP logs automatically; the serial number starts
from 0.
srcIP
IP address of the NMS.
op
SNMP operation type (GET or SET).
node
Node name of the SNMP operations and OID of the
instance.
erroIndex
Error index, with 0 meaning no error.
errorstatus
Error status, with noError meaning no error.
Value set when the SET operation is performed. This field is
null, meaning the value obtained with the GET operation is
not logged.
value
When the value is a string of characters and the string
contains characters not ranging from ASCII 0 to 127 or
invisible characters, the string is displayed in hexadecimal.
For example, value = <81-43>[hex].
NOTE:
The system information of the information center can be output to the terminal or to the log buffer. In
this example, SNMP logs are output to the terminal. For configuration of SNMP log output to other
destinations, see Information center configuration in the Network Management and Monitoring
Configuration Guide.
109
Configuring RMON
RMON is used by management devices to monitor and manage the managed devices on the network by
implementing such functions as statistics collection and alarm generation. The statistics collection function
enables a managed device to periodically or continuously track various traffic information on the
network segments connecting to its ports, such as total number of received packets or total number of
oversize packets received. The alarm function enables a managed device to monitor the value of a
specified MIB variable, log the event and send a trap to the management device when the value reaches
the threshold, such as the port rate reaches a certain value or the potion of broadcast packets received
in the total packets reaches a certain value.
Both the RMON protocol and the SNMP are used for remote network management:
•
RMON is implemented on the basis of the SNMP, and is an enhancement to SNMP. RMON sends
traps to the management device to notify the abnormality of the alarm variables by using the SNMP
trap packet sending mechanism. Although trap is also defined in SNMP, it usually notifies the
management device whether some functions on managed devices operate normally and the
change of physical status of interfaces. Traps in RMON and those in SNMP have different
monitored targets, triggering conditions, and report contents.
•
RMON provides an efficient means of monitoring subnets and allows SNMP to monitor remote
network devices in a more proactive, effective way. The RMON protocol defines that when an
alarm threshold is reached on a managed device, the managed device sends a trap to the
management device automatically, so the management device does not need to get the values of
MIB variables for multiple times and compare them, reducing the communication traffic between the
management device and the managed device. In this way, you can manage a large scale network
easily and effectively.
Working mechanism
RMON allows multiple monitors (management devices). A monitor provides the following methods for
data gathering:
•
Using RMON probes. Management devices can obtain management information from RMON
probes directly and control network resources. In this approach, management devices can obtain
all RMON MIB information.
•
Embedding RMON agents in network devices such as routers, switches, and hubs to provide the
RMON probe function. Management devices exchange data with RMON agents by using basic
SNMP operations to gather network management information, which, due to system resources
limitation, only covers four groups of MIB information, alarm, event, history, and statistics, in most
cases.
The HP device adopts the second way and realizes the RMON agent function. With the RMON agent
function, the management device can obtain the traffic that flow among the managed devices on each
connected network segments; obtain information about error statistics and performance statistics for
network management.
110
RMON groups
Among the RMON groups defined by RMON specifications (RFC 2819), the device has realized the
statistics group, history group, event group, and alarm group supported by the public MIB. Besides, HP
also defines and implements the private alarm group, which enhances the functions of the alarm group.
This section describes the five kinds of groups in general.
Ethernet statistics group
The statistics group collects statistics of various traffic information on an Ethernet interface and saves the
statistics in the Ethernet statistics table (ethernetStatsTable) for query convenience of the management
device. It provides statistics about network collisions, CRC alignment errors, undersize/oversize packets,
broadcasts, multicasts, bytes received, packets received, and so on.
After the creation of a statistics entry on an interface, the statistics group starts to collect traffic statistics
on the interface. The result of the statistics is a cumulative sum.
History group
The history group periodically collects statistics of traffic information on an interface and saves the
statistics in the history record table (ethernetHistoryTable) for query convenience of the management
device. The statistics include bandwidth utilization, number of error packets, and total number of
packets.
A history group collects statistics on packets received on the interface during each period, which can be
configured at the CLI.
Event group
The event group defines event indexes and controls the generation and notifications of the events
triggered by the alarms defined in the alarm group and the private alarm group. The events can be
handled in one of the following methods:
•
Log—Logging event related information (the occurred events, contents of the event, and so on) in
the event log table of the RMON MIB of the device, and the management device can check the
logs through the SNMP Get operation.
•
Trap—Sending a trap to notify the occurrence of this event to the network management station
(NMS).
•
Log-Trap—Logging event information in the event log table and sending a trap to the NMS.
•
None—No action.
Alarm group
The RMON alarm group monitors specified alarm variables, such as total number of received packets —
etherStatsPkts—on an interface. After you define an alarm entry, the system gets the value of the
monitored alarm variable at the specified interval, when the value of the monitored variable is greater
than or equal to the rising threshold, a rising event is triggered; when the value of the monitored
variable is smaller than or equal to the falling threshold, a falling event is triggered. The event is then
handled as defined in the event group.
If the value of a sampled alarm variable overpasses the same threshold multiple times, only the first one
can cause an alarm event, which means the rising alarm and falling alarm are alternate. As shown in
Figure 41, the value of an alarm variable (the black curve in the figure) overpasses the threshold value
(the blue line in the figure) for multiple times, and multiple crossing points are generated, but only
crossing points marked with the red crosses can trigger alarm events.
111
Figure 41 Rising and falling alarm events
Private alarm group
The private alarm group calculates the values of alarm variables and compares the result with the
defined threshold, realizing a more comprehensive alarming function.
The system handles the prialarm alarm table entry—as defined by the user—in the following ways:
•
Periodically samples the prialarm alarm variables defined in the prialarm formula.
•
Calculates the sampled values based on the prialarm formula.
•
Compares the result with the defined threshold and generates an appropriate event if the threshold
value is reached.
NOTE:
If the count result of the private alarm group overpasses the same threshold multiple times, only the first
one can cause an alarm event, which means the rising alarm and falling alarm are alternate.
Configuring the RMON statistics function
RMON statistics function can be implemented by either the Ethernet statistics group or the history group,
but the objects of the statistics are different, you can configure a statistics group or a history group.
•
A statistics object of the Ethernet statistics group is a variable defined in the Ethernet statistics table,
and the recorded content is a cumulative sum of the variable from the time the statistics entry is
created to the current time. For more information, see Configuring the RMON Ethernet statistics
function.
•
A statistics object of the history group is the variable defined in the history record table, and the
recorded content is a cumulative sum of the variable in each period. For more information, see
Configuring the RMON history statistics function.
112
Configuring the RMON Ethernet statistics function
To configure the RMON Ethernet statistics function:
To do…
Use the command…
Remarks
1. Enter system view.
system-view
—
2. Enter Ethernet interface view.
interface interface-type interface-number
—
3. Create an entry in the RMON
statistics table.
rmon statistics entry-number [ owner text ]
Required
NOTE:
• Only one statistics entry can be created on one interface.
• Up to 100 statistics entries can be created for the device. When the number of statistics entries
exceeds 100, the creation of a new entry fails.
Configuring the RMON history statistics function
To configure the RMON history statistics function:
To do…
Use the command…
Remarks
1. Enter system view.
system-view
—
2. Enter Ethernet interface view.
interface interface-type interface-number
—
3. Create an entry in the RMON
history control table.
rmon history entry-number buckets number
interval sampling-interval [ owner text ]
Required
NOTE:
• The entry-number must be globally unique and cannot be used on another interface; otherwise, the
operation fails.
• You can configure multiple history entries on one interface, but the values of the entry-number
arguments must be different, and the values of the sampling-interval arguments must be different too;
otherwise, the operation fails.
• Up to 100 history entries can be created for the device.
• When you create an entry in the history table, if the specified buckets number argument exceeds the
history table size supported by the device, the entry is created. However, the validated value of the
buckets number argument that corresponds to the entry is the history table size supported by the
device.
113
Configuring the RMON alarm function
Configuration prerequisites
Before you configure the RMON alarm function, complete the following tasks:
•
To enable the managed devices to send traps to the NMS when the NMS triggers an alarm event,
configure the SNMP agent as described in SNMP configuration in the Network Management and
Monitoring Configuration Guide.
•
If the alarm variable is the MIB variable defined in the history group or the Ethernet statistics group,
make sure that the RMON Ethernet statistics function or the RMON history statistics function is
configured on the monitored Ethernet interface; otherwise, the creation of the alarm entry fails, and
no alarm event is triggered.
Configuration procedure
To configure the RMON alarm function:
To do…
Use the command…
Remarks
1. Enter system view.
system-view
—
2. Create an event entry in the
event table.
rmon event entry-number [ description string ] {
log | log-trap log-trapcommunity | none | trap
trap-community } [ owner text ]
Required.
3. Create an entry in the alarm
table.
rmon alarm entry-number alarm-variable
sampling-interval { absolute | delta } risingthreshold threshold-value1 event-entry1 fallingthreshold threshold-value2 event-entry2 [ owner
text ]
4. Create an entry in the private
alarm table.
rmon prialarm entry-number prialarm-formula
prialarm-des sampling-interval { absolute |
changeratio | delta } rising-threshold thresholdvalue1 event-entry1 falling-threshold thresholdvalue2 event-entry2 entrytype { forever | cycle
cycle-period } [ owner text ]
Required.
Use at least one
command.
NOTE:
• A new entry cannot be created if its parameters are identical with the parameters of an existing
entry. If the created entry is a history entry, it will only be compared with the existing history entries
on the same interface. See Table 3 for the parameters to be compared for different entries.
• The system limits the total number of each type of entries (See Table 3 for the detailed numbers).
When the total number of an entry reaches the maximum number of entries that can be created, the
creation fails.
114
Table 3 Restrictions on the configuration of RMON
Entry
Parameters to be compared
Maximum number of
entries that can be
created
Event
Event description (description string), event type (log, trap,
logtrap or none) and community name (trap-community or
log-trapcommunity)
60
Alarm
Alarm variable (alarm-variable), sampling interval
(sampling-interval), sampling type (absolute or delta), rising
threshold (threshold-value1) and falling threshold (thresholdvalue2)
60
Prialarm
Alarm variable formula (alarm-variable), sampling interval
(sampling-interval), sampling type (absolute, changeratio or
delta), rising threshold (threshold-value1) and falling
threshold (threshold-value2)
50
Displaying and maintaining RMON
To do…
Use the command…
Remarks
Display RMON statistics
display rmon statistics [ interfacetype interface-number ] [ | { begin
| exclude | include } regularexpression ]
Available in any view
Display the RMON history control
entry and history sampling
information
display rmon history [ interfacetype interface-number ] [ | { begin
| exclude | include } regularexpression ]
Available in any view
Display RMON alarm
configuration information
display rmon alarm [ entrynumber ] [ | { begin | exclude |
include } regular-expression ]
Available in any view
Display RMON prialarm
configuration information
display rmon prialarm [ entrynumber ] [ | { begin | exclude |
include } regular-expression ]
Available in any view
Display RMON events
configuration information
display rmon event [ entry-number
] [ | { begin | exclude | include }
regular-expression ]
Available in any view
Display log information for the
specified or all event entries.
display rmon eventlog [ entrynumber ] [ | { begin | exclude |
include } regular-expression ]
Available in any view
115
Configuring Ethernet statistics group example
Network requirements
As shown in Figure 42, Agent is connected to a configuration terminal through its console port and to
Server through Ethernet cables.
Gather performance statistics on received packets on GigabitEthernet 1/0/1 through RMON Ethernet
statistics table, and the administrator can view the statistics on packets received on the interface at any
time.
Figure 42 Network diagram for RMON
Configuration procedure
# Configure RMON to gather statistics for interface GigabitEthernet 1/0/1.
<Sysname> system-view
[Sysname] interface GigabitEthernet 1/0/1
[Sysname-GigabitEthernet1/0/1] rmon statistics 1 owner user1
After the configuration, the system gathers statistics on packets received on GigabitEthernet 1/0/1. To
view the statistics of the interface:
Execute the display command.
•
<Sysname> display rmon statistics GigabitEthernet 1/0/1
EtherStatsEntry 1 owned by user1-rmon is VALID.
Interface : GigabitEthernet1/0/1<ifIndex.3>
etherStatsOctets
: 21657
, etherStatsPkts
etherStatsBroadcastPkts
: 56
, etherStatsMulticastPkts : 34
etherStatsUndersizePkts
: 0
, etherStatsOversizePkts
: 0
etherStatsFragments
: 0
, etherStatsJabbers
: 0
, etherStatsCollisions
: 0
etherStatsCRCAlignErrors : 0
: 307
etherStatsDropEvents (insufficient resources): 0
Packets received according to length:
64
: 235
256-511: 1
•
,
65-127
,
512-1023: 0
: 67
,
128-255
,
1024-1518: 0
: 4
Obtain the value of the MIB node directly by executing the SNMP Get operation on the NMS
through software.
116
Configuring history group example
Network requirements
As shown in Figure 43, Agent is connected to a configuration terminal through its console port and to
Server through Ethernet cables.
Gather statistics on received packets on GigabitEthernet 1/0/1 every one minute through RMON history
statistics table, and the administrator can view whether data burst happens on the interface in a short
time.
Figure 43 Network diagram for RMON
Configuration procedure
# Configure RMON to periodically gather statistics for interface GigabitEthernet 1/0/1.
<Sysname> system-view
[Sysname] interface GigabitEthernet 1/0/1
[Sysname-GigabitEthernet1/0/1] rmon history 1 buckets 8 interval 60 owner user1
After the configuration, the system periodically gathers statistics on packets received on GigabitEthernet
1/0/1: the statistical interval is 1 minute, and statistics of the last 8 times are saved in the history
statistics table. To view the statistics of the interface:
•
Execute the display command.
[Sysname-GigabitEthernet1/0/1] display rmon history
HistoryControlEntry 2 owned by null is VALID
Samples interface
: GigabitEthernet1/0/1<ifIndex.3>
Sampled values of record 1 :
dropevents
: 0
, octets
: 834
packets
: 8
, broadcast packets
: 1
multicast packets : 6
, CRC alignment errors : 0
undersize packets : 0
, oversize packets
: 0
fragments
: 0
, jabbers
: 0
collisions
: 0
, utilization
: 0
Sampled values of record 2 :
dropevents
: 0
, octets
: 962
packets
: 10
, broadcast packets
: 3
multicast packets : 6
, CRC alignment errors : 0
undersize packets : 0
, oversize packets
: 0
fragments
: 0
, jabbers
: 0
collisions
: 0
, utilization
: 0
117
Sampled values of record 3 :
dropevents
: 0
, octets
: 830
packets
: 8
, broadcast packets
: 0
multicast packets : 6
, CRC alignment errors : 0
undersize packets : 0
, oversize packets
: 0
fragments
: 0
, jabbers
: 0
collisions
: 0
, utilization
: 0
Sampled values of record 4 :
dropevents
: 0
, octets
: 933
packets
: 8
, broadcast packets
: 0
multicast packets : 7
, CRC alignment errors : 0
undersize packets : 0
, oversize packets
: 0
fragments
: 0
, jabbers
: 0
collisions
: 0
, utilization
: 0
Sampled values of record 5 :
dropevents
: 0
, octets
: 898
packets
: 9
, broadcast packets
: 2
multicast packets : 6
, CRC alignment errors : 0
undersize packets : 0
, oversize packets
: 0
fragments
: 0
, jabbers
: 0
collisions
: 0
, utilization
: 0
Sampled values of record 6 :
dropevents
: 0
, octets
: 898
packets
: 9
, broadcast packets
: 2
multicast packets : 6
, CRC alignment errors : 0
undersize packets : 0
, oversize packets
: 0
fragments
: 0
, jabbers
: 0
collisions
: 0
, utilization
: 0
Sampled values of record 7 :
dropevents
: 0
, octets
: 766
packets
: 7
, broadcast packets
: 0
multicast packets : 6
, CRC alignment errors : 0
undersize packets : 0
, oversize packets
: 0
fragments
: 0
, jabbers
: 0
collisions
: 0
, utilization
: 0
Sampled values of record 8 :
dropevents
: 0
, octets
: 1154
packets
: 13
, broadcast packets
: 1
multicast packets : 6
, CRC alignment errors : 0
undersize packets : 0
, oversize packets
: 0
fragments
, jabbers
: 0
: 0
collisions
: 0
•
, utilization
: 0
Obtain the value of the MIB node directly by executing the SNMP Get operation on the NMS
through software.
118
Configuring alarm group example
Network requirements
As shown in Figure 44, Agent is connected to a console terminal through its console port and to an
NMS across Ethernet.
Do the following:
•
Connect GigabitEthernet 1/0/1 to the FTP server. Gather statistics on traffic of the server on
GigabitEthernet 1/0/1 with the sampling interval being five seconds. When traffic is above or
below the thresholds, Agent sends the corresponding traps to the NMS.
•
Execute the display rmon statistics command on Agent to display the statistics, and query the
statistics on the NMS.
Figure 44 Network diagram for RMON
Configuration procedure
# Configure the SNMP agent. Parameter values configured on the agent must be the same as the
following configured on the NMS: suppose SNMPv1 is enabled on the NMS, the read community name
is public, the write community name is private, the IP address of the NMS is 1.1.1.2, authentication
protocol is MD5, authorization password is authkey, the privacy protocol is DES56, and the privacy
password is prikey.
<Sysname> system-view
[Sysname] snmp-agent
[Sysname] snmp-agent community read public
[Sysname] snmp-agent community write private
[Sysname] snmp-agent sys-info version v1
[Sysname] snmp-agent trap enable
[Sysname] snmp-agent target-host trap address udp-domain 1.1.1.2 params securityname
public
# Configure RMON to gather statistics on interface GigabitEthernet 1/0/1.
[Sysname] interface GigabitEthernet 1/0/1
[Sysname-GigabitEthernet1/0/1] rmon statistics 1 owner user1
[Sysname-GigabitEthernet1/0/1] quit
# Create an RMON alarm entry that when the delta sampling value of node 1.3.6.1.2.1.16.1.1.1.4.1
exceeds 100 or is lower than 50, event 1 is triggered to send traps.
[Sysname] rmon event 1 trap public owner user1
[Sysname] rmon alarm 1 1.3.6.1.2.1.16.1.1.1.4.1 5 delta rising-threshold 100 1 fallingthreshold 50 1
119
# Display the RMON alarm entry configuration.
<Sysname> display rmon alarm 1
AlarmEntry 1 owned by null is Valid.
Samples type
: delta
Variable formula
: 1.3.6.1.2.1.16.1.1.1.4.1<etherStatsOctets.1>
Sampling interval
: 5(sec)
Rising threshold
: 100(linked with event 1)
Falling threshold
: 50(linked with event 2)
When startup enables
: risingOrFallingAlarm
Latest value
: 0
# Display statistics for interface GigabitEthernet 1/0/1.
<Sysname> display rmon statistics GigabitEthernet 1/0/1
EtherStatsEntry 1 owned by user1-rmon is VALID.
Interface : GigabitEthernet1/0/1<ifIndex.3>
etherStatsOctets
: 57329
, etherStatsPkts
etherStatsBroadcastPkts
: 53
, etherStatsMulticastPkts : 353
etherStatsUndersizePkts
: 0
, etherStatsOversizePkts
: 0
etherStatsFragments
: 0
, etherStatsJabbers
: 0
, etherStatsCollisions
: 0
etherStatsCRCAlignErrors : 0
: 455
etherStatsDropEvents (insufficient resources): 0
Packets received according to length:
64
: 7
,
65-127
256-511: 0
,
512-1023: 0
: 413
,
128-255
,
1024-1518: 0
: 35
After completing the configuration, you may query alarm events on the NMS. On the monitored device,
alarm event messages are displayed when events occur. The following is a sample output:
[Sysname]
#Aug 27 16:31:34:12 2005 Sysname RMON/2/ALARMFALL:Trap 1.3.6.1.2.1.16.0.2 Alarm table 1
monitors 1.3.6.1.2.1.16.1.1.1.4.1 with sample type 2,has sampled alarm value 0 less
than(or =) 50.
120
Configuring CWMP
The CWMP is initiated and developed by the DSL Forum. CWMP is numbered TR-069 by the forum, and
is thus also called the TR-069 protocol.
CWMP is designed to be applied to DSL access networks, which are hard to manage because devices
are located at the customer premise, dispersed, and large in number. CWMP makes the management
easier by using an ACS to perform remote centralized management of CPE.
A large-sale data center network has similar network environment as a DSL access network, so you can
use CWMP to remotely configure, manage, and maintain the switches in batches in the data center
network.
The HP A5800 and A5820X switches support the CWMP protocol. When starting up for the first time to
access the network, an HP A5800 and A5820X switch functions as a CPE and automatically downloads
the configuration file from the ACS. Compared with traditional manual configuration, remote and unified
configuration by using CWMP offers the following benefits:
•
Deployment of unified configuration to switches providing the same services. This reduces
workloads and improves configuration deployment efficiency.
•
Auto-configuration of access switches. This enables the switches to access the network after startup
without the need of manual configuration and reduces costs.
•
Pre-generation of the configuration file. This reduces the error probability of manual configuration.
CWMP network framework
Figure 45 illustrates the basic framework of a CWMP network.
Figure 45 Network diagram for CWMP
NOTE:
In a real network, the DHCP server, ACS, and DNS server can locate on the same server as three
logical components.
121
As shown in the figure, a CWMP network includes the following roles:
•
CPE—Managed switch in the network. A CPE reports its information to the ACS and obtains
configurations from the ACS.
•
ACS—Auto-configuration server. An ACS delivers configurations to CPEs and provides
management services to CPEs. In this document, ACS refers to the server installed with the HP iMC
BIMS.
•
DNS server—Domain name system server. An ACS and a CPE use URLs to identify and access each
other. DNS is used to resolve the URLs.
•
DHCP server—DHCP server, which assigns IP addresses to CPEs, and uses the options filed in the
DHCP packet to provide configuration parameters (such as URL) to the CPEs.
CWMP basic functions
Automatic configuration file deployment
The network administrator can create different configuration files on the ACS for access switches
according to their service functions to realize fast configuration. After a connection is established
between the ACS and a CPE, the ACS determines the type of the CPE and delivers the corresponding
configuration file to the CPE. In this way, CPEs of the same type obtain the same service configurations.
The ACS divides CPEs by their switch models or serial IDs.
A configuration file delivered by the ACS can be either the startup configuration or the running
configuration on the CPE.
•
Startup configuration: The configuration file delivered by the ACS overwrites the default
configuration file on the CPE. After the CPE reboots, it runs the new configuration file.
•
Running configuration. The configuration file delivered by the ACS is written to the running
configuration file on the CPE, and the new configurations take effect immediately. You must save
the new configurations to make them survive a switch reboot.
CPE system file management
The network administrator can save important files such as the application file and configuration file of a
CPE to an ACS. If the ACS finds that a file is updated, it notifies the CPE to download the file by sending
a request. After the CPE receives the request, it automatically downloads the file from the specified file
server according to the filename and downloading address provided in the ACS request. After the CPE
downloads the file, it checks the file validity and then report the download result (success or failure) to
the ACS.
CPEs can download the following types of files from the ACS: application file and configuration file.
To backup important data, a CPE can upload the current configuration file and log files to the specified
server according to the requirement of an ACS.
CPE status and performance monitoring
An ACS can monitor the parameters of a CPE connected to it. Different CPEs have different
performances and functionalities. Therefore the ACS must be able to identify each type of CPE and
monitor the current configuration and configuration changes of each CPE. CWMP also allows the
122
administrator to define monitor parameters and get the parameter values through an ACS, so as to get
the CPE status and statistics information.
The status and performance that can be monitored by an ACS include:
•
Manufacture name (Manufacturer)
•
ManufacturerOUI
•
SerialNumber
•
HardwareVersion
•
SoftwareVersion
•
DeviceStatus
•
UpTime
•
Configuration file (ConfigFile)
•
ACS address (URL)
•
ACS username (Username)
•
ACS password (Password)
•
PeriodicInformEnable
•
PeriodicInformInterval
•
PeriodicInformTime
•
CPE address (ConnectionRequestURL)
•
CPE username (ConnectionRequestUsername)
•
CPE password (ConnectionRequestPassword)
CWMP mechanism
Auto-connection between the ACS and a CPE
When a CPE starts up for the first time, it automatically obtains an IP address from the DHCP server,
which informs the CPE of the following information:
•
The URL address of the ACS (assigned by the DHCP server through Option 43)
•
Username and password for connecting the ACS (assigned by the DHCP server through Option 43)
•
DNS server address (directly assigned)
After the CPE receives the above information, it has the IP address of the ACS resolved by the DNS
server, and sends a connection request to the ACS. If the CPE passes the authentication with the
acquired username and password, the connection between the ACS and the CPE is established.
If the current session is not finished but the connection between ACS and CPE is interrupted, the CPE
automatically establishes a new connection with the ACS until the number of CPE auto-connection retries
reaches the limit.
The CPE can send connection requests either periodically or at the specified time to the ACS. The ACS
can initiate a connection request to the CPE at any time, and can establish a connection with the CPE
after passing CPE authentication.
123
Configuration parameter deployment
When a CPE logs in to an ACS, the ACS can automatically apply some configurations to the CPE for it
to perform auto configuration. Table 4 lists the auto-configuration parameters supported by the switch.
Table 4 Auto-configuration parameters and their functions
Auto-configuration parameters
Function
Configuration file (ConfigFile)
Updates the local configuration file on the CPE. The ACS delivers a
configuration file to the CPE in one of the following formats: file or
current configuration.
ACS address (URL)
Updates the ACS address kept on the CPE. The parameter is used
when there is an active and standby ACS switchover.
ACS username (Username)
ACS password (Password)
Automatically synchronizes the username and password on the CPE
when those on the ACS change. The parameters are also used to
inform the CPE of the authentication information of the standby ACS
server when there is an active and standby ACS switchover.
PeriodicInformEnable
Enables the sending of Inform messages.
PeriodicInformInterval
Configures the CPE to send an Inform message periodically. The
parameter is used for querying updates and information backup
regularly.
PeriodicInformTime
Configures the CPE to send an Inform message at a specified time. The
parameter is used for querying updates and information backup at a
specified time.
CPE username
(ConnectionRequestUsername)
CPE password
(ConnectionRequestPassword)
Configures the CPE username and password for connection to the
ACS.
RPC methods
In the CWMP, a series of RPC methods are used for intercommunication between a CPE and an ACS.
The primary RPC methods are described as follows:
•
Get—Method used by an ACS to get the value of one or more parameters of a CPE.
•
Set— Method used by an ACS to set the value of one or more parameters of a CPE.
•
Inform— Method used by a CPE to send an Inform message to an ACS whenever the CPE initiates
a connection to the ACS, or the CPE’s underlying configuration changes, or the CPE periodically
sends its local information to the ACS.
•
Download— Method used by an ACS to require a CPE to download a specified file from the
specified URL, ensuring upgrading of CPE software and auto download of the vendor configuration
file.
•
Upload— Method used by an ACS to require a CPE to upload a specified file to the specified
location.
•
Reboot— Method used by an ACS to reboot a CPE remotely when the CPE encounters a failure or
software upgrade is needed.
124
Active and standby ACS switchover
The following example illustrates how an active and standby ACS switchover is performed. The
scenario: There are two ACSs, active and standby in an area. The active ACS needs to restart for system
upgrade. To ensure a continuous monitoring of the CPE, all CPEs in the area must connect to the standby
ACS.
Figure 46 Example of the message interaction during an active and standby ACS switchover
The active and standby ACS switchover proceeds as follows:
1.
Establish a TCP connection.
2.
SSL initialization, and establish a security connection.
3.
The CPE sends an Inform request message to initiate a CWMP connection. The Inform message
carries the reason for sending this message in the Eventcode field. In this example, the reason is “6
CONNECTION REQUEST”, indicating that the ACS requires the CPE to establish a connection.
4.
If the CPE passes the authentication of the ACS, the ACS returns an Inform response, and the
connection is established.
5.
Receiving the Inform response, the CPE sends an empty message, if it has no other requests. The
CPE does this in order to comply with the request/reply interaction model of HTTP, in which CWMP
messages are conveyed.
6.
The ACS queries the value of the ACS URL set on the CPE.
7.
The CPE replies to the ACS with the obtained value of the ACS URL.
8.
The ACS finds that its local URL value is the same as the value of the ACS URL on the CPE.
Therefore, the ACS sends a Set request to the CPE to modify the ACS URL value of the CPE to the
URL of the standby ACS.
9.
The setting succeeds and the CPE sends a response.
10.
The ACS sends an empty message to notify the CPE that it does not request for any other
information from the CPE.
11.
The CPE closes the connection.
125
After this, the CPE will initiate a connection to the standby ACS.
CWMP configuration tasks
Configuring the DHCP server
In a CWMP network, the DHCP server is mainly used to notify the ACS location and authentication
information to the ACS. DHCP server configuration includes the following tasks:
•
Configuring a DHCP address pool for allocating IP addresses to CPEs.
•
Configuring the DNS server.
•
Configuring the Option 43 field to notify the ACS information to CPEs.
The following describes how to configure the option 43 field:
You can configure ACS parameters for the CPE on the DHCP server through DHCP Option 43. When
accessed by the CPE, the DHCP server sends the ACS parameters in DHCP Option 43 to the CPE. If the
DHCP server is an HP switch that supports DHCP Option 43, you can configure the ACS parameters at
the CLI with the command option 43 hex 01length URL username password, where
•
length is a hexadecimal string that indicates the total length of the URL username password
arguments. No space is allowed between the 01 keyword and the length value.
•
URL is the ACS address.
•
username is the ACS username.
•
password is the ACS password.
When configuring the ACS URL, username and password, follow these guidelines:
•
The three arguments take the hexadecimal format and the ACS URL and username must each end
with a space (20 in hexadecimal format) for separation.
•
The three arguments must be entered in 2-digit, 4-digit, 6-digit, or 8-digit segments, each separated
by a space.
For example, to set the ACS address to http://169.254.76.31:7547/acs, username to 1234, and
password to 5678, you can configure as follows:
<Sysname> system-view
[Sysname] dhcp server ip-pool 0
[Sysname-dhcp-pool-0] option 43 hex 0127 68747470 3A2F2F31 36392E32 35342E37 362E3331
3A373534 372F6163 73203132 33342035 3637 38
In the option 43 hex command,
•
27 indicates that the length of the subsequent hexadecimal strings is 39 characters.
•
68747470 3A2F2F31 36392E32 35342E37 362E3331 3A373534 372F6163 73 corresponds
to the ACS address http://169.254.76.31/acs.
•
3132 3334 corresponds to the username 1234.
•
35 3637 38 corresponds to the password 5678.
•
20 is the end delimiter.
NOTE:
For more information about DHCP, DHCP Option 43, the option command, DHCP address pool
configuration, and DNS server configuration, see Layer 3—IP Services Configuration Guide.
126
Configuring the DNS server
On the DNS server, you must bind the URL address to the IP address of the ACS server to ensure that
CPEs can obtain the IP address of the ACS through the DNS function.
Configuring the ACS server
An ACS performs auto-configuration of a CPE through remote management. For the primary
configurable parameters, see “Configuration parameter deployment.” For more information on
configuring the ACS server, see the user manual that came with your ACS server.
Configuring CPEs
You can set CWMP parameters at the CLI.
NOTE:
• The HP A5800 and A5820X switches operate as CPEs in a CWMP-enabled network, so the following
only describes the configuration on CPEs.
• You can perform some configurations on CPEs at the CLI, or remotely obtain the configurations from
the ACS or DHCP server. The configurations obtained through ACS and DHCP, and configurations
made at the CLI are of descending priorities. The configurations of a higher priority take effect.
Complete these tasks to configure CWMP:
Task
Remarks
Enabling CWMP
Required
Configuring the
ACS server
Configuring CPE
attributes
Configuring the ACS URL
Required
Configuring the ACS username and
password
Optional
Configuring the CPE username and
password
Optional
Configuring the CWMP connection
interface
Optional
Configuring the CWMP connection
interface
Optional
Configuring the maximum number of
attempts made to retry a connection
Optional
Configuring the close-wait timer of the CPE
Optional
127
Enabling CWMP
CWMP configurations can only take effect after you enable CWMP.
To enable CWMP:
To do…
Use the command…
Remarks
1. Enter system view.
system-view
—
2. Enter CWMP view.
cwmp
—
3. Enable CWMP.
cwmp enable
Optional.
By default, CWMP is enabled.
Configuring the ACS server
ACS server information includes ACS URL, username and password. The ACS server information is
included in the connection request when the CPE sends a connection request to the ACS. When the ACS
receives the request, if the parameter values in the request are consistent with those configured locally,
the authentication succeeds, and the connection is allowed to be established; otherwise, the
authentication fails, and the connection is not allowed to be established.
Configuring the ACS URL
To do…
Use the command…
Remarks
1. Enter system view.
system-view
—
2. Enter CWMP view.
cwmp
—
Required.
3. Configure the ACS URL.
cwmp acs url url
By default, no ACS URL is
configured.
NOTE:
You can only assign one ACS for a CPE and the ACS URL you configured overwrites the old one, if
any.
Configuring the ACS username and password
To do…
Use the command…
Remarks
1. Enter system view.
system-view
—
2. Enter CWMP view.
cwmp
—
Required.
3. Configure the ACS username
for connection to the ACS.
cwmp acs username username
128
By default, no ACS username is
configured for connection to the
ACS.
To do…
Use the command…
Remarks
Optional.
4. Configure the ACS password
for connection to the ACS.
cwmp acs password password
You can specify a username
without a password that is used in
the authentication. If so, the
configuration on the ACS and that
on the CPE must be the same.
By default, no ACS password is
configured for connection to the
ACS.
NOTE:
Make sure that the configured username and password are the same as those configured for the CPE
on the ACS; otherwise, the CPE cannot pass the ACS authentication.
Configuring CPE attributes
CPE attributes include CPE username and password, which are used by a CPE to authenticate an ACS.
When an ACS initiates a connection to a CPE, the ACS sends a session request carrying the CPE URL,
username, and password. When the switch (CPE) receives the request, it compares the CPE URL,
username, and password with those configured locally. If they are the same, the ACS passes the
authentication of the CPE, and the connection establishment proceeds. Otherwise, the authentication
fails, and the connection establishment is terminated.
Configuring the CPE username and password
To do…
Use the command…
Remarks
1. Enter system view.
system-view
—
2. Enter CWMP view.
cwmp
—
Required.
3. Configure the CPE username
for connection to the CPE.
cwmp cpe username username
By default, no CPE username is
configured for connection to the
CPE.
Optional.
4. Configure the CPE password
for connection to the CPE.
cwmp cpe password password
You can specify a username
without a password that is used in
the authentication. If so, the
configuration on the ACS and that
on the CPE must be the same.
By default, no CPE password is
configured for connection to the
CPE.
129
Configuring the CWMP connection interface
A CWMP connection interface is an interface that connects a CPE to the ACS. The CPE sends an Inform
message carrying the IP address of the CWMP connection interface, and asks the ACS to establish a
connection through this IP address; the ACS will reply the CPE with a response message to this IP
address.
Generally, the system automatically obtains a CWMP connection interface through a certain mechanism.
However, if the obtained interface is not the one that connects the CPE to the ACS, the CWMP
connection will fail to be established. In this case, you must specify the CWMP connection interface
manually.
To configure a CWMP connection interface:
To do…
Use the command…
Remarks
1. Enter system view.
system-view
—
2. Enter CWMP view.
cwmp
—
3. Set the interface that connects
the CPE to the ACS.
cwmp cpe connect interface
interface-type interface-number
Required.
By default, the interface that
connects the CPE to the ACS is
VLAN-interface 1.
Sending Inform messages
Inform messages must be sent during the connection establishment between a CPE and an ACS. You can
configure the Inform message sending parameter to trigger the CPE to initiate a connection to the ACS.
Sending an Inform message periodically
To do…
Use the command…
Remarks
1. Enter system view.
system-view
—
2. Enter CWMP view.
cwmp
—
3. Enable the periodical sending
of Inform messages.
cwmp cpe inform interval enable
4. Configure the interval
between sending the Inform
messages.
Required.
Disabled by default.
Optional.
cwmp cpe inform interval seconds
130
By default, the CPE sends an
Inform message every 600
seconds.
Sending an Inform message at a specific time
To do…
Use the command…
Remarks
1. Enter system view.
system-view
—
2. Enter CWMP view.
cwmp
—
Required.
3. Configure the CPE to send an
Inform message at the
specified time.
cwmp cpe inform time time
By default, the time is null, that is,
the CPE is not configured to send
an Inform message at a specific
time.
Configuring the maximum number of attempts made to retry a
connection
If a CPE fails to establish a connection to an ACS, or the connection is interrupted during the session (the
CPE does not receive a message indicating the normal close of the session), the CPE can automatically
reinitiate a connection to the ACS.
To configure the maximum number of attempts that a CPE can make to retry a connection:
To do…
Use the command…
Remarks
4. Enter system view.
system-view
—
5. Enter CWMP view.
cwmp
—
6. Configure the maximum
number of attempts that a CPE
can make to retry a
connection.
Optional.
cwmp cpe connect retry times
Infinity by default, that is, a CPE
sends connection requests to the
ACS at a specified interval all
along.
Configuring the close-wait timer of the CPE
The close-wait timeout is used mainly in the following two cases:
•
During the establishment of a connection: If the CPE sends connection requests to the ACS, but the
CPE does not receive a response within the configured close-wait timeout, the CPE will consider the
connection failed.
•
After a connection is established: If there is no packet interaction between the CPE and ACS within
the configured close-wait timeout, the CPE will consider the connection invalid, and disconnect the
connection.
To configure the close wait timer of a CPE:
To do…
Use the command…
Remarks
1. Enter system view.
system-view
—
2. Enter CWMP view.
cwmp
—
3. Configure the timeout value of
the CPE close-wait timer.
cwmp cpe wait timeout seconds
131
Optional.
30 seconds by default.
Displaying and maintaining CWMP
To do…
Use the command…
Remarks
Display the current configuration
information of CWMP
display cwmp configuration [ | {
begin | exclude | include }
regular-expression ]
Available in any view
Display the current status
information of CWMP
display cwmp status [ | { begin |
exclude | include } regularexpression ]
Available in any view
Configuring CWMP example
Before configuring the ACS server, make sure that the HP iMC BIMS software is installed on the server.
Along with software updates, the BIMS functions and web interface may change. If your web interface is
different from that in this example, see the user manual that came with your server.
Network requirements
A data center has two equipment rooms A and B. Both rooms require a great number of A5800
switches. There are ACS, DHCP, and DNS servers on the network. To improve deployment efficiency,
use CWMP to deliver different configuration files to the switches in rooms A and B. In this example,
each room has three A5800 switches.
Figure 47 Network diagram for CWMP
Table 5 A5800 switches deployed in two equipment rooms
Equipment room
A
A5800 switch
Serial ID
A5800-1
210235AOLNH12000008
A5800-2
210235AOLNH12000010
132
Equipment room
B
A5800 switch
Serial ID
A5800-3
210235AOLNH12000015
A5800-4
210235AOLNH12000017
A5800-5
210235AOLNH12000020
A5800-6
210235AOLNH12000022
The network administrator has created two configuration files sys.a.cfg and sys_b.cfg for the switches in
the two rooms. The username and password for accessing the ACS server is vicky and 12345. The URL
address is http://acs.database:9090/acs.
Configuration procedure
1.
Configure the ACS server
ACS server configuration includes the following tasks:
•
Setting the username and password for accessing the ACS server.
•
Adding information about CPEs and divide CPEs into different groups.
•
Binding configuration files to different CPE groups.
Other configurations on the ACS server keep their default value.
# Set a username and password on the ACS server.
Click the System Management tab, and select CPE Authentication Users from the navigation tree to enter
the CPE authentication user configuration page.
Figure 48 CPE authentication user configuration page
Click Add to enter the page for adding a CPE authentication user.
133
Figure 49 Add CPE authentication user page
Set the username, password, and description, and then click OK.
# Add a device group and a device class. In this example, add A5800-1 to the A5800_A class of the
DB_1 group.
Click the Resource tab, and select Group Management > Device Group from the navigation tree to enter
the device group page. Click Add to enter the page for adding a device group.
Figure 50 Add device group page
Set the group name and click OK.
# Select Device Class from the navigation tree. On the device class page, click Add to enter the page for
adding a device class.
134
Figure 51 Add device class page
After setting the class name, click OK.
# Select Add Device from the navigation tree to enter the page for adding a device.
Figure 52 Add device page
Enter the device information and click OK.
135
Figure 53 Adding device succeeded
Repeat the previous steps to add information about A5800-2 and A5800-3 to the ACS server, and the
adding operation of switches in equipment room A is completed.
# Bind different configuration files to different CPE groups to realize auto-deployment.
Select Deployment Guide from the navigation tree. On the deployment guide page, select By Device Type
in the Auto Deploy Configuration area.
Figure 54 Deployment guide page
# On the Auto Deploy Configuration page, select the configuration file to be deployed and set it as the
startup configuration as the deployment strategy.
136
Figure 55 Auto deploy configuration page
# Click Select Class and enter the page for selecting device type.
137
Figure 56 Select a device class
# Select the A5800_A device class and click OK. After that, the auto deploy configuration page is
displayed. Click OK to complete the task.
Figure 57 Deploying task succeeded
Configuration of the A5800 switches in room B is the same as that of the switches in room A except that
you must perform the following configuration:
•
Create device class A5800_B for switches in room B.
•
Add switches in room B to the device class A5800_B.
•
Bind the configuration file corresponding to switches in room B to the device class A5800_B.
138
2.
Configure the DHCP server
NOTE:
In this example, the DHCP server is an HP switch supporting the Option 43 function. If your DHCP
server is not an HP switch supporting the Option 43 function, see the user manual that came with your
server.
•
Configure a DHCP address pool. Assign IP addresses to CPEs and the DNS server. In this example,
the addresses are in the network segment 10.185.10.0/24.
# Enable DHCP.
<DHCP_server> system-view
[DHCP_server] dhcp enable
# Enable the DHCP server on VLAN-interface 1.
[DHCP_server] interface vlan-interface 1
[DHCP_server-Vlan-interface1] dhcp select server global-pool
[DHCP_server-Vlan-interface1] quit
# Exclude IP addresses (addresses of the DNS server and ACS server).
[DHCP_server] dhcp server forbidden-ip 10.185.10.41
[DHCP_server] dhcp server forbidden-ip 10.185.10.60
# Configure DHCP address pool 0 (subnet and DNS server address).
[DHCP_server] dhcp server ip-pool 0
[DHCP_server-dhcp-pool-0] network 10.185.10.0 mask 255.255.255.0
[DHCP_server-dhcp-pool-0] dns-list 10.185.10.60
•
Configure Option 43 to contain the ACS address, username, and password.
# Covert the ACS address, username, and password to ASCII code. The ASCII code of the URL address
is 68 74 74 70 3A 2F 2F 61 63 73 2E 64 61 74 61 62 61 73 65 3A 39 30 39 30 2F 61 63 73,
that of the username Vicky is 76 69 63 6B 79, and that of the password 12345 is 31 32 33 34 35.
[DHCP_server-dhcp-pool-0] option 43 hex 0140 68747470 3A2F2F61 63732E64 61746162 6173653A
39303930 2F616373 20766963 6B792031 32333435
3.
Configure the DNS server
Configure the mappings between the domain name and IP address, that is, create the mapping between
the addresses http://acs.database:9090/acs and http://10.185.1.41:9090/acs. For how to create a
mapping between addresses, see the user manual that came with your DNS server.
4.
Connect CPEs to the network
Connect the CPEs with network cables and power them on, the CPEs can automatically obtain
configuration files from the ACS server.
5.
Verify the configuration on the ACS server
Click the Resource tab, select Device Interaction Log from the navigation tree to enter the page for
querying device interaction records. You can view whether the deployment configuration of a switch is
completed.
139
Figure 58 Device interaction log page
If the deployment is completed, the network administrator needs to deliver the reboot direction to the
switch through the ACS server. After the switch reboots, it loads the configuration file delivered from the
ACS server and completes the auto-configuration process.
140
Configuring cluster management
With the growth of networks, a great number of access devices are needed at network borders.
Management for these devices is very complicated; moreover, each device needs an IP address and
wastes IP address resources. Problems can be solved by cluster, which is a group of network devices.
Cluster management implements management of large numbers of distributed network devices. Cluster
management offers the following advantages:
•
Saving public IP address resource
•
Simplifying configuration and management tasks. By configuring a public IP address on one
device, you can configure and manage a group of devices without the trouble of logging in to
each device separately.
•
Providing topology discovery and display function, which is useful for network monitoring and
debugging
•
Allowing simultaneous software upgrading and parameter configuration on multiple devices, free of
topology and distance limitations
Roles in a cluster
The devices in a cluster play different roles according to their different functions and status. You can
specify the following roles for the devices:
•
Management device (Administrator): The device providing management interfaces for all devices in
a cluster and the only device configured with a public IP address. You can specify one and only
one management device for a cluster. Any configuration, management, and monitoring of the other
devices in a cluster can only be implemented through the management device. When a device is
specified as the management device, it collects related information to discover and define
candidate devices.
•
Member device (Member): A device managed by the management device in a cluster.
•
Candidate device (Candidate): A device that does not belong to any cluster but can be added to a
cluster. Different from a member device, its topology information has been collected by the
management device but it has not been added to the cluster.
Figure 59 Network diagram for a cluster
141
As shown in Figure 59, the device configured with a public IP address and performing the management
function is the management device, the other managed devices are member devices, and the device that
does not belong to any cluster but can be added to a cluster is a candidate device. The management
device and the member devices form the cluster.
Figure 60 Role change in a cluster
As shown in Figure 60, a device in a cluster changes its role according to the following rules:
•
A candidate device becomes a management device when you create a cluster on it. A
management device only becomes a candidate device after the cluster is removed.
•
A candidate device becomes a member device after being added to a cluster. A member device
becomes a candidate device after it is removed from the cluster.
How a cluster works
Cluster management is implemented through HW Group Management Protocol version 2 (HGMPv2),
which consists of the following protocols:
•
NDP
•
NTDP
•
Cluster
A cluster configures and manages the devices in it through the protocols. Cluster management involves
topology information collection and the establishment and maintenance of a cluster. Topology
information collection and cluster maintenance are independent from each other, with the former starting
before the cluster is created; the following workflow applies:
•
All devices use NDP to collect the information of the directly connected neighbors, including their
software version, host name, MAC address, and port number.
•
The management device uses NTDP to collect the information of the devices within user-specified
hops and the topology information of all devices, and then determines the candidate devices of the
cluster based on the collected information.
•
The management device adds or deletes a member device and modifies cluster management
configuration according to the candidate device information collected through NTDP.
Introduction to NDP
NDP discovers the information about directly connected neighbors, including the device name, software
version, and connecting port of the adjacent devices. NDP works in the following ways:
•
A device running NDP periodically sends NDP packets to its neighbors. An NDP packet carries
NDP information (including the device name, software version, and connecting port, and so on)
and the holdtime, which indicates how long the receiving devices will keep the NDP information. At
the same time, the device also receives (but does not forward) the NDP packets from its neighbors.
•
A device running NDP stores and maintains an NDP table. The device creates an entry in the NDP
table for each neighbor. If a new neighbor is found, meaning that the device receives an NDP
packet sent by the neighbor for the first time, the device adds an entry in the NDP table. If the NDP
information carried in the NDP packet is different from the stored information, the corresponding
142
entry and holdtime in the NDP table are updated; otherwise, only the holdtime of the entry is
updated. If no NDP information from the neighbor is received when the holdtime times out, the
corresponding entry is removed from the NDP table.
NDP runs on the data link layer, and supports different network layer protocols.
Introduction to NTDP
NTDP provides information required for cluster management; it collects topology information about the
devices within the specified hop count. Based on the neighbor information stored in the neighbor table
maintained by NDP, NTDP on the management device advertises NTDP topology-collection requests to
collect the NDP information of all devices in a specific network range as well as the connection
information of all its neighbors. The information collected will be used by the management device or the
network management software to implement required functions.
When a member device detects a change on its neighbors through its NDP table, it informs the
management device through handshake packets. Then the management device triggers its NTDP to
collect specific topology information, so that its NTDP can discover topology changes timely.
The management device collects topology information periodically. You can also administratively launch
a topology information collection. Topology information collection includes the following process:
•
The management device periodically sends NTDP topology-collection request from the NTDPenabled ports.
•
Upon receiving the request, the device sends NTDP topology-collection response to the
management device, copies this response packet on the NTDP-enabled port and sends it to the
adjacent device. Topology-collection response includes the basic information of the NDP-enabled
device and NDP information of all adjacent devices.
•
The adjacent device performs the same operation until the NTDP topology-collection request is sent
to all devices within specified hops.
When the NTDP topology-collection request is advertised in the network, large numbers of network
devices receive the NTDP topology-collection request and send NTDP topology-collection response at the
same time, which may cause congestion and the management device busyness. To avoid such case, use
the following methods to control the speed of the NTDP topology-collection request advertisement:
•
Upon receiving an NTDP topology-collection request, each device does not forward it, instead, it
waits for a period of time and then forwards the NTDP topology-collection request on the first
NTDP-enabled port.
•
On the same device, except the first port, each NTDP-enabled port waits for a period of time and
then forwards the NTDP topology-collection request after its prior port forwards the NTDP topologycollection request.
Cluster management maintenance
1.
Adding a candidate device to a cluster
You should specify the management device before creating a cluster. The management device discovers
and defines a candidate device through NDP and NTDP protocols. The candidate device can be
automatically or manually added to the cluster.
After the candidate device is added to the cluster, it can obtain the member number assigned by the
management device and the private IP address used for cluster management.
2.
Communication within a cluster
In a cluster the management device communicates with its member devices by sending handshake
packets to maintain connection between them.
143
Figure 61 Management/member device state change
•
After a cluster is created, a candidate device is added to the cluster and becomes a member
device, the management device saves the state information of its member device and identifies it as
Active. And the member device also saves its state information and identifies itself as Active.
•
After a cluster is created, its management device and member devices begin to send handshake
packets. Upon receiving the handshake packets from the other side, the management device or a
member device simply remains its state as Active, without sending a response.
•
If the management device does not receive the handshake packets from a member device in an
interval three times of the interval to send handshake packets, it changes the status of the member
device from Active to Connect. Likewise, if a member device fails to receive the handshake packets
from the management device in an interval three times of the interval to send handshake packets,
the status of itself will also be changed from Active to Connect.
•
If this management device, in information holdtime, receives the handshake or management
packets from its member device which is in Connect state, it changes the state of its member device
to Active; otherwise, it changes the state of its member device to Disconnect, in which case the
management device considers its member device disconnected. If this member device, which is in
Connect state, receives handshake or management packets from the management device in
information holdtime, it changes its state to Active; otherwise, it changes its state to Disconnect.
•
If the communication between the management device and a member device is recovered, the
member device which is in Disconnect state will be added to the cluster. After that, the state of the
member device locally and on the management device will be changed to Active.
•
A member device informs the management device using handshake packets when there is a
neighbor topology change.
Management VLAN
The management VLAN is a VLAN used for communication in a cluster; it limits the cluster management
range. Through configuration of the management VLAN, the following functions can be implemented:
•
Management packets—including NDP, NTDP and handshake packets—are restricted within the
management VLAN, and isolated from other packets, which enhances security.
•
The management device and the member devices communicate with each other through the
management VLAN.
144
For a cluster to work normally, you must set the packets from the management VLAN to pass the ports
connecting the management device and the member/candidate devices—including the cascade ports—
using the following guidelines:
•
If the packets from the management VLAN cannot pass a port, the device connected with the port
cannot be added to the cluster. If the ports—including the cascade ports—connecting the
management device and the member/candidate devices prohibit the packets from the management
VLAN, set the packets from the management VLAN to pass the ports on candidate devices with the
management VLAN auto-negotiation function.
•
Only when the default VLAN ID of the cascade ports and the ports connecting the management
device and the member/candidate devices is that of the management VLAN can you set the
packets without tags from the management VLAN to pass the ports; otherwise, only the packets with
tags from the management VLAN can pass the ports.
NOTE:
• If a candidate device is connected to a management device through another candidate device, the
ports between the two candidate devices are cascade ports.
• For more information about VLAN, see VLAN configuration in the Layer 2—LAN Switching
Configuration Guide.
Cluster configuration task list
Before configuring a cluster, you must determine the roles and functions the devices play. You also must
configure the related functions, preparing for the communication between devices within the cluster.
Complete these tasks to configure a cluster:
Task
Configuring the
management device
Configuring the
member devices
Remarks
Enabling NDP globally and for specific ports
Optional
Configuring NDP parameters
Optional
Enabling NTDP globally and for specific ports
Optional
Configuring NTDP parameters
Optional
Manually collecting topology information
Optional
Enabling the cluster function
Optional
Establishing a cluster
Required
Enabling management VLAN auto-negotiation
Required
Configuring communication between the
management device and the member devices
within a cluster
Optional
Configuring cluster management protocol packets
Optional
Cluster member management
Optional
Enabling NDP
Optional
Enabling NTDP
Optional
Manually collecting topology information
Optional
145
Task
Remarks
Enabling the cluster function
Optional
Deleting a member device from a cluster
Optional
Configuring access between the management device and its member
devices
Optional
Adding a candidate device to a cluster
Optional
Configuring advanced
cluster functions
Configuring topology management
Optional
Configuring interaction for a cluster
Optional
SNMP configuration synchronization function
Optional
Configuring web user accounts in batches
Optional
CAUTION:
• Disabling the NDP and NTDP functions on the management device and member devices after a
cluster is created will not cause the cluster to be dismissed, but will influence the normal operation of
the cluster.
• In a cluster, if a member device enabled with the 802.1X or MAC address authentication function has
other member devices connected to it, you must enable HW Authentication Bypass Protocol (HABP)
server on the device. Otherwise, the management device of the cluster cannot manage the devices
connected with it. Whether to enable HABP server on the management device enabled with the
802.1X or MAC address authentication depends on your device model. For more information about
the HABP, see HABP configuration in the Security Configuration Guide.
• If the routing table of the management device is full when a cluster is established, which means that
entries with the destination address as a candidate device cannot be added to the routing table, all
candidate devices will be added to and removed from the cluster repeatedly.
• If the routing table of a candidate device is full when the candidate device is added to a cluster,
which means that the entry with the destination address as the management device cannot be added
to the routing table, the candidate device will be added to and removed from the cluster repeatedly.
146
Configuring the management device
Enabling NDP globally and for specific ports
For NDP to work normally, you must enable NTDP both globally and on specific ports.
To enable NDP globally and for specific ports:
To do…
Use the command…
Remarks
1. Enter system view.
system-view
—
2. Enable NDP globally.
ndp enable
3. Enable the
NDP
feature for
the ports.
Optional.
Enabled by default.
In system view
ndp enable interfaceinterface-list
In Ethernet
interface view
or Layer 2
aggregate
interface view
interface interface-type interfacenumber
Use either command.
By default, NDP is enabled
globally and also on all ports.
ndp enable
NOTE:
HP recommends that you disable NDP on the port which connects with the devices that do not need to
join the cluster, preventing the management device from adding the device which needs not to join the
cluster and collecting the topology information of this device.
Configuring NDP parameters
A port enabled with NDP periodically sends NDP packets to its neighbors. If no NDP information from
the neighbor is received when the holdtime times out, the device removes the corresponding entry from
the NDP table.
To configure NDP parameters:
To do…
Use the command…
Remarks
1. Enter system view.
system-view
—
2. Configure the interval for
sending NDP packets.
ndp timer hello hello-time
3. Configure the period for the
receiving device to keep the
NDP packets.
ndp timer aging aging-time
Optional.
60 seconds by default.
Optional.
180 seconds by default.
CAUTION:
The time for the receiving device to hold NDP packets cannot be shorter than the interval for sending
NDP packets; otherwise, the NDP table may become instable.
147
Enabling NTDP globally and for specific ports
For NTDP to work normally, you must enable NTDP both globally and on specific ports.
To do…
Use the command…
Remarks
1. Enter system view.
system-view
—
2. Enable NTDP globally.
ntdp enable
3. Enter Ethernet interface view
or Layer 2 aggregate
interface view.
interface interface-type interfacenumber
4. Enable NTDP for the port.
ntdp enable
Optional.
Enabled by default.
—
Optional.
NTDP is enabled on all ports by
default.
NOTE:
HP recommends that you disable NTDP on the port which connects with the devices that do not need to
join the cluster, preventing the management device from adding the device which needs not to join the
cluster and collecting the topology information of this device.
Configuring NTDP parameters
By configuring the maximum hops for collecting topology information, get topology information of the
devices in a specified range, avoiding unlimited topology collection.
After the interval for collecting topology information is configured, the device collects the topology
information at this interval.
To avoid network congestion caused by large amounts of topology responses received in short periods,
perform the following steps:
•
Upon receiving an NTDP topology-collection request, a device does not forward the request,
instead, it waits for a period of time and then forwards the request on its first NTDP-enabled port.
•
On the same device, except the first port, each NTDP-enabled port waits for a period of time and
then forwards the NTDP topology-collection request after the previous port forwards the NTDP
topology-collection request.
To configure NTDP parameters:
To do…
Use the command…
Remarks
1. Enter system view.
system-view
—
2. Configure the maximum hops
for topology collection.
ntdp hop hop-value
3. Configure the interval to
collect topology information.
ntdp timer interval
4. Configure the delay to
forward topology-collection
request packets on the first
port.
ntdp timer hop-delay delay-time
148
Optional.
3 by default.
Optional.
1 minute by default.
Optional.
200 ms by default.
To do…
Use the command…
5. Configure the port delay to
forward topology-collection
request on other ports.
ntdp timer port-delay delay-time
Remarks
Optional.
20 ms by default.
NOTE:
The two delay values should be configured on the topology collecting device. A topology-collection
request sent by the topology collecting device carries the two delay values, and a device that receives
the request forwards the request according to the delays.
Manually collecting topology information
The management device collects topology information periodically after a cluster is created. In addition,
you can configure the device to manually initiate topology information collection on the management
device or NTDP-enabled device, managing and monitoring devices in real time, regardless of whether a
cluster is created.
To configure the device to manually collect topology information:
To do…
Use the command…
Remarks
Manually collect topology
information
ntdp explore
Required
Enabling the cluster function
To do…
Use the command…
Remarks
6. Enter system view.
system-view
—
7. Enable the cluster function
globally.
cluster enable
Optional.
Enabled by default.
Establishing a cluster
Before establishing a cluster, you must specify the management VLAN, and you cannot modify the
management VLAN after a device is added to the cluster.
In addition, you must configure a private IP address pool for the devices to be added to the cluster on
the device to be configured as the management device before establishing a cluster. Meanwhile, the IP
addresses of the VLAN interfaces of the management device and member devices cannot be in the same
network segment as that of the cluster address pool; otherwise, the cluster cannot work normally. When
a candidate device is added to a cluster, the management device assigns it a private IP address for it to
communicate with other devices in the cluster.
You can establish a cluster in the following ways: manually and automatically. With the latter, establish
a cluster according to the prompt information. The system performs the following workflow:
•
Prompts you to enter a name for the cluster you want to establish;
•
Lists all candidate devices within your predefined hop count;
•
Starts to automatically add them to the cluster.
149
You can press Ctrl+C anytime during the adding process to exit the cluster auto-establishment process.
However, this only stops adding new devices into the cluster, and devices already added into the cluster
are not removed.
To manually establish a cluster:
To do…
Use the command…
Remarks
1. Enter system view.
system-view
—
2. Specify the management
VLAN.
management-vlan vlan-id
By default, VLAN 1 is the
management VLAN.
3. Enter cluster view.
cluster
—
4. Configure the private IP
address range for member
devices.
ip-pool ip-address { mask | masklength }
Required.
Manually
establish a
cluster
build cluster-name
Required.
Automatically
establish a
cluster
auto-build [ recover ]
5. Establish a
cluster.
Optional.
Not configured by default.
Use either approach.
By default, the device is not the
management device.
CAUTION:
Handshake packets use UDP port 40000. For a cluster to be established successfully, make sure that the
port is not in use before establishing it.
Enabling management VLAN auto-negotiation
The management VLAN limits the cluster management range. If the device discovered by the
management device does not belong to the management VLAN, meaning that the cascade ports and the
ports connecting with the management device do not allow the packets from the management VLAN to
pass, and the new device cannot be added to the cluster. Through the configuration of the management
VLAN auto-negotiation function, the cascade ports and the ports directly connected to the management
device can be automatically added to the management VLAN.
NOTE:
When the management VLAN auto-negotiation is enabled, the ports connecting member devices
automatically change to hybrid ports, and permit the packets of the management VLAN to pass
through tagged.
• If a port was an access or a trunk port, after changed to a hybrid port, the port does not permit the
packets of any other VLAN except the management VLAN to pass through.
• If a port was a hybrid port, the link type change process does not affect the permitted VLANs. The
only change is that the packets of the management VLAN are permitted to pass through tagged.
Before enabling this function, check the link types of ports connecting member devices and the VLANs
whose packets are permitted to pass through to avoid influence to your network due to link type change
of ports.
150
To configure management VLAN auto-negotiation:
To do…
Use the command…
Remarks
1. Enter system view.
system-view
—
2. Enter cluster view.
cluster
—
3. Enable management VLAN
auto-negotiation.
management-vlan synchronization
enable
Required.
Disabled by default.
Configuring communication between the management device
and the member devices within a cluster
In a cluster, the management device and member devices communicate by sending handshake packets
to maintain connection between them. You can configure interval of sending handshake packets and the
holdtime of a device on the management device. This configuration applies to all member devices within
the cluster. For a member device in Connect state, the following rules apply:
•
If the management device does not receive handshake packets from a member device within the
holdtime, it changes the state of the member device to Disconnect. When the communication is
recovered, the member device needs to be re-added to the cluster, and this process is automatically
performed.
•
If the management device receives handshake packets from the member device within the holdtime,
the state of the member device remains Active.
To configure communication between the management device and the member devices within a cluster:
To do…
Use the command…
Remarks
1. Enter system view.
system-view
—
2. Enter cluster view.
cluster
—
3. Configure the interval to send
handshake packets.
timer interval
4. Configure the holdtime of a
device.
holdtime hold-time
Optional.
10 seconds by default
Optional.
60 seconds by default
Configuring cluster management protocol packets
By default, the destination MAC address of cluster management protocol packets—including NDP, NTDP
and HABP packets—is a multicast MAC address 0180-C200-000A, which IEEE reserved for later use.
Since some devices cannot forward the multicast packets with the destination MAC address of 0180C200-000A, cluster management packets cannot traverse these devices. For a cluster to work normally
in this case, modify the destination MAC address of a cluster management protocol packet without
changing the current networking.
The management device periodically sends MAC address negotiation broadcast packets to advertise the
destination MAC address of the cluster management protocol packets.
151
To configure the destination MAC address of the cluster management protocol packets:
To do…
Use the command…
Remarks
1. Enter system view.
system-view
—
2. Enter cluster view.
cluster
—
Required.
The destination MAC address is
0180-C200-000A by default.
3. Configure the destination
MAC address for cluster
management protocol
packets.
cluster-mac mac-address
The following are the configurable
MAC addresses:
• 0180-C200-0000
• 0180-C200-000A
• 0180-C200-0020 through
0180-C200-002F
• 010F-E200-0002
4. Configure the interval to send
MAC address negotiation
broadcast packets.
cluster-mac syn-interval interval
Optional.
One minute by default.
CAUTION:
When you configure the destination MAC address for cluster management protocol packets:
• If the interval for sending MAC address negotiation broadcast packets is 0, the system automatically
sets it to 1 minute.
• If the interval for sending MAC address negotiation broadcast packets is not 0, the interval remains
unchanged.
Cluster member management
You can manually add a candidate device to a cluster, or remove a member device from a cluster.
If a member device needs to be rebooted for software upgrade or configuration update, remotely reboot
it through the management device.
Adding a member device
To do…
Use the command…
Remarks
1. Enter system view.
system-view
—
2. Enter cluster view.
cluster
—
3. Add a candidate device to
the cluster.
add-member [ member-number ]
mac-address mac-address [
password password ]
Required
To do…
Use the command…
Remarks
1. Enter system view.
system-view
—
Removing a member device
152
To do…
Use the command…
Remarks
2. Enter cluster view.
cluster
—
3. Remove a member device
from the cluster.
delete-member member-number [
to-black-list ]
Required
To do…
Use the command…
Remarks
1. Enter system view.
system-view
—
2. Enter cluster view.
cluster
—
3. Reboot a specified member
device.
Reboot member { member-number
| mac-address mac-address } [
eraseflash ]
Required
Rebooting a member device
Configuring the member devices
Enabling NDP
See Enabling NDP globally and for specific ports.
Enabling NTDP
See Enabling NTDP globally and for specific ports.
Manually collecting topology information
See Manually collecting topology information.
Enabling the cluster function
See Enabling the cluster function.
Deleting a member device from a cluster
To do…
Use the command…
Remarks
1. Enter system view.
system-view
—
2. Enter cluster view.
cluster
—
3. Delete a member device from
the cluster.
undo administrator-address
Required
153
Configuring access between the management
device and its member devices
After having successfully configured NDP, NTDP and cluster, configure, manage and monitor the
member devices through the management device. You can manage member devices in a cluster through
switching from the operation interface of the management device to that of a member device or
configure the management device by switching from the operation interface of a member device to that
of the management device.
To configure access between member devices of a cluster:
To do…
Use the command…
Remarks
1. Switch from the operation
interface of the management
device to that of a member
device.
cluster switch-to { member-number
| mac-address mac-address |
sysname member-sysname }
Required
2. Switch from the operation
interface of a member device
to that of the management
device.
cluster switch-to administrator
Required
CAUTION:
Telnet connection is used in the switching between the management device and a member device.
When switching between them:
• Authentication is required when you switch from a member device to the management device. The
switching fails if authentication is not passed. Your user level is allocated according to the predefined
level by the management device if authentication is passed.
• When a candidate device is added to a cluster and becomes a member device, its super password
with the level of 3 will be automatically synchronized to the management device. After a cluster is
established, do not modify the super password of any member —including the management device
and member devices—of the cluster; otherwise, the switching may fail because of an authentication
failure.
• If the member specified in this command does not exist, the system prompts error when you execute
the command; if the switching succeeds, your user level on the management device is retained.
• If the Telnet users on the device to be logged in reach the maximum number, the switching fails.
• To prevent resource waste, avoid ring switching when configuring access between cluster members.
For example, if you switch from the operation interface of the management device to that of a
member device and then need to switch back to that of the management device, use the quit
command to end the switching, but not the cluster switch-to administrator command to switch to the
operation interface of the management device.
154
Adding a candidate device to a cluster
To do…
Use the command…
Remarks
1. Enter system view.
system-view
—
2. Enter cluster view.
cluster
—
3. Add a candidate device to
the cluster.
administrator-address macaddress name name
Required
Configuring advanced cluster functions
Configuring topology management
The concepts of blacklist and whitelist are used for topology management. An administrator can
diagnose the network by comparing the following topologies: current topology —the information of a
node and its neighbors in the cluster—and the standard topology.
•
Topology management whitelist (standard topology)—A whitelist is a list of topology information
that has been confirmed by the administrator as correct. You can get the information of a node and
its neighbors from the current topology. Based on the information, you can manage and maintain
the whitelist by adding, deleting or modifying a node.
•
Topology management blacklist—Devices in a blacklist are not allowed to join a cluster. A blacklist
contains the MAC addresses of devices. If a blacklisted device is connected to a network through
another device not included in the blacklist, the MAC address and access port of the latter are also
included in the blacklist. The candidate devices in a blacklist can only be added to a cluster if the
administrator manually removes them from the list.
The whitelist and blacklist are mutually exclusive. A whitelist member cannot be a blacklist member, and
vice versa. However, a topology node can belong to neither the whitelist nor the blacklist. Nodes of this
type are usually newly added nodes, whose identities are to be confirmed by the administrator.
You can back up and restore the whitelist and blacklist in the following ways:
•
Backing them up on the FTP server shared by the cluster. You can manually restore the whitelist and
blacklist from the FTP server.
•
Backing them up in the Flash of the management device. When the management device restarts,
the whitelist and blacklist will be automatically restored from the Flash. When a cluster is reestablished, choose whether to restore the whitelist and blacklist from the Flash automatically, or
manually restore them from the Flash of the management device.
To configure cluster topology management:
To do…
Use the command…
Remarks
1. Enter system view.
system-view
—
2. Enter cluster view.
cluster
—
3. Add a device to the blacklist.
black-list add-mac mac-address
Optional
4. Remove a device from the
blacklist.
black-list delete-mac { all | macaddress }
Optional
155
To do…
Use the command…
Remarks
5. Confirm the current topology
and save it as the standard
topology.
topology accept { all [ save-to {
ftp-server | local-flash } ] | macaddress mac-address | member-id
member-number }
Optional
6. Save the standard topology to
the FTP server or the local
Flash.
topology save-to { ftp-server |
local-flash }
Optional
7. Restore the standard topology
information.
topology restore-from { ftp-server
| local-flash }
Optional
Configuring interaction for a cluster
After establishing a cluster, configure FTP/TFTP server, NM host and log host for the cluster on the
management device.
•
After you configure an FTP/TFTP server for a cluster, the members in the cluster access the FTP/TFTP
server configured through the management device.
•
After you configure a log host for a cluster, all log information of the members in the cluster will be
output to the configured log host in the following way: first, the member devices send their log
information to the management device, which then converts the addresses of log information and
sends them to the log host.
•
After you configure an NM host for a cluster, the member devices in the cluster send their Trap
messages to the shared SNMP NM host through the management device.
If the port of an access NM device—including FTP/TFTP server, NM host and log host—does not allow
the packets from the management VLAN to pass, the NM device cannot manage the devices in a cluster
through the management device. You must configure the VLAN interface of the access NM device—
including FTP/TFTP server, NM host and log host—as the NM interface on the management device.
To configure the interaction for a cluster:
To do…
Use the command…
Remarks
1. Enter system view.
system-view
—
2. Enter cluster view.
cluster
—
3. Configure the FTP server
shared by the cluster.
ftp-server ip-address [ user-name
username password { simple |
cipher } password ]
Required.
By default, no FTP server is
configured for a cluster.
Required.
4. Configure the TFTP server
shared by the cluster.
tftp-server ip-address
5. Configure the log host shared
by the member devices in the
cluster.
logging-host ip-address
By default, no log host is
configured for a cluster.
6. Configure the SNMP NM host
shared by the cluster.
snmp-host ip-address [
community-string read string1
write string2 ]
Required.
By default, no TFTP server is
configured for a cluster.
Required.
156
By default, no SNMP host is
configured.
To do…
Use the command…
Remarks
7. Configure the NM interface of
the management device.
nm-interface vlan-interface
interface-name
Optional.
CAUTION:
To isolate management protocol packets of a cluster from packets outside the cluster, configure the
device to prohibit packets from the management VLAN from passing the ports that connect the
management device with the devices outside the cluster and configure the NM interface for the
management device.
SNMP configuration synchronization function
SNMP configuration synchronization function facilitates management of a cluster, with which you can
perform SNMP-related configurations on the management device and synchronize them to the member
devices on the whitelist. This operation is equal to configuring multiple member devices at one time,
simplifying the configuration process.
To configure the SNMP configuration synchronization function:
To do…
Use the command…
Remarks
1. Enter system view.
system-view
—
2. Enter cluster view.
cluster
—
3. Configure the SNMP
community name shared by a
cluster.
cluster-snmp-agent community {
read | write } community-name [
mib-view view-name ]
Required.
4. Configure the SNMPv3 group
shared by a cluster.
cluster-snmp-agent group v3
group-name [ authentication |
privacy ] [ read-view read-view ] [
write-view write-view ] [ notifyview notify-view ]
Required.
Required.
5. Create or update information
of the MIB view shared by a
cluster.
cluster-snmp-agent mib-view
included view-name oid-tree
6. Add a user for the SNMPv3
group shared by a cluster.
cluster-snmp-agent usm-user v3
user-name group-name [
authentication-mode { md5 | sha }
auth-password ] [ privacy-mode
des56 priv-password ]
By default, the name of the MIB
view shared by a cluster is
ViewDefault and a cluster can
access the ISO subtree.
Required.
NOTE:
• The SNMP-related configurations are retained when a cluster is dismissed or the member devices are
removed from the whitelist.
• For more information about SNMP, see SNMP configuration in the Network Management and
Monitoring Configuration Guide.
157
Configuring web user accounts in batches
Configuring Web user accounts in batches enables you to configure on the management device the
username and password used to log in to the devices —including the management device and member
devices—within a cluster through Web and synchronize the configurations to the member devices in the
whitelist. This operation is equal to performing the configurations on the member devices. You must enter
your username and password when you log in to the devices, including the management device and
member devices, in a cluster through Web.
To configure Web user accounts in batches:
To do…
Use the command…
Remarks
1. Enter system view.
system-view
—
2. Enter cluster view.
cluster
—
3. Configure Web user accounts
in batches.
cluster-local-user user-name
password { cipher | simple }
password
Required
NOTE:
If a cluster is dismissed or the member devices are removed from the whitelist, the configurations of
Web user accounts are still retained.
Displaying and maintaining cluster management
To do…
Use the command…
Display NDP configuration
information
display ndp [ interface interfacelist ] [ | { begin | exclude |
include } regular-expression ]
Display NTDP configuration
information
display ntdp [ | { begin | exclude
| include } regular-expression ]
Display the device information
collected through NTDP
display ntdp device-list [ verbose ]
[ | { begin | exclude | include }
regular-expression ]
Display the detailed NTDP
information of a specified device
display ntdp single-device macaddress mac-address [ | { begin |
exclude | include } regularexpression ]
Display information of the cluster
to which the current device
belongs
display cluster [ | { begin |
exclude | include } regularexpression ]
Display the standard topology
information
display cluster base-topology [
mac-address mac-address |
member-id member-number ] [ | {
begin | exclude | include }
regular-expression ]
Display the current blacklist of the
cluster
display cluster black-list [ | {
begin | exclude | include }
regular-expression ]
158
Remarks
Available in any view
To do…
Use the command…
Display the information of
candidate devices
display cluster candidates [ macaddress mac-address | verbose ] [
| { begin | exclude | include }
regular-expression ]
Display the current topology
information
display cluster current-topology [
mac-address mac-address [ tomac-address mac-address ] |
member-id member-number [ tomember-id member-number ] ] [ |
{ begin | exclude | include }
regular-expression ]
Display the information about
cluster members
display cluster members [ membernumber | verbose ] [ | { begin |
exclude | include } regularexpression ]
Clear NDP statistics
reset ndp statistics [ interface
interface-list ]
Remarks
Available in user view
Configuring cluster management example
Network requirements
•
Three switches form cluster abc, whose management VLAN is VLAN 10. In the cluster, Switch B
serves as the management device (Administrator), whose network management interface is VLANinterface 2; Switch A and Switch C are the member devices (Member).
•
All devices in the cluster use the same FTP server and TFTP server on host 63.172.55.1/24, and
use the same SNMP NMS and log services on host IP address: 69.172.55.4/24.
•
Add the device whose MAC address is 000f-e201-0013 to the blacklist.
Figure 62 Network diagram for cluster management configuration
159
Configuration procedure
1.
Configure the member device Switch A
# Enable NDP globally and for port GigabitEthernet 1/0/1.
<SwitchA> system-view
[SwitchA] ndp enable
[SwitchA] interface gigabitethernet 1/0/1
[SwitchA-GigabitEthernet1/0/1] ndp enable
[SwitchA-GigabitEthernet1/0/1] quit
# Enable NTDP globally and for port GigabitEthernet 1/0/1.
[SwitchA] ntdp enable
[SwitchA] interface gigabitethernet 1/0/1
[SwitchA-GigabitEthernet1/0/1] ntdp enable
[SwitchA-GigabitEthernet1/0/1] quit
# Enable the cluster function.
[SwitchA] cluster enable
2.
Configure the member device Switch C
As the configurations of the member devices are the same, the configuration procedure of Switch C is
omitted here.
3.
Configure the management device Switch B
# Enable NDP globally and for ports GigabitEthernet 1/0/2 and GigabitEthernet 1/0/3.
<SwitchB> system-view
[SwitchB] ndp enable
[SwitchB] interface gigabitethernet 1/0/2
[SwitchB-GigabitEthernet1/0/2] ndp enable
[SwitchB-GigabitEthernet1/0/2] quit
[SwitchB] interface gigabitethernet 1/0/3
[SwitchB-GigabitEthernet1/0/3] ndp enable
[SwitchB-GigabitEthernet1/0/3] quit
# Configure the period for the receiving device to keep NDP packets as 200 seconds.
[SwitchB] ndp timer aging 200
# Configure the interval to send NDP packets as 70 seconds.
[SwitchB] ndp timer hello 70
# Enable NTDP globally and for ports GigabitEthernet 1/0/2 and GigabitEthernet 1/0/3.
[SwitchB] ntdp enable
[SwitchB] interface gigabitethernet 1/0/2
[SwitchB-GigabitEthernet1/0/2] ntdp enable
[SwitchB-GigabitEthernet1/0/2] quit
[SwitchB] interface gigabitethernet 1/0/3
[SwitchB-GigabitEthernet1/0/3] ntdp enable
[SwitchB-GigabitEthernet1/0/3] quit
# Configure the hop count to collect topology as 2.
[SwitchB] ntdp hop 2
# Configure the delay to forward topology-collection request packets on the first port as 150 ms.
160
[SwitchB] ntdp timer hop-delay 150
# Configure the delay to forward topology-collection request packets on the first port as 15 ms.
[SwitchB] ntdp timer port-delay 15
# Configure the interval to collect topology information as 3 minutes.
[SwitchB] ntdp timer 3
# Configure the management VLAN of the cluster as VLAN 10.
[SwitchB] vlan 10
[SwitchB-vlan10] quit
[SwitchB] management-vlan 10
# Configure ports GigabitEthernet 1/0/2 and GigabitEthernet 1/0/3 as Trunk ports and allow packets
from the management VLAN to pass.
[SwitchB] interface gigabitethernet 1/0/2
[SwitchB-GigabitEthernet1/0/2] port link-type trunk
[SwitchB-GigabitEthernet1/0/2] port trunk permit vlan 10
[SwitchB-GigabitEthernet1/0/2] quit
[SwitchB] interface gigabitethernet 1/0/3
[SwitchB-GigabitEthernet1/0/3] port link-type trunk
[SwitchB-GigabitEthernet1/0/3] port trunk permit vlan 10
[SwitchB-GigabitEthernet1/0/3] quit
# Enable the cluster function.
[SwitchB] cluster enable
# Configure a private IP address range for the member devices, which is from 172.16.0.1 to
172.16.0.7.
[SwitchB] cluster
[SwitchB-cluster] ip-pool 172.16.0.1 255.255.255.248
# Configure the current device as the management device, and establish a cluster named abc.
[SwitchB-cluster] build abc
Restore topology from local flash file, for there is no base topology.
(Please confirm in 30 seconds, default No). (Y/N)
N
# Enable management VLAN auto-negotiation.
[abc_0.SwitchB-cluster] management-vlan synchronization enable
# Configure the holdtime of the member device information as 100 seconds.
[abc_0.SwitchB-cluster] holdtime 100
# Configure the interval to send handshake packets as 10 seconds.
[abc_0.SwitchB-cluster] timer 10
# Configure the FTP Server, TFTP Server, Log host and SNMP host for the cluster.
[abc_0.SwitchB-cluster] ftp-server 63.172.55.1
[abc_0.SwitchB-cluster] tftp-server 63.172.55.1
[abc_0.SwitchB-cluster] logging-host 69.172.55.4
[abc_0.SwitchB-cluster] snmp-host 69.172.55.4
# Add the device whose MAC address is 00E0-FC01-0013 to the blacklist.
[abc_0.SwitchB-cluster] black-list add-mac 00e0-fc01-0013
[abc_0.SwitchB-cluster] quit
161
# Add port GigabitEthernet 1/0/1 to VLAN 2, and configure the IP address of VLAN-interface 2.
[abc_0.SwitchB] vlan 2
[abc_0.SwitchB-vlan2] port gigabitethernet 1/0/1
[abc_0.SwitchB] quit
[abc_0.SwitchB] interface vlan-interface 2
[abc_0.SwitchB-Vlan-interface2] ip address 163.172.55.1 24
[abc_0.SwitchB-Vlan-interface2] quit
# Configure VLAN-interface 2 as the network management interface.
[abc_0.SwitchB] cluster
[abc_0.SwitchB-cluster] nm-interface vlan-interface 2
162
Configuring a sampler
A sampler provides the packet sampling function. A sampler selects a packet out of sequential packets,
and sends it to the service module for processing.
The following sampling modes are available:
•
Fixed mode—The first packet is selected out of a number of sequential packets in each sampling.
•
Random mode—Any packet might be selected out of a number of sequential packets in each
sampling. The A5800 series do not support the random mode.
A sampler can be used to sample packets for NetStream. Only the sampled packets are sent and
processed by the traffic monitoring module. Sampling is useful if you have too much traffic and want to
limit the traffic of interest to be analyzed. The sampled data is statistically accurate and decreases the
impact on forwarding capacity of the device. For more information about NetStream, see “Configuring
NetStream.”
Creating a sampler
To do…
Use the command…
Remarks
1. Enter system view.
system-view
—
Required.
2. Create a sampler.
sampler sampler-name mode
fixed packet-interval rate
The rate argument specifies the sampling
rate, which equals the 2 to the power of rate.
For example, if the rate is 8, one packet out
of 256 packets (2 to the power of 8) is
sampled in each sampling; if the rate is 10,
one packet out of 1024 packets (2 to the
power of 10) is sampled.
Displaying and maintaining sampler
To do…
Use the command…
Remarks
Display configuration and running
information about the sampler
display sampler [ sampler-name ] [
slot slot-number ] [ | { begin | exclude
| include } regular-expression ]
Available in any view
Clear running information about the
sampler
reset sampler statistics [ sampler-name
]
Available in user view
163
Configuring sampler examples
Network requirements
As shown in Figure 63, configure IPv4 NetStream on Switch A to collect statistics on coming traffic on
GigabitEthernet 1/0/1 and send the result to port 5000 on NSC 12.110.2.2/16.
Configure fixed sampling in the inbound direction to select the first packet out of 256 packets.
Figure 63 Network diagram for using sampler with NetStream
Vlan-int1
12.110.2.1/16
Switch A
GE1/0/1
NSC
12.110.2.2/16
Network
Configuration procedure
# Create sampler 256 in fixed sampling mode, and set the sampling rate to 8. The first packet out of
256 (two to the power of eight) packets is selected.
<SwitchA> system-view
[SwitchA] sampler 256 mode fixed packet-interval 8
# Configure interface GigabitEthernet 1/0/1, enable IPv4 NetStream to collect statistics on the
incoming traffic, and configure the interface to use sampler 256.
[SwitchA] interface GigabitEthernet1/0/1
[SwitchA-GigabitEthernet1/0/1] ip netstream inbound
[SwitchA-GigabitEthernet1/0/1] ip netstream sampler 256 inbound
[SwitchA-GigabitEthernet1/0/1] quit
# Configure the IP address and port number of the NSC as the destination address and port number for
NetStream data export, leaving the default for source interface.
[SwitchA] ip netstream export host 12.110.2.2 5000
164
Configuring port mirroring
Both Layer 2 and Layer 3 interfaces support port mirroring. The term “port” in this chapter collectively
refers to these two types of interface. The Layer 3 Ethernet interface in this document refers to an Ethernet
port that can perform IP routing and inter-VLAN routing. You can set an Ethernet port as a Layer 3
Ethernet interface by using the port link-mode route command (see Layer 2—LAN Switching
Configuration Guide).
Port mirroring copies packets passing through a port/CPU (called a mirroring port/CPU) to another port
(called the monitor port) connected with a monitoring device for packet analysis.
You can select to port-mirror inbound, outbound, or bidirectional traffic on a port/CPU as needed.
Port mirroring types
Port mirroring falls into the following types:
•
Local port mirroring: In local port mirroring, the mirroring ports/CPUs and the monitor port are
located on the same device.
•
Layer 2 remote port mirroring: In Layer 2 remote port mirroring, the mirroring ports/CPUs and the
monitor port are located on different devices on a same Layer 2 network.
•
Layer 3 remote port mirroring: In Layer 3 remote port mirroring, the mirroring ports/CPUs and the
monitor port are separated by IP networks.
NOTE:
• Because a monitor port can monitor multiple ports, it may receive multiple duplicates of a packet in
some cases. Suppose that Port 1 is monitoring bidirectional traffic on Port 2 and Port 3 on the same
device. If a packet travels from Port 2 to Port 3, two duplicates of the packet will be received on Port 1.
• On the A5820X&A5800 switch series, if incoming traffic is mirrored, the mirrored traffic is sent with
the same VLAN tag (if any) as the original traffic; if the outgoing traffic is mirrored, the mirrored
traffic carries the same VLAN tag as the original traffic did before it was sent out the mirroring ports.
Implementing port mirroring
Port mirroring is implemented through port mirroring groups. Mirroring groups have the types: local,
remote source, and remote destination.
The following subsections describe how local port mirroring, Layer 2 remote port mirroring, and Layer 3
remote port mirroring are implemented.
Local port mirroring
Local port mirroring is implemented through a local mirroring group. In local port mirroring, packets
passing through a port/CPU (mirroring port/CPU) are mirrored to the monitor port located on the same
device.
165
Figure 64 Local port mirroring implementation
As shown in Figure 64, packets of the mirroring port are mirrored to the monitor port for the data
monitoring device to analyze.
Layer 2 remote port mirroring
Layer 2 remote port mirroring is implemented through the cooperation between a remote source
mirroring group and a remote destination mirroring group as shown in Figure 65.
Figure 65 Layer 2 remote port mirroring implementation
On the network shown in Figure 65, a remote source mirroring group is created on the source device
and a remote destination mirroring group is created on the destination device. The source device copies
the packets passing through the mirroring ports/CPUs, broadcasts the packets in the remote probe VLAN
for remote mirroring through the egress port, and transmits the packets to the destination device via the
intermediate device. When receiving these mirrored packets, the destination device compares their
VLAN IDs to the ID of the remote probe VLAN configured in the remote destination mirroring group. If
the VLAN IDs of these mirrored packets match the remote probe VLAN ID, the device forwards them to
the data monitoring device through the monitor port. In this way, the data monitoring device connected
to the monitor port on the destination device can monitor and analyze packets passing through the
mirroring ports/CPUs on the source device.
166
NOTE:
• You must make sure that the source device and the destination device can communicate at Layer 2 in
the remote probe VLAN.
• For the mirrored packets to be forwarded to the monitor port, make sure that the same probe VLAN
is configured in the remote source and destination mirroring groups.
• To make the port mirroring function work properly, before configuring bidirectional traffic mirroring
on a port in a mirroring group, you must use the mac-address mac-learning disable command on
the source device, intermediate devices, and destination device to disable the MAC address learning
function for the remote port mirroring VLAN. For more information about the mac-address maclearning disable command, see Layer 2—LAN Switching Command Reference.
CAUTION:
For a mirrored packet to successfully arrive at the remote destination device, you must make sure that
the VLAN ID carried in the packet is correct (the same as the probe VLAN ID). If the VLAN is removed
or the VLAN ID is changed, the Layer 2 remote port mirroring configuration becomes invalid.
Layer 3 remote port mirroring
Layer 3 remote port mirroring is implemented through the cooperation of a remote source mirroring
group, a remote destination mirroring group, and a GRE tunnel, as shown in Figure 66.
Figure 66 Layer 3 remote port mirroring implementation
On the source device, packets of the mirroring port (or CPU) are mirrored to the tunnel interface that
serves as the monitor port in the remote source mirroring group, and then transmitted to the destination
device through the GRE tunnel. The destination device receives the mirrored packets from the other
tunnel interface that serves the mirroring port in the remote destination mirroring group, and then
forwards the packets to the monitor port in the remote destination mirroring group. In this way, the data
monitoring device connected to the monitor port on the destination device can monitor and analyze
packets passing through the mirroring port (or CPU) on the source device.
NOTE:
For more information about GRE tunnels, see Layer 3—IP Services Configuration Guide.
167
Configuring local port mirroring
Local port mirroring configuration task list
Configuring local port mirroring is to configure local mirroring groups.
A local mirroring group comprises one or multiple mirroring ports/CPUs and one monitor port that are
located on a same device.
Complete these tasks to configure a local mirroring group:
Task
Remarks
Creating a local mirroring group
Required
Configuring mirroring ports for the local mirroring group
Configuring mirroring CPUs for the local mirroring group
Perform at least one of these operations, or all
of them.
Configuring the monitor port for the local mirroring group
Required
NOTE:
On the A5820X&A5800 switch series, you can configure a port as the source port of multiple
mirroring groups, so that traffic passing through the port can be mirrored to multiple monitor ports.
• On the A5800 switch series, unidirectional traffic of a source port occupies one mirroring resource,
and bidirectional traffic of a source port occupies two mirroring resources. The A5800 switch series
can assign up to four mirroring resources for each source port. As a result, you can add a port to
four mirroring groups as unidirectional source ports, to two mirroring groups as bidirectional source
ports, or to three mirroring groups as a bidirectional source port in one mirroring group and
unidirectional ports in two mirroring groups.
• The A5820X switch series allows you to add a source port to up to two mirroring groups.
NOTE:
A source port cannot be used as the egress or monitor port of the current or another mirroring group.
Creating a local mirroring group
To do…
Use the command…
Remarks
1. Enter system view.
system-view
—
2. Create a local mirroring
group.
mirroring-group group-id local
Required
NOTE:
A local mirroring group only takes effect after you configure a monitor port and mirroring ports/CPUs
for it.
168
Configuring mirroring ports for the local mirroring group
You can configure a list of mirroring ports for a mirroring group at a time in system view, or only assign
the current port to it as a mirroring port in interface view. To assign multiple ports to the mirroring group
as mirroring ports in interface view, repeat the step.
Configuring mirroring ports in system view
To do…
Use the command…
Remarks
1. Enter system view.
system-view
—
mirroring-group group-id
mirroring-port mirroring-port-list {
both | inbound | outbound }
Required.
2. Configure mirroring ports.
By default, no mirroring port is
configured for a mirroring group.
Configuring a mirroring port in interface view
To do…
Use the command…
Remarks
1. Enter system view.
system-view
—
2. Enter interface view.
interface interface-type interfacenumber
—
3. Configure the current port as
a mirroring port.
[ mirroring-group group-id ]
mirroring-port { both | inbound |
outbound }
Required.
By default, a port does not serve
as a mirroring port for any
mirroring group.
NOTE:
A mirroring group can contain multiple mirroring ports.
Configuring mirroring CPUs for the local mirroring group
To do…
Use the command…
Remarks
1. Enter system view.
system-view
—
mirroring-group group-id
mirroring-cpu slot slot-number-list {
both | inbound | outbound }
Required.
2. Configure mirroring CPUs.
NOTE:
A mirroring group can contain multiple mirroring CPUs.
169
By default, no mirroring CPU is
configured for a mirroring group.
Configuring the monitor port for the local mirroring group
You can configure the monitor port for a mirroring group in system view, or assign the current port to a
mirroring group as the monitor port in interface view. The two modes lead to the same result.
Configuring the monitor port in system view
To do…
Use the command…
Remarks
1. Enter system view.
system-view
—
2. Configure the monitor port.
mirroring-group group-id monitorport monitor-port-id
Required.
By default, no monitor port is
configured for a mirroring group.
Configuring the monitor port in interface view
To do…
Use the command…
Remarks
1. Enter system view.
system-view
—
2. Enter interface view.
interface interface-type interfacenumber
—
Required.
3. Configure the current port as
the monitor port.
[ mirroring-group group-id ]
monitor-port
By default, a port does not serve
as the monitor port for any
mirroring group.
NOTE:
• A mirroring group only contains one monitor port.
• To make sure that the port mirroring function works properly, do not enable STP, MSTP, or RSTP on
the monitor port.
• HP recommends you only use a monitor port for port mirroring to make sure that the data monitoring
device only receives and analyzes the mirrored traffic rather than a mix of mirrored traffic and
normally forwarded traffic.
• A port connected to an RRPP ring cannot be configured as the monitor port of a port mirroring
group.
Configuring layer 2 remote port mirroring
Layer 2 remote port mirroring configuration task list
Configuring Layer 2 remote port mirroring is to configure remote mirroring groups. When doing that,
configure the remote source mirroring group on the source device and the cooperating remote
destination mirroring group on the destination device.
170
NOTE:
On the A5820X&A5800 switch series, you can configure a port as the source port of multiple
mirroring groups so that traffic passing through the port can be mirrored to multiple monitor ports.
• On the A5800 switch series, unidirectional traffic of a source port occupies one mirroring resource,
and bidirectional traffic of a source port occupies two mirroring resources. The A5800 switch series
can assign up to four mirroring resources for each source port. As a result, you can add a port to
four mirroring groups as unidirectional source ports, to two mirroring groups as bidirectional source
ports, or to three mirroring groups as a bidirectional source port in one mirroring group and
unidirectional ports in two mirroring groups.
• The A5820X switch series allows you to add a source port to up to two mirroring groups.
NOTE:
• A source port cannot be used as the egress or monitor port of the current or another mirroring group.
• If GVRP is enabled, GVRP may register the remote probe VLAN to unexpected ports, resulting in
undesired duplicates. For information on GVRP, see Layer 2—LAN Switching Configuration Guide.
Configure the mirroring ports/CPUs, the remote probe VLAN, and the egress port for the remote source
mirroring group on the source device; then, configure the remote probe VLAN and the monitor port for
the remote destination mirroring group on the destination device.
Complete these tasks to configure Layer 2 remote port mirroring:
Task
Remarks
Creating a remote source mirroring group
Configuring mirroring ports for the remote source
mirroring group
Configuring a remote
source mirroring group.
Configuring a remote
destination mirroring
group.
Configuring mirroring CPUs for the remote source
mirroring group
Required.
Perform at least one of
these operations, or all of
them.
Configuring the egress port for the remote source
mirroring group
Required.
Configuring the remote probe VLAN for the remote
source mirroring group
Required.
Creating a remote destination mirroring group
Required.
Configuring the monitor port for the remote
destination mirroring group
Required.
Configuring the remote probe VLAN for the remote
source mirroring group
Required.
Assigning the monitor port to the remote probe
VLAN
Required.
Using the remote probe VLAN to enable local mirroring to support multiple
destination ports
171
Configuration prerequisites
Before configuring Layer 2 remote port mirroring, make sure that you have created static VLANs for the
remote probe VLAN.
CAUTION:
The remote source mirroring group on the source device and the remote destination mirroring group on
the destination device must use the same remote probe VLAN.
Configuring a remote source mirroring group (on the source
device)
To configure a remote source mirroring group, make the following configurations on the source device.
Creating a remote source mirroring group
To do…
Use the command…
Remarks
1. Enter system view.
system-view
—
2. Create a remote source
mirroring group.
Required.
mirroring-group group-id remote-source
By default, no mirroring
group exists.
Configuring mirroring ports for the remote source mirroring group
You can configure a list of mirroring ports for a mirroring group at a time in system view, or assign only
the current port to it as a mirroring port in interface view. To assign multiple ports to the mirroring group
as mirroring ports in interface view, repeat the step.
•
•
Configuring mirroring ports in system view
To do…
Use the command…
Remarks
1. Enter system view.
system-view
—
2. Configure mirroring ports for
the remote source mirroring
group.
mirroring-group group-id
mirroring-port mirroring-port-list {
both | inbound | outbound }
Required.
By default, no mirroring port is
configured for a mirroring group.
Configuring a mirroring port in interface view
To do…
Use the command…
Remarks
1. Enter system view.
system-view
—
2. Enter interface view.
interface interface-type interfacenumber
—
3. Configure the current port as
a mirroring port.
[ mirroring-group group-id ]
mirroring-port { both | inbound |
outbound }
172
Required.
By default, a port does not serve
as a mirroring port for any
mirroring group.
NOTE:
• A mirroring group can contain multiple mirroring ports.
• To make sure that the port mirroring function works properly, do not assign a mirroring port to the
remote probe VLAN.
Configuring mirroring CPUs for the remote source mirroring group
To do…
Use the command…
Remarks
1. Enter system view.
system-view
—
mirroring-group group-id
mirroring-cpu slot slot-number-list {
both | inbound | outbound }
Required.
2. Configure mirroring CPUs.
By default, no mirroring CPU is
configured for a mirroring group.
NOTE:
A mirroring group can contain multiple mirroring CPUs.
Configuring the egress port for the remote source mirroring group
You can configure the egress port for a mirroring group in system view, or assign the current port to it as
the egress port in interface view. The two configuration modes lead to the same result.
•
•
Configuring the egress port in system view
To do…
Use the command…
Remarks
1. Enter system view.
system-view
—
2. Configure the egress port for
the remote source mirroring
group.
mirroring-group group-id monitoregress monitor-egress-port
Required.
By default, no egress port is
configured for a mirroring group.
Configuring the egress port in interface view
To do…
Use the command…
Remarks
1. Enter system view.
system-view
—
2. Enter interface view.
interface interface-type interfacenumber
—
Required.
3. Configure the current port as
the egress port.
mirroring-group group-id monitoregress
By default, a port does not serve
as the egress port for any
mirroring group.
NOTE:
• A mirroring group only contains one egress port.
• A mirroring port of an existing mirroring group cannot be configured as an egress port.
• To make sure that the port mirroring function works properly, disable these functions on the egress
port: STP, MSTP, RSTP, 802.1X, IGMP Snooping, static ARP, and MAC address learning.
173
Configuring the remote probe VLAN for the remote source mirroring group
To do…
Use the command…
Remarks
1. Enter system view.
system-view
—
Required.
2. Configure the remote probe
VLAN.
mirroring-group group-id remoteprobe vlan rprobe-vlan-id
By default, no remote probe
VLAN is configured for a
mirroring group.
NOTE:
• A VLAN can only be used by one mirroring group.
• HP recommends you use the remote probe VLAN for port mirroring exclusively.
• To remove the VLAN configured as a remote probe VLAN, you must remove the remote probe VLAN
with undo mirroring-group remote-probe vlan command first. Removing the probe VLAN can
invalidate the remote source mirroring group.
Configuring a remote destination mirroring group (on the
destination device)
To configure a remote destination mirroring group, make the following configurations on the destination
device.
Creating a remote destination mirroring group
To do…
Use the command…
Remarks
1. Enter system view.
system-view
—
2. Create a remote destination
mirroring group.
mirroring-group group-id remotedestination
Required.
By default, no mirroring group
exists.
Configuring the monitor port for the remote destination mirroring group
You can configure the monitor port for a mirroring group in system view, or assign the current port to a
mirroring group as the monitor port in interface view. The two modes lead to the same result.
•
Configuring the monitor port in system view
To do…
Use the command…
Remarks
1. Enter system view.
system-view
—
2. Configure the monitor port.
mirroring-group group-id monitorport monitor-port-id
174
Required.
By default, no monitor port is
configured for a mirroring group.
•
Configuring the monitor port in interface view
To do…
Use the command…
Remarks
1. Enter system view.
system-view
—
2. Enter interface view.
interface interface-type interfacenumber
—
3. Configure the current port as
the monitor port.
[ mirroring-group group-id ]
monitor-port
Required.
By default, a port does not serve
as the monitor port for any
mirroring group.
NOTE:
• A mirroring group only contains one monitor port.
• To make sure that the port mirroring function works properly, do not enable STP, MSTP, or RSTP on
the monitor port.
• HP recommends you only use a monitor port for port mirroring. This is to make sure that the data
monitoring device only receives and analyzes the mirrored traffic rather than a mix of mirrored traffic
and normally forwarded traffic.
• A port connected to an RRPP ring cannot be configured as the monitor port of a port mirroring
group.
Configuring the remote probe VLAN for the remote destination mirroring group
To do…
Use the command…
Remarks
1. Enter system view.
system-view
—
Required.
2. Configure the remote probe
VLAN.
mirroring-group group-id remoteprobe vlan rprobe-vlan-id
By default, no remote probe
VLAN is configured for a
mirroring group.
NOTE:
• A VLAN can only be used by one mirroring group.
• HP recommends you use the remote probe VLAN for port mirroring exclusively.
• To remove the VLAN configured as a remote probe VLAN, you must remove the remote probe VLAN
with undo mirroring-group remote-probe vlan command first. Removing the probe VLAN can
invalidate the remote source mirroring group.
Assigning the monitor port to the remote probe VLAN
To do…
Use the command…
Remarks
1. Enter system view.
system-view
—
2. Enter the interface view of the
monitor port.
interface interface-type interface-number
—
3. Assign the
port to the
probe
For an access
port
port access vlan vlan-id
For a trunk port
port trunk permit vlan vlan-id
175
Required.
Use one of the
commands.
To do…
VLAN:
Use the command…
For a hybrid port
Remarks
port hybrid vlan vlan-id { tagged | untagged }
NOTE:
For more information about the port access vlan command, the port trunk permit vlan command, and
the port hybrid vlan command, see Layer 2—LAN Switching Command Reference.
Using the remote probe VLAN to enable local mirroring to
support multiple destination ports
In typical local port mirroring configuration, you can only configure one monitor port in a local mirroring
group. As a result, you cannot monitor traffic of a local device on multiple data monitoring devices. To
do that, you can take advantage of the remote probe VLAN used in Layer 2 remote mirroring.
In Layer 2 remote port mirroring, a remote probe VLAN is configured, and the mirrored packets are
broadcast within the remote probe VLAN. By connecting multiple data monitoring devices to the member
ports of the remote probe VLAN, you can monitor the traffic of the local device on multiple data
monitoring devices.
Configure this feature in the following steps:
1.
Configure a remote source mirroring group on the local device
2.
Configure the monitored ports on the device as mirroring ports of this mirroring group
3.
Configure a remote probe VLAN for this mirroring group
4.
Assign the ports connecting the data monitoring devices to the remote probe VLAN
In this way, when packets mirrored on the monitored ports are broadcast in the remote probe VLAN,
they will be sent out the ports connecting the data monitoring devices, and all data monitoring devices
can thus receive these mirrored packets.
Configuration procedure
To configure local port mirroring with multiple monitor ports:
To do…
Use the command
Remarks
1. Enter system view.
system-view
—
2. Create a remote source
mirroring group.
mirroring-group group-id remotesource
3. Configure
mirroring
ports for
the remote
source
mirroring
group:
In system view
mirroring-group group-id mirroringport mirroring-port-list { both |
inbound | outbound }
interface interface-type interfacenumber
In interface
view
[ mirroring-group group-id ] mirroringport { both | inbound | outbound }
quit
176
Required.
By default, no mirroring group
exists on a device.
Use either command.
By default, no mirroring port is
configured for a mirroring
group.
To do…
Use the command
Remarks
Required.
4. Configure the reflector port
for the remote source
mirroring group.
mirroring-group group-id reflector-port
reflector-port
By default, no reflector port is
configured for a mirroring
group.
Required.
5. Create the remote probe
VLAN and enter VLAN view.
By default, no remote probe
VLAN is configured for a
mirroring group.
vlan vlan-id
Required.
6. Assign monitor ports to
the remote probe VLAN.
port interface-list
By default, a newly-created
VLAN does not have any
member port.
7. Return to system view.
quit
—
8. Configure the remote
probe VLAN for the
remote source mirroring
group.
Required.
mirroring-group group-id remote-probe vlan
rprobe-vlan-id
By default, no remote probe
VLAN is configured for a
mirroring group.
NOTE:
• The reflector port of a remote source mirroring group must be an access port and belong to the
default VLAN, VLAN 1.
• HP recommends you configure an unused port as the reflector port of a remote source mirroring
group and disable STP on it.
• A mirroring group can contain multiple mirroring ports.
• To make sure that the port mirroring function works properly, do not assign a mirroring port to the
remote probe VLAN.
• If you have already configured a reflector port for a remote source mirroring group, you can no
longer configure an egress port for it.
• A VLAN can only serve as the remote probe VLAN for one remote source mirroring group. HP
recommends you use the remote probe VLAN for port mirroring exclusively.
• A remote probe VLAN must be a static VLAN.
• To remove the VLAN configured as a remote probe VLAN, you must remove the remote probe VLAN
with undo mirroring-group remote-probe vlan command first.
• If the remote probe VLAN of a remote mirroring group is removed, the remote mirroring group will
become invalid.
• The link type of monitor ports configured for port mirroring must be access.
177
Configuring layer 3 remote port mirroring
Layer 3 remote port mirroring configuration task list
To configure Layer 3 remote port mirroring, create a local port mirroring group on the source device as
well as on the destination device, and configure mirroring ports/CPUs and the monitor port for each
mirroring group. The source and destination devices are connected by a tunnel.
•
On the source device, you must configure the ports/CPUs you want to monitor as the mirroring
ports/CPUs, and configure the tunnel interface as the monitor port.
•
On the destination device, you must configure the physical port corresponding to the tunnel
interface as the mirroring port and configure the port that connects the data monitoring device as
the monitor port.
Complete these tasks to configure Layer 3 remote port mirroring:
Task
Remarks
Configuring local mirroring groups
Configuring mirroring ports for a local mirroring
group
Configuring the source
device.
Configuring the
destination device.
Configuring mirroring CPUs for a local mirroring
group
Required.
Perform at least one of
these operations, or all of
them.
Configuring the monitor port for a local mirroring
group
Required.
Configuring local mirroring groups
Required.
Configuring mirroring ports for a local mirroring
group
Required.
Configuring the monitor port for a local mirroring
group
Required.
NOTE:
On the A5800&A5820X switch series, you can configure a port as the source port of multiple
mirroring groups, so that traffic passing through the port can be mirrored to multiple monitor ports.
• On the A5800 switch series, unidirectional traffic of a source port occupies one mirroring resource,
and bidirectional traffic of a source port occupies two mirroring resources. The A5800 switch series
can assign up to four mirroring resources for each source port. As a result, you can add a port to
four mirroring groups as unidirectional source ports, to two mirroring groups as bidirectional source
ports, or to three mirroring groups as a bidirectional source port in one mirroring group and
unidirectional ports in two mirroring groups.
• The A5820X switch series allows you to add a source port to up to two mirroring groups.
NOTE:
A source port cannot be used as the egress or monitor port of the current or another mirroring group.
178
Configuration prerequisites
Before configuring Layer 3 remote port mirroring, create a GRE tunnel that connects the source and
destination devices.
Configuring local mirroring groups
Configure a local mirroring group on the source device and on the destination device separately.
To create a local mirroring group (on the source or destination device):
To do…
Use the command…
Remarks
1. Enter system view.
system-view
—
2. Create a local mirroring
group.
Required.
mirroring-group group-id local
By default, no mirroring
group exists.
Configuring mirroring ports for a local mirroring group
On the source device, configure the ports you want to monitor as the mirroring ports; on the destination
device, configure the physical port corresponding to the tunnel interface as the mirroring port.
You can configure a list of mirroring ports for a mirroring group at a time in system view, or assign only
the current port to it as a mirroring port in interface view. To assign multiple ports to the mirroring group
as mirroring ports in interface view, repeat the step.
Configuring mirroring ports in system view
To configure mirroring ports for a local mirroring group in system view:
To do…
Use the command…
Remarks
1. Enter system view.
system-view
—
2. Configure mirroring ports for
a local mirroring group.
mirroring-group group-id
mirroring-port mirroring-port-list {
both | inbound | outbound }
Required.
By default, no mirroring port is
configured for a mirroring group.
Configuring a mirroring port in interface view
To do…
Use the command…
Remarks
1. Enter system view.
system-view
—
2. Enter interface view.
interface interface-type interfacenumber
—
3. Configure the current port as
a mirroring port.
[ mirroring-group group-id ]
mirroring-port { both | inbound |
outbound }
NOTE:
A mirroring group can contain multiple mirroring ports.
179
Required.
By default, a port does not serve
as a mirroring port for any
mirroring group.
Configuring mirroring CPUs for a local mirroring group
To do…
Use the command…
Remarks
1. Enter system view.
system-view
—
mirroring-group group-id
mirroring-cpu slot slot-number-list {
both | inbound | outbound }
Required.
2. Configure mirroring CPUs.
By default, no mirroring CPU is
configured for a mirroring group.
NOTE:
A mirroring group can contain multiple mirroring CPUs.
Configuring the monitor port for a local mirroring group
On the source device, configure the tunnel interface as the monitor port; on the destination device,
configure the port that connects the data monitoring device as the monitor port.
You can configure the monitor port for a mirroring group in system view, or assign the current port to a
mirroring group as the monitor port in interface view. The two modes lead to the same result.
Configuring the monitor port in system view
To do…
Use the command…
Remarks
1. Enter system view.
system-view
—
2. Configure the monitor port.
mirroring-group group-id monitorport monitor-port-id
Required.
By default, no monitor port is
configured for a mirroring group.
Configuring the monitor port in interface view
To do…
Use the command…
Remarks
1. Enter system view.
system-view
—
2. Enter interface view.
interface interface-type interfacenumber
—
Required.
3. Configure the current port as
the monitor port.
[ mirroring-group group-id ]
monitor-port
180
By default, a port does not serve
as the monitor port for any
mirroring group.
NOTE:
• A mirroring group only contains one monitor port.
• To make sure that the port mirroring function can work properly, do not enable STP, MSTP, or RSTP on
the monitor port.
• HP recommends you only use a monitor port for port mirroring. This is to make sure that the data
monitoring device only receives and analyzes the mirrored traffic rather than a mix of mirrored traffic
and normally forwarded traffic.
• A port connected to an RRPP ring cannot be configured as the monitor port of a port mirroring
group.
Displaying and maintaining port mirroring
To do…
Use the command…
Remarks
Display the configuration of port
mirroring groups
display mirroring-group { group-id
| all | local | remote-destination
| remote-source }
Available in any view
Configuring port mirroring examples
Configuring local port mirroring example
Network requirements
On a network shown in Figure 67:
•
Device A connects to the marketing department through GigabitEthernet 1/0/1 and to the
technical department through GigabitEthernet 1/0/2, and connects to the server through
GigabitEthernet 1/0/3.
•
Configure local port mirroring in mirroring port mode to enable the server to monitor the
bidirectional traffic of the marketing department and the technical department.
Figure 67 Network diagram for local port mirroring configuration
181
Configuration procedure
1.
Create a local mirroring group.
# Create local mirroring group 1.
<DeviceA> system-view
[DeviceA] mirroring-group 1 local
# Configure GigabitEthernet 1/0/1 and GigabitEthernet 1/0/2 as mirroring ports and port
GigabitEthernet 1/0/3 as the monitor port.
[DeviceA] mirroring-group 1 mirroring-port gigabitethernet 1/0/1 gigabitethernet 1/0/2
both
[DeviceA] mirroring-group 1 monitor-port gigabitethernet 1/0/3
# Disable Spanning Tree Protocol (STP) in the monitor port GigabitEthernet1/0/3.
[DeviceA] interface gigabitethernet 1/0/3
[DeviceA-GigabitEthernet1/0/3] undo stp enable
[DeviceA-GigabitEthernet1/0/3] quit
2.
Verify the configurations.
# Display the configuration of all port mirroring groups.
[DeviceA] display mirroring-group all
mirroring-group 1:
type: local
status: active
mirroring port:
GigabitEthernet1/0/1
both
GigabitEthernet1/0/2
both
mirroring CPU:
monitor port: GigabitEthernet1/0/3
After the configurations are completed, you can monitor all packets received and sent by the marketing
department and the technical department on the server.
Configuring Layer 2 remote port mirroring example
Network requirements
On the Layer 2 network shown in Figure 68,
•
Device A connects to the marketing department through GigabitEthernet 1/0/1, and to the trunk
port GigabitEthernet 1/0/1 of Device B through the trunk port GigabitEthernet 1/0/2; Device C
connects to the server through GigabitEthernet 1/0/2, and to the trunk port GigabitEthernet 1/0/2
of Device B through the trunk port GigabitEthernet 1/0/1.
•
Configure Layer 2 remote port mirroring to enable the server to monitor the bidirectional traffic of
the marketing department.
182
Figure 68 Network diagram for Layer 2 remote port mirroring configuration
Configuration procedure
1.
Configure Device A (the source device)
# Create a remote source mirroring group.
<DeviceA> system-view
[DeviceA] mirroring-group 1 remote-source
# Create VLAN 2 and disable the MAC address learning function for VLAN 2.
[DeviceA] vlan 2
[DeviceA-vlan2] mac-address mac-learning disable
[DeviceA-vlan2] quit
# Configure VLAN 2 as the remote probe VLAN of the mirroring group; configure GigabitEthernet
1/0/1 as a mirroring port and GigabitEthernet 1/0/2 as the egress port in the mirroring group.
[DeviceA] mirroring-group 1 remote-probe vlan 2
[DeviceA] mirroring-group 1 mirroring-port gigabitethernet 1/0/1 both
[DeviceA] mirroring-group 1 monitor-egress gigabitethernet 1/0/2
# Configure GigabitEthernet 1/0/2 as a trunk port that permits the packets of VLAN 2 to pass through,
and disable STP on it.
[DeviceA] interface gigabitethernet 1/0/2
[DeviceA-GigabitEthernet1/0/2] port link-type trunk
[DeviceA-GigabitEthernet1/0/2] port trunk permit vlan 2
[DeviceA-GigabitEthernet1/0/2] undo stp enable
[DeviceA-GigabitEthernet1/0/2] quit
2.
Configure Device B (the intermediate device)
# Create VLAN 2 and disable the MAC address learning function for VLAN 2.
<DeviceB> system-view
[DeviceB] vlan 2
[DeviceB-vlan2] mac-address mac-learning disable
[DeviceB-vlan2] quit
# Configure GigabitEthernet 1/0/1 as a trunk port that permits the packets of VLAN 2 to pass through.
[DeviceB] interface gigabitethernet 1/0/1
[DeviceB-GigabitEthernet1/0/1] port link-type trunk
[DeviceB-GigabitEthernet1/0/1] port trunk permit vlan 2
183
[DeviceB-GigabitEthernet1/0/1] quit
# Configure GigabitEthernet 1/0/2 as a trunk port that permits the packets of VLAN 2 to pass through.
[DeviceB-GigabitEthernet1/0/1] quit
[DeviceB] interface gigabitethernet 1/0/2
[DeviceB-GigabitEthernet1/0/2] port link-type trunk
[DeviceB-GigabitEthernet1/0/2] port trunk permit vlan 2
[DeviceB-GigabitEthernet1/0/2] quit
3.
Configure Device C (the destination device)
# Configure GigabitEthernet 1/0/1 as a trunk port that permits the packets of VLAN 2 to pass through.
<DeviceC> system-view
[DeviceC] interface gigabitethernet 1/0/1
[DeviceC-GigabitEthernet1/0/1] port link-type trunk
[DeviceC-GigabitEthernet1/0/1] port trunk permit vlan 2
[DeviceC-GigabitEthernet1/0/1] quit
# Create a remote destination mirroring group.
[DeviceC] mirroring-group 1 remote-destination
# Create VLAN 2 and disable the MAC address learning function for VLAN 2.
[DeviceC] vlan 2
[DeviceC-vlan2] mac-address mac-learning disable
[DeviceC-vlan2] quit
# Configure VLAN 2 as the remote probe VLAN of the mirroring group; configure GigabitEthernet
1/0/2 as the monitor port of the mirroring group; disable STP on GigabitEthernet 1/0/2 and assign the
port to VLAN 2.
[DeviceC] mirroring-group 1 remote-probe vlan 2
[DeviceC] interface gigabitethernet 1/0/2
[DeviceC-GigabitEthernet1/0/2] mirroring-group 1 monitor-port
[DeviceC-GigabitEthernet1/0/2] undo stp enable
[DeviceC-GigabitEthernet1/0/2] port access vlan 2
[DeviceC-GigabitEthernet1/0/2] quit
4.
Verify the configurations
After the configurations are completed, you can monitor all packets received and sent by the marketing
department on the server.
Configuring local port mirroring with multiple monitor ports
example
Network requirements
As shown in Figure 69, Dept. A, Dept. B, and Dept. C are connected to Switch A through ports
GigabitEthernet 1/0/1, GigabitEthernet 1/0/2, and GigabitEthernet 1/0/3 respectively. Configure
port mirroring to enable all three data monitoring devices, Server A, Server B, and Server C, to monitor
both the incoming and outgoing traffic of the three departments.
184
Figure 69 Network diagram for configuring local port mirroring with multiple monitor ports
Configuration procedure
# Create remote source mirroring group 1.
<SwitchA> system-view
[SwitchA] mirroring-group 1 remote-source
# Configure GigabitEthernet 1/0/1 through GigabitEthernet 1/0/3 as mirroring ports of remote source
mirroring group 1.
[SwitchA] mirroring-group 1 mirroring-port gigabitethernet 1/0/1 to gigabitethernet 1/0/3
both
# Configure an unused port (GigabitEthernet 1/0/5 for example) of Switch A as the reflector port of
remote source mirroring group 1, and disable STP on the port.
[SwitchA] mirroring-group 1 reflector-port GigabitEthernet 1/0/5
[SwitchA] interface GigabitEthernet 1/0/5
[SwitchA-GigabitEthernet1/0/5] undo stp enable
# Create VLAN 10 and assign the three ports (Gigabitethernet 1/0/11 through Gigabitethernet
1/0/13) connecting the three data monitoring devices to VLAN 10.
[SwitchA] vlan 10
[SwitchA-vlan10] port gigabitethernet 1/0/11 to gigabitethernet 1/0/13
[SwitchA-vlan10] quit
# Configure VLAN 10 as the remote probe VLAN of remote source mirroring group 1.
[SwitchA] mirroring-group 1 remote-probe vlan 10
185
Configuring Layer 3 remote port mirroring example
Network requirements
On the network shown in Figure 70,
•
Device A connects to the marketing department through GigabitEthernet 1/0/1, and to
GigabitEthernet 1/0/1 of Device B through GigabitEthernet 1/0/2; Device C connects to the
server through GigabitEthernet 1/0/2, and to GigabitEthernet 1/0/2 of Device B through
GigabitEthernet 1/0/1.
•
Configure Layer 3 remote port mirroring to enable the server to monitor the bidirectional traffic of
the marketing department through a GRE tunnel.
Figure 70 Network diagram for Layer 3 remote port mirroring configuration
Source
device
Device A
GE1/0/1
VLAN-int10
10.1.1.1/24
GE1/0/2
VLAN-int11
20.1.1.1/24
Intermediate
device
GE1/0/2 Device B GE1/0/1
VLAN-int12
30.1.1.1/24
VLAN-int11
20.1.1.2/24
GE1/0/1
VLAN-int12
30.1.1.2/24
GRE tunnel
Tunnel0
50.1.1.1/24
Tunnel0
50.1.1.2/24
Destination
device
Device C
GE1/0/2
VLAN-int10
40.1.1.1/24
Marketing
Dept.
Common port
Source port
Monitor port
Server
Configuration procedure
1.
Configure IP addresses for the tunnel interfaces and related ports on the devices.
Configure IP addresses and subnet masks for related ports and the tunnel interfaces according to the
configurations shown in Figure 70.
2.
Configure Device A (the source device)
# Create tunnel interface Tunnel 0, and configure an IP address and subnet mask for it.
<DeviceA> system-view
[DeviceA] interface tunnel 0
[DeviceA-Tunnel0] ip address 50.1.1.1 24
# Configure Tunnel 0 to operate in GRE mode, and configure source and destination IP addresses for it.
[DeviceA-Tunnel0] tunnel-protocol gre
[DeviceA-Tunnel0] source 20.1.1.1
[DeviceA-Tunnel0] destination 30.1.1.2
[DeviceA-Tunnel0] quit
# Create and configure service loopback group 1 and specify its service type as tunnel.
[DeviceA] service-loopback group 1 type tunnel
# Assign a port (GigabitEthernet 1/0/3 for example) of the device to service loopback group 1.
[DeviceA] interface GigabitEthernet 1/0/3
[DeviceA-GigabitEthernet1/0/3] undo stp enable
186
[DeviceA-GigabitEthernet1/0/3] port service-loopback group 1
# In tunnel interface view, configure the tunnel to reference service loopback group 1.
[DeviceA-GigabitEthernet1/0/3] quit
[DeviceA] interface tunnel 0
[DeviceA-Tunnel0] service-loopback-group 1
[DeviceA-Tunnel0] quit
# Enable the OSPF protocol.
[DeviceA] ospf 1
[DeviceA-ospf-1] area 0
[DeviceA-ospf-1-area-0.0.0.0] network 10.1.1.0 0.0.0.255
[DeviceA-ospf-1-area-0.0.0.0] network 20.1.1.0 0.0.0.255
[DeviceA-ospf-1-area-0.0.0.0] network 50.1.1.0 0.0.0.255
[DeviceA-ospf-1-area-0.0.0.0] quit
[DeviceA-ospf-1] quit
# Create local mirroring group 1.
[DeviceA] mirroring-group 1 local
# Configure GigabitEthernet 1/0/1 as a mirroring port and Tunnel 0 as the monitor port of local
mirroring group 1.
[DeviceA] mirroring-group 1 mirroring-port gigabitethernet 1/0/1 both
[DeviceA] mirroring-group 1 monitor-port tunnel 0
3.
Configure Device B (the intermediate device)
# Enable the OSPF protocol
<DeviceB> system-view
[DeviceB] ospf 1
[DeviceB-ospf-1] area 0
[DeviceB-ospf-1-area-0.0.0.0] network 20.1.1.0 0.0.0.255
[DeviceB-ospf-1-area-0.0.0.0] network 30.1.1.0 0.0.0.255
[DeviceB-ospf-1-area-0.0.0.0] quit
[DeviceB-ospf-1] quit
4.
Configure Device C (the destination device)
# Create tunnel interface Tunnel 0, and configure an IP address and subnet mask for it.
<DeviceC> system-view
[DeviceC] interface tunnel 0
[DeviceC-Tunnel0] ip address 50.1.1.2 24
# Configure Tunnel 0 to operate in GRE mode, and configure source and destination IP addresses for it.
[DeviceC-Tunnel0] tunnel-protocol gre
[DeviceC-Tunnel0] source 30.1.1.2
[DeviceC-Tunnel0] destination 20.1.1.1
[DeviceC-Tunnel0] quit
# Create and configure service loopback group 1 and specify its service type as tunnel.
[DeviceC] service-loopback group 1 type tunnel
# Assign a port (GigabitEthernet 1/0/3 for example) of the device to service loopback group 1.
[DeviceC] interface GigabitEthernet 1/0/3
[DeviceC-GigabitEthernet1/0/3] undo stp enable
187
[DeviceC-GigabitEthernet1/0/3] port service-loopback group 1
# In tunnel interface view, configure the tunnel to reference service loopback group 1.
[DeviceC-GigabitEthernet1/0/3] quit
[DeviceC] interface tunnel 0
[DeviceC-Tunnel0] service-loopback-group 1
[DeviceC-Tunnel0] quit
# Enable the OSPF protocol.
[DeviceC] ospf 1
[DeviceC-ospf-1] area 0
[DeviceC-ospf-1-area-0.0.0.0] network 30.1.1.0 0.0.0.255
[DeviceC-ospf-1-area-0.0.0.0] network 40.1.1.0 0.0.0.255
[DeviceC-ospf-1-area-0.0.0.0] network 50.1.1.0 0.0.0.255
[DeviceC-ospf-1-area-0.0.0.0] quit
[DeviceC-ospf-1] quit
# Create local mirroring group 1.
[DeviceC] mirroring-group 1 local
# Configure GigabitEthernet 1/0/1 as a mirroring port and GigabitEthernet 1/0/2 as the monitor port
of local mirroring group 1, and disable STP on GigabitEthernet 1/0/2.
[DeviceC] mirroring-group 1 mirroring-port gigabitethernet 1/0/1 inbound
[DeviceC] mirroring-group 1 monitor-port gigabitethernet 1/0/2
[DeviceC] interface gigabitethernet 1/0/2
[DeviceC-GigabitEthernet1/0/2] undo stp enable
5.
Verify the configurations
After the configurations are completed, you can monitor all packets received and sent by the marketing
department on the server.
188
Configuring traffic mirroring
Traffic mirroring is the action of copying the specified packets to the specified destination for packet
analyzing and monitoring.
You can configure mirroring traffic to an interface or to the CPU.
•
Mirroring traffic to an interface: copies the matching packets on an interface to a destination
interface.
•
Mirroring traffic to the CPU: copies the matching packets on an interface to a CPU (the CPU of the
device where the traffic mirroring-enabled interface resides).
To configure traffic mirroring, you must enter the view of an existing traffic behavior.
NOTE:
In a traffic behavior, the action of mirroring traffic to an interface and the action of mirroring traffic to
a CPU is mutually exclusive.
Mirroring traffic to an interface
To do…
Use the command…
Remarks
1. Enter system view.
system-view
—
2. Create a class and enter
class view.
traffic classifier tcl-name [ operator { and
| or } ]
Required.
By default, no traffic class
exists.
Required.
3. Configure the match
criteria.
if-match match-criteria
By default, no match criterion
is configured in a traffic class.
4. Exit class view.
quit
—
5. Create a behavior and
enter behavior view.
traffic behavior behavior-name
Required.
189
By default, no traffic behavior
exists.
To do…
Use the command…
Remarks
Required.
By default, traffic mirroring is
not configured in a traffic
behavior.
Execute this command multiple
times to configure multiple
traffic mirroring destination
ports in a traffic behavior. On
an A5800 switch, you can
configure up to four traffic
mirroring destination ports in a
traffic behavior. On an
A5820X switch, you can
configure up to two traffic
mirroring destination ports in a
traffic behavior.
6. Specify the destination
interface for traffic
mirroring.
mirror-to interface interface-type
interface-number
7. Exit behavior view.
quit
8. Create a policy and enter
policy view.
qos policy policy-name
9. Associate the class with
the traffic behavior in the
QoS policy.
classifier tcl-name behavior behaviorname
10. Exit policy view.
quit
—
11. Apply the QoS policy.
See “Applying a QoS policy”
Required.
—
Required.
By default, no policy exists.
Required.
By default, no traffic behavior
is associated with a class.
Mirroring traffic to the CPU
To do…
Use the command…
Remarks
1. Enter system view.
system-view
—
2. Create a class and enter
class view.
traffic classifier tcl-name [ operator { and
| or } ]
3. Configure the match
criteria.
if-match match-criteria
By default, no match criterion
is configured in a traffic class.
4. Exit class view.
quit
—
5. Create a behavior and
enter behavior view.
Required.
By default, no traffic class
exists.
Required.
Required.
traffic behavior behavior-name
By default, no traffic behavior
exists.
Required.
6. Mirror traffic to the CPU.
mirror-to cpu
By default, traffic mirroring is
not configured in a traffic
behavior.
7. Exit behavior view.
quit
—
190
To do…
Use the command…
Remarks
8. Create a policy and enter
policy view.
qos policy policy-name
9. Associate the class with
the traffic behavior in the
QoS policy.
classifier tcl-name behavior behaviorname
10. Exit policy view.
quit
—
11. Apply the QoS policy.
See “Applying a QoS policy”
Required.
Required.
By default, no policy exists.
Required.
By default, no traffic behavior
is associated with a class.
Applying a QoS policy
For more information about applying a QoS policy, see ACL and QoS Configuration Guide.
Appling a QoS policy to an interface
By applying a QoS policy to an interface, you can regulate the traffic sent or received on the interface.
A policy can be applied to multiple interfaces, but in one direction (inbound or outbound) of an
interface, only one policy can be applied.
To apply a QoS policy to an interface:
To do…
Use the command…
Remarks
1. Enter system view.
system-view
—
Enter interface
view.
interface interface-type interfacenumber
Use either command.
Enter port
group view.
port-group manual port-groupname
3. Apply a policy to the
interface or all ports in the
port group.
qos apply policy policy-name {
inbound | outbound }
2. Enter
interface
view or
port group
view:
Settings in interface view take
effect on the current interface;
settings in port group view take
effect on all ports in the port
group.
Required.
NOTE:
For more information about the qos apply policy command, see ACL and QoS Command Reference.
Apply a QoS policy to a VLAN
You can apply a QoS policy to a VLAN to regulate the traffic sent or received on all ports in the VLAN.
To do…
Use the command…
Remarks
1. Enter system view.
system-view
—
2. Apply a QoS policy to a
VLAN.
qos vlan-policy policy-name vlan
vlan-id-list { inbound | outbound }
Required.
NOTE:
For more information about the qos vlan-policy command, see ACL and QoS Command Reference.
191
Apply a QoS policy globally
You can apply a QoS policy globally to the inbound or outbound direction of all ports.
To apply a QoS policy globally:
To do…
Use the command…
Remarks
1. Enter system view.
system-view
—
2. Apply a QoS policy globally.
qos apply policy policy-name
global { inbound | outbound }
Required.
NOTE:
For more information about the qos apply policy command, see ACL and QoS Command Reference.
Displaying and maintaining traffic mirroring
To do…
Use the command…
Remarks
Display traffic behavior
configuration information
display traffic behavior userdefined [ behavior-name ]
Available in any view
Display QoS policy configuration
information
display qos policy user-defined [
policy-name [ classifier tcl-name ]
]
Available in any view
Configuring traffic mirroring examples
Mirroring traffic to an interface example
Network requirements
On the network as shown in Figure 71, Host A (with the IP address 192.168.0.1) and Host B are
connected to GigabitEthernet1/0/1 of the switch; a data monitoring device is connected to
GigabitEthernet1/0/2 of the switch.
Monitor and analyze packets sent by Host A on the data monitoring device.
Figure 71 Network diagram for configuring traffic mirroring to a port
Configuration procedure
Configure Switch:
192
# Enter system view.
<Sysname> system-view
# Configure basic IPv4 ACL 2000 to match packets with the source IP address 192.168.0.1.
[Sysname] acl number 2000
[Sysname-acl-basic-2000] rule permit source 192.168.0.1 0
[Sysname-acl-basic-2000] quit
# Create class 1 and configure the class to use ACL 2000 for traffic classification.
[Sysname] traffic classifier 1
[Sysname-classifier-1] if-match acl 2000
[Sysname-classifier-1] quit
# Create behavior 1 and configure the action of mirroring traffic to GigabitEthernet1/0/2 in the traffic
behavior.
[Sysname] traffic behavior 1
[Sysname-behavior-1] mirror-to interface GigabitEthernet 1/0/2
[Sysname-behavior-1] quit
# Create QoS policy 1 and associate traffic behavior 1 with class 1 in the QoS policy.
[Sysname] qos policy 1
[Sysname-policy-1] classifier 1 behavior 1
[Sysname-policy-1] quit
# Apply the QoS policy to the incoming traffic of GigabitEthernet 1/0/1.
[Sysname] interface GigabitEthernet 1/0/1
[Sysname-GigabitEthernet1/0/1] qos apply policy 1 inbound
After the configurations, you can monitor all packets sent from Host A on the data monitoring device.
193
Configuring NetStream
The A5820X switch series do not support NetStream.
Legacy traffic statistics collection methods, like SNMP and port mirroring, cannot provide precise
network management because of inflexible statistical methods or high cost (dedicated servers are
required). This calls for a new technology to collect traffic statistics.
NetStream provides statistics on network traffic flows and can be deployed on access, distribution, and
core layers.
The NetStream technology implements the following features:
•
Accounting and billing—NetStream provides fine-gained data about the network usage based on
the resources such as lines, bandwidth, and time periods. The ISP can use the data for billing
based on time period, bandwidth usage, application usage, and QoS. The enterprise customers
can use this information for department chargeback or cost allocation.
•
Network planning—NetStream data provides key information, for example the AS traffic
information, for optimizing the network design and planning. This helps maximize the network
performance and reliability when minimizing the network operation cost.
•
Network monitoring—Configured on the Internet interface, NetStream allows for traffic and
bandwidth utilization monitoring in real time. Based on this, administrators can understand how the
network is used and where the bottleneck is, better planning the resource allocation.
•
User monitoring and analysis—The NetStream data provides detailed information about network
applications and resources. This information helps network administrators efficiently plan and
allocate network resources, and ensure network security.
NetStream basic concepts
What is a flow
NetStream is an accounting technology to provide statistics on a per-flow basis. An IPv4 flow is defined
by the 7-tuple elements: destination address, source IP address, destination port number, source port
number, protocol number, ToS, and inbound or outbound interface. The 7-tuple elements define a unique
flow.
How NetStream works
A typical NetStream system comprises three parts: NDE, NSC, and NDA.
•
NDE
The NDE analyzes traffic flows that pass through it, collects necessary data from the target flows, and
exports the data to the NSC. Before exporting data, the NDE may process the data like aggregation. A
device with NetStream configured acts as an NDE.
194
•
NSC
The NSC is usually a program running in Unix or Windows. It parses the packets sent from the NDE,
stores the statistics to the database for the NDA. The NSC gathers the data from multiple NDEs, then
filters and aggregates the total received data.
•
NDA
The NDA is a network traffic analysis tool. It collects statistics from the NSC, and performs further
process, generates various types of reports for applications of traffic billing, network planning, and
attack detection and monitoring. Typically, the NDA features a Web-based system for users to easily
obtain, view, and gather the data.
Figure 72 NetStream system
NDE
NSC
NDA
NDE
As shown in Figure 72, the following procedure of NetStream data collection and analysis occurs:
1.
The NDE, that is the device configured with NetStream, periodically delivers the collected statistics
to the NSC.
2.
The NSC processes the statistics, and then sends the results to the NDA.
3.
The NDA analyzes the statistics for accounting, network planning, and the like.
NOTE:
• This document focuses on the description and configuration of NDE.
• NSC and NDA are usually integrated into a NetStream server.
NetStream key technologies
Flow aging
The flow aging in NetStream is a means used by the NDE to export NetStream data to the NetStream
server. NetStream creates a NetStream entry for each active flow in the cache of the NDE and each
entry stores the flow statistics, which will be later exported to the NetStream server. When the timer of
an entry expires, the NDE exports the summarized data to the NetStream server in a specified
NetStream version export format. For more information about flow aging types and configuration, see
“Configuring NetStream flow aging.”
195
NetStream data export
NetStream traditional data export
NetStream collects statistics of each flow and, when the entry timer expires, exports the data of each
entry to the NetStream server.
Though the data includes statistics of each flow, this method consumes more bandwidth and CPU, and
requires large cache size. In most cases, not all statistics are necessary for analysis.
NetStream aggregation data export
NetStream aggregation merges the flow statistics according to the aggregation criteria of an
aggregation mode, and sends the summarized data to the NetStream server. This process is the
NetStream aggregation data export, which decreases the bandwidth usage compared to traditional
data export.
For example, the aggregation mode configured on the NDE is protocol-port, which means to aggregate
statistics of flow entries by protocol number, source port and destination port. Four NetStream entries
record four TCP flows with the same destination address, source port and destination port but different
source addresses. According to the aggregation mode, only one NetStream aggregation flow is created
and sent to the NetStream server.
Table 6 lists the 9 aggregation modes. In each mode, the system merges flows into one aggregation
flow if the aggregation criteria are of the same value. These 9 aggregation modes work independently
and can be configured on the same interface.
Table 6 NetStream aggregation modes
Aggregation mode
Aggregation criteria
Protocol-port aggregation
• Protocol number
• Source port
• Destination port
Source AS number
Source-prefix aggregation
•
•
•
•
•
•
•
•
Destination AS number
•
•
•
•
•
•
•
•
Source AS number
Destination-prefix aggregation
Prefix aggregation
Source address mask length
Source prefix
Inbound interface index
Destination address mask length
Destination prefix
Outbound interface index
Destination AS number
Source address mask length
Destination address mask length
Source prefix
Destination prefix
Inbound interface index
Outbound interface index
196
Aggregation mode
Aggregation criteria
Source prefix
Prefix-port aggregation
•
•
•
•
•
•
•
•
•
•
•
•
•
•
•
ToS
•
•
•
•
•
ToS
•
•
•
•
•
•
•
•
•
ToS
•
•
•
•
•
•
ToS
ToS-source-prefix aggregation
ToS-destination-prefix aggregation
ToS- prefix aggregation
ToS-protocol-port aggregation
Destination prefix
Source address mask length
Destination address mask length
ToS
Protocol number
Source port
Destination port
Inbound interface index
Outbound interface index
Source AS number
Source prefix
Source address mask length
Inbound interface index
Destination AS number
Destination address mask length
Destination prefix
Outbound interface index
Source AS number
Source prefix
Source address mask length
Destination AS number
Destination address mask length
Destination prefix
Inbound interface index
Outbound interface index
Protocol type
Source port
Destination port
Inbound interface index
Outbound interface index
NetStream export formats
NetStream exports data in UDP datagrams in one of the following formats: version 5, version 8 and
version 9.
•
Version 5: Exports original statistics collected based on the 7-tuple elements. The packet format is
fixed and cannot be extended flexibly.
•
Version 8: Supports NetStream aggregation data export. The packet formats are fixed and cannot
be extended flexibly.
197
•
Version 9: The most flexible format. It allows users to define templates with different statistics fields.
The template-based feature provides support of different statistics information, such as BGP next
hop and MPLS information.
Introduction to NetStream sampling and filtering
NetStream sampling
NetStream sampling basically reflects the network traffic information by collecting statistics on fewer
packets. The reduced statistics to be transferred also bring down the impact on the device performance.
For more information about sampling, see “Configuring a sampler.”
NetStream filtering
NetStream filtering is implemented by referencing an ACL or applying a QoS policy to NetStream.
NetStream filtering enables NetStream module to collect statistics on packets permitted by the filtering
criteria. The filtering allows for selecting specific data flows for statistics purpose. The NetStream filtering
by QoS policy is flexible and suitable for various applications.
NetStream configuration task list
Before you configure NetStream, determine the following proper configurations as needed.
•
Make sure on which device you want to enable NetStream.
•
If multiple service flows are passing the NDE, use an ACL or QoS policy to select the target data.
•
If enormous traffic flows are on the network, configure NetStream sampling.
•
Decide which export format is used for NetStream data export.
•
Configure the timer for NetStream flow aging.
•
To reduce the bandwidth consumption of NetStream data export, configure NetStream
aggregation.
198
Figure 73 NetStream configuration flow
Complete these tasks to configure NetStream:
Task
Remarks
Enabling NetStream
Required
Configuring NetStream filtering
Optional
Configuring NetStream sampling
Optional
Configuring NetStream data
export
Configuring NetStream traditional data
export
Configuring NetStream aggregation
data export
Required
Use at least one approach.
Configuring attributes of NetStream export data
Optional
Configuring NetStream flow aging
Optional
199
Enabling NetStream
Enabling NetStream on an interface
To do…
Use the command…
Remarks
1. Enter system view.
system-view
—
2. Enter Layer 2 Ethernet
interface view or Layer 3
Ethernet interface view.
interface interface-type interface-number
—
3. Enable NetStream on the
interface.
ip netstream { inbound | outbound }
Required.
Disabled by default.
NOTE:
NetStream can only be enabled on Layer 2 Ethernet interface or Layer 3 Ethernet interface.
Configuring NetStream filtering and sampling
Before you configure NetStream filtering and sampling, use the ip netstream command to enable
NetStream.
Configuring NetStream filtering
Configuring ACL-based NetStream filtering
To do…
Use the command…
Remarks
1. Enter system view.
system-view
—
2. Enter Layer 2 Ethernet interface
view or Layer 3 Ethernet
interface view.
interface interface-type interface-number
—
3. Enable ACL-based NetStream
filtering in the inbound or
outbound direction of an
interface.
Optional.
ip netstream filter acl acl-number {
inbound | outbound }
By default, no ACL is
referenced and IPv4
packets are not filtered.
NOTE:
• When NetStream filtering and sampling are both configured, packets are filtered first and then the
matching packets are sampled.
• An ACL must be created before being referenced by NetStream filtering. An ACL that is referenced by
NetStream filtering cannot be deleted or modified. For more information about ACLs, see ACL and
QoS Configuration Guide.
Configuring QoS-based NetStream filtering
Use the netstream filter command to configure a NetStream filtering action for a traffic behavior by
specifying the following keywords:
200
•
deny to forward packets without performing NetStream processing.
•
permit to perform NetStream processing.
To configure QoS-based NetStream filtering:
To do…
Use the command…
Remarks
1. Enter system view.
system-view
—
2. Define a class and enter its view.
traffic classifier tcl-name [ operator { and | or
}]
—
3. Define a match criterion.
if-match match-criteria
—
4. Quit the class view.
quit
—
5. Create a traffic behavior and enter its
view.
traffic behavior behavior-name
—
6. Configure the NetStream filtering
action for a traffic behavior.
netstream filter { deny | permit }
Required
7. Quit the traffic behavior view.
quit
—
8. Create a policy and enter its view.
qos policy policy-name
—
9. Specify a behavior for a class in the
policy.
classifier tcl-name behavior behavior-name
—
10. Quit the policy view.
quit
—
Interface-based
In Layer 2 Ethernet interface view or Layer 3
Ethernet interface view:
qos apply policy policy-name { inbound |
outbound }
—
In system view:
11. Apply a
QoS policy:
VLAN-based
qos vlan-policy policy-name vlan vlan-id-list {
inbound | outbound }
—
In system view:
Globally
qos apply policy policy-name global { inbound
| outbound }
—
NOTE:
For more information about class, traffic behavior, QoS policy, see ACL and QoS Configuration Guide.
201
Configuring NetStream sampling
To do…
Use the command…
Remarks
1. Enter system view.
system-view
—
2. Enter Layer 2 Ethernet
interface view or Layer
3 Ethernet interface
view.
interface interface-type interface-number
—
Required.
3. Configure NetStream
sampling.
Disable by default.
ip netstream sampler sampler-name {
inbound | outbound }
You can also execute the
command in system view to
enable NetStream sampling for
all interfaces.
NOTE:
• When NetStream filtering and sampling are both configured, packets are filtered first and then the
permitted packets are sampled.
• A sampler must be created by using the sampler command before being referenced by NetStream
sampling.
• A sampler that is referenced by NetStream sampling cannot be deleted. For more information about
samplers, see “Configuring a sampler.”
Configuring NetStream data export
To allow the NDE to export collected statistics to the NetStream server, configure the source interface out
of which the data is sent and the destination address to which the data is sent.
Configuring NetStream traditional data export
To do…
Use the command…
Remarks
1. Enter system view.
system-view
—
2. Enter Layer 2 Ethernet
interface view or Layer 3
Ethernet interface view.
interface interface-type interfacenumber
—
3. Enable NetStream.
ip netstream { inbound |
outbound }
Required.
4. Exit to system view.
quit
—
5. Configure the destination
address for the
NetStream traditional
data export.
Disabled by default.
Required.
ip netstream export host ipaddress udp-port [ vpn-instance
vpn-instance-name ]
202
By default, no destination address is
configured, in which case, the
NetStream traditional data is not
exported.
To do…
Use the command…
Remarks
Optional.
• By default, the interface where the
6. Configure the source
interface for NetStream
traditional data export.
ip netstream export source
interface interface-type interfacenumber
NetStream data is sent out (the
interface connects to the
NetStream server) is used as the
source interface.
• HP recommends you connect the
network management interface to
the NetStream server and
configure it as the source
interface.
7. Limit the data export rate.
ip netstream export rate rate
Optional.
No limit by default.
Configuring NetStream aggregation data export
NetStream aggregation can be implemented by software or hardware. The term of NetStream
aggregation refers to the implementation by software, unless otherwise noted.
The NetStream hardware aggregation directly merges the statistics of data flows at the hardware layer
according to the aggregation criteria of the specific aggregation mode, and stores the NetStream
hardware aggregation data in the cache. When the timer for the hardware aggregation entry expires,
the data is exported. This greatly reduces the resource consumption by NetStream aggregation.
Without hardware aggregation configured, the NetStream data aggregation is implemented by
software.
To configure NetStream aggregation data export:
To do…
Use the command…
Remarks
1. Enter system view.
system-view
—
2. Enter Layer 2 Ethernet
interface view or Layer 3
Ethernet interface view.
interface interface-type
interface-number
—
3. Enable NetStream.
ip netstream { inbound |
outbound }
Required.
4. Exit to system view.
quit
—
5. Configure the NetStream
hardware aggregation.
ip netstream aggregation
advanced
Optional.
6. Set a NetStream aggregation
mode and enter its view.
ip netstream aggregation {
destination-prefix | prefix |
prefix-port | protocol-port |
source-prefix | tosdestination-prefix | tos-prefix
| tos-protocol-port | tossource-prefix }
203
Disabled by default.
Disabled by default.
Required.
To do…
Use the command…
Remarks
Required.
7. Configure the destination
address for the NetStream
aggregation data export.
ip netstream export host ipaddress udp-port [ vpninstance vpn-instance-name ]
By default, no destination address is
configured in NetStream aggregation
view. Its default destination address is
that configured in system view, if any.
If you expect to only export NetStream
aggregation data, configure the
destination address in related
aggregation view only.
Optional.
By default, the interface connecting to
the NetStream server is used as the
source interface.
• Source interfaces in different
8. Configure the source interface
for NetStream aggregation
data export.
ip netstream export source
interface interface-type
interface-number
aggregation views can be
different.
• If no source interface is configured
in aggregation view, the source
interface configured in system
view, if any, is used.
• HP recommends you connect the
network management interface to
the NetStream server.
9. Enable the current NetStream
aggregation configuration.
Required.
enable
Disabled by default.
NOTE:
• Configurations in NetStream aggregation view apply to aggregation data export only, and those in
system view apply to NetStream traditional data export. If configurations in NetStream aggregation
view are not provided, the configurations in system view apply to the aggregation data export.
• The aging of NetStream hardware aggregation entries is exactly the same as the aging of NetStream
traditional data entries.
• The NetStream hardware aggregation data export and NetStream traditional data export are
mutually exclusive. The hardware aggregation does not take effect if the destination address for
NetStream traditional data export is configured (ip netstream export host in system view).
Configuring attributes of NetStream export data
Configuring NetStream export format
The NetStream export format configures to export NetStream data in version 5 or version 9 formats, and
the data fields can be expanded to contain more information, such as the following information:
•
Statistics about source AS, destination AS, and peer ASs in version 5 or version 9 export format.
•
Statistics about BGP next hop in version 9 format only.
204
To configure the NetStream export format:
To do…
Use the command…
Remarks
1. Enter system view.
system-view
—
.ip netstream export version 5 [
origin-as | peer-as ]
Optional.
2. Configure the version
for NetStream export
format, and specify
whether to record AS
and BGP next hop
information
ip netstream export version 9 [
origin-as | peer-as ] [ bgp-nexthop
]
By default, NetStream traditional data
export uses version 5; MPLS flow data
is not exported; the peer AS numbers
are exported for the source and
destination; the BGP next hop is not
exported.
NOTE:
For more information about an AS, see Layer 3—IP Routing Configuration Guide.
A NetStream entry for a flow records the source IP address and destination IP address, each with two
AS numbers. The source AS from which the flow originates and the peer AS from which the flow travels
to the NetStream-enabled device are for the source IP address; the destination AS to which the flow is
destined and the peer AS to which the NetStream-enabled device passes the flow are for the destination
IP address.
To specify which AS numbers to be recorded for the source and destination IP addresses, include
keyword peer-as or origin-as. For example, as shown in Figure 74, a flow starts from AS 20, passes AS
21 through AS 23, and reaches AS 24. NetStream is enabled on the device in AS 22. If keyword peeras is provided, the command records AS 21 as the source AS, and AS 23 as the destination AS. If
keyword origin-as is provided, the command records AS 20 as the source AS and AS 24 as the
destination AS.
205
Figure 74 Recorded AS information varies with different keyword configuration
AS 20
AS 21
Enable NetStream
AS 22
Include peer-as in the command.
AS 21 is recorded as the source AS, and
AS 23 as the destination AS.
Include origin-as in the command.
AS 20 is recorded as the source AS and
AS 24 as the destination AS.
AS 23
AS 24
Configuring refresh rate for NetStream version 9 templates
Version 9 is template-based and supports user-defined formats, so the NetStream-enabled device needs
to resend a new template to the NetStream server for an update. If the version 9 format is changed on
the NetStream-enabled device and not updated on the NetStream server, the server is unable to
associate the received statistics with its proper fields. To avoid such situation, configure the refresh
frequency and rate for version 9 templates so that the NetStream server can refresh the templates on
time.
To configure the refresh rate for NetStream version 9 templates:
To do…
Use the command…
Remarks
1. Enter system view.
system-view
—
2. Configure the refresh frequency for
NetStream version 9 templates.
ip netstream export v9-template
refresh-rate packet packets
3. Configure the refresh interval for
NetStream version 9 templates.
ip netstream export v9-template
refresh-rate time minutes
Optional.
By default, the version 9
templates are sent every 20
packets.
Optional.
By default, the version 9
templates are sent every 30
minutes.
NOTE:
The refresh frequency and interval can be both configured, and the template is resent when either of
the condition is reached.
206
Configuring NetStream flow aging
Flow aging approaches
The following types of NetStream flow aging are available:
•
Periodical aging
•
Forced aging
•
TCP FIN- and RST-triggered aging (it is automatically triggered when a TCP connection is
terminated)
Periodical aging
Periodical aging uses the following approaches: inactive flow aging and active flow aging.
Inactive flow aging
•
A flow is considered inactive if its statistics have not been changed, that is, no packet for this NetStream
entry arrives in the time specified by the ip netstream timeout inactive command. The inactive flow entry
remains in the cache until the inactive timer expires. Then the inactive flow is aged out and its statistics,
which can no longer be displayed by the display ip netstream cache command, are sent to the
NetStream server. The inactive flow aging makes sure the cache is big enough for new flow entries.
Active flow aging
•
An active flow is aged out when the time specified by the ip netstream timeout active command is
reached, and its statistics are exported to the NetStream server. Because the flow is active, its entry still
remains in the cache, which can be displayed by the display ip netstream cache command. The active
flow aging is designed to export the statistics of active flows to the NetStream server.
Forced aging
The reset ip netstream statistics command ages out all NetStream entries in the cache and clears the
statistics.
TCP FIN- and RST-triggered aging
For a TCP connection, when a packet with a FIN or RST flag is sent out, it means that a session is
finished. When a packet with a FIN or RST flag is recorded for a flow with the NetStream entry already
created, the flow is aged out immediately. This type of aging is enabled by default, and cannot be
disabled.
Configuring NetStream flow aging
To do…
Use the command…
Remarks
1. Enter system view.
system-view
—
Set the aging timer for
active flows.
ip netstream timeout active
minutes
Optional.
Set the aging timer for
inactive flows.
ip netstream timeout
inactive seconds
2. Configure
periodical aging:
207
5 minutes by default.
Optional.
30 seconds by
default.
To do…
Use the command…
Remarks
Optional.
3. Configure forced aging of the NetStream
entries.
reset ip netstream statistics
This command also
clears the cache.
Displaying and maintaining NetStream
To do…
Use the command…
Remarks
Display the NetStream entry
information in the cache
display ip netstream cache [ verbose ] [ slot
slot-number ] [ | { begin | exclude | include
} regular-expression ]
Available in any view
Display information about
NetStream data export
display ip netstream export [ | { begin |
exclude | include } regular-expression ]
Available in any view
Display the configuration and
status of the NetStream flow
record templates
display ip netstream template [ slot slotnumber ] [ | { begin | exclude | include }
regular-expression ]
Available in any view
Clear the cache, age out and
export all NetStream data
reset ip netstream statistics
Available in user view
Configuring NetStream examples
Configuring NetStream traditional data export example
Network requirements
As shown in Figure 75, configure NetStream on Switch A to collect statistics on packets passing through
it. Configure the device to export NetStream traditional data to UDP port 5000 of the NetStream server
at 12.110.2.2/16.
Figure 75 Network diagram for configuring NetStream traditional data export
Configuration procedure
# Enable NetStream in the inbound direction of GigabitEthernet 1/0/1.
<SwitchA> system-view
[SwitchA] interface GigabitEthernet 1/0/1
[SwitchA-GigabitEthernet1/0/1] ip netstream inbound
[SwitchA-GigabitEthernet1/0/1] quit
# Create VLAN-interface 2000 and configure it as the source interface for NetStream common data
export.
[SwitchA] vlan 2000
208
[SwitchA] interface vlan-interface 2000
[SwitchA-Vlan-interface2000] ip address 12.110.2.1 255.255.0.0
[SwitchA-Vlan-interface2000] quit
[SwitchA] ip netstream export source interface vlan 2000
# Configure the destination host for the NetStream data export with the IP address being 12.110.2.2
and port number being 5000.
[SwitchA] ip netstream export host 12.110.2.2 5000
Configuring NetStream aggregation data export example
Network requirements
As shown in Figure 76, configure NetStream on Switch A so that:
•
Switch A exports NetStream traditional data in version 5 export format to port 5000 of the
NetStream server at 4.1.1.1/16.
•
Switch A performs NetStream aggregation in the modes of protocol-port, source-prefix, destinationprefix and prefix. Then aggregation data are sent in version 8 export format to the destination host
at 4.1.1.1, with port 3000, 4000, 6000, and 7000 for different modes.
NOTE:
All routers in the network are running EBGP. For more information about BGP, see Layer 3—IP Routing
Configuration Guide.
Figure 76 Network diagram for configuring NetStream aggregation data export
Configuration procedure
# Enable NetStream in both inbound and outbound directions of GigabitEthernet 1/0/1.
<SwitchA> system-view
[SwitchA] interface GigabitEthernet 1/0/1
[SwitchA-GigabitEthernet1/0/1] ip netstream inbound
[SwitchA-GigabitEthernet1/0/1] ip netstream outbound
[SwitchA-GigabitEthernet1/0/1] quit
# In system view, configure the destination host for the NetStream common data export with the IP
address being 4.1.1.1 and port number being 5000.
[SwitchA] ip netstream export host 4.1.1.1 5000
209
# Configure the aggregation mode as protocol-port, and in aggregation view configure the destination
host for the NetStream protocol-port aggregation data export.
[SwitchA] ip netstream aggregation protocol-port
[SwitchA-ns-aggregation-protport] enable
[SwitchA-ns-aggregation-protport] ip netstream export host 4.1.1.1 3000
[SwitchA-ns-aggregation-protport] quit
# Configure the aggregation mode as source-prefix, and in aggregation view configure the destination
host for the NetStream source-prefix aggregation data export.
[SwitchA] ip netstream aggregation source-prefix
[SwitchA-ns-aggregation-srcpre] enable
[SwitchA-ns-aggregation-srcpre] ip netstream export host 4.1.1.1 4000
[SwitchA-ns-aggregation-srcpre] quit
# Configure the aggregation mode as destination-prefix, and in aggregation view configure the
destination host for the NetStream destination-prefix aggregation data export.
[SwitchA] ip netstream aggregation destination-prefix
[SwitchA-ns-aggregation-dstpre] enable
[SwitchA-ns-aggregation-dstpre] ip netstream export host 4.1.1.1 6000
[SwitchA-ns-aggregation-dstpre] quit
# Configure the aggregation mode as prefix, and in aggregation view configure the destination host for
the NetStream prefix aggregation data export.
[SwitchA] ip netstream aggregation prefix
[SwitchA-ns-aggregation-prefix] enable
[SwitchA-ns-aggregation-prefix] ip netstream export host 4.1.1.1 7000
[SwitchA-ns-aggregation-prefix] quit
210
Configuring IPv6 NetStream
The A5820X switch series do not support IPv6 NetStream.
Legacy traffic statistics collection methods, like SNMP and port mirroring, cannot provide precise
network management because of inflexible statistical methods or high cost (dedicated servers are
required). This calls for a new technology to collect traffic statistics.
IPv6 NetStream provides statistics on network traffic flows and can be deployed on access, distribution,
and core layers.
The IPv6 NetStream technology implements the following features:
•
Accounting and billing—IPv6 NetStream provides fine-gained data about the network usage based
on the resources such as lines, bandwidth, and time periods. The ISPs can use the data for billing
based on time period, bandwidth usage, application usage, and QoS. The enterprise customers
can use this information for department chargeback or cost allocation.
•
Network planning—IPv6 NetStream data provides key information, for example the AS traffic
information, for optimizing the network design and planning. This helps maximize the network
performance and reliability when minimizing the network operation cost.
•
Network monitoring—Configured on the Internet interface, IPv6 NetStream allows for traffic and
bandwidth utilization monitoring in real time. Based on this, administrators can understand how the
network is used and where the bottleneck is, better planning the resource allocation.
•
User monitoring and analysis—The IPv6 NetStream data provides detailed information about
network applications and resources. This information helps network administrators efficiently plan
and allocate network resources, and ensure network security.
IPv6 NetStream basic concepts
What is an IPv6 flow
IPv6 NetStream is an accounting technology to provide statistics on a per-flow basis. An IPv6 flow is
defined by the 7-tuple elements: destination address, source IP address, destination port number, source
port number, protocol number, ToS, and inbound or outbound interface. The 7-tuple elements define a
unique flow.
How IPv6 NetStream works
A typical IPv6 NetStream system comprises three parts: NDE, NSC, and NDA.
•
NDE
The NDE analyzes traffic flows that pass through it, collects necessary data from the target flows, and
exports the data to the NSC. Before exporting data, the NDE may process the data like aggregation. A
device with IPv6 NetStream configured acts as an NDE.
•
NSC
The NSC is usually a program running in Unix or Windows. It parses the packets sent from the NDE,
stores the statistics to the database for the NDA. The NSC gathers the data from multiple NDEs.
211
•
NDA
The NDA is a network traffic analysis tool. It collects statistics from the NSC, and performs further
process, generates various types of reports for applications of traffic billing, network planning, and
attack detection and monitoring. Typically, the NDA features a Web-based system for users to easily
obtain, view, and gather the data.
Figure 77 IPv6 NetStream system
NDE
NSC
NDA
NDE
As shown in Figure 77, the following procedure of IPv6 NetStream data collection and analysis occurs:
1.
The NDE, that is the device configured with IPv6 NetStream, periodically delivers the collected
statistics to the NSC.
2.
The NSC processes the statistics, and then sends the results to the NDA.
3.
The NDA analyzes the statistics for accounting, network planning, and the like.
NOTE:
• This document focuses on the description and configuration of NDE.
• NSC and NDA are usually integrated into a NetStream server.
IPv6 NetStream key technologies
Flow aging
The flow aging in IPv6 NetStream is a means used by the NDE to export IPv6 NetStream data to the
NetStream server. IPv6 NetStream creates an IPv6 NetStream entry for each active flow in the cache of
the NDE and each entry stores the flow statistics, which will be later exported to the NetStream server.
When the timer of an entry expires, the NDE exports the summarized data to the NetStream server in a
specified IPv6 NetStream version export format.
IPv6 NetStream data export
IPv6 NetStream traditional data export
IPv6 NetStream collects statistics of each flow and, when the entry timer expires, exports the data of
each entry to the NetStream server.
Though the data includes statistics of each flow, this method consumes more bandwidth and CPU, and
requires large cache size. In most cases, not the whole statistics are necessary for analysis.
212
IPv6 NetStream aggregation data export
IPv6 NetStream aggregation merges the flow statistics according to the aggregation criteria of an
aggregation mode, and sends the summarized data to the NetStream server. This process is the IPv6
NetStream aggregation data export, which decreases the bandwidth usage compared to traditional
data export.
Table 7 lists the aggregation modes supported on the A5800.
Table 7 IPv6 NetStream aggregation modes
Aggregation mode
Aggregation criteria
Protocol-port aggregation
• Protocol number
• Source port
• Destination port
Source AS number
Source-prefix aggregation
•
•
•
•
•
•
•
•
Destination AS number
•
•
•
•
•
•
•
•
Source AS number
Destination-prefix aggregation
Prefix aggregation
Source address mask length
Source prefix
Inbound interface index
Destination address mask length
Destination prefix
Outbound interface index
Destination AS number
Source address mask length
Destination address mask length
Source prefix
Destination prefix
Inbound interface index
Outbound interface index
IPv6 NetStream export format
IPv6 NetStream exports data in UDP datagrams in version 9 format.
Version 9 format's template-based feature provides support of different statistics information.
IPv6 NetStream configuration task list
Before you configure IPv6 NetStream, determine the following proper configurations as needed.
•
Make sure on which device you want to enable IPv6 NetStream.
•
Configure the timer for NetStream flow aging.
•
To reduce the bandwidth consumption used by IPv6 NetStream data export, configure IPv6
NetStream aggregation.
213
Complete these tasks to configure IPv6 NetStream:
Task
Remarks
Enabling NetStream
Required
Configuring IPv6 NetStream data
export
Configuring IPv6 NetStream
traditional data export
Required
Select a command as required.
Configuring IPv6 NetStream
aggregation data export
Configuring attributes of IPv6 NetStream data export
Optional
Enabling NetStream
Enabling NetStream on an interface
To do…
Use the command…
Remarks
1. Enter system view.
system-view
—
2. Enter Layer 2 Ethernet
interface view or Layer 3
Ethernet interface view.
interface interface-type interface-number
—
3. Enable NetStream on the
interface.
ip netstream { inbound | outbound }
Required.
Disabled by default.
NOTE:
• NetStream can only be enabled on Layer 2 Ethernet interface or Layer 3 Ethernet interface of the
A5800.
• For more information about the ip netstream { inbound | outbound } command, see “NetStream
configuration commands.”
Configuring IPv6 NetStream data export
To allow the NDE to export collected statistics to the NetStream server, configure the source interface out
of which the data is sent and the destination address to which the data is sent.
Configuring IPv6 NetStream traditional data export
To do…
Use the command…
Remarks
1. Enter system view.
system-view
—
2. Enter Layer 2 Ethernet
interface view or Layer 3
Ethernet interface view.
interface interface-type interfacenumber
—
214
To do…
Use the command…
Remarks
3. Enable NetStream.
ip netstream { inbound |
outbound }
Required.
4. Exit to system view.
quit
—
5. Configure the destination
address for the IPv6
NetStream traditional
data export.
ipv6 netstream export host ipaddress udp-port [ vpn-instance
vpn-instance-name ]
Disabled by default.
Required.
By default, no destination address is
configured, in which case, the IPv6
NetStream traditional data is not
exported.
Optional.
• By default, the interface where the
6. Configure the source
interface for IPv6
NetStream traditional
data export.
ipv6 netstream export source
interface interface-type interfacenumber
7. Limit the data export rate.
ipv6 netstream export rate rate
NetStream data is sent out (the
interface connects to the
NetStream server) is used as the
source interface.
• HP recommends you connect the
network management interface to
the NetStream server and
configure it as the source
interface.
Optional.
No limit by default.
Configuring IPv6 NetStream aggregation data export
IPv6 NetStream aggregation can be implemented by software or hardware. The term of NetStream
aggregation refers to the implementation by software, unless otherwise noted.
The IPv6 NetStream hardware aggregation directly merges the statistics of data flows at the hardware
layer according to the aggregation criteria of the specific aggregation mode, and stores the IPv6
NetStream hardware aggregation data in the cache. When the timer for the hardware aggregation
entry expires, the data is exported. This greatly reduces the resource consumption by IPv6 NetStream
aggregation.
Without hardware aggregation configured, the IPv6 NetStream data aggregation is implemented by
software.
To configure IPv6 NetStream aggregation data export:
To do…
Use the command…
Remarks
1. Enter system view.
system-view
—
2. Enter Layer 2 Ethernet
interface view or Layer 3
Ethernet interface view.
interface interface-type
interface-number
—
3. Enable NetStream.
ip netstream { inbound |
outbound }
215
Required.
Disabled by default.
To do…
Use the command…
Remarks
4. Exit to system view.
quit
—
5. Configure the IPv6 NetStream
hardware aggregation.
ipv6 netstream aggregation
advanced
Optional.
6. Set an IPv6 NetStream
aggregation mode and enter
its view.
ipv6 netstream aggregation {
destination-prefix | prefix |
protocol-port | source-prefix }
Disabled by default.
Required.
Required.
7. Configure the destination
address for the IPv6
NetStream aggregation data
export.
ipv6 netstream export host ipaddress udp-port [ vpninstance vpn-instance-name ]
By default, no destination address is
configured in IPv6 NetStream
aggregation view. Its default
destination address is that configured
in system view, if any.
If you expect to only export IPv6
NetStream aggregation data,
configure the destination address in
related aggregation view only.
Optional.
By default, the interface connecting to
the NetStream server is used as the
source interface.
• Source interfaces in different
8. Configure the source interface
for IPv6 NetStream
aggregation data export.
ipv6 netstream export source
interface interface-type
interface-number
aggregation views can be
different.
• If no source interface is configured
in aggregation view, the source
interface configured in system
view, if any, is used.
• HP recommends you connect the
network management interface to
the NetStream server.
9. Enable the current IPv6
NetStream aggregation
configuration.
Required.
enable
Disabled by default.
NOTE:
• Configurations in IPv6 NetStream aggregation view apply to aggregation data export only, and
those in system view apply to traditional data export. If configurations in IPv6 NetStream aggregation
view are not provided, the configurations in system view apply to the aggregation data export.
• The aging of NetStream hardware aggregation entries is exactly the same as the aging of NetStream
traditional data entries.
• The IPv6 NetStream hardware aggregation data export and IPv6 NetStream traditional data export
are mutually exclusive. The hardware aggregation does not take effect if the destination address for
IPv6 NetStream traditional data export is configured (ipv6 netstream export host in system view).
216
Configuring attributes of IPv6 NetStream data
export
Configuring IPv6 NetStream export format
The IPv6 NetStream export format configures to export IPv6 NetStream data in version 9 formats, and
the data fields can be expanded to contain more information, such as the following information:
•
Statistics about source AS, destination AS, and peer ASs in version 9 format.
•
Statistics about BGP next hop in version 9 format.
To configure the IPv6 NetStream export format:
To do…
Use the command…
Remarks
1. Enter system view.
system-view
—
Optional.
2. Configure the version for
IPv6 NetStream export
format, and specify whether
to record AS and BGP next
hop information.
ipv6 netstream export version 9 [ originas | peer-as ] [ bgp-nexthop ]
By default, version 9 format
is used to export IPv6
NetStream traditional data,
IPv6 NetStream aggregation
data, and MPLS flow data
with IPv6 fields; the peer AS
numbers are recorded; the
BGP next hop is not
recorded.
Configuring refresh rate for IPv6 NetStream version 9 templates
Version 9 is template-based and supports user-defined formats, so the NetStream device needs to resend
the new template to the NetStream server for an update. If the version 9 format is changed on the
NetStream device and not updated on the NetStream server, the server is unable to associate the
received statistics with its proper fields. To avoid such situation, configure the refresh frequency and rate
for version 9 templates so that the NetStream server can refresh the templates on time.
To configure the refresh rate for IPv6 NetStream version 9 templates:
To do…
Use the command…
Remarks
1. Enter system view.
system-view
—
2. Configure the refresh frequency for
NetStream version 9 templates.
ipv6 netstream export v9template refresh-rate packet
packets
3. Configure the refresh interval for
NetStream version 9 templates.
ipv6 netstream export v9template refresh-rate time
minutes
217
Optional.
By default, the version 9
templates are sent every 20
packets.
Optional.
By default, the version 9
templates are sent every 30
minutes.
NOTE:
The refresh frequency and interval can be both configured, and the template is resent when either of
the condition is reached.
Displaying and maintaining IPv6 NetStream
To do…
Use the command…
Remarks
Display the IPv6 NetStream
entry information in the cache
display ipv6 netstream cache [ verbose ] [ slot
slot-number ] [ | { begin | exclude | include }
regular-expression ]
Available in any view
Display information about IPv6
NetStream data export
display ipv6 netstream export [ | { begin |
exclude | include } regular-expression ]
Available in any view
Display the configuration and
status of the NetStream flow
record templates
display ipv6 netstream template [ slot slotnumber ] [ | { begin | exclude | include }
regular-expression ]
Available in any view
Clear the cache, and age out
and export all IPv6 NetStream
data
reset ipv6 netstream statistics
Available in user view
Configuring IPv6 NetStream examples
Configuring IPv6 NetStream traditional data export example
Network requirements
As shown in Figure 78, configure IPv6 NetStream on Switch A to collect statistics on packets passing
through it. Configure the device to export IPv6 NetStream traditional data to UDP port 5000 of the
NetStream server at 12.110.2.2/16.
Figure 78 Network diagram for configuring IPv6 NetStream traditional data export
Configuration procedure
# Enable IPv6 NetStream in its inbound direction of GigabitEthernet 1/0/1.
<SwitchA> system-view
[SwitchA] ipv6
[SwitchA] interface GigabitEthernet 1/0/1
[SwitchA-GigabitEthernet1/0/1] ip netstream inbound
[SwitchA-GigabitEthernet1/0/1] quit
# Create VLAN 2000 and assign IP address 12.110.2.1 to VLAN-interface 2000.
[SwitchA] vlan 2000
218
[SwitchA-vlan2000] quit
[SwitchA] interface vlan-interface 2000
[SwitchA-Vlan-interface2000] ip address 12.110.2.1 255.255.0.0
[SwitchA-Vlan-interface2000] quit
# Configure the destination IP address and port number for IPv6 NetStream data export as 12.110.2.2
and 5000.
[SwitchA] ipv6 netstream export host 12.110.2.2 5000
Configuring IPv6 NetStream aggregation data export example
Network requirements
As shown in Figure 79, configure IPv6 NetStream on Switch A so that:
•
Switch A exports IPv6 NetStream traditional data to port 5000 of the NetStream server at
4.1.1.1/16.
•
Switch A performs IPv6 NetStream aggregation in the modes of protocol-port, source-prefix,
destination-prefix and prefix. Then aggregation data is sent to the destination address with UDP
port 3000, 4000, 6000, and 7000 for different modes.
NOTE:
All routers in the network are running IPv6 EBGP. For more information about IPv6 BGP, see Layer 3—
IP Routing Configuration Guide.
Figure 79 Network diagram for configuring IPv6 NetStream aggregation data export
Switch A
AS 100
IPv6 Network
GE1/0/1
IPv6 Network
NetStream Server
4.1.1.1/16
Configuration procedure
# Enable NetStream in both the inbound and outbound directions of GigabitEthernet 1/0/1.
<SwitchA> system-view
[SwitchA] interface GigabitEthernet 1/0/1
[SwitchA-GigabitEthernet1/0/1] ip netstream inbound
[SwitchA-GigabitEthernet1/0/1] ip netstream outbound
[SwitchA-GigabitEthernet1/0/1] quit
# Configure the destination address and destination port for IPv6 NetStream common data export.
[SwitchA] ipv6 netstream export host 4.1.1.1 5000
# Configure the aggregation mode as protocol-port, and in aggregation view configure the destination
host for the IPv6 NetStream protocol-port aggregation data export.
219
[SwitchA] ipv6 netstream aggregation protocol-port
[SwitchA-ns6-aggregation-protport] ipv6 netstream export host 4.1.1.1 3000
[SwitchA-ns6-aggregation-protport] enable
[SwitchA-ns6-aggregation-protport] quit
# Configure the aggregation mode as source-prefix, and in aggregation view configure the destination
host for the IPv6 NetStream source-prefix aggregation data export.
[SwitchA] ipv6 netstream aggregation source-prefix
[SwitchA-ns6-aggregation-srcpre] ipv6 netstream export host 4.1.1.1 4000
[SwitchA-ns6-aggregation-srcpre] enable
[SwitchA-ns6-aggregation-srcpre] quit
# Configure the aggregation mode as destination-prefix, and in aggregation view configure the
destination host for the IPv6 NetStream destination-prefix aggregation data export.
[SwitchA] ipv6 netstream aggregation destination-prefix
[SwitchA-ns6-aggregation-dstpre] ipv6 netstream export host 4.1.1.1 6000
[SwitchA-ns6-aggregation-dstpre] enable
[SwitchA-ns6-aggregation-dstpre] quit
# Configure the aggregation mode as prefix, and in aggregation view configure the destination host for
the IPv6 NetStream prefix aggregation data export.
[SwitchA] ipv6 netstream aggregation prefix
[SwitchA-ns6-aggregation-prefix] ipv6 netstream export host 4.1.1.1 7000
[SwitchA-ns6-aggregation-prefix] enable
[SwitchA-ns6-aggregation-prefix] quit
220
Configuring sFlow
The Layer 3 Ethernet interface operates in route mode, For more information about the operating mode
of the Ethernet interface, see Layer 2—LAN Switching Configuration Guide.
sFlow is a traffic monitoring technology mainly used to collect and analyze traffic statistics. As shown in
Figure 80, the sFlow system involves an sFlow agent embedded in a device and a remote sFlow
collector. The sFlow agent collects traffic statistics and packet information from the sFlow-enabled
interfaces on the device, encapsulates them into sFlow packets. When an sFlow packet buffer overflows,
or an sFlow packet ages out (the aging time is one second), the sFlow agent sends the packet to a
specified sFlow collector. The sFlow collector analyzes the sFlow packets and displays the results.
sFlow has the following sampling mechanisms:
•
Flow sampling: Packet-based sampling, used to obtain packet content information.
•
Counter sampling: Time-based sampling, used to obtain port traffic statistics.
Figure 80 sFlow system
As a traffic monitoring technology, sFlow has the following advantages:
•
Supporting traffic monitoring on Gigabit and higher-speed networks.
•
Providing good scalability to allow one sFlow collector to monitor multiple sFlow agents.
•
Saving cost by embedding the sFlow agent in a device, instead of using a dedicated sFlow agent
device.
NOTE:
Only the sFlow agent function is supported on the switch.
sFlow operation
sFlow operates in the following ways:
1.
Before enabling the sFlow function, configure the sFlow agent and sFlow collector on the switch.
For more information, see “Configuring the sFlow agent and sFlow collector.”
2.
With flow sampling enabled on an Ethernet interface, the sFlow agent samples packets and
encapsulates them into sFlow packets. For more information, see “Configuring flow sampling.”
221
3.
With counter sampling enabled on an Ethernet interface, the sFlow agent periodically collects the
statistics of the interface and encapsulates the statistics into sFlow packets. For more information,
see “Configuring counter sampling.”
Configuring sFlow
Complete the following tasks before sFlow can operate normally:
•
Configuring the IP address, flow sampling, and counter sampling of the sFlow collector on the
switch.
•
Configuring the sFlow collector.
Configuring the sFlow agent and sFlow collector
The sFlow feature enables the remote sFlow collector to monitor the network and analyze sFlow packet
statistics.
To configure the sFlow agent and sFlow collector:
To do…
Use the command…
Remarks
1. Enter system view.
system-view
—
Optional.
2. Specify the IP address
for the sFlow agent.
sflow agent { ip ip-address | ipv6
ipv6-address }
Not specified by default. The switch
periodically checks the existence of the
sFlow agent address. If the sFlow agent
has no IP address configured, the switch
automatically selects an interface IP
address for the sFlow agent but does not
save the selected IP address.
• HP recommends configuring an IP
address manually for the sFlow
agent.
• Only one IP address can be
specified for the sFlow agent on the
switch.
Required.
3. Configure the sFlow
collector.
sflow collector collector-id { { ip ipaddress | ipv6 ipv6-address } |
datagram-size size | description
text | port port-number | time-out
seconds } *
By default, the switch presets a number
of sFlow collectors.
Use the display sflow command to
display the parameters of the preset
sFlow collectors.
Support for the number of preset sFlow
collectors depends on the device model.
222
Configuring flow sampling
To do…
Use the command…
Remarks
1. Enter system view.
system-view
—
2. Enter Layer 2 or Layer 3
Ethernet interface view.
interface interface-type interfacenumber
—
Optional.
3. Set the Flow sampling mode.
4. Specify the number of packets
out of which the interface will
sample a packet.
sflow sampling-mode { determine
| random }
random by default.
The determine mode is not
supported on the switch.
Required.
sflow sampling-rate rate
By default, no sampling rate is
specified.
Optional.
5. Set the maximum copied
length of a sampled packet.
6. Specify the sFlow collector for
flow sampling.
sflow flow max-header length
By default, up to 128 bytes of a
sampled packet can be copied.
HP recommends using the default
value.
Required.
sflow flow collector collector-id
No collector is specified for flow
sampling by default.
Configuring counter sampling
To do…
Use the command…
Remarks
1. Enter system view.
system-view
—
2. Enter layer 2 or layer 3
Ethernet interface view.
interface interface-type interfacenumber
—
Required.
3. Set the interval for counter
sampling.
sflow counter interval seconds
4. Specify the sFlow collector for
counter sampling.
sflow counter collector collector-id
Counter sampling is disabled by
default.
Required.
No collector is specified for
counter sampling by default.
Displaying and maintaining sFlow
To do…
Use the command…
Remarks
Display sFlow configuration information
display sflow [ slot slot-number ] [ | {
begin | exclude | include } regularexpression ]
Available in any view
223
Configuring sFlow example
Network requirements
As shown in Figure 81, Host A is connected with Server through Switch (sFlow agent).
Enable sFlow (including flow sampling and counter sampling) on GigabitEthernet 1/0/1 to monitor
traffic on the port. The Switch sends sFlow packets through GigabitEthernet 1/0/3 to the sFlow collector,
which analyzes the sFlow packets and displays results.
Figure 81 Network diagram for sFlow configuration
Configuration procedure
1.
Configure the sFlow agent and sFlow collector
# Configure the IP address of Vlan-interface 1 on Switch as 3.3.3.1/16.
<Switch> system-view
[Switch] interface vlan-interface 1
[Switch-Vlan-interface1] ip address 3.3.3.1 16
[Switch-Vlan-interface1] quit
# Specify the IP address for the sFlow agent.
[Switch] sflow agent ip 3.3.3.1
# Specify sFlow collector ID 2, IP address 3.3.3.2, the default port number, and description of netserver
for the sFlow collector.
[Switch] sflow collector 2 ip 3.3.3.2 description netserver
2.
Configure counter sampling
# Set the counter sampling interval to 120 seconds.
[Switch] interface gigabitethernet 1/0/1
[Switch-GigabitEthernet1/0/1] sflow counter interval 120
# Specify sFlow collector 2 for counter sampling.
[Switch-GigabitEthernet1/0/1] sflow counter collector 2
3.
Configure flow sampling
# Set the Flow sampling mode and sampling rate.
[Switch-GigabitEthernet1/0/1] sflow sampling-mode random
[Switch-GigabitEthernet1/0/1] sflow sampling-rate 4000
# Specify sFlow collector for flow sampling.
[Switch-GigabitEthernet1/0/1] sflow flow collector 2
224
# Display the sFlow configuration and operation information.
[Switch-GigabitEthernet1/0/1] display sflow
sFlow Version: 5
sFlow Global Information:
Agent
IP:3.3.3.1
Collector Information:
ID
IP
1
2
3.3.3.2
Port
Aging
Size
6343
0
1400
6543
N/A
1400
3
6343
0
1400
4
6343
0
1400
5
6343
0
1400
6
6343
0
1400
7
6343
0
1400
8
6343
0
1400
9
6343
0
1400
10
6343
0
1400
Description
netserver
sFlow Port Information:
Interface CID
GE1/0/1
2
Interval(s) FID
120
2
MaxHLen
Rate
Mode
Status
128
4000
Random
Active
The output shows that GigabitEthernet 1/0/1 enabled with sFlow is active, the counter sampling interval
is 120s, the packet sampling rate is 4000, and that means the sFlow operates normally.
Troubleshooting sFlow configuration
The remote sFlow collector cannot receive sFlow packets
Symptom
The remote sFlow collector cannot receive sFlow packets.
Analysis
•
The sFlow collector has no IP address specified.
•
No interface is enabled with sFlow to sample data.
•
The IP address of the sFlow collector specified on the sFlow agent is different from that of the
remote sFlow collector.
•
No IP address is configured for the Layer 3 interface on the switch, or the IP address is configured,
but the UDP packets with the IP address being the source cannot reach the sFlow collector.
•
The physical link between the switch and the sFlow collector fails.
1.
Check whether sFlow is correctly configured by displaying sFlow configuration with the display
sflow command.
2.
Check whether the correct IP address is configured for the switch to communicate with the sFlow
collector.
3.
Check whether the physical link between the switch and the sFlow collector is normal.
Solution
225
Configuring information center
Acting as the system information hub, information center classifies and manages system information,
offering a powerful support for network administrators and developers in monitoring network
performance and diagnosing network problems.
The following describes the working process of information center:
•
Receives the log, trap, and debugging information generated by each module.
•
Outputs the information to different information channels according to the user-defined output
rules.
•
Outputs the information to different destinations based on the information channel-to-destination
associations.
To sum up, information center assigns the log, trap and debugging information to the 10 information
channels according to the eight severity levels and then outputs the information to different
destinations. The following describes the working process in details.
Figure 82 Information center diagram (default)
226
NOTE:
By default, the information center is enabled. An enabled information center affects the system
performance in some degree due to information classification and output. Such impact becomes more
obvious in the event that there is enormous information waiting for processing.
System information types
The system information of the information center falls into the following types:
•
Log information
•
Trap information
•
Debugging information
Eight levels of system information
The information is classified into eight levels by severity. The severity levels in the descending order
are emergency, alert, critical, error, warning, notice, informational and debug. When the system
information is output by level, the information with severity level higher than or equal to the specified
level is output. For example, in the output rule, if you configure the device to output information with
severity level being informational, the information with severity level being emergency through
informational will be output.
Table 8 Severity description
Severity
Severity value
Description
Corresponding keyword
in commands
Emergency
0
The system is unusable.
emergencies
Alert
1
Action must be taken immediately
alerts
Critical
2
Critical conditions
critical
Error
3
Error conditions
errors
Warning
4
Warning conditions
warnings
Notice
5
Normal but significant condition
notifications
Informational
6
Informational messages
informational
Debug
7
Debug-level messages
debugging
Output destinations and channels of system information
The system supports ten channels. The channels 0 through 6 are configured with channel names,
output rules, and are associated with output destinations by default. The channel names, output rules
and the associations between the channels and output destinations can be changed through
commands. Besides, you can configure channels 7, 8, and 9 without changing the default
configuration of channels 0 through 6.
227
Table 9 Information channels and output destinations
Information
channel
number
Default
channel name
Default output destination
Description
0
console
Console
Receives log, trap and debugging
information.
1
monitor
Monitor terminal
Receives log, trap and debugging
information, facilitating remote
maintenance.
2
loghost
Log host
Receives log, trap and debugging
information and information will be
stored in files for future retrieval.
3
trapbuffer
Trap buffer
Receives trap information, a buffer
inside the device for recording
information.
4
logbuffer
Log buffer
Receives log and debugging
information, a buffer inside the
device for recording information.
5
snmpagent
SNMP module
Receives trap information.
6
channel6
Web interface
Receives log information.
7
channel7
Not specified
Receives log, trap, and debugging
information.
8
channel8
Not specified
Receives log, trap, and debugging
information.
9
channel9
Log file
Receives log, trap, and debugging
information.
Outputting system information by source module
The system is composed of a variety of protocol modules, and configuration modules. The system
information can be classified, filtered, and output according to source modules. You can use the
info-center source ? command to view the supported information source modules.
Default output rules of system information
The default output rules define the source modules allowed to output information on each output
destination, the output information type, and the output information level as shown in Table 10,
which indicates that by default and in terms of all modules:
•
All log information is allowed to be output to the web interface and log file; log information
with severity level equal to or higher than informational is allowed to be output to the log host;
log information with severity level equal to or higher than informational is allowed to be output
to the console, monitor terminal, and log buffer; log information is not allowed to be output to
the trap buffer and the SNMP module.
•
All trap information is allowed to be output to the console, monitor terminal, log host, web
interface, and log file; trap information with severity level equal to or higher than informational
228
is allowed to be output to the trap buffer and SNMP module; trap information is not allowed to
be output to the log buffer.
All debugging information is allowed to be output to the console and monitor terminal;
debugging information is not allowed to be output to the log host, trap buffer, log buffer, the
SNMP module, web interface, and log file.
•
Table 10 Default output rules for different output destinations
Output
destination
Modules
allowed
Console
LOG
TRAP
DEBUG
Enabled/
disabled
Severity
Enabled/
disabled
Severity
Enabled/
disabled
Severity
default (all
modules)
Enabled
Informatio
nal
Enabled
Debug
Enabled
Debug
Monitor
terminal
default (all
modules)
Enabled
Informatio
nal
Enabled
Debug
Enabled
Debug
Log host
default (all
modules)
Enabled
Informatio
nal
Enabled
Debug
Disabled
Debug
Trap buffer
default (all
modules)
Disabled
Informatio
nal
Enabled
Informati
onal
Disabled
Debug
Log buffer
default (all
modules)
Enabled
Informatio
nal
Disabled
Debug
Disabled
Debug
SNMP
module
default (all
modules)
Disabled
Debug
Enabled
Informati
onal
Disabled
Debug
Web
interface
default (all
modules)
Enabled
Debug
Enabled
Debug
Disabled
Debug
Log file
default (all
modules)
Enabled
Debug
Enabled
Debug
Disabled
Debug
System information format
The format of system information varies with the output destinations.
1.
If the output destination is not the log host (such as console, monitor terminal, logbuffer,
trapbuffer, SNMP, or log file), the system information is in the following format:
timestamp sysname module/level/digest:content
For example, a monitor terminal connects to the device. When a terminal logs in to the device, the
log information in the following format is displayed on the monitor terminal:
%Jun 26 17:08:35:809 2008 Sysname SHELL/4/LOGIN: VTY login from 1.1.1.1
2.
If the output destination is the log host, the system information is in the following formats: HP
and UNICOM.
•
HP format
<PRI>timestamp sysname %%vvmodule/level/digest: source content
For example, if a log host is connected to the device, when a terminal logs in to the device, the
following log information is displayed on the log host:
<189>Oct 9 14:59:04
192.168.1.21.
2009
MyDevice
%%10SHELL/5/SHELL_LOGIN(l):VTY
229
logged
in
from
UNICOM format
•
<PRI>timestamp sysname vvmodule/level/serial_number: content
NOTE:
• The closing set of angel brackets < >, the space, the forward slash /, and the colon are all required
in the UNICOM format.
• The format in the previous part is the original format of system information, so you may see the
information in a different format. The displayed format depends on the log resolution tools you use.
What follows is a detailed explanation of the fields involved:
PRI (priority)
The priority is calculated using the following formula: facility*8+severity, in which facility represents
the logging facility name and can be configured when you set the log host parameters. The facility
ranges from local0 to local7—16 to 23 in decimal integers—and defaults to local7. The facility
marks different log sources on the log host, queries and filters the logs of the corresponding log
source. Severity ranges from 0 to 7. Table 8 details the value and meaning associated with each
severity.
The priority field only takes effect when the information has been sent to the log host.
timestamp
Times tamp records the time when system information is generated to allow users to check and
identify system events. The time stamp of the system information sent from the information center to
the log host is with a precision of milliseconds. The time stamp format of the system information sent
to the log host is configured with the info-center timestamp loghost command, and that of the system
information sent to the other destinations is configured with the info-center timestamp command.
Table 11 Description on the time stamp parameters
Time stamp
parameter
boot
Description
Example
System up time (the duration for this
operation of the device), in the format of
xxxxxx.yyyyyy. xxxxxx represents the higher
32 bits, and yyyyyy represents the lower 32
bits.
%0.16406399 Sysname
IFNET/3/LINK_UPDOWN:
GigabitEthernet1/0/6 link status is
DOWN.
System information sent to all destinations
except log host supports this parameter.
date
Current date and time of the system, in the
format of Mmm dd hh:mm:ss:sss yyyy.
System information sent to all destinations
supports this parameter.
Time stamp format stipulated in ISO 8601
iso
Only the system information sent to a log
host supports this parameter.
230
0.16406399 is a time stamp in the boot
format.
%Aug 19 16:11:03:288 2009 Sysname
IFNET/3/LINK_UPDOWN:
GigabitEthernet1/0/6 link status is UP.
Aug 19 16:11:03:288 2009 is a time
stamp in the date format.
<187>2009-09-21T15:32:55 Sysname
%%10 IFNET/3/LINK_UPDOWN(l):
GigabitEthernet1/0/6 link status is
DOWN.
2009-09-21T15:32:55 is a time stamp in
the iso format.
Time stamp
parameter
Description
Example
No time stamp is included.
none
no-year-date
System information sent to all destinations
supports this parameter.
Current date and time of the system, with
year information excluded.
Only the system information sent to a log
host supports this parameter.
% Sysname IFNET/3/LINK_UPDOWN:
GigabitEthernet1/0/6 link status is
DOWN.
No time stamp is included.
<187>Aug 19 16:120:38 Sysname
%%10 IFNET/3/LINK_UPDOWN(l):
GigabitEthernet1/0/6 link status is
DOWN.
Aug 19 16:120:38 is a time stamp in the
no-year-date format.
Sysname (host name or host IP address)
•
If the system information is sent to a log host in the format of UNICOM, and the info-center
loghost source command is configured, or vpn-instance vpn-instance-name is provided in the
info-center loghost command, the field is displayed as the IP address of the device that
generates the system information.
•
In other cases (when the system information is sent to a log host in the format of HP, or sent to
other destinations), the field is displayed as the name of the device that generates the system
name of the device. You can use the sysname command to modify the system name. For more
information, see Device management commands in the Fundamentals Command Reference.
%% (vendor ID)
This field indicates that the information is generated by an HP device. It is only displayed when the
system information is sent to a log host in the format of HP.
vv
This field is a version identifier of syslog, with a value of 10. It is only displayed when the output
destination is log host.
module
The module field represents the name of the module that generates system information. You can enter
the info-center source ? command in system view to view the module list.
level (severity)
System information can be divided into eight levels based on its severity, from 0 to 7. See Table 8
for definition and description of these severity levels. The levels of system information generated by
modules are predefined by developers, and you cannot change the system information levels.
However, with the info-center source command, you can configure the device to output information
of the specified level and not to output information lower than the specified level.
digest
The digest field is a string of up to 32 characters, outlining the system information.
For system information destined to the log host, the following rules apply:
•
If the character string ends with (l), the information is log information
•
If the character string ends with (t), the information is trap information
•
If the character string ends with (d), the information is debugging information
231
For system information destined to other destinations, the following rules apply:
•
If the time stamp starts with a %, the information is log information
•
If the time stamp starts with a #, the information is trap information
•
If the time stamp starts with a *, the information is debugging information
serial number
This field indicates the serial number of the device that generates the system information. It is only
displayed when the system information is sent to a log host in the format of UNICOM.
source
This field indicates the source of the information, such as the slot number of a board, IRF member ID,
IRF member ID and slot number, or the source IP address of the log sender. This field is optional and
is only displayed when the system information is sent to a log host in the format of HP.
content
This field provides the content of the system information.
Configuring information center
Information center configuration task list
Complete the following tasks to configure information center:
Task
Remarks
Outputting system information to the console
Optional
Outputting system information to a monitor terminal
Optional
Outputting system information to a log host
Optional
Outputting system information to the trap buffer
Optional
Outputting system information to the log buffer
Optional
Outputting system information to the SNMP module
Optional
Outputting system information to the web interface
Optional
Saving system information to a log file
Optional
Saving security logs into the security log file
Optional
Configuring synchronous information output
Optional
Disabling a port from generating link up/down logging information
Optional
232
Outputting system information to the console
Outputting system information to the console
To do…
Use the command…
Remarks
1. Enter system view.
system-view
—
2. Enable information center.
info-center enable
3. Name the channel with a
specified channel number.
info-center channel channelnumber name channel-name
Optional.
Enabled by default.
Optional.
See Table 9 for default channel
names.
Optional.
4. Configure the channel
through which system
information can be output to
the console.
info-center console channel {
channel-number | channel-name }
5. Configure the output rules of
system information.
info-center source { module-name
| default } channel { channelnumber | channel-name } [ debug
{ level severity | state state } * |
log { level severity | state state } *
| trap { level severity | state state
}*]*
6. Configure the format of the
time stamp.
info-center timestamp { debugging
| log | trap } { boot | date |
none }
By default, system information is
output to the console through
channel 0 (console).
Optional.
See “Default output rules of
system information.”
Optional.
The time stamp format for log,
trap and debugging information
is date by default.
Enabling the display of system information on the console
After setting to output system information to the console, you must enable the associated display
function to display the output information on the console.
Follow these steps in user view to enable the display of system information on the console:
To do…
Use the command…
Remarks
Optional.
1. Enable the monitoring of
system information on the
console.
terminal monitor
2. Enable the display of
debugging information on the
console.
terminal debugging
3. Enable the display of log
information on the console.
terminal logging
4. Enable the display of trap
information on the console.
terminal trapping
233
Enabled on the console and
disabled on the monitor terminal
by default.
Required.
Disabled by default.
Optional.
Enabled by default.
Optional.
Enabled by default.
Outputting system information to a monitor terminal
System information can also be output to a monitor terminal, which is a user terminal that has login
connections through the VTY user interface.
Outputting system information to a monitor terminal
To do…
Use the command…
Remarks
1. Enter system view.
system-view
—
2. Enable information center.
info-center enable
3. Name the channel with a
specified channel number.
info-center channel channelnumber name channel-name
Optional.
Enabled by default.
Optional.
See Table 9 for default channel
names.
Optional.
4. Configure the channel
through which system
information can be output to a
monitor terminal.
info-center monitor channel {
channel-number | channel-name }
5. Configure the output rules of
the system information.
info-center source { module-name
| default } channel { channelnumber | channel-name } [ debug
{ level severity | state state } * |
log { level severity | state state } *
| trap { level severity | state state
}*]*
6. Configure the format of the
time stamp.
info-center timestamp { debugging
| log | trap } { boot | date |
none }
By default, system information is
output to the monitor terminal
through channel 1 (monitor).
Optional.
See “Default output rules of
system information.”
Optional.
By default, the time stamp format
for log, trap and debugging
information is date.
Enabling the display of system information on a monitor terminal
After setting to output system information to a monitor terminal, you must enable the associated
display function in order to display the output information on the monitor terminal.
To enable the display of system information on a monitor terminal:
To do…
Use the command…
Remarks
Required.
1. Enable the monitoring of
system information on a
monitor terminal.
terminal monitor
2. Enable the display of
debugging information on a
monitor terminal.
terminal debugging
3. Enable the display of log
information on a monitor
terminal.
terminal logging
234
Enabled on the console and
disabled on the monitor terminal
by default.
Required.
Disabled by default.
Optional.
Enabled by default.
To do…
Use the command…
4. Enable the display of trap
information on a monitor
terminal.
terminal trapping
Remarks
Optional.
Enabled by default.
Outputting system information to a log host
To do…
Use the command…
Remarks
1. Enter system view.
system-view
—
2. Enable information center.
info-center enable
3. Name the channel with a
specified channel number.
info-center channel channelnumber name channel-name
4. Configure the output rules of
the system information.
info-center source { module-name
| default } channel { channelnumber | channel-name } [ debug
{ level severity | state state } * |
log { level severity | state state } *
| trap { level severity | state state
}*]*
Optional.
Enabled by default.
Optional.
See Table 9 for default channel
names.
Optional.
See “Default output rules of
system information.”
Optional.
5. Specify the source IP address
for the log information.
info-center loghost source
interface-type interface-number
6. Configure the format of the
time stamp for system
information output to the log
host.
info-center timestamp loghost {
date | iso | no-year-date | none
}
7. Set the format of the system
information sent to a log host
to UNICOM.
info-center format unicom
By default, the source interface is
determined by the matched route,
and the primary IP address of this
interface is the source IP address
of the log information.
Optional.
date by default.
Optional.
HP by default.
Required
8. Specify a log host and
configure the related output
parameters.
info-center loghost { ipv6 hostipv6-address | [ vpn-instance vpninstance-name ] host-ipv4-address
} [ port port-number ] [ channel {
channel-number | channel-name }
| facility local-number ] *
235
By default, the system does not
output information to a log host. If
you specify to output system
information to a log host, the
system uses channel 2 (loghost)
by default.
The value of the port-number
argument should be the same as
the value configured on the log
host, otherwise, the log host
cannot receive system
information.
Outputting system information to the trap buffer
NOTE:
The trap buffer only receives the trap information, and discards the log and debugging information
even if you have configured to output them to the trap buffer.
To do…
Use the command…
Remarks
1. Enter system view.
system-view
—
2. Enable information center.
info-center enable
3. Name the channel with a
specified channel number.
info-center channel channelnumber name channel-name
Optional.
Enabled by default.
Optional.
See Table 9 for default channel
names.
Optional.
4. Configure the channel
through which system
information can be output to
the trap buffer and specify the
buffer size.
info-center trapbuffer [ channel {
channel-number | channel-name }
| size buffersize ] *
5. Configure the output rules of
the system information.
info-center source { module-name
| default } channel { channelnumber | channel-name } [ debug
{ level severity | state state } * |
log { level severity | state state } *
| trap { level severity | state state
}*]*
6. Configure the format of the
time stamp.
info-center timestamp { debugging
| log | trap } { boot | date |
none }
By default, system information is
output to the trap buffer through
channel 3 (trapbuffer) and the
default buffer size is 256.
Optional.
See “Default output rules of
system information.”
Optional.
The time stamp format for log,
trap and debugging information
is date by default.
Outputting system information to the log buffer
You can configure the device to output log, trap, and debugging information to the log buffer, but
the log buffer only receives the log and debugging information, and discards the trap information.
To do…
Use the command…
Remarks
1. Enter system view.
system-view
—
2. Enable information center.
info-center enable
3. Name the channel with a
specified channel number.
info-center channel channelnumber name channel-name
236
Optional.
Enabled by default.
Optional.
See Table 9 for default channel
names.
To do…
Use the command…
4. Configure the channel
through which system
information can be output to
the log buffer and specify the
buffer size.
info-center logbuffer [ channel {
channel-number | channel-name }
| size buffersize ] *
5. Configure the output rules of
the system information.
info-center source { module-name
| default } channel { channelnumber | channel-name } [ debug
{ level severity | state state } * |
log { level severity | state state } *
| trap { level severity | state state
}*]*
6. Configure the format of the
time stamp.
info-center timestamp { debugging
| log | trap } { boot | date |
none }
Remarks
Optional.
By default, system information is
output to the log buffer through
channel 4 (logbuffer) and the
default buffer size is 512.
Optional.
See “Default output rules of
system information.”
Optional.
The time stamp format for log,
trap and debugging information
is date by default.
Outputting system information to the SNMP module
The SNMP module only receives the trap information, and discards the log and debugging
information even if you have configured to output them to the SNMP module. To monitor the device
running status, trap information is usually sent to the SNMP NMS. You must configure the device to
send traps to the SNMP module, and then set the trap sending parameters for the SNMP module to
further process traps. For more information, see “Configuring SNMP.”
To configure the device to output system information to the SNMP module:
To do…
Use the command…
Remarks
1. Enter system view.
system-view
—
2. Enable information center.
info-center enable
3. Name the channel with a
specified channel number.
info-center channel channelnumber name channel-name
4. Configure the channel
through which system
information can be output to
the SNMP module.
info-center snmp channel {
channel-number | channel-name }
5. Configure the output rules of
the system information.
info-center source { module-name
| default } channel { channelnumber | channel-name } [ debug
{ level severity | state state } * |
log { level severity | state state } *
| trap { level severity | state state
}*]*
Optional.
Enabled by default.
Optional.
See Table 9 for default channel
names.
Optional.
237
By default, system information is
output to the SNMP module
through channel 5 (snmpagent).
Optional.
See “Default output rules of
system information.”
To do…
Use the command…
6. Configure the format of the
time stamp.
info-center timestamp { debugging
| log | trap } { boot | date |
none }
Remarks
Optional.
The time stamp format for log,
trap and debugging information
is date by default.
Outputting system information to the web interface
This feature allows you to control whether to output system information to the web interface and
which system information can be output to the web interface. The web interface provides abundant
search and sorting functions. If you configure the device to output the system information to the web
interface, view system information by clicking corresponding tabs after logging in to the device
through the web interface.
To set to output system information to the web interface:
To do…
Use the command…
Remarks
1. Enter system view.
system-view
—
2. Enable information center.
info-center enable
3. Name the channel with a
specified channel number.
info-center channel channelnumber name channel-name
Optional.
Enabled by default.
Optional.
See Table 9 for default channel
names.
Optional.
4. Configure the channel
through which system
information can be output to
the web interface.
info-center syslog channel {
channel-number | channel-name }
5. Configure the output rules of
the system information.
info-center source { module-name
| default } channel { channelnumber | channel-name } [ debug
{ level severity | state state }* |
log { level severity | state state }*
| trap { level severity | state state
}* ]*
6. Configure the format of the
time stamp.
info-center timestamp { debugging
| log | trap } { boot | date |
none }
By default, system information is
output to the web interface
through channel 6.
Optional.
See “Default output rules of
system information.”
Optional.
The time stamp format for log,
trap and debugging information
is date by default.
NOTE:
You can configure the device to output log, trap and debugging information to a channel. However,
when this channel is bound with the output destination web interface, after logging in through the web
interface, view log information of specific types only, and other types of information will be filtered out.
238
Saving system information to a log file
With the log file feature enabled, the log information generated by system can be saved to a
specified directory with a predefined frequency. This allows you to check the operation history at
any time to make sure that the device functions properly.
Logs are saved into the log file buffer before they are saved into a log file. The system writes the logs
in the log file buffer into the log file at a specified frequency, which is usually set to 24 hours and
during a relatively free time, in mornings for example. You can also manually save the logs. After the
logs in the log file buffer are saved into the log file successfully, the system clears the log file buffer.
A log file has capacity limitations. When the size of a log file reaches the maximum value, the
system will delete the earliest messages and write new messages into the log file.
To set to save system information to a log file:
To do…
Use the command…
Remarks
1. Enter system view.
system-view
—
2. Enable information center.
info-center enable
3. Enable the log file feature.
info-center logfile enable
4. Configure the frequency with
which the log file is saved.
info-center logfile frequency freqsec
5. Configure the maximum
storage space reserved for a
log file.
info-center logfile size-quota size
6. Configure the directory to
save the log file.
info-center logfile switch-directory
dir-name
Optional.
Enabled by default.
Optional.
Enabled by default.
Optional.
The default value is 86,400
seconds.
Optional.
The default value is 10 MB.
Optional.
By default, it is the log file
directory under the root directory
of the Flash.
Optional.
7. Manually save the log buffer
content to the log file.
Available in any view.
By default, the system saves the
log file with the frequency defined
by the info-center logfile
frequency command.
logfile save
NOTE:
• To make sure that the device works normally, use the info-center logfile size-quota command to set a
log file to be no smaller than 1 MB and no larger than 10 MB.
• The info-center logfile switch-directory command is always used when you back up or move files.
The configuration will be invalid after system reboot or the active standby switchover.
239
Saving security logs into the security log file
Introduction
You can understand the device status, locate and troubleshoot network problems by viewing system
information, especially the security logs. Generally, all kinds of system information including security
logs is output into one folder, and it is difficult to recognize and check the security logs among all
kinds of system information.
This function enables the system to save the security logs into the security log file in a specific
directory without affecting the current output rules of the system information. It means that the system
picks up all security logs from the system information, copies and saves them into the security log file
in a specified directory when outputting the system information to different destinations. You can
perform centralized management to the security logs and view the security logs conveniently.
The configuration of this feature and the management of the security log file are separated, and the
security log file is managed by a privileged user. After logging in to the device, the administrator
can enable the saving of security logs into the security log file and configure related parameters by
executing the commands listed in Table 12. However, only the privileged user, which is the security
log administrator, can perform operations listed in Table 13 to the security log file after passing the
AAA local authentication and logging in to the device. Other users, including the system
administrator, cannot perform these operations to the security log file.
NOTE:
• You can authorize a security log administrator by executing the authorization-attribute user-role
security-audit command in local user view.
• The system administrator cannot view, copy, and rename the security log file; otherwise, the system
prompts “% Execution error”. The system administrator can view, copy and rename other types of
files.
• For the introduction and configuration of local user and AAA local authentication, see Security
Configuration Guide.
Saving security logs into the security log file
With this feature enabled, when the system outputs the system information to a specified destination,
it copies the security logs at the same time and saves them into the security log file buffer. Then, the
system writes the contents of the security log file buffer into the security log file at a specified
frequency (the security log administrator can trigger the saving of security logs into the log file
manually). After the contents of the buffer are saved into the security log file successfully, the security
log file buffer is cleared immediately.
The size of the security log file is limited. When the size of the security log file reaches the
predefined maximum value, the system deletes the oldest information and then writes the new
information into the security log file. To avoid security log file loss, set the alarm threshold of the
security log file usage. When the alarm threshold is reached, the system outputs the log information
to inform the administrator. The administrator can log in to the device as the security log
administrator, and then back up the security log file, preventing the loss of important historical data.
By default, the saving of security logs into the security log file is disabled. The parameters, such as
the saving frequency, the maximum size and the alarm threshold of the security log file usage, have
their default settings. To modify these parameters, you must log in to the device as the system
administrator, and then follow the steps in Table 12 to configure the related parameters:
240
Table 12 Save security logs into the security log file
To do…
Use the command…
Remarks
1. Enter system view.
system-view
—
2. Enable the information center.
info-center enable
3. Enable the saving of the
security logs into the security
log file.
info-center security-logfile enable
4. Set the frequency with which
the system saves the security
log file.
info-center security-logfile
frequency freq-sec
Optional.
5. Set the maximum storage
space reserved for the
security log file.
info-center security-logfile sizequota size
Optional.
6. Set the alarm threshold of the
security log file usage.
info-center security-logfile alarmthreshold usage
Optional.
Enabled by default.
Required.
Disabled by default.
The default value is 600 seconds.
The default value is 1 MB.
Optional.
80 by default. When the usage of
the security log file reaches 80%,
the system will inform the user.
Managing the security log file
After passing the AAA local authentication, the security log administrator can perform the following
operations:
Table 13 Manage the security log file
To do…
Use the command…
Remarks
1. Display the summary of the security log
file.
display security-logfile
summary [ | { begin |
exclude | include } regularexpression ]
Optional.
Optional.
2. Change the directory where the
security log file is saved.
info-center security-logfile
switch-directory dir-name
By default, the directory to
save the security log file is the
seclog directory under the
root directory of the storage
medium.
Available in user view.
3. Display contents of the security log file
buffer.
display security-logfile buffer
[ | { begin | exclude |
include } regular-expression ]
241
Optional.
To do…
Use the command…
Remarks
Optional.
4. Save all contents in the security log file
buffer into the security log file.
security-logfile save
By default, the system
automatically saves the
security log file at a frequency
configured by the info-center
security-logfile frequency
command into a directory
configured by the info-center
security-logfile switchdirectory command.
Available in user view.
5. Perform
these
operations
to the
security log
file:
6. Uploading
the security
log file to
the FTP
server:
Display the contents of
the specified file.
more file-url
Display information
about all files and
folders.
dir [ /all ] [ file-url ]
Create a folder under a
specified directory on
the storage medium.
mkdir directory
Change the current
working directory.
cd { directory | .. | / }
Display the current path.
pwd
Copy a file.
copy fileurl-source fileurl-dest
Rename a file or a
folder.
rename fileurl-source fileurldest
Move a file.
move fileurl-source fileurl-dest
Move a specified file
from a storage medium
to the recycle bin.
delete [ /unreserved ] file-url
Remove a folder.
rmdir directory
Format a storage
medium.
format device
Restore a file from the
recycle bin.
undelete file-url
Establish an FTP
connection.
ftp [ server-address [ serviceport ] [ [ vpn-instance vpninstance-name ] | [ source {
interface interface-type
interface-number | ip sourceip-address } ] ] ]
Establish an FTP
connection in an IPv6
network environment.
ftp ipv6 [ server-address [
service-port ] [ source ipv6
source-ipv6-address ] [ -i
interface-type interfacenumber ] ]
242
Optional.
Available in user view.
For details of these
commands, see Fundamentals
Command Reference.
Optional.
The ftp commands are
available in user view; the
other commands are
available in FTP client view.
For details of these
commands, see Fundamentals
Command Reference.
To do…
Use the command…
Upload a file on the
client to the remote FTP
server.
put localfile [ remotefile ]
Download a file from a
remote FTP server and
save it.
get remotefile [ localfile ]
All other operations
supported by the device
acting as an FTP client.
See Fundamentals
Configuration Guide.
Remarks
Configuring synchronous information output
Synchronous information output refers to the feature that if the user’s entries are interrupted by system
output such as log, trap, or debugging information, then after the completion of system output the
system will display a command line prompt—a prompt in command editing mode, or a [Y/N] string
in interaction mode—and your entries so far.
This command is used in the case that your entries are interrupted by a large amount of system
output. With this feature enabled, you can continue your operations from where you were stopped.
To enable synchronous information output:
To do…
Use the command…
Remarks
1. Enter system view.
system-view
—
2. Enable synchronous
information output.
info-center synchronous
Required.
Disabled by default.
NOTE:
• If system information, such as log information, is output before you enter any information under the
current command line prompt, the system will not display the command line prompt after the system
information output.
• If system information is output when you are entering some interactive information (non Y/N
confirmation information), then after the system information output, the system will not display the
command line prompt but your previous entry in a new line.
Disabling a port from generating link up/down logging
information
By default, all ports of the device generate link up/down logging information when the port state
changes. You may need to use this function in some cases, for example:
•
If you only concern the states of some of the ports, use this function to disable the other ports
from generating link up/down logging information.
•
If the state of a port is not stable and redundant logging information will be generated, use this
function to disable the port from generating link up/down logging information.
243
To disable a port from generating link up/down logging information:
To do…
Use the command…
Remarks
1. Enter system view.
system-view
—
2. Enter interface view.
interface interface-type interfacenumber
—
Required.
3. Disable the port from
generating link up/down
logging information.
undo enable log updown
By default, all ports are allowed
to generate link up/down logging
information when the port state
changes.
NOTE:
With this feature applied to a port, when the state of the port changes, the system does not generate
port link up/down logging information, and you cannot monitor the port state changes conveniently.
HP recommends that you use the default configuration in normal cases.
Displaying and maintaining information center
To do…
Use the command…
Remarks
Display information about
information channels
display channel [ channel-number
| channel-name ] [ | { begin |
exclude | include } regularexpression ]
Available in any view
Display the information of each
output destination
display info-center
Available in any view
Display the state of the log buffer
and the log information recorded
display logbuffer [ reverse ] [
level severity | size buffersize |
slot slot-number ] * [ | { begin |
exclude | include } regularexpression ]
Available in any view
Display a summary of the log
buffer
display logbuffer summary [ level
severity | slot slot-number ] * [ | {
begin | exclude | include }
regular-expression ]
Available in any view
Display the content of the log file
buffer
display logfile buffer [ | { begin |
exclude | include } regularexpression ]
Available in any view
Display the configuration of the
log file
display logfile summary [ | {
begin | exclude | include }
regular-expression ]
Available in any view
Display the state of the trap buffer
and the trap information recorded
display trapbuffer [ reverse ] [
size buffersize ] [ | { begin |
exclude | include } regularexpression ]
Available in any view
Reset the log buffer
reset logbuffer
Available in user view
244
To do…
Use the command…
Remarks
Reset the trap buffer
reset trapbuffer
Available in user view
Configuring information center examples
Outputting log information to a Unix log host
Network requirements
•
Send log information to a Unix log host with an IP address of 1.2.0.1/16;
•
Log information with severity higher than or equal to informational will be output to the log host;
•
The source modules are ARP and IP.
Figure 83 Network diagram for outputting log information to a Unix log host
Configuration procedure
Before the configuration, make sure that Device and PC are reachable to each other.
1.
Configure the device
# Enable information center.
<Sysname> system-view
[Sysname] info-center enable
# Specify the host with IP address 1.2.0.1/16 as the log host, use channel loghost to output log
information (optional, loghost by default), and use local4 as the logging facility.
[Sysname] info-center loghost 1.2.0.1 channel loghost facility local4
# Disable the output of log, trap, and debugging information of all modules on channel loghost.
[Sysname] info-center source default channel loghost debug state off log state off
trap state off
CAUTION:
As the default system configurations for different channels are different, you must disable the output of
log, trap, and debugging information of all modules on the specified channel (loghost in this example)
first, and then configure the output rule as needed so that unnecessary information will not be output.
# Configure the information output rule: allow log information of ARP and IP modules with severity
equal to or higher than informational to be output to the log host. (The source modules allowed to
output information depend on the device model.)
[Sysname] info-center source arp channel loghost log level informational state on
[Sysname] info-center source ip channel loghost log level informational state on
245
2.
Configure the log host
The following configurations were performed on Solaris which has similar configurations to the Unix
operating systems implemented by other vendors.
Step 1: Log in to the log host as a root user.
Step 2: Create a subdirectory named Device under directory /var/log/, and create file info.log
under the Device directory to save logs of Device.
# mkdir /var/log/Device
# touch /var/log/Device/info.log
Step 3: Edit file /etc/syslog.conf and add the following contents.
# Device configuration messages
local4.info
/var/log/Device/info.log
In the configuration, local4 is the name of the logging facility used by the log host to receive logs.
info is the information level. The Unix system will record the log information with severity level equal
to or higher than informational to file /var/log/Device/info.log.
NOTE:
Be aware of the following issues while editing file /etc/syslog.conf:
• Comments must be on a separate line and begin with the # sign.
• No redundant spaces are allowed after the file name.
• The logging facility name and the information level specified in the /etc/syslog.conf file must be
identical to those configured on the device using the info-center loghost and info-center source
commands; otherwise the log information may not be output properly to the log host.
Step 4: After log file info.log is created and file /etc/syslog.conf is modified, you must issue the
following commands to display the process ID of syslogd, kill the syslogd process and then restart
syslogd using the –r option to make the modified configuration take effect.
# ps -ae | grep syslogd
147
# kill -HUP 147
# syslogd -r &
After the configurations, the system will be able to record log information into the log file.
Outputting log information to a Linux log host
Network requirements
•
Send log information to a Linux log host with an IP address of 1.2.0.1/16;
•
Log information with severity equal to or higher than informational will be output to the log host;
•
All modules can output log information.
Figure 84 Network diagram for outputting log information to a Linux log host
246
Configuration procedure
Before the configuration, make sure that Device and PC are reachable.
1.
Configure the device
# Enable information center.
<Sysname> system-view
[Sysname] info-center enable
# Specify the host with IP address 1.2.0.1/16 as the log host, use channel loghost to output log
information (optional, loghost by default), and use local5 as the logging facility.
[Sysname] info-center loghost 1.2.0.1 channel loghost facility local5
# Disable the output of log, trap, and debugging information of all modules on channel loghost.
[Sysname] info-center source default channel loghost debug state off log state off
trap state off
CAUTION:
As the default system configurations for different channels are different, you must disable the output of
log, trap, and debugging information of all modules on the specified channel—loghost in this
example—first and then configure the output rule as needed so that unnecessary information will not be
output.
# Configure the information output rule: allow log information of all modules with severity equal to or
higher than informational to be output to the log host.
[Sysname] info-center source default channel loghost log level informational state on
2.
Configure the log host
Step 1: Log in to the log host as a root user.
Step 2: Create a subdirectory named Device under directory /var/log/, and create file info.log
under the Device directory to save logs of Device.
# mkdir /var/log/Device
# touch /var/log/Device/info.log
Step 3: Edit file /etc/syslog.conf and add the following contents.
# Device configuration messages
local5.info
/var/log/Device/info.log
In the configuration, local5 is the name of the logging facility used by the log host to receive logs.
info is the information level. The Linux system will record the log information with severity level equal
to or higher than informational to file /var/log/Device/info.log.
NOTE:
Be aware of the following issues while editing file /etc/syslog.conf:
• Comments must be on a separate line and begin with the # sign.
• No redundant spaces are allowed after the file name.
• The logging facility name and the information level specified in the /etc/syslog.conf file must be
identical to those configured on the device using the info-center loghost and info-center source
commands; otherwise the log information may not be output properly to the log host.
247
Step 4: After log file info.log is created and file /etc/syslog.conf is modified, you must issue the
following commands to display the process ID of syslogd, kill the syslogd process, and restart
syslogd using the -r option to make the modified configuration take effect.
# ps -ae | grep syslogd
147
# kill -9 147
# syslogd -r &
NOTE:
Make sure that the syslogd process is started with the -r option on a Linux log host.
After the configurations, the system will be able to record log information into the log file.
Outputting log information to the console
Network requirements
•
Log information with a severity equal to or higher than informational will be output to the
console;
•
The source modules are ARP and IP.
Figure 85 Network diagram for sending log information to the console
Configuration procedure
# Enable information center.
<Sysname> system-view
[Sysname] info-center enable
# Use channel console to output log information to the console (optional, console by default).
[Sysname] info-center console channel console
# Disable the output of log, trap, and debugging information of all modules on channel console.
[Sysname] info-center source default channel console debug state off log state off
trap state off
CAUTION:
As the default system configurations for different channels are different, you must disable the output of
log, trap, and debugging information of all modules on the specified channel—console in this
example—first and then configure the output rule as needed so that unnecessary information will not be
output.
# Configure the information output rule: allow log information of ARP and IP modules with severity
equal to or higher than informational to be output to the console. (The source modules allowed to
output information depend on the device model.)
[Sysname] info-center source arp channel console log level informational state on
[Sysname] info-center source ip channel console log level informational state on
248
[Sysname] quit
# Enable the display of log information on a terminal. (Optional, this function is enabled by default.)
<Sysname> terminal monitor
Info: Current terminal monitor is on.
<Sysname> terminal logging
Info: Current terminal logging is on.
After the configuration takes effect, if the specified module generates log information, the information
center automatically sends the log information to the console, which then displays the information.
Saving security logs into the security log file
Network requirements
As shown in Figure 86, to efficiently and conveniently view the security events and understand the
security status of the device, make sure of the following points:
•
Save security logs into the security log file Flash:/securitylog/seclog.log at a frequency of one
hour.
•
Only the security log administrator can view the contents of the security log file and back up the
security log file into the FTP server. All other logged-in users cannot view, copy and rename the
security log file.
Figure 86 Network diagram for saving security logs in a specific directory
Console
System
administrator
Device GE1/0/2
192.168.1.1/24
GE1/0/1
1.1.1.1/24
FTP Server
192.168.1.2/24
IP network
Security log
administrator
Configuration considerations
The configuration in this example includes the following parts: logging in to the device as the system
administrator and logging in to the device as the security log administrator.
1.
Logging in to the device as the system administrator
•
Enable the saving of the security logs into the security log file and set the frequency with which
the system saves the security log file to one hour.
•
Create a local user seclog with the password 123123123123, and authorize this user as the
security log administrator. You must use the authorization-attribute command to set the user
privilege level to 3 and specify the user role as security audit. In addition, specify the service
types that the user can use by using the service-type command.
249
•
Set the authentication mode to scheme for the user logging in to the device, and make sure that
only the local user who has passed the AAA local authentication can view and perform
operations on the security log file.
2.
Logging in to the device as the security log administrator
•
Set the directory for saving the security log file to Flash:/securitylog/seclog.log.
•
View the contents of the security log file to get the security status of the device.
•
Back up the security log file to the FTP server.
Configuration procedure
1.
Configuration performed by the system administrator
# Enable the saving of the security logs into the security log file and set the frequency with which the
system automatically saves the security log file to one hour.
<Sysname> system-view
[Sysname] info-center security-logfile enable
[Sysname] info-center security-logfile frequency 3600
# Create a local user seclog, and configure the password for the user as 123123123123.
[Sysname] local-user seclog
New local user added.
[Sysname-luser-seclog] password simple 123123123123
# Authorize the user to manage the security log file.
[Sysname-luser-seclog] authorization-attribute level 3 user-role security-audit
# Authorize the user to use SSH, Telnet, and terminal services.
[Sysname-luser-seclog] service-type ssh telnet terminal
[Sysname-luser-seclog] quit
# According to the network plan, the user will log in to the device through SSH or telnetting, so you
must configure the authentication mode of the VTY user interface as scheme.
[Sysname] display user-interface vty ?
INTEGER<0-15>
Specify one user terminal interface
The command output indicates that the device supports sixteen VTY user interfaces, which are
numbered 0 through 15.
[Sysname] user-interface vty 0 15
[Sysname-ui-vty0-15] authentication-mode scheme
[Sysname-ui-vty0-15] quit
2.
Configuration performed by the security log administrator
# Re-log in to the device as user seclog.
C:/> telnet 1.1.1.1
******************************************************************************
* Copyright (c) 2010-2011 Hewlett-Packard Development Company, L.P.
*
* Without the owner's prior written consent,
*
* no decompiling or reverse-engineering shall be allowed.
*
******************************************************************************
Login authentication
250
Username:seclog
Password:
<Sysname>
# Display the summary of the security log file.
<Sysname> display security-logfile summary
Security-log is enabled.
Security-log file size quota: 1MB
Security-log file directory: flash:/seclog
Alarm-threshold: 80%
Current usage: 0%
Writing frequency: 1 hour 0 min 0 sec
The command output indicates that the directory for saving the security log file is flash:/seclog.
# Change the directory where the security log file is saved to Flash:/securitylog.
<Sysname> mkdir securitylog
.
%Created dir flash:/securitylog.
<Sysname> info-center security-logfile switch-directory flash:/securitylog/
# Display contents of the security log file buffer.
<Sysname> display security-logfile buffer
%@175 Nov
2 17:02:53:766 2009 Sysname SHELL/4/LOGOUT:
Trap 1.3.6.1.4.1.25506.2.2.1.1.3.0.2: logout from Console
%@176 Nov
aux0.
2 17:02:53:766 2009 Sysname SHELL/5/SHELL_LOGOUT:Console logged out from
Contents of other logs are omitted here.
The command output indicates that the new content in the buffer has not been saved into the security
log file yet.
# Save the contents of the security log file buffer into the security log file manually.
<Sysname> security-logfile save
Info:
Save
all
contents
in
the
flash:/securitylog/seclog.log successfully.
security
log
buffer
into
file
# Display the contents of the security log file.
<Sysname> more securitylog/seclog.log
%@157 Nov
2 16:12:01:750 2009 Sysname SHELL/4/LOGIN:
Trap 1.3.6.1.4.1.25506.2.2.1.1.3.0.1: login from Console
%@158 Nov
aux0.
2 16:12:01:750 2009 Sysname SHELL/5/SHELL_LOGIN:Console logged in from
Contents of other logs are omitted here.
# Back up the security log file onto FTP server 192.168.1.2.
<Sysname> ftp 192.168.1.2
Trying 192.168.1.2 ...
Press CTRL+K to abort
Connected to 192.168.1.2.
220220 WFTPD 2.0 service (by Texas Imperial Software) ready for new user
251
User(192.168.0.201:(none)):123
331 Give me your password, please
Password:
230 Logged in successfully
[ftp] put securitylog/seclog.log
227 Entering Passive Mode (192,168,1,2,8,58)
150 "D:\DEBUG\TEMP\seclog.log" file ready to receive in ASCII mode
226 Transfer finished successfully.
FTP: 2063 byte(s) sent in 0.210 second(s), 9.00Kbyte(s)/sec.
[ftp] quit
252
Support and other resources
Contacting HP
For worldwide technical support information, see the HP support website:
http://www.hp.com/support
Before contacting HP, collect the following information:
•
Product model names and numbers
•
Technical support registration number (if applicable)
•
Product serial numbers
•
Error messages
•
Operating system type and revision level
•
Detailed questions
Subscription service
HP recommends that you register your product at the Subscriber's Choice for Business website:
http://www.hp.com/go/wwalerts
After registering, you will receive email notification of product enhancements, new driver versions,
firmware updates, and other product resources.
Related information
Documents
To find related documents, browse to the Manuals page of the HP Business Support Center website:
http://www.hp.com/support/manuals
•
For related documentation, navigate to the Networking section, and select a networking
category.
•
For a complete list of acronyms and their definitions, see HP A-Series Acronyms.
Websites
•
HP.com http://www.hp.com
•
HP Networking http://www.hp.com/go/networking
•
HP manuals http://www.hp.com/support/manuals
•
HP download drivers and software http://www.hp.com/support/downloads
•
HP software depot http://www.software.hp.com
253
Conventions
This section describes the conventions used in this documentation set.
Command conventions
Convention
Description
Boldface
Bold text represents commands and keywords that you enter literally as shown.
Italic
Italic text represents arguments that you replace with actual values.
[]
Square brackets enclose syntax choices (keywords or arguments) that are optional.
{ x | y | ... }
Braces enclose a set of required syntax choices separated by vertical bars, from which
you select one.
[ x | y | ... ]
Square brackets enclose a set of optional syntax choices separated by vertical bars,
from which you select one or none.
{ x | y | ... } *
Asterisk-marked braces enclose a set of required syntax choices separated by vertical
bars, from which you select at least one.
[ x | y | ... ] *
Asterisk-marked square brackets enclose optional syntax choices separated by vertical
bars, from which you select one choice, multiple choices, or none.
&<1-n>
The argument or keyword and argument combination before the ampersand (&) sign
can be entered 1 to n times.
#
A line that starts with a pound (#) sign is comments.
GUI conventions
Convention
Description
Boldface
Window names, button names, field names, and menu items are in bold text. For
example, the New User window appears; click OK.
>
Multi-level menus are separated by angle brackets. For example, File > Create >
Folder.
Convention
Description
Symbols
WARNING
An alert that calls attention to important information that if not understood or followed
can result in personal injury.
CAUTION
An alert that calls attention to important information that if not understood or followed
can result in data loss, data corruption, or damage to hardware or software.
IMPORTANT
An alert that calls attention to essential information.
NOTE
TIP
An alert that contains additional or supplementary information.
An alert that provides helpful information.
254
Network topology icons
Represents a generic network device, such as a router, switch, or firewall.
Represents a routing-capable device, such as a router or Layer 3 switch.
Represents a generic switch, such as a Layer 2 or Layer 3 switch, or a router that
supports Layer 2 forwarding and other Layer 2 features.
Port numbering in examples
The port numbers in this document are for illustration only and might be unavailable on your device.
255
Index
%% (vendor ID, system information), 230
advanced
7-tuple elements
configuring advanced cluster functions, 154
IPv6 NetStream, 210
agent
NetStream, 193
configuring NQA threshold monitoring, 28
access
configuring sFlow agent, 221
configuring access between management device
and member devices (cluster management), 153
aggregating
data export (IPv6 NetStream), 211
deleting member device from cluster, 152
data export (NetStream), 195
access-control rights, 65
data export configuration (IPv6 NetStream), 213
account
data export configuration (NetStream), 201
configuring web user accounts in batches (cluster
management), 157
data export format (IPv6 NetStream), 212
data export formats (NetStream), 196
accounting
aggregation data export
IPv6 NetStream configuration, 210, 217
IPv6 NetStream, 212
IPv6 NetStream flow concept, 210
NetStream, 195
NetStream configuration, 193, 207
aging
NetStream flow concept, 193
IPv6 NetStream flow, 211
ACL (NetStream filtering), 199
NetStream flow, 194, 206
ACS
alarm
active and standby ACS switchover (CWMP), 124
alarm group (RMON), 110
auto-connection between ACS and CPE (CWMP),
122
configuring alarm group (RMON), 118
configuring ACS URL (CWMP), 127
configuring RMON alarm function, 113
configuring server (CWMP), 126, 127
private alarm group (RMON), 111
configuring username and password (CWMP),
127
application (NTP), 54
applying
RPC methods (CWMP), 123
PoE profile, 91
active
QoS policy, 190
active and standby ACS switchover (CWMP), 124
QoS policy globally (traffic mirroring), 191
adding
QoS policy to interface (traffic mirroring), 190
candidate device to cluster, 154
QoS policy to VLAN (traffic mirroring), 190
member device (cluster management), 151
assigning
256
adding candidate device to cluster, 154
monitor port to remote probe VLAN, 174
channel
attempt
IPC, 82
configuring maximum number of retry connection
attempts (CWMP), 130
system information, 226
attribute
client. See also server
configuring CPE attributes (CWMP), 128
configuring client/server mode (NTP), 61
data export configuration (IPv6 NetStream), 216
configuring NTP client authentication, 66
data export configuration (NetStream), 203
multicast configuration (NTP), 63
authenticating (NTP), 65
NQA, 12
auto-connection
probe operation (NQA), 12
between ACS and CPE CWMP), 122
client/server (NTP operation mode)
automatic
configuration, 60, 61, 68
configuration file deployment (CWMP), 121
configuring MPLS VPN time synchronization, 78
basic concepts
configuring with authentication, 75
NQA, 11
overview, 57
basic functions
clock synchronization message (NTP), 56
CWMP, 121
cluster
batch
how it works, 141
configuring web user accounts in batches (cluster
management), 157
cluster management
adding candidate device to cluster, 154
benefits
adding member device, 151
NQA, 9
cluster roles, 140
bridge mode
configuration, 140
port mirroring, 164
configuring, 144, 158
sFlow, 220, 223
configuring access between management device
and member devices, 153
broadcast (NTP operation mode)
client configuration, 62
configuring advanced cluster functions, 154
configuration, 60, 62
configuring, 71
configuring communication between management
device and member devices, 150
configuring with authentication, 76
configuring interaction for a cluster, 155
overview, 57, 58
configuring management device, 146
server configuration, 62
configuring member device, 152
configuring protocol packets, 150
buffer
configuring SNMP configuration synchronization
function (cluster management), 156
outputting system information to log buffer, 235
outputting system information to trap buffer, 235
configuring topology management, 154
candidate
257
configuring web user accounts in batches, 157
ACS server (CWMP), 126, 127
deleting member device from cluster, 152
ACS URL (CWMP), 127
displaying, 157
ACS username and password (CWMP), 127
enabling cluster function, 148, 152
advanced cluster functions, 154
enabling management VLAN auto-negotiation,
149
automatic file deployment (CWMP), 121
broadcast client, 62
establishing a cluster, 148
broadcast server, 62
maintaining, 157
client/server mode (NTP), 61
maintenance, 142
cluster management, 140, 144, 158
management VLAN, 143
cluster management protocol packets, 150
manually collecting topology information, 148,
152
collaboration (NQA), 51
collaboration function (NQA), 27
member management, 151
communication between management device and
member devices (cluster management), 150
NDP, 141
NTDP, 142
connection interface (CWMP), 129
rebooting member device, 152
counter sampling (sFlow), 222
removing member device, 151
CPE (CWMP), 126
collaboration
CPE attributes (CWMP), 128
configuring function (NQA), 27
CPE close-wait timer (CWMP), 130
function (NQA), 9, 51
CPE username and password (CWMP), 128
collecting
topology
information
management), 148, 152
CWMP, 120, 125, 131, 132
manually
(cluster
DHCP server (CWMP), 125
DHCP test, 15
collector (sFlow), 221
DHCP test (NQA), 16, 35
command
DLSw test (NQA), 26, 50
debugging, 5
DNS server (CWMP), 126
ping, 1, 7
DNS test (NQA), 16, 36
tracert, 3, 7
egress port for remote source mirroring group,
172
communicating
configuring communication between management
device
and
member
devices
(cluster
management), 150
Ethernet statistics group (RMON), 115
Flow sampling, 222
FTP test (NQA), 17, 37
configuring
access between management device and member
devices (cluster management), 153
history group (RMON), 116
access-control rights, 65
HTTP test (NQA), 18, 38
access-control rights (NTP), 65
ICMP echo test, 14
history record saving function (NQA), 30
258
ICMP echo test (NQA), 33
mirroring ports in interface view, 178
information center, 225, 231, 244
mirroring ports in system view, 178
interaction for cluster, 155
monitor port for Layer 3 local mirroring group,
179
IPC, 82
monitor port for remote destination mirroring
group, 173
IPv6 NetStream, 210, 217
IPv6 NetStream aggregation data export, 214,
218
monitor port for the local mirroring group, 169
monitor port in interface view, 169, 179
IPv6 NetStream data export, 213
monitor port in system view, 169, 179
IPv6 NetStream data export attributes, 216
MPLS VPN time synchronization in client/server
mode, 78
IPv6 NetStream data export format, 216
IPv6 NetStream traditional data export, 213, 217
MPLS VPN time synchronization in symmetric
peers mode, 80
IPv6 NetStream version 9 template refresh rate,
216
multicast client, 63
Layer 2 remote port mirroring, 169, 181
multicast server, 63
Layer 3 remote port mirroring, 177, 185
NDP parameters (cluster management), 146
local mirroring groups, 178
NetStream, 193, 207
local port mirroring, 167, 169
NetStream ACL-based filtering, 199
local port mirroring with multiple monitor ports,
175, 183
NetStream aggregation data export, 202, 208
NetStream data export, 201
management device (cluster management), 146
NetStream data export attributes, 203
maximum number of dynamic sessions allowed
(NTP), 64
NetStream data export format, 203
NetStream filtering, 199
maximum number of retry connection attempts
(CWMP), 130
NetStream flow aging, 206
maximum PoE interface power, 89
NetStream QoS-based filtering, 199
member device (cluster management), 152
NetStream sampling, 199, 201
mirroring CPUs for Layer 3 local mirroring group,
179
NetStream traditional data export, 201, 207
NetStream version 9 template refresh rate, 205
mirroring CPUs for local mirroring group, 168
network management-specific
(SNMP), 100
mirroring CPUs for remote source mirroring group,
172
interface
NQA, 9, 33
mirroring port for local mirroring group, 168
NQA server, 13
mirroring port in interface view, 168
NQA statistics collection function, 29
mirroring port in system view, 168
NQA test group, 14
mirroring ports for Layer 3 local mirroring group,
178
NTDP parameters (cluster management), 147
NTP, 54, 68
mirroring ports for remote source mirroring group,
171
NTP authentication, 65
259
index
NTP broadcast mode, 62, 71
sFlow, 220, 221, 223
NTP broadcast mode with authentication, 76
sFlow agent, 221
NTP client authentication, 66
sFlow collector, 221
NTP client/server mode, 68
SNMP, 96, 97
NTP client/server mode with authentication, 75
SNMP configuration synchronization
(cluster management), 156
NTP multicast mode, 63, 72
SNMP logging, 101, 107
NTP operation mode, 60
SNMP test (NQA), 21, 43
NTP optional parameters, 63
SNMP trap, 102
NTP server authentication, 67
SNMPv1, 105
NTP symmetric peers mode, 61, 69
SNMPv2c, 105
PD disconnection detection mode (PoE), 88
SNMPv3, 106
ping, 1
system debugging, 6
ping and tracert, 7
TCP test (NQA), 22, 44
PoE, 85, 93
test group optional parameters (NQA), 31
PoE interface power management, 89, 90
threshold monitoring (NQA), 28
PoE interface through PoE profile, 91
topology management (cluster management), 154
PoE monitoring function, 90
tracert, 4
PoE power, 89
traffic mirroring, 188, 191
PoE power management, 89
trap parameters (SNMP), 103
PoE profile, 91
UDP echo test (NQA), 23, 45
PSE power monitoring, 90
remote destination mirroring
destination device), 173
remote probe VLAN for
mirroring group, 174
function
group
remote
(on
UDP jitter test (NQA), 19, 20, 40
the
voice test (NQA), 24, 25, 47
web
user
accounts
management), 157
destination
in
batches
(cluster
connecting
remote probe VLAN for remote source mirroring
group, 173
auto-connection between ACS and CPE (CWMP),
122
remote source mirroring group (on the source
device), 171
configuring connection interface (CWMP), 129
RMON, 109
configuring maximum number of retry connection
attempts (CWMP), 130
RMON alarm function, 113
console
RMON alarm group, 118
RMON Ethernet statistics function, 112
enabling display of system information, 232
RMON history statistics function, 112
outputting log information, 247
RMON statistics function, 111
outputting system information, 232
contacting HP, 252
sampler, 162, 163
260
content (system information), 231
configuring ACS username and password, 127
control message (NTP), 56
configuring connection interface, 129
CPE
configuring CPE, 126
configuring CPE close-wait timer, 130
auto-connection between ACS and CPE (CWMP),
122
configuring CPE username and password, 128
configuring (CWMP), 126
configuring DHCP server, 125
configuring attributes (CWMP), 128
configuring DNS server, 126
configuring close-wait timer (CWMP), 130
configuring maximum number of retry connection
attempts, 130
configuring username and password (CWMP),
128
CPE system file management, 121
monitoring status and performance (CWMP), 121
displaying, 131
RPC methods (CWMP), 123
enabling, 127
CPU
maintaining, 131
configuring mirroring CPUs for Layer 3 local
mirroring group, 179
mechanism, 122
monitoring CPE status and performance, 121
configuring mirroring CPUs for local mirroring
group, 168
network framework, 120
configuring mirroring CPUs for remote source
mirroring group, 172
sending Inform message, 129
IPC node, 82
sending Inform message periodically, 129
sending Inform message at a specific time, 130
mirroring traffic to CPU, 189
data
creating
export (IPv6 NetStream), 211
local mirroring group, 167
export (NetStream), 195
NQA test group, 14
remote destination mirroring group, 173
export attribute configuration (IPv6 NetStream),
216
remote source mirroring group, 171
export attribute configuration (NetStream), 203
sampler, 162
export configuration (IPv6 NetStream), 213
export configuration (NetStream), 201
CWMP
active and standby ACS switchover, 124
export format (IPv6 NetStream), 212
auto-connection between ACS and CPE, 122
export formats (NetStream), 196
debugging
automatic configuration file deployment, 121
basic functions, 121
command, 5
configuration, 120
default output rules (system information), 227
configuration parameter deployment, 123
information center configuration, 225, 231, 244
configuring, 125, 131, 132
system, 1
configuring ACS server, 126, 127
default output rules (system information), 227
configuring ACS URL, 127
deleting
261
removing member device (cluster management),
151
member device from cluster, 152
deploying
system information format, 228
automatic configuration file deployment (CWMP),
121
DHCP
configuring server (CWMP), 125
configuration parameter deployment (CWMP),
123
configuring test (NQA), 15, 16
destination
test configuration (NQA), 35
configuring remote destination mirroring group (on
the destination device), 173
digest (system information), 230
disabling
creating remote destination mirroring group, 173
interface receiving NTP messages, 64
system information format, 228
disablng
system information output, 226
a port from generating linkup/linkdown logging
information, 242
detecting
configuring PD disconnection detection mode
(PoE), 88
disconnecting
configuring PD disconnection detection mode
(PoE), 88
enabling PSE to detect nonstandard PDs (PoE), 88
PDs (PoE), 88
displaying
device
cluster management, 157
adding candidate device to cluster, 154
CWMP, 131
adding member device (cluster management), 151
information center, 243
configuring access between management device
and member devices (cluster management), 153
IPC, 84
configuring communication between management
device
and
member
devices
(cluster
management), 150
NetStream, 207
configuring
management
management), 146
device
IPv6 NetStream, 217
NQA, 33
(cluster
NTP, 67
PoE, 93
configuring member device (cluster management),
152
port mirroring, 180
deleting member device from cluster, 152
RMON, 114
IPC configuration, 82
sampler, 162
IPC node, 82
sFlow, 222
NTP applications, 54
SNMP, 104
outputting log information (console), 247
traffic mirroring, 191
DLSw
outputting log information (Linux log host), 245
outputting log information (UNIX log host), 244
configuring test (NQA), 26
rebooting member device (cluster management),
152
test (NQA), 50
DNS
262
Ethernet
configuring server (CWMP), 126
configuring test (NQA), 16
configuring Ethernet statistics group (RMON), 115
test configuration (NQA), 36
configuring RMON Ethernet statistics function, 112
local port mirroring configuration, 167, 169
documentation
conventions used, 253
port mirroring configuration, 164
website, 252
sFlow configuration, 220, 221, 223
sFlow operation, 220
echo test. See UDP echo test
statistics group (RMON), 110
configuring ICMP (NQA), 14
event
ICMP configuration, 33
event group (RMON), 110
UDP configuration (NQA), 45
field
egress
%% (system information), 230
configuring egress port for remote source mirroring
group, 172
content (system information), 231
enabling
digest (system information), 230
cluster function (cluster management), 148, 152
level (severity, system information), 230
CWMP, 127
PRI (system information), 229
display of system information on a monitor
terminal, 233
serial number (system information), 231
source (system information), 231
display of system information on the console, 232
sysname (system information), 230
IPC performance statistics, 83
system information, 230
IPv6 NetStream, 213
timestamp (system information), 229
local mirroring with remote probe VLAN, 175
management VLAN
management), 149
auto-negotiation
vv (system information), 230
(cluster
file
automatic configuration file deployment (CWMP),
121
NDP (cluster management), 146, 152
NetStream, 199
manaing security log file, 240
NetStream on interface, 199
saving security logs into security log file, 239, 248
NQA client, 14
saving system information to log file, 238
NTDP (cluster management), 147, 152
file management
PoE, 87
CPE system file management (CWMP), 121
PoE for a PoE interface, 87
filtering
PSE to detect nonstandard PDs (PoE), 88
NetStream ACL-based configuration, 199
SNMP logging, 101
NetStream configuration, 197, 199
trap function (SNMP), 102
NetStream QoS-based configuration, 199
establishing
FIN-triggered aging (NetStream flow), 206
cluster (cluster management), 148
263
fixed (sampler mode), 162
enabling trap function, 102
flow
RMON Ethernet statistics function, 112
functions
IPv6 NetStream aging, 211
configuring advanced cluster functions, 154
IPv6 NetStream concept, 210
NetStream aging, 194, 206
globally applying QoS policy (traffic mirroring), 191
NetStream concept, 193
group
forced aging (NetStream flow), 206
alarm group (RMON), 110
format
configuring alarm group (RMON), 118
configuring IPv6 NetStream data export format,
216
configuring egress port for remote source mirroring
group, 172
configuring NetStream data export format, 203
configuring Ethernet statistics group (RMON), 115
data export (IPv6 NetStream), 212
configuring history group (RMON), 116
data export (NetStream), 196
configuring Layer 3 local mirroring groups, 178
NTP message, 56
configuring local mirroring monitor port, 169
switching format of NM-specific ifindex (SNMP),
100
configuring mirroring CPUs for Layer 3 local
mirroring group, 179
system information, 228
configuring mirroring CPUs for local mirroring
group, 168
framework
configuring mirroring CPUs for remote source
mirroring group, 172
CWMP network framework, 120
FTP
configuring mirroring port for local mirroring
group, 168
configuring test (NQA), 17
test configuration (NQA), 37
configuring mirroring ports for Layer 3 local
mirroring group, 178
function
configuring mirroring ports for remote source
mirroring group, 171
collaboration (NQA), 9
configuring collaboration (NQA), 27
configuring monitor port for
mirroring group, 179
configuring history record saving (NQA), 30
configuring PoE monitoring function, 90
Layer
3
local
configuring monitor port for remote destination
mirroring group, 173
configuring RMON alarm function, 113
configuring remote destination mirroring group (on
the destination device), 173
configuring RMON history statistics function, 112
configuring RMON statistics function, 111
configuring remote probe VLAN
destination mirroring group, 174
configuring SNMP configuration synchronization
function, 156
for
remote
configuring remote probe VLAN for remote source
mirroring group, 173
configuring SNMP configuration synchronization
function (cluster management), 156
configuring statistics collection (NQA), 29
configuring remote source mirroring group (on the
source device), 171
enabling cluster function (cluster management),
148, 152
configuring test group (NQA), 14
264
implementing
configuring test group optional parameters (NQA),
31
port mirroring, 164
creating local port mirroring group, 167
index
creating remote destination mirroring group, 173
creating remote source mirroring group, 171
configuring network management-specific interface
index (SNMP), 100
creating test group (NQA), 14
switching format of NM-specific ifindex, 100
information
Ethernet statistics group (RMON), 110
manually collecting topology information (cluster
management), 148, 152
event group (RMON), 110
history group (RMON), 110
information center
private alarm group (RMON), 111
configuration, 225, 231, 244
RMON, 110
configuring synchronous information output, 242
scheduling test group (NQA), 32
default output rules (system information), 227
test group (NQA), 11
disablng a port from generating linkup/linkdown
logging information, 242
history
configuring history group (RMON), 116
displaying, 243
configuring record saving function (NQA), 30
maintaining, 243
configuring RMON history statistics function, 112
outputting by source module, 227
history group (RMON), 110
outputting system information to console, 232
HP
outputting system information to log buffer, 235
customer support and resources, 252
outputting system information to log host, 234
document conventions, 253
outputting system information to monitor terminal,
233
documents and manuals, 252
icons used, 253
subscription service, 252
outputting system information to SNMP module,
236
support contact information, 252
outputting system information to trap buffer, 235
symbols used, 253
outputting system information to web interface,
237
system information format, 228
saving security logs into security log file, 239, 248
websites, 252
saving system information to log file, 238
HTTP
system information %% (vendor ID) field, 230
configuring test (NQA), 18
system information channels, 226
test configuration (NQA), 38
system information content field, 231
ICMP
system information digest field, 230
configuring echo test (NQA), 14
system information fields, 230
echo test configuration (NQA), 33
system information format, 228
icons, 253
system information output destination, 226
265
system information PRI (priority) field, 229
configuring SNMP test (NQA), 21
system information serial number field, 231
configuring TCP test (NQA), 22
system information severity level, 226
configuring UDP echo test (NQA), 23
system information severity level field, 230
configuring UDP jitter test (NQA), 19
system information source field, 231
configuring voice test (NQA), 24
system information sysname field, 230
creating NQA test group, 14
system information timestamp field, 229
enabling NQA client, 14
system information types, 226
NQA collaboration configuration, 51
system information vv field, 230
NQA configuration, 9, 33
NQA DHCP test configuration, 35
instance
NQA DLSw test configuration, 50
multiple instances (NTP), 59
NQA DNS test configuration, 36
interaction
NQA FTP test configuration, 37
configuring interaction for a cluster, 155
NQA HTTP test configuration, 38
interface
applying QoS policy (traffic mirroring), 190
NQA ICMP echo test configuration, 33
configuring connection interface (CWMP), 129
NQA server configuration, 13
configuring maximum PoE interface power, 89
NQA SNMP test configuration, 43
configuring monitor port, 169
NQA TCP test configuration, 44
configuring network management-specific interface
index (SNMP), 100
NQA UDP echo test configuration, 45
NQA UDP jitter test configuration, 40
configuring PoE interface power management, 89,
90
NQA voice test configuration, 47
IP (system information), 230
configuring PoE interface through PoE profile, 91
IPC
enabling PoE for a PoE interface, 87
channel, 82
mirroring traffic to interface, 188
configuration, 82
outputting system information to web interface,
237
displaying, 84
enabling performance statistics, 83
interface view
link, 82
configuring mirroring port, 168
maintaining, 84
Internet
configuring DHCP test (NQA), 15
node, 82
configuring DLSw test (NQA), 26
packet sending modes, 83
IPv4
configuring FTP test (NQA), 17
configuring HTTP test (NQA), 18
NetStream flow concept, 193
configuring ICMP echo test (NQA), 14
ping, 1
configuring NQA test group, 14
tracert, 4
266
enabling local port mirroring with remote probe
VLAN, 175
IPv6
ping, 1
enabling NetStream, 199
tracert, 4
enabling NetStream on interface, 199
IPv6 NetStream
local port mirroring configuration, 167, 169
aggregation data export, 212
port mirroring configuration, 164
aggregation data export configuration, 214, 218
remote port mirroring, 165
configuration, 210, 217
remote port mirroring configuration, 181
data export, 211
sFlow configuration, 220, 221, 223
data export attribute configuration, 216
sFlow operation, 220
data export configuration, 213
Layer 3
data export format configuration, 216
configuring local mirroring groups, 178
displaying, 217
configuring mirroring ports for a local mirroring
group, 178
export format, 212
flow aging, 211
flow concept, 210
configuring monitor port for local mirroring group,
179
how it works, 210
configuring remote port mirroring, 177
key technologies, 211
enabling IPv6 NetStream, 213
maintaining, 217
enabling NetStream, 199
NDA, 210
enabling NetStream on interface, 199
NDE, 210
local port mirroring configuration, 167, 169
NSC, 210
port mirroring configuration, 164
traditional data export, 211
remote port mirroring, 166
traditional data export configuration, 213, 217
sFlow configuration, 220, 221, 223
version 9 template refresh rate configuration, 216
sFlow operation, 220
IRF fabric
Layer 3 remote port mirroring configuration, 185
IPC configuration, 82
level (severity, system information), 230
IPC node, 82
link (IPC), 82
jitter test. See UDP jitter test
Linux log host, 245
Layer 2
local
configuring remote destination mirroring group (on
the destination device), 173
mirroring group, 168
port mirroring, 169
configuring remote port mirroring, 169
local port mirroring, 164, 167
configuring remote source mirroring group (on the
source device), 171
log
managing security log file, 240
enabling IPv6 NetStream, 213
saving security logs into security log file, 239, 248
267
SNMP, 96
saving system information to log file, 238
working mechanism (RMON), 109
log host (system information), 234
member
logging
configuring SNMP logging, 101
adding member device (cluster management), 151
default output rules (system information), 227
cluster member management, 151
disablng a port from generating linkup/linkdown
information, 242
configuring access between management device
and member devices (cluster management), 153
enabling SNMP logging, 101
configuring communication between management
device
and
member
devices
(cluster
management), 150
information center configuration, 225, 231, 244
outputting information (console), 247
outputting information (Linux log host), 245
configuring member device (cluster management),
152
outputting information (UNIX log host), 244
deleting member device from cluster, 152
outputting system information to log buffer, 235
rebooting member device (cluster management),
152
outputting system information to log host, 234
removing member device (cluster management),
151
system information format, 228
maintaining
message
cluster management, 142, 157
clock synchronization message (NTP), 56
CWMP, 131
control message (NTP), 56
information center, 243
NTP format, 56
IPC, 84
sending Inform message (CWMP), 129
IPv6 NetStream, 217
sending Inform message at a specific time
(CWMP), 130
NetStream, 207
PoE, 93
sending Inform message periodically (CWMP),
129
RMON, 114
method
sampler, 162
RPC methods (CWMP), 123
SNMP, 104
MIB
system, 1
overview (SNMP), 97
managing
mirroring
cluster, 140
configuring
topology
management), 154
management
port mirroring. See port mirroring
(cluster
traffic. See traffic mirroring
CPE system file management (CWMP), 121
traffic to CPU, 189
security log file, 240
traffic to interface, 188
manuals, 252
mixcast (IPC packet sending mode), 83
mechanism
mode
CWMP, 122
268
NetStream, 193
configuring PD disconnection detection mode
(PoE), 88
NDP
data aggregation export (IPv6 NetStream), 211
configuring parameters (cluster management), 146
data aggregation export (NetStream), 195
enabling (cluster management), 146, 152
fixed (sampler), 162
NDP (cluster management), 141
IPC packet sending, 83
negotiating
NTP operation, 57
enabling management VLAN
(cluster management), 149
port mirroring configuration, 164
NetStream
random (sampler), 162
ACL-based filtering configuration, 199
module
aggregation data export, 195
outputting system information to SNMP module,
236
aggregation data export configuration, 202, 208
system information field, 230
configuration, 193, 207
system information output by source, 227
data export, 195
monitor terminal (system information), 233
data export attribute configuration, 203
monitoring
data export configuration, 201
assigning monitor port to remote probe VLAN,
174
configuring monitor port
mirroring group, 173
auto-negotiation
for
remote
data export format configuration, 203
displaying, 207
source
enabling, 199, 213
configuring PoE monitoring function, 90
enabling on interface, 199
configuring PSE power monitoring (PoE), 90
export formats, 196
CPE status and performance (CWMP), 121
filtering, 197
PD (PoE), 90
filtering configuration, 199
flow aging, 194
multicast
flow aging configuration, 206
IPC packet sending mode, 83
flow concept, 193
multicast (NTP operation mode)
client configuration, 63
how it works, 193
configuration, 60, 63, 72
IPv6. See IPv6 NetStream
overview, 57, 59
key technologies, 194
server configuration, 63
maintaining, 207
NDA, 193
NDA
IPv6 NetStream, 210
NDE, 193
NetStream, 193
NSC, 193
QoS-based filtering configuration, 199
NDE
sampler configuration, 162
IPv6 NetStream, 210
269
IPv6 NetStream aggregation
configuration, 218
sampling, 197
sampling configuration, 199, 201
data
export
IPv6 NetStream configuration, 210, 217
traditional data export, 195
IPv6
NetStream
traditional
configuration, 217
traditional data export configuration, 201, 207
version 9 template refresh rate configuration, 205
data
export
Layer 3 remote port mirroring configuration, 185
network
local port mirroring configuration, 167, 169, 180
CWMP network framework, 120
NQA client and server relationship, 12
NetStream aggregation data export configuration,
208
NTP applications, 54
NetStream configuration, 193, 207
network management
applying traffic mirroring QoS policy, 190
NetStream traditional data export configuration,
207
configuring collaboration function (NQA), 27
NQA collaboration configuration, 51
configuring DHCP test (NQA), 15
NQA configuration, 9, 33
configuring DLSw test (NQA), 26
NQA DHCP test configuration, 35
configuring FTP test (NQA), 17
NQA DLSw test configuration, 50
configuring history record saving function (NQA),
30
NQA DNS test configuration, 36
configuring HTTP test (NQA), 18
NQA HTTP test configuration, 38
configuring ICMP echo test (NQA), 14
NQA ICMP echo test configuration, 33
configuring network management-specific interface
index (SNMP), 100
NQA server configuration, 13
NQA FTP test configuration, 37
NQA SNMP test configuration, 43
configuring NQA test group, 14
NQA TCP test configuration, 44
configuring SNMP test (NQA), 21
NQA UDP echo test configuration, 45
configuring statistics collection function (NQA), 29
NQA UDP jitter test configuration, 40
configuring TCP test (NQA), 22
NQA voice test configuration, 47
configuring test group optional parameters (NQA),
31
NTP configuration, 54, 68
ping, 7
configuring threshold monitoring (NQA), 28
ping and tracert configuration, 7
configuring UDP echo test (NQA), 23
ping configuration, 1
configuring UDP jitter test (NQA), 19
port mirroring configuration, 164, 180
configuring voice test (NQA), 24
sampler configuration, 162
creating NQA test group, 14
scheduling test group (NQA), 32
debugging, 5
sFlow configuration, 220, 221, 223
enabling NQA client, 14
sFlow operation, 220
information center configuration, 225, 231, 244
switching format of NM-specific ifindex, 100
IPC configuration, 82
270
system debugging configuration, 6
configuring voice test, 24, 25
system maintenance, 1
creating test group, 14
tracert, 3, 7
DHCP test configuration, 35
tracert configuration, 4
displaying, 33
traffic mirroring configuration, 188, 191
DLSw test configuration, 50
DNS test configuration, 36
node
IPC, 82
enabling client, 14
IPC channel, 82
FTP test configuration, 37
IPC link, 82
HTTP test configuration, 38
ICMP echo test configuration, 33
NQA
basic concepts, 11
probe operation, 12
benefits, 9
scheduling test group, 32
client, 12
server, 12
collaboration configuration, 51
server configuration, 13
collaboration function, 9
SNMP test configuration, 43
configuration, 9, 33
TCP test configuration, 44
configuration examples, 33
test and probe, 11
configuring collaboration function, 27
test group, 11
configuring DHCP test, 15, 16
test types supported, 9
configuring DLSw test, 26
threshold monitoring (NQA), 10
configuring DNS test, 16
UDP echo test configuration, 45
configuring FTP test, 17
UDP jitter test configuration, 40
configuring history record saving function, 30
voice test configuration, 47
NSC
configuring HTTP test, 18
configuring ICMP echo test, 14
IPv6 NetStream, 210
configuring SNMP test, 21
NetStream, 193
NTDP
configuring statistics collection function, 29
configuring TCP test, 22
configuring parameters (cluster management), 147
configuring test group, 14
enabling (cluster management), 147, 152
NTDP (cluster management), 142
configuring test group optional parameters (NQA),
31
NTP
configuring threshold monitoring, 28
applications, 54
configuring UDP echo test, 23
configuration, 54, 68
configuring UDP echo test (NQA), 23
configuring access-control rights, 65
configuring UDP jitter test, 19, 20
configuring authentication, 65
271
system information to web interface, 237
configuring broadcast mode, 62, 71
overview
configuring broadcast mode with authentication,
76
MIB (SNMP), 97
configuring client/server mode, 61, 68
packet
configuring client/server mode with authentication,
75
applying traffic mirroring QoS policy, 190
configuring cluster management protocol packets,
150
configuring maximum number of dynamic sessions
allowed, 64
IPC link, 82
configuring MPLS VPN time synchronization in
client/server mode, 78
IPC sending modes, 83
configuring MPLS VPN time synchronization in
symmetric peers mode, 80
local port mirroring configuration, 167, 169
configuring multicast mode, 63, 72
NetStream sampling, 197
configuring optional parameters, 63
port mirroring configuration, 164
configuring symmetric peers mode, 61, 69
probe operation (NQA), 12
disablng interface receiving messages, 64
sampler configuration, 162
displaying, 67
traffic mirroring configuration, 188, 191
NetStream filtering, 197
how it works, 55
parameter
message format, 56
configuration parameter deployment (CWMP),
123
multiple instances, 59
operation modes, 57
specifying message source interface, 63
outputting
information center configuration, 225, 231, 244
configuring
NDP
management), 146
parameters
(cluster
configuring
NTDP
management), 147
parameters
(cluster
log information to a Linux log host, 245
configuring test group optional parameters (NQA),
31
log information to a UNIX log host, 244
configuring trap parameters (SNMP), 103
password
log information to console, 247
synchronous system information, 242
system information by source module, 227
system information destination, 226
system information severity level, 226
configuring ACS
(CWMP), 127
username
and
password
configuring CPE
(CWMP), 128
username
and
password
PD
system information to console, 232
system information to log buffer, 235
configuring disconnection detection mode (PoE),
88
system information to log host, 234
detecting (PoE), 88
system information to monitor terminal, 233
monitoring (PoE), 90
system information to SNMP module, 236
peer (NTP access-control right), 65
system information to trap buffer, 235
performance
272
assigning monitor port to remote probe VLAN,
174
monitoring CPE status and performance (CWMP),
121
disablng generation of linkup/linkdown logging
information, 242
performance statistics (IPC), 83
periodic aging (NetStream flow), 206
enabling NDP (cluster management), 146, 152
ping
enabling NTDP (cluster management), 147, 152
configuring, 1
NTP configuration, 54
ping command, 1, 7
port mirroring. See port mirroring
PoE
port mirroring
advantages, 85
configuration, 164, 180
applying profile, 91
configuring egress port for remote source mirroring
group, 172
composition, 85
configuring, 85, 93
configuring Layer 3 local mirroring groups, 178
configuring maximum PoE interface power, 89
configuring Layer 3 remote, 177
configuring PD disconnection detection mode, 88
configuring local mirroring group monitor port,
169
configuring PoE interface power management, 89,
90
configuring mirroring CPUs for Layer 3 local
mirroring group, 179
configuring PoE interface through PoE profile, 91
configuring PoE monitoring function, 90
configuring mirroring CPUs for local mirroring
group, 168
configuring PoE power, 89
configuring mirroring CPUs for remote source
mirroring group, 172
configuring PoE power management, 89
configuring profile, 91
configuring mirroring port for local mirroring
group, 168
configuring PSE power monitoring, 90
detecting PDs, 88
configuring mirroring ports for Layer 3 local
mirroring group, 178
displaying, 93
configuring mirroring ports for remote source
mirroring group, 171
enabling, 87
enabling PoE for a PoE interface, 87
configuring mirroring ports in interface view, 178
enabling PSE to detect nonstandard PDs, 88
configuring mirroring ports in system view, 178
maintaining, 93
configuring monitor port for
mirroring group, 179
monitoring PD, 90
protocol specification, 86
Layer
3
local
troubleshooting, 94
configuring monitor port for remote destination
mirroring group, 173
upgrading PSE processing software in service, 92
configuring monitor port in interface view, 179
configuring monitor port in system view, 179
policy
configuring remote destination mirroring group (on
the destination device), 173
applying traffic mirroring QoS policy, 190
port
configuring remote probe VLAN
destination mirroring group, 174
273
for
remote
procedure
configuring remote probe VLAN for remote source
mirroring group, 173
adding candidate device to cluster, 154
configuring remote source mirroring group (on the
source device), 171
adding member device (cluster management), 151
applying PoE profile, 91
creating local group, 167
applying QoS policy globally (traffic mirroring),
191
creating remote destination mirroring group, 173
creating remote source mirroring group, 171
displaying, 180
applying QoS policy to interface (traffic mirroring),
190
enabling local mirroring with remote probe VLAN,
175
applying QoS policy to VLAN (traffic mirroring),
190
implementing, 164
assigning monitor port to remote probe VLAN,
174
Layer 2 remote configuration, 181
cluster member management, 151
Layer 2 remote port mirroring, 165
configuring access between management device
and member devices (cluster management), 153
Layer 3 remote configuration, 185
Layer 3 remote port mirroring, 166
configuring access-control rights (NTP), 65
link-mode, 164
configuring ACS server (CWMP), 127
local, 164
configuring ACS URL (CWMP), 127
local configuration, 167, 169, 180
configuring ACS
(CWMP), 127
types, 164
power
username
and
password
configuring advanced cluster functions, 154
configuring maximum PoE interface power, 89
configuring alarm group (RMON), 118
configuring PoE interface power management, 89,
90
configuring broadcast client, 62
configuring broadcast server, 62
configuring PoE power, 89
configuring client/server mode (NTP), 61
configuring PoE power management, 89
configuring cluster management, 144, 158
configuring PSE power monitoring (PoE), 90
PRI (priority, system information), 229
configuring cluster management protocol packets,
150
probe
configuring collaboration function (NQA), 27
assigning monitor port to remote probe VLAN,
174
configuring communication between management
device
and
member
devices
(cluster
management), 150
configuring NQA collaboration function, 27
configuring remote probe VLAN
destination mirroring group, 174
for
configuring CPE (CWMP), 126
remote
configuring CPE attributes (CWMP), 128
configuring remote probe VLAN for remote source
mirroring group, 173
configuring CPE close-wait timer (CWMP), 130
operation (NQA), 12
configuring CPE
(CWMP), 128
test and probe (NQA), 11
configuring CWMP, 125, 131, 132
274
username
and
password
configuring maximum number of dynamic sessions
allowed (NTP), 64
configuring CWMP connection interface, 129
configuring DHCP server (CWMP), 125
configuring maximum number of retry connection
attempts (CWMP), 130
configuring DHCP test (NQA), 15, 16, 35
configuring DLSw test (NQA), 26, 50
configuring maximum PoE interface power, 89
configuring DNS test (NQA), 16, 36
configuring member device (cluster management),
152
configuring egress port for remote source mirroring
group, 172
configuring mirroring CPUs for Layer 3 local
mirroring group, 179
configuring Ethernet statistics group (RMON), 115
configuring FTP test (NQA), 17, 37
configuring history group (RMON), 116
configuring mirroring CPUs for local mirroring
group, 168
configuring history record saving function (NQA),
30
configuring mirroring CPUs for remote source
mirroring group, 172
configuring HTTP test (NQA), 18, 38
configuring mirroring port for local mirroring
group, 168
configuring ICMP echo test (NQA), 33
configuring mirroring port in interface view, 168
configuring information center, 231, 244
configuring mirroring port in system view, 168
configuring interaction for a cluster, 155
configuring mirroring ports for Layer 3 local
mirroring group, 178
configuring IPC, 82
configuring IPv6 NetStream, 210, 217
configuring mirroring ports for remote source
mirroring group, 171
configuring IPv6 NetStream aggregation data
export, 214, 218
configuring mirroring ports in interface view, 178
configuring IPv6 NetStream data export, 213
configuring mirroring ports in system view, 178
configuring IPv6 NetStream data export attributes,
216
configuring monitor port for
mirroring group, 179
Layer
configuring IPv6 NetStream data export format,
216
configuring monitor port
mirroring group, 173
remote
configuring IPv6 NetStream
export, 213, 217
data
configuring monitor port for the local mirroring
group, 169
configuring IPv6 NetStream version 9 template
refresh rate, 216
configuring monitor port in interface view, 169,
179
configuring Layer 2 remote port mirroring, 181
configuring monitor port in system view, 169, 179
configuring Layer 3 local mirroring groups, 178
configuring Layer 3 remote port mirroring, 185
configuring MPLS VPN time synchronization in
client/server mode, 78
configuring local mirroring with multiple monitor
ports, 175, 183
configuring MPLS VPN time synchronization in
symmetric peers mode, 80
configuring local port mirroring, 180
configuring multicast client, 63
configuring
management
management), 146
traditional
device
for
3
local
source
configuring multicast server, 63
(cluster
configuring
NDP
management), 146
275
parameters
(cluster
configuring PoE interface power management, 89,
90
configuring NetStream, 193, 207
configuring NetStream ACL-based filtering, 199
configuring PoE interface through PoE profile, 91
configuring NetStream aggregation data export,
202, 208
configuring PoE monitoring function, 90
configuring NetStream data export, 201
configuring PoE power, 89
configuring NetStream data export attributes, 203
configuring PoE power management, 89
configuring NetStream data export format, 203
configuring PoE profile, 91
configuring NetStream filtering, 199
configuring PSE power monitoring (PoE), 90
configuring NetStream flow aging, 206
configuring remote destination mirroring group (on
the destination device), 173
configuring NetStream QoS-based filtering, 199
configuring remote probe VLAN
destination mirroring group, 174
configuring NetStream sampling, 199, 201
configuring NetStream traditional data export,
201, 207
configuring remote source mirroring group (on the
source device), 171
configuring network management-specific interface
index (SNMP), 100
configuring RMON alarm function, 113
configuring RMON Ethernet statistics function, 112
configuring NQA collaboration, 51
parameters
configuring RMON history statistics function, 112
(cluster
configuring RMON statistics function, 111
configuring NTP, 68
configuring sampler, 162, 163
configuring NTP authentication, 65
configuring sFlow, 223
configuring NTP broadcast mode, 62, 71
configuring sFlow agent, 221
configuring
NTP
authentication, 76
broadcast
mode
configuring sFlow collector, 221
with
configuring sFlow counter sampling, 222
configuring NTP client authentication, 66
configuring sFlow sampling, 222
configuring NTP client/server mode, 68
configuring NTP client/server
authentication, 75
remote
configuring remote probe VLAN for remote source
mirroring group, 173
configuring NetStream version 9 template refresh
rate, 205
configuring
NTDP
management), 147
for
mode
configuring SNMP, 96, 97
with
configuring SNMP configuration synchronization
function (cluster management), 156
configuring NTP multicast mode, 63, 72
configuring SNMP logging, 101, 107
configuring NTP optional parameters, 63
configuring SNMP test (NQA), 21, 43
configuring NTP server authentication, 67
configuring SNMP trap, 102
configuring NTP symmetric peers mode, 69
configuring SNMPv1, 105
configuring PD disconnection detection mode
(PoE), 88
configuring SNMPv2c, 105
configuring SNMPv3, 106
configuring ping, 1
configuring statistics collection function (NQA), 29
configuring ping and tracert, 7
configuring synchronous information output, 242
configuring PoE, 93
276
enabling cluster function (cluster management),
148, 152
configuring system debugging, 6
configuring TCP test (NQA), 22, 44
enabling CWMP, 127
configuring test group optional parameters (NQA),
31
enabling display of system information on a
monitor terminal, 233
configuring the NTP symmetric peers mode, 61
enabling display of system information on the
console, 232
configuring threshold monitoring (NQA), 28
configuring tracert, 4
enabling IPC performance statistics, 83
configuring trap parameters (SNMP), 103
enabling IPv6 NetStream, 213
configuring UDP echo test (NQA), 23, 45
enabling local mirroring with remote probe VLAN,
175
configuring UDP jitter test (NQA), 19, 20, 40
configuring voice test (NQA), 24, 25, 47
enabling management VLAN
(cluster management), 149
configuring web user accounts in batches (cluster
management), 157
auto-negotiation
enabling NDP (cluster management), 146, 152
creating local mirroring group, 167
enabling NetStream, 199
creating remote destination mirroring group, 173
enabling NetStream on interface, 199
creating remote source mirroring group, 171
enabling NTDP (cluster management), 147, 152
creating sampler, 162
enabling PoE, 87
detecting PDs (PoE), 88
enabling PoE for a PoE interface, 87
disabling interface receiving NTP messages, 64
enabling PSE to detect nonstandard PDs (PoE), 88
disablng a port from generating linkup/linkdown
logging information, 242
enabling SNMP logging, 101
enabling trap function (SNMP), 102
displaying cluster management, 157
establishing a cluster (cluster management), 148
displaying CWMP, 131
maintaining cluster management, 157
displaying information center, 243
maintaining CWMP, 131
displaying IPC, 84
maintaining information center, 243
displaying IPv6 NetStream, 217
maintaining IPC, 84
displaying NetStream, 207
maintaining IPv6 NetStream, 217
displaying NQA, 33
maintaining NetStream, 207
displaying NTP, 67
maintaining PoE, 93
displaying PoE, 93
maintaining RMON, 114
displaying port mirroring, 180
maintaining sampler, 162
displaying RMON, 114
maintaining SNMP, 104
displaying sampler, 162
managing security log file, 240
displaying sFlow, 222
displaying SNMP, 104
manually collecting topology information (cluster
management), 148, 152
displaying traffic mirroring, 191
mirroring traffic to CPU, 189
277
protocol
mirroring traffic to interface, 188
configuring cluster management protocol packets,
150
monitoring PD (PoE), 90
outputting log information (console), 247
SNMP protocol version, 96
outputting log information (Linux log host), 245
specification (PoE), 86
outputting log information (UNIX log host), 244
PSE
outputting system information to console, 232
enabling PSE to detect nonstandard PDs (PoE), 88
outputting system information to log buffer, 235
upgrading PSE processing software in service
(PoE), 92
outputting system information to log host, 234
outputting system information to monitor terminal,
233
QoS
applying policy (traffic mirroring), 190
outputting system information to SNMP module,
236
NetStream filtering configuration, 199
traffic mirroring configuration, 188, 191
outputting system information to trap buffer, 235
query (NTP access-control right), 65
outputting system information to web interface,
237
random (sampler mode), 162
rebooting member device (cluster management),
152
rebooting
member device (cluster management), 152
removing member device (cluster management),
151
reflector port (port mirroring), 175
saving security logs into security log file, 239, 248
refresh rate
saving system information to log file, 238
IPv6 NetStream version 9, 216
scheduling test group (NQA), 32
NetStream version 9, 205
remote
sending Inform message (CWMP), 129
sending Inform message at a specific time
(CWMP), 130
assigning monitor port to remote probe VLAN,
174
sending Inform message periodically (CWMP),
129
configuring egress port for remote source mirroring
group, 172
specifying NTP message source interface, 63
configuring mirroring CPUs for remote source
mirroring group, 172
switching format of NM-specific ifindex, 100
configuring mirroring ports for remote source
mirroring group, 171
topology management (cluster management), 154
troubleshooting sFlow configuration, 224
configuring monitor port for remote destination
mirroring group, 173
processing
configuring remote probe VLAN
destination mirroring group, 174
upgrading PSE processing software in service
(PoE), 92
for
remote
configuring remote probe VLAN for remote source
mirroring group, 173
profile
applying PoE profile, 91
creating remote destination mirroring group, 173
configuring PoE interface through PoE profile, 91
creating remote source mirroring group, 171
configuring PoE profile, 91
278
methods (CWMP), 123
Layer 2 remote port mirroring, 165
RST-triggered aging (NetStream flow), 206
Layer 3 remote port mirroring, 166
rule (system information), 227
remote probe VLAN
sampler
enabling local mirroring, 175
configuration, 162
removing
configuring, 163
member device (cluster management), 151
creating, 162
RMON
alarm group, 110
displaying, 162
configuration, 109
maintaining, 162
sampling. See also sampler
configuring alarm function, 113
configuring alarm group, 118
NetStream configuration, 197, 199, 201
configuring Ethernet statistics function, 112
sFlow configuration, 222
configuring Ethernet statistics group, 115
sFlow counter configuration, 222
saving
configuring history group, 116
configuring history statistics function, 112
security logs into security log file, 239, 248
configuring statistics function, 111
system information to log file, 238
displaying, 114
saving (NQA history function), 30
Etherenet statistics group, 110
scheduling
event group, 110
NQA test group, 32
group, 110
test group (NQA), 32
security
history group, 110
maintaining, 114
managing security log file, 240
private alarm group, 111
saving security logs into security log file, 239, 248
sending
working mechanism, 109
Inform message (CWMP), 129
role
Inform message at a specific time (CWMP), 130
cluster, 140
Inform message periodically (CWMP), 129
route mode
port mirroring, 164
serial number (system information), 231
sFlow, 220, 223
server. See also client
configuring ACS server (CWMP), 126, 127
routing
NTP configuration, 54
configuring client/server mode (NTP), 61
port mirroring configuration, 180
configuring DHCP server (CWMP), 125
route mode (port mirroring), 164
configuring DNS server (CWMP), 126
route mode (sFlow), 220, 223
configuring NTP server authentication, 67
multicast configuration (NTP), 63
RPC
279
NQA, 12
protocol version, 96
NTP access-control right, 65
switching format of NM-specific ifindex, 100
test configuration (NQA), 43
service
software
upgrading PSE processing software in service
(PoE), 92
upgrading PSE processing software in service
(PoE), 92
severity level (system information), 226
source
sFlow
configuring remote source mirroring group (on the
source device), 171
configuration, 220, 221, 223
configuring agent, 221
field (system information), 231
configuring collector, 221
module (system information output), 227
configuring counter sampling, 222
specifying
configuring sampling, 222
message source interface (NTP), 63
displaying, 222
standby
operation, 220
active and standby ACS switchover (CWMP), 124
troubleshooting configuration, 224
statistics
SNMP
configuring collection function (NQA), 29
configuration, 96
configuring Ethernet statistics group (RMON), 115
configuring, 97
configuring RMON history statistics function, 112
configuring logging, 101, 107
configuring RMON statistics function, 111
configuring network management-specific interface
index, 100
data export (IPv6 NetStream), 211
data export (NetStream), 195
configuring SNMP configuration synchronization
function (cluster management), 156
data
export
attribute
NetStream), 216
configuring SNMPv1, 105
configuration
(IPv6
data export attribute configuration (NetStream),
203
configuring SNMPv2c, 105
configuring SNMPv3, 106
data export configuration (IPv6 NetStream), 213
configuring test (NQA), 21
data export configuration (NetStream), 201
configuring trap, 102
data export format (IPv6 NetStream), 212
configuring trap parameters, 103
data export formats (NetStream), 196
displaying, 104
enabling IPC performance statistics, 83
enabling logging, 101
Ethernet statistics group (RMON), 110
enabling trap function, 102
IPv6 NetStream configuration, 210, 217
maintaining, 104
IPv6 NetStream flow concept, 210
mechanism, 96
NetStream configuration, 193, 207
MIB overview, 97
NetStream filtering, 197
outputting system information to module, 236
280
NetStream flow concept, 193
ping, 7
NetStream sampling, 197
tracert, 3, 7
system information
RMON Ethernet statistics function, 112
sFlow configuration, 220, 221, 223
%% (vendor ID) field, 230
sFlow operation, 220
channels, 226
configuring synchronous information output, 242
status
content field, 231
monitoring CPE status and performance (CWMP),
121
default output rules, 227
subscription service, 252
digest field, 230
support and other resources, 252
disablng a port from generating linkup/linkdown
logging information, 242
supporting
collaboration function (NQA), 9
enabling display on a monitor terminal, 233
multiple test types (NQA), 9
format, 228
threshold monitoring (NQA), 10
information center configuration, 225, 231, 244
module field, 230
switching
format of NM-specific ifindex (SNMP), 100
output destination, 226
NTP configuration, 54
outputting by source module, 227
port mirroring configuration, 180
outputting console, 232
outputting to log buffer, 235
switchover
outputting to log host, 234
active and standby ACS switchover (CWMP), 124
symbols, 253
outputting to monitor terminal, 233
symmetric peers (NTP operation mode)
outputting to SNMP module, 236
configuration, 60, 61, 69
outputting to trap buffer, 235
configuring MPLS VPN time synchronization, 80
outputting to web interface, 237
overview, 57, 58
PRI (priority) field, 229
saving security logs into security log file, 239, 248
synchronization
saving to log file, 238
configuring SNMP configuration synchronization
function (cluster management), 156
serial number field, 231
synchronization (NTP access-control right), 65
severity level, 226
synchronous information output, 242
severity level field, 230
sysname (host name or host IP address), 230
source field, 231
system
sysname field, 230
CPE system file management (CWMP), 121
timestamp field, 229
system administration
types, 226
debugging, 1, 5, 6
vv field, 230
maintenance, 1
281
configuring voice test (NQA), 24
system view
configuring mirroring port, 168
creating NQA test group, 14
configuring monitor port, 169
enabling NQA client, 14
multiple test types (NQA), 9
TCP
configuring test (NQA), 22
NQA collaboration configuration, 51
FIN- and RST-triggered aging (NetStream flow),
206
NQA configuration, 9, 33
NQA DHCP test configuration, 35
test configuration (NQA), 44
NQA DLSw test configuration, 50
technology
NQA DNS test configuration, 36
IPv6 NetStream, 211
NQA FTP test configuration, 37
NetStream, 194
NQA HTTP test configuration, 38
template
NQA ICMP echo test configuration, 33
IPv6 NetStream version 9, 216
NQA server configuration, 13
NetStream version 9, 205
NQA SNMP test configuration, 43
test and probe (NQA), 11
NQA TCP test configuration, 44
test group (NQA), 11
NQA UDP echo test configuration, 45
testing
NQA UDP jitter test configuration, 40
configuring collaboration function (NQA), 27
NQA voice test configuration, 47
configuring DHCP test (NQA), 15
scheduling test group (NQA), 32
configuring DLSw test (NQA), 26
test and probe (NQA), 11
configuring FTP test (NQA), 17
test group (NQA), 11
configuring history record saving function (NQA),
30
threshold monitoring (NQA), 10, 28
timer
configuring HTTP test (NQA), 18
configuring CPE close-wait timer (CWMP), 130
configuring ICMP echo test (NQA), 14
data export (IPv6 NetStream), 211
configuring NQA collaboration function, 27
data export (NetStream), 195
configuring NQA test group, 14
data
export
attribute
NetStream), 216
configuring NQA threshold monitoring, 28
configuring SNMP test (NQA), 21
configuration
(IPv6
configuring statistics collection function (NQA), 29
data export attribute configuration (NetStream),
203
configuring TCP test (NQA), 22
data export configuration (IPv6 NetStream), 213
configuring test group optional parameters (NQA),
31
data export configuration (NetStream), 201
data export format (IPv6 NetStream), 212
configuring threshold monitoring (NQA), 28
data export formats (NetStream), 196
configuring UDP echo test (NQA), 23
timestamp
configuring UDP jitter test (NQA), 19
probe operation (NQA), 12
282
trapping
system information, 229
default output rules (system information), 227
topology
configuring
topology
management), 154
management
information center configuration, 225, 231, 244
(cluster
outputting system information to trap buffer, 235
manually collecting topology information (cluster
management), 148, 152
troubleshooting
information center configuration, 225, 231, 244
tracert
PoE, 94
configuring, 4
sFlow configuration, 224
tracert command, 3, 4, 7
type
traditional data export
port mirroring, 164
IPv6 NetStream, 211
types
NetStream, 195
system information, 226
traffic
UDP
IPv6 NetStream configuration, 210, 217
configuring echo test (NQA), 23
IPv6 NetStream flow concept, 210
configuring jitter test (NQA), 19, 20
mirroring. See traffic mirroring
data export formats (NetStream), 196
NetStream configuration, 193, 207
echo test configuration (NQA), 45
NetStream filtering, 197
IPv6 NetStream version 9 data export format, 212
NetStream flow concept, 193
jitter test configuration (NQA), 40
NetStream sampling, 197
unicast (IPC packet sending mode), 83
sFlow configuration, 220, 221, 223
UNICOM system information format, 228
sFlow operation, 220
UNIX log host, 244
traffic mirroring
upgrading
applying QoS policy, 190
PSE processing software in service, 92
applying QoS policy globally, 191
URL
applying QoS policy to interface, 190
configuring ACS URL (CWMP), 127
applying QoS policy to VLAN, 190
user
configuration, 188, 191
configuring web user accounts in batches (cluster
management), 157
displaying, 191
to CPU, 189
username
to interface, 188
transmission (IPC configuration), 82
trap
configuring SNMP trap, 102
configuring ACS
(CWMP), 127
username
and
password
configuring CPE
(CWMP), 128
username
and
password
version
configuring trap parameters (SNMP), 103
enabling trap function (SNMP), 102
283
configuring IPv6 NetStream version 9 template
refresh rate, 216
enabling local port mirroring with remote probe
VLAN, 175
configuring NetStream version 9 template refresh
rate, 205
enabling management VLAN
(cluster management), 149
IPv6 NetStream version 9 data export format, 212
management VLAN (cluster management), 143
voice test
NetStream version 5 data export format), 196
NetStream version 8 data export format, 196
configuration (NQA), 47
NetStream version 9 data export format, 196
configuring (NQA), 24, 25
vv (system information), 230
SNMP protocol version, 96
web
VLAN
configuring web user accounts in batches (cluster
management), 157
applying QoS policy (traffic mirroring), 190
assigning monitor port to remote probe VLAN,
174
configuring remote probe VLAN
destination mirroring group, 174
auto-negotiation
for
outputting system information to web interface,
237
remote
websites, 252
configuring remote probe VLAN for remote source
mirroring group, 173
284