1
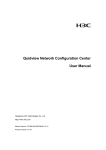
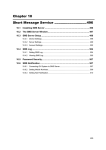
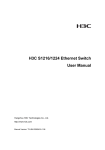
User Manual
Quidview IPSec VPN Service Monitor
Table of Contents
Table of Contents
Chapter 1 System Description ..................................................................................................... 1-1
1.1 Quidview NMS System Description ................................................................................... 1-1
1.2 Introduction to IPSec VPN Service Monitor....................................................................... 1-2
1.2.1 Component Overview.............................................................................................. 1-2
1.2.2 Introduction to IPSec VPN Service Monitor Interface ............................................. 1-3
Chapter 2 IPSec VPN Topology Management ............................................................................ 2-1
2.1 Viewing Device Tunnel Topology ...................................................................................... 2-1
2.2 Auto-refreshing Topology .................................................................................................. 2-1
Chapter 3 IPSec VPN Tunnel Management................................................................................. 3-1
3.1 Browsing Tunnel ................................................................................................................ 3-1
3.1.1 Information of All Tunnels of a Single Device ......................................................... 3-2
3.1.2 Information of Tunnel Between Two Devices ......................................................... 3-2
3.2 Manually Refreshing Tunnel Information........................................................................... 3-3
3.3 Setting Device Tunnel Fault Switch ................................................................................... 3-3
3.4 Device Tunnel History........................................................................................................ 3-3
Chapter 4 IPSec VPN Performance Management ...................................................................... 4-1
4.1 Introduction to Performance Management ........................................................................ 4-1
4.2 Introduction to Performance Template .............................................................................. 4-2
4.3 At A Glance of VPN ........................................................................................................... 4-3
4.3.1 At A Glance ............................................................................................................. 4-3
4.3.2 Setting At A Glance................................................................................................. 4-5
4.3.3 TopN........................................................................................................................ 4-5
4.3.4 Browsing Historical Data ......................................................................................... 4-5
4.3.5 Monitoring Data in Real Time.................................................................................. 4-5
4.3.6 Setting Global Thresholds....................................................................................... 4-6
4.3.7 Setting Thresholds .................................................................................................. 4-6
4.4 Monitor Task Management ................................................................................................ 4-6
4.4.1 Detail Data and Report Data ................................................................................... 4-6
4.4.2 Viewing Tasks ......................................................................................................... 4-7
4.4.3 Creating a Task ....................................................................................................... 4-7
4.4.4 Suspending Tasks................................................................................................... 4-7
4.4.5 Modifying Task Properties....................................................................................... 4-8
4.4.6 Resuming Suspended Tasks .................................................................................. 4-8
4.4.7 Deleting Tasks......................................................................................................... 4-8
4.5 Data Browsing.................................................................................................................... 4-8
4.5.1 Detail Data............................................................................................................... 4-8
4.5.2 Report Data ............................................................................................................. 4-8
i
User Manual
Quidview IPSec VPN Service Monitor
Table of Contents
4.6 Deleted Task Management................................................................................................ 4-9
4.7 Realtime Monitoring........................................................................................................... 4-9
4.8 Device Performance Monitoring ........................................................................................ 4-9
4.8.1 Creating a Monitor Task........................................................................................ 4-10
4.8.2 Generating Fault Information ................................................................................ 4-10
4.8.3 Browsing and Locating Fault Information.............................................................. 4-10
4.8.4 Acknowledging Performance Fault Information .................................................... 4-10
Chapter 5 Typical Applications.................................................................................................... 5-1
5.1 How to Browse VPN Tunnel Information ........................................................................... 5-1
5.1.1 Prerequisites ........................................................................................................... 5-1
5.1.2 Network Diagram..................................................................................................... 5-1
5.1.3 Browsing Topology.................................................................................................. 5-2
5.1.4 Browse Tunnel Information ..................................................................................... 5-3
5.2 How to Monitor Performance of VPN Device .................................................................... 5-6
5.2.1 Prerequisites ........................................................................................................... 5-6
5.2.2 Configuration ........................................................................................................... 5-6
Chapter 6 FAQ ............................................................................................................................... 6-1
Chapter 7 Acronyms ..................................................................................................................... 7-1
ii
User Manual
Quidview IPSec VPN Service Monitor
Chapter 1 System Description
Chapter 1 System Description
1.1 Quidview NMS System Description
With increasing demand for information in different industries and boosts in the
construction of a variety of networks, such as enterprise network and campus area
network (CAN), network management is confronted with the issues of how to provide
easy and efficient management for devices. In addition, the popularity of networks and
the explosion of network subscribers allow a boom of various types of networks. As the
network offers convenience for end users, network security is becoming a major
concern. The Quidview Network Management System (NMS) offers an ultimate
solution for users to monitor, maintain, and manage their networks with ease.
The Quidview NMS builds on modular structure and can implement such features as
device management, VPN monitoring and deployment, software upgrade management,
configuration file management, and fault management.
The Quidview NMS supports Windows XP/2000. Its architecture is shown in Figure 1-1.
Figure 1-1 Quidview system architecture
In the above figure, the Quidview NMS consists of the following components:
z
Network Management Framework (NMF): Provides some basic functions such as
user management, resource management, log management, fault management,
performance management, and device log management. It is the basic
component for other service components.
z
Network Management Framework for Small to Medium Business (NMF-SMB): A
lite version of NMF for small to medium businesses. Provides some basic
functions such as user management, automatic discovery, topology management,
fault management, and real-time monitoring.
1-1
User Manual
Quidview IPSec VPN Service Monitor
z
Chapter 1 System Description
Device Manager (DM): Provides such functions as panel display, configuration
management, realtime monitoring for switches and routers. It can be either
installed standalone or included in the NMF.
z
IPSec VPN Service Monitor (VSM): Monitors the performance of IPSec VPN
gateways.
z
IPSec VPN Service Deployment Manager (VDM): Provides deployment function
for IPSec VPN gateways.
z
Network
Configuration
Center
(NCC):
Includes
software
upgrade
and
configuration file management features that provide software backup and upgrade
for network devices and centralized management on configuration files.
z
Branch Intelligent Management System (BIMS): Provides software upgrade for
edge access and SOHO devices, and centralized management on configuration
files without the integration into NMF. It can be either installed standalone or
integrated into NMF.
z
Wireless Control Management System (WCMS): Provides radio parameter
settings and performance monitor for wireless devices.
These service components are relatively independent, and can be included in the NMF
with a significant impact on the scalability of the entire system.
Note:
z
This manual only takes the Windows operating system as an example to introduce
the functions and usage of IPSec VPN Service Monitor. For detailed operations,
refer to the online help.
z
For information about installation and operation, refer to Quidview Installation
Manual.
1.2 Introduction to IPSec VPN Service Monitor
1.2.1 Component Overview
With the increasing concern over network security, VPN technology has drawn a good
deal of deployment. IPSec VPN monitor component can provide realtime monitor on
the operating state (including CPU usage and memory usage indices) and performance
of VPN gateways and the state information on VPN tunnel, receive and analyze the
alarms from the gateway, and quickly locate problems and view traffic, helping plan for
a better network management and operation.
1-2
User Manual
Quidview IPSec VPN Service Monitor
Chapter 1 System Description
1.2.2 Introduction to IPSec VPN Service Monitor Interface
Upon the installation of IPSec VPN Service Monitor, a [Security] tab is added in the left
navigation pane on the interface as shown in Figure 1-2.
Figure 1-2 Quidview NMS main interface
The [Security] tab contains two navigation panes: VPN view and security management
panes.
The VPN view displays all VPN devices; the security management pane displays the
monitor functions for VPN device, including At A Glance of VPN, monitor task
management, realtime monitor, and deleted tasks management.
Note:
z
After the installation of IPSec VPN Service Monitor, the NMS automatically adds
VPN devices to the VPN view when adding devices.
z
If VPN devices have been already added to the IP view before the installation of
IPSec VPN Service Monitor, you can copy them to the VPN view.
z
Satisfying the following requirements, you can successfully add devices using the
two methods mentioned above: devices to be added support Telnet, and Telnet
parameters configured on devices and the NMS are the same.
1-3
User Manual
Quidview IPSec VPN Service Monitor
Chapter 2 IPSec VPN Topology Management
Chapter 2 IPSec VPN Topology Management
IPSec VPN topology is a start topology in which you have a tunnel as a connection from
each node, a remote device, to the main VPN hub, an IPSec VPN device. It provides an
intuitive view of connectivity between tunnels.
The topology management of Quidview VSM supports such functions as drawing and
displaying a VPN topology centered with an IPSec VPN device, as well as
auto-refreshing topology.
2.1 Viewing Device Tunnel Topology
You can view the tunnel topology of an IPSec VPN device, in which connections only
have one state (normal, indicated in green). If there is a tunnel, a connection is
displayed in the topology; if the tunnel is disconnected, the connection is deleted from
the topology. If there is no tunnel between a node to the main hub any longer, the
unmanaged node will be deleted.
2.2 Auto-refreshing Topology
For an open topology of an IPSec VPN device, if the state of the tunnel between the
main hub and node changes, the topology will be automatically refreshed.
2-1
User Manual
Quidview IPSec VPN Service Monitor
Chapter 3 IPSec VPN Tunnel Management
Chapter 3 IPSec VPN Tunnel Management
IPSec VPN tunnel management allows you to learn about the states and detailed
information of tunnels between devices, tunnel usage and information of dial-in
connection from nodes to the main hub, facilitating troubleshooting the problems of
IPSec VPN.
You can use this function to check whether a tunnel is established between VPN
devices in a VPN network, and the tunnel and security association (SA) information
about each device. You can learn the relations between the tunnels and SA of VPN
devices, and the related configurations on those devices. Tunnel information includes
the number of tunnels and the information of each tunnel.
3.1 Browsing Tunnel
You can view the information of all the tunnels of a device, as well as the information of
a tunnel between two devices.
Table 3-1 describes the parameters of IPSec tunnel information.
Table 3-1 Tunnel parameters
Parameter
Description
Local device name
Name of local device
Local IP
IP address of local device interface
Remote device ID
Unique ID of remote device
Remote IP
IP address of remote device interface
Tunnel state
Current state of tunnel, including
Tunnel source
Indicates the source is local or remote.
Key negotiation type
Key negotiation type, including IKE negotiation and manual.
Encap. mode
Packet encapsulation mode, including transport and tunnel
Num of current SAs
Total number of current SAs in tunnel
SA refresh times
Times of refreshing SAs in tunnel
SA remaining time
Remaining time of SAs in tunnel
SA lifetime
Live time of SAs in tunnel
SA remaining traffic
Remaining traffic of SAs in tunnel
DH group
Diffie-Hellamn group ID of this security proposal, including
DH1 and DH2.
3-1
User Manual
Quidview IPSec VPN Service Monitor
Chapter 3 IPSec VPN Tunnel Management
You can view the number of tunnels and the information of each SA by selecting an
entry in the list of tunnels. Table 3-2 describes the parameters of SA.
Table 3-2 SA parameters
Parameter
Description
Device name
Name of local device
SA direction
Direction of IPSec SA
SPI value
Index of IPSec SA
Security protocol
Security protocol of IPSec SA, including AH, ESP, and both
Encr. algorithm
Message encapsulation mode for security policy configured
on IPSec tunnel
Auth. algorithm
Message authentication mode of security policy configured
on IPSec tunnel
SA status
Current status of SA, including active and expiring.
Note:
The number of SAs established on each tunnel varies with the security proposal on
device in the VPN network.
z
If only AH or ESP proposal is selected, there are two SAs established on each
tunnel: one is in; the other out.
z
If both AH and ESP proposal are selected, there are four SAs established on each
tunnel. Each security proposal corresponds to one in SA and one out SA.
3.1.1 Information of All Tunnels of a Single Device
Use this function to view the information of all the tunnels of a specified IPSec VPN
device, and check whether there is a tunnel established between the device and other
nodes.
3.1.2 Information of Tunnel Between Two Devices
Use this function to view the information of a tunnel between two devices, and learn
about the number of tunnels between them and the detailed information of each tunnel.
3-2
User Manual
Quidview IPSec VPN Service Monitor
Chapter 3 IPSec VPN Tunnel Management
Note:
z
There may be several tunnels between two devices, but they are indicated just by
one link in the topology.
z
In the [Browse Tunnel] dialog box, click <Refresh> to refresh the tunnel information
in the database.
3.2 Manually Refreshing Tunnel Information
Use this function to refresh the tunnel information of an IPSec VPN device at once. To
open the topology map of that device can also refresh the topology.
3.3 Setting Device Tunnel Fault Switch
Use this function to set whether to sent an alarm to Quidview NMS when there is a
tunnel established or disconnected. This allows you to get the state of a node’s access
to the main hub and view the topology information in real time.
3.4 Device Tunnel History
Device tunnel history records the establishment and disconnection of a VPN tunnel. It
helps you learn about the tunnel usage and the state of a node’s access to the main
hub, facilitating troubleshooting the problems in IPSec VPN.
Note:
Only when the “Device Tunnel Fault Switch” is enabled and the alarm destination
address is set as the IP address of the Quidview server, tunnel history can be received
and recorded by Quidview.
I. Browsing tunnel history
Use this function to browse the tunnel connection and disconnection records of a
device. It supports a multipage view.
Tunnel history includes: no., remote IP, tunnel action, duration, security protocol, AH
auth. algorithm, ESP auth. algorithm, ESP encr. algorithm, key negotiation type,
message encap. mode.
II. Querying tunnel history
The browse tunnel history function can filter records, thus facilitating a specified record
query. The filter conditions include: duration, tunnel action, and security protocol.
3-3
User Manual
Quidview IPSec VPN Service Monitor
Chapter 3 IPSec VPN Tunnel Management
III. Backing up tunnel history
Quidview NMS can save up to 10,000 recodes. If the recodes exceeds the limit,
Quidview NMS only keep the last 5,000 recodes, and backup the rest to a file under
Quidview3\server\backup\vsm.
3-4
User Manual
Quidview IPSec VPN Service Monitor
Chapter 4 IPSec VPN Performance Management
Chapter 4 IPSec VPN Performance Management
4.1 Introduction to Performance Management
Performance management provides the capability to collect and retrieve performance
data about the devices on the network, allowing you to monitor their operating histories
and current states. Through historical data, you can perform a trend analysis of the
network and learn its operating state and performance to locate the bottleneck. This
helps you plan or adjust your network better. By monitoring the current state of devices,
you can diagnose faults of devices, and then prevent network failures so as to manage
and operate your networks better.
Performance management allows you to collect and retrieve basic performance data
about the monitored devices and their ports. It comprises three parts: At A Glance of
VPN, Realtime Monitor Management, and Monitor Task Management.
z
At A Glance of VPN: Displays summaries of device performance indices,
facilitating information browsing and problem location.
z
Realtime Monitor: Collects and displays realtime data based on the condition that
you set. It displays the operating performance at the network, device and port
levels, facilitating network and device troubleshooting.
z
Monitor Task: Collects the performance data about the monitored network, device,
or port and checks it against the specified thresholds. By reading the performance
trend presented by Monitor Task, you can find out the network bottleneck, predict
network traffic model, and optimize the network.
The Quidview NMF provides various functions for performance management. With the
IPSec VPN monitor component, the Quidview NMF can provide realtime monitoring on
the operating state (including CPU usage and memory usage indices) of VPN gateway
and the state information on VPN tunnel, and receive and analyze the alerts from the
gateway.
The following table describes several concepts about performance management.
Table 4-1 Basic concepts
Concept
Description
Performance template
A parameter used for evaluating operating performance
of systems (elements, network management stations,
or networks).
Monitored object
The administered object about which performance data
is collected. It can be a device, card, or port.
4-1
User Manual
Quidview IPSec VPN Service Monitor
Chapter 4 IPSec VPN Performance Management
Concept
Description
A way of scheduling performance data collection.
During the specified time period, the system collects
data about the specified monitored object according to
the specified performance template.
Task
4.2 Introduction to Performance Template
IPSec VPN performance monitor includes general performance template and VPN
device-specific performance template. The Table 4-2 describes the general
performance templates.
Table 4-2 General performance templates available in the NMS
Category
Performance Template
IPSec VPN-device basic
information
CPU usage (%), memory usage (%), number of critical
alarms, number of unconfirmed critical alarms, number
of major alarms, number of unconfirmed major alarms,
average critical alarm increment, average major alarm
increment, interface receiving rate (bytes/s), interface
transmitting rate (bytes/s)
VPN device-specific templates are specified performance management templates
based on VPN device. The Table 4-3 describes VPN device-specific templates.
Table 4-3 VPN device-specific templates
Category
IPSec VPN-IPSec
tunnel
Performance Template
IPSec tunnel receiving rate (bytes/s), IPSec tunnel
receiving rate (packets/s), number of IPSec tunnel
discarded packets, IPSec tunnel sending rate (bytes/s),
IPSec tunnel sending rate (packets/s), number of IPSec
tunnel discarded packets, discarding rate of inbound
packets on IPSec tunnel (%), discarding rate of outbound
packets on IPSec tunnel (%)
4-2
User Manual
Quidview IPSec VPN Service Monitor
Chapter 4 IPSec VPN Performance Management
Category
Performance Template
IPSec VPN-IPSec
global stat.
Average of active IPSec tunnels, average of active IPSec
SA, receiving rate of all IPSec tunnels (bytes/s), receiving
rate of all IPSec tunnels (packets/s), number of inbound
packets discarded on all IPSec tunnels, number of discard
packets received repeatedly on all IPSec tunnels, inbound
authentication failures on all IPSec tunnels, inbound
decryption errors on all IPSec tunnels, sending rate of all
IPSec tunnels (bytes/s), sending rate of all IPSec tunnels
(packets/s), number of outbound packets discarded on all
IPSec tunnels, number of discard packets on all IPSec
tunnels for insufficient memory, number of discard
packets on all IPSec tunnels for SA loss, number of
discard packets on all IPSec tunnels for full queue,
number of discard packets on all IPSec tunnels for invalid
length, number of discard packets on all IPSec tunnels for
too long packet, number of discard packets on all IPSec
tunnels for invalid SA, discarding rate of inbound packets
on all IPSec tunnels (%), discarding rate of outbound
packets on all IPSec tunnels (%)
IPSec VPN-IKE tunnel
IKE tunnel receiving rate (bytes/s), IKE tunnel receiving
rate (packets/s), number of inbound packet discarded on
IKE tunnel, sending rate of IKE tunnel (bytes/s), sending
rate of IKE tunnel (packets/s), number of outbound
packets discarded on IKE tunnel
IPSec VPN-IKE global
statistics
Average of active IKE tunnels, receiving rate of all IKE
tunnels (bytes/s), receiving rate of all IKE tunnels
(packets/s), number of inbound packets discarded on all
IKE tunnels, sending rate of all IKE tunnels (bytes/s),
sending rate of all IKE tunnels (packets/s), number of
outbound packets discarded on all IKE tunnels, increment
of local initialized IKE tunnels, number of local initialization
failed IKE tunnels, increment of remote initialized IKE
tunnels, number of remote initialization failed IKE tunnels
4.3 At A Glance of VPN
4.3.1 At A Glance
The At A Glance function presents both realtime and historical performance data about
11 monitored performance indices for a device in a time range. You can specify the
number of devices and items to be monitored, and the number of specified top n
devices in terms of a performance index along with their performance index values.
Also, you can view the raw or realtime data of a specified device, and the thresholds for
performance indices.
4-3
User Manual
Quidview IPSec VPN Service Monitor
Chapter 4 IPSec VPN Performance Management
I. Presenting performance data
After you set the devices and items to be monitored by At A Glance, the system collects
data about the 11 crucial performance indices of these devices at five-minute intervals.
As the number of the monitored devices grows, enormous performance data can be
generated. The system can however present the data neatly at the following intervals,
and automatically delete the expired data over a specified time range.
z
10-minute report data summarized from raw data every 10 minutes. The system
retains only the 10-minute report data for the last week;
z
Hourly report data summarized from 10-minute report data every hour. The
system retains only hourly report data for the last month;
z
Daily report data summarized from hourly report data every day. The system
retains the daily report data for the last year.
II. Setting monitored performance indices
Among all the performance indices, At A Glance monitors only 11 crucial indices in 5
categories:
z
CPU Usage: Percentage of CPU usage;
z
Memory Usage: Percentage of memory usage;
z
Device alarm: Average critical alarm increment, and average major alarm
increment;
z
IPSec global: Average of active IKE tunnels, average of active IPSec tunnels, and
average of active IPSec SAs;
z
IPSec Traffic: Receiving rate of all IPSec tunnels (packets/s), sending rate of all
IPSec tunnels (packets/s), discarding rate of inbound packets on all IPSec tunnels
(%), and discarding rate of outbound packets on all IPSec tunnels (%);
When creating At A Glance of VPN, you can specify whether to monitor each item listed
above. After the creation, you can configure instances for each monitored item of these
items, for example, specify to monitor a specific CPU of a device.
III. Time range for At A Glance
The system presents a report of performance data depending on your time range
selection:
z
Recent: Presents the performance data collected the last time;
z
Past 1 hour: Presents the summary of the performance data collected in the last
hour. One hour’s worth of data spans from December 24, 2004 14:30:30 to
December 24, 2004 15:30:30;
z
Today: Presents the 10-minute report data summarized from the raw data
spanning from 00:00:00 of today to the present. One day’s worth of data spans
from December 24, 2004 00:00:00 to December 24, 2004 15:30:30. On the curve
line, each dot represents a 10-minute report data value.
4-4
User Manual
Quidview IPSec VPN Service Monitor
z
Chapter 4 IPSec VPN Performance Management
This week: Presents the hourly report data summarized from the 10-minute report
data spanning from 00:00:00 of this Monday to the present. One week’s worth of
data spans from Monday December 20, 2004 00:00:00 to Friday December 24,
2004 15:30:30. On the curve line, each dot represents an hourly report data value.
z
This month: Presents this month’s summary of the performance data spanning
from 00:00:00 the first day of this month to the present. One month’s worth of data
spans from December 1, 2004 00:00:00 to December 24, 2004 15:30:30.
z
This year: Presents this year’s summary of the performance data spanning from
00:00:00 on January 1 of this year. One year’s worth of data spans from January 1,
2004 00:00:00 to December 24, 2004 15:30:30.
These data summaries are formed by summarizing raw data, 10-minute report data,
hourly-report data, and daily report data respectively.
4.3.2 Setting At A Glance
At A Glance allows you to select the devices to be monitored.
4.3.3 TopN
You can use the TopN function to view in terms of a performance index the specified
number of the devices on the top of the list and their corresponding performance index
values.
4.3.4 Browsing Historical Data
At A Glance can display the collected raw data about a device, presenting the
performance trend of the device with respect to total 11 or some performance indices
within a time range. You can select a table or a graph mode such as line or bar, and
specify the desired time range.
At A Glance can present a performance index at its maximum, minimum, and average
within a specified time range. In addition, it provides statistics about the time for
performance index reaching the maximum and descending to the minimum, first-level
alarm threshold exceeding count, and second-level alarm threshold exceeding count.
At A Glance retains the monitored data for at least 24 hours, and some data may be
hold for nearly two days. (Because data deletion is performed on data retained for over
24 hours at midnight everyday). The valid time range for AT A Glance of raw data is
from current time back to yesterday 00:00:00. If your selection is beyond this time range,
there is no data in the excessive range.
4.3.5 Monitoring Data in Real Time
At A Glance can monitor and present data about the 11 performance indices in real time.
You can however specify the number of monitored performance indices and monitor
interval as needed.
4-5
User Manual
Quidview IPSec VPN Service Monitor
Chapter 4 IPSec VPN Performance Management
In addition, you can view a performance index at its current value, maximum, minimum,
and average in real time.
4.3.6 Setting Global Thresholds
You can set the default thresholds of monitored performance indices, including Alarm 1
and Alarm 2. When the value of a monitored index exceeds its Alarm 1 or Alarm 2
threshold, the system generates the corresponding fault information. When the index
value is decreased below the threshold, the system acknowledges the fault
automatically by sending a fault recovery message.
4.3.7 Setting Thresholds
You can set performance index thresholds for the specified device. These thresholds
are restricted to the device. If no fault alarm thresholds are set for the device, the global
thresholds would apply.
4.4 Monitor Task Management
You can create and manage monitor tasks. When doing this, you can specify the
interval, start time, and end time for a monitor task. In addition, you can set a fault alarm
mechanism for the task, allowing the system to generate fault information when the
collected performance data exceeds a specified threshold.
Monitor task management operations include create, delete, suspend, change
properties, resume, and view data.
4.4.1 Detail Data and Report Data
Detail data is the raw data collected at a specified interval by each performance task
after its creation. When a large number of performance tasks and monitored instances
exist, enormous data can be generated after a while. The system can however present
data neatly using:
z
Ten-minute report data summarized from raw performance data;
z
Hourly report data summarized from 10-minute report data;
z
Daily report data summarized from hourly report data.
To decrease the load of the database and improve the overall network management
performance, the system purges the old raw data and reports based on the following
policies:
z
Detail data: The system retains only one day’s worth of raw data. To view the
performance data for the previous day, you must browse report data;
z
Ten-minute report data summarized from raw data: The system retains one
week’s worth of data. To view the performance data for the last week, you must
browse hourly or daily report data;
4-6
User Manual
Quidview IPSec VPN Service Monitor
z
Chapter 4 IPSec VPN Performance Management
Hourly report data summarized from 10-minute report data: The system retains
one month’s worth of data. To view the performance data for the last month, you
must browse daily report data;
z
Daily report data summarized from hourly report data: The system retains one
year’s worth of data. To view the performance data for the last year, you must
browse daily report data.
You must be aware of these restrictions when querying performance data. To ensure a
successful query, observe the following:
z
The summarizing interval must be equal to or greater than ten minutes. When the
summarizing interval is between ten minutes and one hour, the time range of data
must be within one week.
z
When the summarizing interval is between one hour and one day, the time range
of data must be within one month.
z
When the summarizing interval is one day or greater, the time range of data must
be within one year.
4.4.2 Viewing Tasks
Monitor Task Management presents all the tasks, describing them using the fields of
Name, Template Name, Status, Creator, and Create Time. To sort the tasks by a field,
click on the field name.
4.4.3 Creating a Task
When creating a monitor task, you may select the device to be monitored and its
performance template, and define the start time, end time, and monitor interval. For
each task, you may select multiple devices but only one performance template.
You may set alarm thresholds for a monitor task in addition to having the system
automatically check performance data against the specified alarm thresholds. When
the value of the monitored performance index exceeds Alarm 1 or Alarm 2 threshold for
any two consecutive checks, a level 1 or level 2 fault alarm is generated and reported.
Note that the severity level of Alarm 2 must be greater than Alarm 1. When the value of
the monitored performance index decreases below Alarm 1 or Alarm 2 threshold for
any two consecutive checks, the corresponding fault recovery alarm is generated. You
may view and handle the generated fault alarms in the fault management component to
remove errors and recover the device.
4.4.4 Suspending Tasks
You may suspend a running task to stop data collection.
4-7
User Manual
Quidview IPSec VPN Service Monitor
Chapter 4 IPSec VPN Performance Management
4.4.5 Modifying Task Properties
You may modify the properties of an existing task, including its task name, start time,
end time, monitor interval, threshold, monitored object, and description.
4.4.6 Resuming Suspended Tasks
You may resume a suspended task to continue data collection.
4.4.7 Deleting Tasks
You may use the Delete function to remove a monitor task.
Note:
The task is not actually deleted, but only removed to the [Deleted Task Management]
list and suspended,
4.5 Data Browsing
The performance data collected by a performance task is grouped into two categories:
detail and report.
4.5.1 Detail Data
Detail data is the raw data collected by a monitor task within the current day. To view the
performance data for the previous day, you must browse report data.
The displayed performance index values are collected at the specified interval. You
may view the monitored performance index at its maximum, minimum, and average
within a specified range. In addition, statistics are available about when the
performance index reaches its maximum and decreases to its minimum, first alarm
threshold exceeding count, second alarm threshold exceeding count, and so on.
4.5.2 Report Data
Five categories of report data are available:
z
Today: Presents the 10-minute report data summarized from the raw data
spanning from 00:00:00 of today to the present. One day’s worth of data spans
from December 24, 2004 00:00:00 to December 24, 2004 15:30:30. On the curve
line, each dot represents a 10-minute report data value.
z
This week: Presents the hourly report data summarized from the 10-minute report
data spanning from 00:00:00 of this Monday to the present. One week’s worth of
4-8
User Manual
Quidview IPSec VPN Service Monitor
Chapter 4 IPSec VPN Performance Management
data spans from Monday December 20, 2004 00:00:00 to Friday December 24,
2004 15:30:30. On the curve line, each dot represents an hourly report data value.
z
This month: Presents the hourly report data summarized from the 10-minute
report data spanning from 00:00:00 the first day of this month to the present. One
month’s worth of data spans from December 1, 2004 00:00:00 to December 24,
2004 15:30:30. On the curve line, each dot represents an hourly report data value.
z
This year: Presents the daily report data summarized from the hourly report data
spanning from 00:00:00 January 1 of this year to the present. One year’s worth of
data spans from January 1, 2004 00:00:00 to December 24, 2004 15:30:30. On
the curve line, each dot represents a daily report data value.
z
Custom: Presents the data in the customized time range. In addition to time range,
you can specify the report interval. This time range and report interval must be
valid for the system to generate the customized report.
From the report data collected by a task, you can get a view of the monitored
performance index with respect to its peak trend, valley trend, and average value trend
in the specified time range. In addition, you can know the peak, valley, and average
value at their maximum, minimum, and average.
4.6 Deleted Task Management
Deleted Task Management presents those deleted monitor tasks and the data they
collected before being deleted. If you do not want to use them any more, you can delete
them from Deleted Task Management.
4.7 Realtime Monitoring
You can browse and save the realtime data about a monitored object. When doing this,
you need to select the monitored object, performance template, and sampling interval.
The templates of realtime monitoring allows multiple choices. When several templates
are selected, the monitored object can be up to eight. If the number is over eight, you
are prompted to select an object again, and automatically clear all the selected objects.
4.8 Device Performance Monitoring
To get the basic information and performance state about a device, you may create a
monitor task with alarm thresholds for the device. When the value of the monitored
performance index exceeds a specified alarm threshold, the system can generate fault
information and notify you of it.
You can monitor how well a device is operating through performance data collection
and fault management, or four stages: create a performance monitor task → generate
fault information → browse and locate fault information → acknowledge fault
information.
4-9
User Manual
Quidview IPSec VPN Service Monitor
Chapter 4 IPSec VPN Performance Management
4.8.1 Creating a Monitor Task
In this stage, you can select one or multiple devices and the desired performance
template to create a task, and define its start time, end time, monitor interval and alarm
mechanism. When the monitor task is operating, you can view the collected data in
table or a graph mode.
4.8.2 Generating Fault Information
In this stage, the system checks the values of the monitored performance index against
the specified thresholds during data collection. When the value of the monitored
performance index exceeds the specified thresholds, the system generates and sends
fault information to the fault management component.
4.8.3 Browsing and Locating Fault Information
In this stage, you can browse fault information in the fault management component to
identify the cause of a fault alarm, determining whether the involved device is operating
well. The fault entry provides information on the involved monitor task.
4.8.4 Acknowledging Performance Fault Information
In this stage, you can browse the data collected by a monitor task in the performance
management component to know about an alarm, including its occurrence time, cause,
and other information. This helps you maintain and troubleshoot devices.
4-10
User Manual
Quidview IPSec VPN Service Monitor
Chapter 5 Typical Applications
Chapter 5 Typical Applications
5.1 How to Browse VPN Tunnel Information
5.1.1 Prerequisites
Before browsing VPN tunnel information, you should make sure:
z
The Quidview NMS is installed and operated correctly.
z
You have the operation right (the default user name is admin and the role is
administrator after installation).
Note:
Functions available for different users vary with their roles. The unavailable menu items
are in gray.
5.1.2 Network Diagram
Suppose there is a configured IPSec network as shown in Figure 5-1. Establish two
tunnels between SecPath 10 and SecPath 100 to secure the data flow between PC A1
(192.168.1.0) and PC B1 (192.168.2.0), as well as PC A2 (10,1.1.0) and PC B2
(10.1.2.0); establish a tunnel between SecPath 1000 and Router AR4640 to secure the
data flow between PC A1 (192.168.1.0) and PC C1 (192.168.3.0). This IPSec network
adopts ESP security protocol, DES encryption and MD5 authentication algorithms, and
IPSec tunnels are established on devices. Take example by browsing the topology and
tunnel information of SecPath 1000.
5-1
User Manual
Quidview IPSec VPN Service Monitor
Chapter 5 Typical Applications
Figure 5-1 Network diagram
5.1.3 Browsing Topology
In the VPN view, select [View Device Tunnel Topo] from the right-click menu to view the
topology of the selected device. Figure 5-2 illustrates the topology interface of SecPath
1000.
Figure 5-2 SecPath 1000 topology interface
5-2
User Manual
Quidview IPSec VPN Service Monitor
Chapter 5 Typical Applications
Note:
If the Tunnel Alarm Switch Settings are enabled, the topology information will be
refreshed when there is a change on tunnel connection.
5.1.4 Browse Tunnel Information
I. Browsing information of all tunnels between two devices
Step1
In the VPN view, select [Browse Tunnel] from the right-click popup menu of the related
device to view the tunnel information. Figure 5-3 illustrates the tunnel browse interface
of SecPath 1000 and SecPath 10 security gateways.
Figure 5-3 Tunnels between SecPath 1000 and SecPath 10
Step2
Select an entry in the tunnel list to view its SA information. For example, the SA
information of SecPath 1000 as shown in Figure 5-4.
5-3
User Manual
Quidview IPSec VPN Service Monitor
Chapter 5 Typical Applications
Figure 5-4 SA of a tunnel between SecPath 1000 and SecPath 10
II. Browsing information of all tunnels of device
Step1
In the VPN view, select [Browse Tunnel] from the right-click popup menu of the related
device to view the tunnel information. Figure 5-3 illustrates the tunnel browse interface
of SecPath 1000 security gateway.
5-4
User Manual
Quidview IPSec VPN Service Monitor
Chapter 5 Typical Applications
Figure 5-5 SecPath 1000 tunnels
Step2
Select an entry in the tunnel list to view its SA information. For example, the SA
information of SecPath 1000 as shown in Figure 5-4.
Figure 5-6 SA of a SecPath1000 tunnel
5-5
User Manual
Quidview IPSec VPN Service Monitor
Chapter 5 Typical Applications
5.2 How to Monitor Performance of VPN Device
5.2.1 Prerequisites
Before creating a monitor task, you should make sure:
z
The Quidview NMS is installed and works properly
z
You have the operation right (the default user name is admin and the role is
administrator after installation).
Note:
Functions available for different users vary with their roles. The unavailable menu items
are in gray.
5.2.2 Configuration
You can monitor the IKE tunnel receiving rate in the following steps:
Step1
On the navigation tree in the [Security Management] pane, click the [Monitor Task
Management] node, and then the [VPN Monitor Management] pane is displayed with all
performance monitor tasks. Click <Create> to enter the [Create a Task] dialog box, as
shown in Figure 5-7, and then input a task name.
Figure 5-7 Create a Task dialog box
5-6
User Manual
Quidview IPSec VPN Service Monitor
Step2
Chapter 5 Typical Applications
Select a template for the task, and then the [Select Template] dialog box is displayed.
Select IPSec-IKE Tunnel in the drop-down list, and then select IKE Tunnel Receiving
Rate (bytes/s).
Step3
Set the start date and end date for the task. If they are left empty, it indicates that the
task is permanent.
Step4
Set the monitor interval. It is the period for monitoring the performance indices.
Step5
Set the alarm threshold. It is optional.
Step6
Click <Select Object> to enter the [Select an Instance] dialog box. Select the device
with an IP address of 1.2.7.11, click <>> to add it to the list, and then click <OK>.
Step7
Step8
Input the task description in the [Description] field box. It is optional.
Click <OK> to return to the [VPN Monitor Management] pane. The newly added task is
displayed, as shown in Figure 5-8.
Figure 5-8 VPN Monitor Management interface
Step9
In the [VPN Monitor Management] pane, select the newly added task and click <View
Data…> to view the detail data and report data of the task. The data can be shown in a
table, line or bar graph mode. The interface of detail data in a plot graph mode is as
shown in Figure 5-9.
5-7
User Manual
Quidview IPSec VPN Service Monitor
Chapter 5 Typical Applications
Figure 5-9 View task data interface
5-8
User Manual
Quidview IPSec VPN Service Monitor
Chapter 6 FAQ
Chapter 6 FAQ
I. Why is a failure prompted when I create a VPN monitor task?
z
Because SNMPv1 does not support the counter64 data type. Use SNMPv2 to
create a task. Select a device which you want to monitor in the topology, and then
modify parameters and select SNMPv2.
z
For establishing a VPN monitor task, that is because the device does not have
IPSec VPN configured, or not have established tunnels for configured IPSec VPN
(namely no traffic over VPN).
II. Why cannot I browse IPSec tunnels after IPSec VPN configuration?
IPSec VPN tunnels should be established on device for tunnel browse. You can
establish a tunnel through pinging a peer device in a VPN network.
6-1
User Manual
Quidview IPSec VPN Service Monitor
Chapter 7 Acronyms
Chapter 7 Acronyms
Table 7-1 Acronyms
AH
Authentication Header
BIMS
Branch Intelligent Management System
DM
Device Manager
ESP
Encapsulating Security Payload
IKE
Internet Key Exchange
IPSec
IP Security
ISAKMP
Internet Security Association and Key Management Protocol
NCC
Network Configuration Center
NMF
Network Management Framework
SA
Security Association
SNMP
Simple Network Management Protocol
VDM
IPSec VPN Service Deployment Manager
VPN
Virtual Private Network
VSM
IPSec VPN Service Monitor
7-1