1
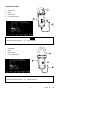
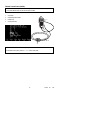
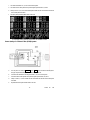
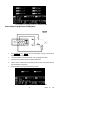
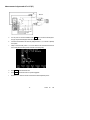
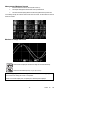
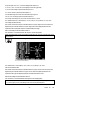
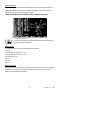
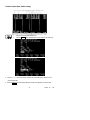
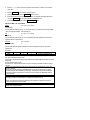
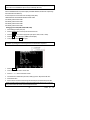
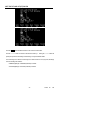
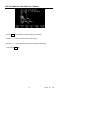
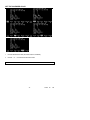
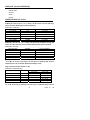
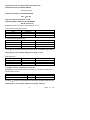
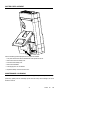
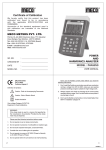
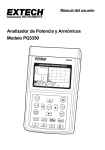
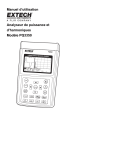
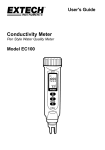
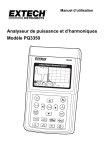
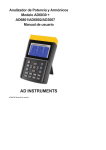
User Manual
Power and Harmonics Analyzer
Model 382095
EN 61010-2-032
CAT III 600V
Pollution Degree 2
Definition of Symbols:
Caution: Refer to Accompanying Documents
Caution: Risk of Electric Shock
Double Insulation
Over-voltage category III (CAT III): equipment in fixed installations.
WARNING: If the power analyzer is used in a manner not specified by the
manufacturer, the protection provided by the clamp meter may be impaired.
Please read the following instructions before use
1.
Do not operate this instrument in wet or dusty environments.
2.
Do not operate this instrument in the presence of combustible or explosive gas
3.
Do not touch exposed metal parts or unused terminals.
4.
Consider the use of rubber gloves in operation.
5.
Do not operate in excess of AC 500V (Phase to Neutral), or AC 600V (Phase to Phase)
6.
Do not operate this instrument if it appears to be malfunctioning
2
382095 V4.1 7/06
Table of Contents
FEATURES
5
PANEL DESCRIPTION
6
OPERATING INSTRUCTIONS
11
Power Quality of a 3 Phase 4 Wire (3P4W) System
11
Power Quality of a 3 Phase 3 Wire (3P3W) System
12
Power Quality of a Single Phase (1P2W) System
13
Power Quality of a 1 Phase 3 Wire (1P3W) System
14
Measurement of a System with CT or VT
15
Harmonic Analysis of Voltage or Current
16
Display the Phase Angle of Harmonics
17
Measurement of Maximum Demand
18
Waveform of Voltage and Current
18
Waveform of Voltage Only
19
Graphic Phase Diagram
19
Phase Sequence of a 3 Phase System
21
Balance and Unbalance 3 Phase (3P3W, 3P4W) Power Source System
21
Balance and Unbalance 3 Phase (3P3W or 3P4W) Load System
22
Transient Capture (Dips, Swells, Outage)
23
Down Load Transient Data
25
Data Logging of Power Data (3P4W, 3P3W, 1P2W, 1P3W)
25
Down Load Power Data
25
Data Logging of Harmonics
25
Down Load Harmonics Data
26
HARDCOPY of SCREEN
27
READ the SAVED SCREEN
28
SET THE CT AND VT RATIO
29
SET THE TIME INTERVAL FOR MAXIMUM DEMAND
30
SET THE SAMPLING TIME FOR DATA LOGGING
31
SET THE CALENDER CLOCK
32
PROTOCOL OF RS-232C INTERFACE
33
SPECIFICATIONS
33
BATTERY REPLACEMENT
41
MAINTENANCE & CLEANING
41
Nomenclature
42
3
382095 V4.1 7/06
Warranty
EXTECH INSTRUMENTS CORPORATION warrants this instrument to be free of defects in parts and
workmanship for one year from date of shipment (a six month limited warranty applies to sensors and
cables). If it should become necessary to return the instrument for service during or beyond the warranty
period, contact the Customer Service Department at (781) 890-7440 ext. 210 for authorization or visit our
website www.extech.com for contact information. A Return Authorization (RA) number must be issued
before any product is returned to Extech. The sender is responsible for shipping charges, freight, insurance
and proper packaging to prevent damage in transit. This warranty does not apply to defects resulting from
action of the user such as misuse, improper wiring, operation outside of specification, improper
maintenance or repair, or unauthorized modification. Extech specifically disclaims any implied warranties or
merchantability or fitness for a specific purpose and will not be liable for any direct, indirect, incidental or
consequential damages. Extech's total liability is limited to repair or replacement of the product. The
warranty set forth above is inclusive and no other warranty, whether written or oral, is expressed or implied.
Calibration and Repair Services
Extech offers repair and calibration services for the products we sell. Extech also provides NIST
certification for most products. Call the Customer Service Department for information on calibration
services available for this product. Extech recommends that annual calibrations be performed to verify
meter performance and accuracy.
Support line (781) 890-7440
Technical support: Extension 200; E-mail: [email protected]
Repair & Returns: Extension 210; E-mail: [email protected]
Product specifications subject to change without notice
For the latest version of this User’s Guide, Software updates, and other
up-to-the-minute product information, visit our website: www.extech.com
Extech Instruments Corporation, 285 Bear Hill Rd., Waltham, MA 02451
Copyright © 2006 Extech Instruments Corporation
All rights reserved including the right of reproduction in whole or in part in any form.
4
382095 V4.1 7/06
FEATURES
■
Analysis for 3P4W, 3P3W, 1P2W, 1P3W
■
True RMS value (V123 and I123)
■
Active Power (W, KW, MW, GW)
■
Apparent and Reactive Power (KVA, KVAR)
■
Power Factor (PF), Phase Angle (Φ)
■
Energy (WH, KWH, KVARH, PFH)
■
Current measurement from 0.1mA to 1000A, capable of analyzing IT standby power consumption
to the maximum demand of a factory
■
Display of 35 Parameters in One Screen (3P4W)
■
Programmable CT (1 to 600) and PT (1 to 3000) Ratios
■
Display of Overlapped Voltage and Current Waveform
■
Maximum Demand (MD KW, MW, KVA, MVA) with Programmable Period
■
Harmonic Analysis (V123 and I123) to the 99 Order
■
Display of 50 Harmonics in one Screen with Waveform
■
Display of Waveform with Peak Values (1024 Samples / Period)
■
Analysis of Total Harmonic Distortion (THD-F)
■
Graphic Phase Diagram with 3 Phase System Parameters
th
■
Capture 28 Transient Events (Time + Cycles) with Programmable Threshold (%)
■
DIP, SWELL, and OUTAGE are included in transient events.
■
3 Phase Voltage or Current Unbalanced Ratio (VUR, IUR)
■
3 Phase Voltage or Current Unbalanced Factor (d0%, d2%)
■
Calculated Unbalanced Current through Neutral Line (In)
■
512K Memory with Programmable Interval (Sampling time from 2 to 6000 seconds, data logging
time from 4.7 hours to 1180 days for 3P4W system)
■
Output of Waveform, Power Parameters and Harmonics on Command
■
Large Dot Matrix LCD Display with Backlight
■
Optical Isolated RS-232C Interface
5
382095 V4.1 7/06
PANEL DESCRIPTION
6
382095 V4.1 7/06
Panel Description
1. Input Terminal for Neutral Line (Voltage)
2. Voltage Input Terminals for Each Phase (V1, V2, V3)
3. External DC Input (The AC adaptor must be 600V isolated)
4. Current Input Terminals for Each Phase (I1, I2, I3)
5. LCD Display
6. Indication of locations where SEC., CT, VT, and SETUP are displayed in LCD.
7. Buttons
8. RS-232C Window
9. Stand Holder
10. Stand
11. Battery Cover
12. Battery Compartment
Press this button to exit transient detection mode. Also used to exit the SETUP menu
Press this button to perform transient detection
Press this button to hold the data displayed in LCD, press again to continue operation.
Press this button to begin the measurement of harmonics in magnitude.
Press this button to select V1, I1, V2, I2, V3, or I3 for harmonics analysis
7
382095 V4.1 7/06
Press this button for the voltage or current input range
Press to enter the Main Menu (also used to navigate menu items).
Press this button to increment value by one. Hold the button for two seconds or
more to speed up the increment.
Press this button to decrement value by one.
In harmonic analysis mode, use these buttons to move the cursor left or right.
Press this button to start data logging. Press it again to stop data logging. The
sampling interval is displayed in the LCD via the SEC indicator.
In the power mode, press this button to display the phase. In the harmonic
analysis mode, press this button to display phase angle instead of magnitude.
Press this button to turn the back light on. Press it again to turn the back light off.
Press this button to begin measuring power.
Press this button to display the waveforms for voltage and current.
Press this button to display the waveform for voltage only
In the power mode, press this button to select the appropriate system (3P4W,
3P3W, 1P2W or 1P3W). In the waveform mode, press to select (V1, I1), (V2, I2),
or (V3, I3).
Press this button to turn the power on or off.
8
382095 V4.1 7/06
Current Probe (100A)
1.
Jaw Assembly
2.
Trigger
3.
Range Selector
4.
6 pin mini DIN connector
100A
100A
(HARMON)
100A
(POWER)
60A
10A
(HARMON)
10A
1A
1A
NOTE: To choose the 100A current probe, press the SETUP button to select CLAMP. When the
CLAMP is reverse video, press the ▲ or ▼ button to select 100.
Current Probe (1000A)
1.
Jaw Assembly
2.
Trigger
3.
Range Selector
4.
6 pin mini DIN connector
1000A
100A
10A
NOTE: To select the1000A current probe, press the SETUP button to select CLAMP. When the
CLAMP is reverse video, press the ▲ or ▼ button to select 1000.
9
382095 V4.1 7/06
Flexible Current Probe (3000A)
NOTE: The flexible current probe has a maximum input of 3000A however the maximum input
current of the 382095 Power and Harmonics Analyzer is 1000A.
1.
Control Box
2.
Output Range Select Switch
3.
Flexible Loop
4.
Coupling Assembly
1
2
3
4
NOTE: To select the 3000A flexible current probe, press the SETUP button to select CLAMP. When
the CLAMP is reverse video, press the ▲ or ▼ button to select 3000.
10
382095 V4.1 7/06
OPERATING INSTRUCTIONS
NOTE: Select the correct CLAMP in the SETUP menu. When the current probe is connected to the
power analyzer, the power analyzer will automatically detect the range selected.
NOTE: Select the correct frequency (Hz) in the SETUP menu.
WARNING: All the current probes connected to the power analyzer must be of the same model and
same range. Mixed models and different ranges will yield incorrect measurement results.
Power Quality of a 3 Phase 4 Wire (3P4W) System
a. Turn the power on. Press the POWER and the 1Φ3Φ buttons to select the 3P4W system. The
type of system will be displayed at the left bottom corner in the LCD.
b. Connect the four test leads to the voltage terminals V1, V2, V3 and the VN (Neutral) of the
system.
11
382095 V4.1 7/06
c. Connect the test leads to L1, L2, and L3 of the 3P4W system.
d. Connect the three current probes to the power analyzer input terminal I1, I2, and I3.
e. Clamp on to the L1, L2, and L3 of the 3P4W system. Make sure the current flows from the front
of the current probe to the back.
f.
All of the system parameters will be shown in the LCD
For a description of each parameter, refer to section XIV. NOMENCLATURE.
Power Quality of a 3 Phase 3 Wire (3P3W) System
a.
Turn the power on. Press the POWER and the 1Φ3Φ buttons to select the 3P3W system.
The type of system will be displayed at the bottom right of the LCD.
b.
Connect the four test leads to the voltage terminals L1, L2, and L3 of the system.
c.
Connect the three current probes to the power analyzer input terminal I1, I2, and I3.
d.
Clamp on to the L1, L2, and L3. Make sure the current flows from the front of the current probe
to the back.
e.
All parameters of the system will be shown in the LCD
12
382095 V4.1 7/06
For a description of each parameter, refer to XIV. NOMENCLATURE.
Power Quality of a Single Phase (1P2W) System
a.
Press POWER and then 1Φ3Φ to select the 1P2W system. The type of system will be
displayed at the bottom right of the LCD
b.
Connect the test leads to the voltage terminals L1 and VN (Neutral) of the system.
c.
Connect one current probe to the power analyzer input terminal I1.
d.
Clamp on to the L1. Make sure the current flows from the front of the current probe to the back
(see arrow labeled on clamp probe).
e.
All of the parameters of the system will be shown in the LCD
For a description of each parameter, refer to XIV. NOMENCLATURE.
13
382095 V4.1 7/06
Power Quality of a 1 Phase 3 Wire (1P3W) System
a.
Turn the power on. Press the POWER and the 1Φ3Φ buttons to select the 1P3W system.
The type of system will be displayed at the bottom right of the LCD.
b.
Connect the test leads to the voltage terminals L1, L2 and VN (Neutral) of the system.
c.
Connect the two current probes to the power analyzer input terminal I1 and I2.
d.
Clamp on to the L1 and L2. Make sure the current flows from the front of the current probe to
the back.
e.
All of the system parameters will be shown in the LCD
For a description of each parameter, refer to XIV. NOMENCLATURE.
14
382095 V4.1 7/06
Measurement of a System with CT or VT (PT)
a.
Turn the power on. Press the POWER and the 1Φ3Φ buttons to select the 3P4W system.
The type of system will be displayed at the bottom right of the LCD.
b.
Connect the four test leads to the secondary voltage terminals L1, L2, L3 and the VN (Neutral)
c.
Clamp on to the secondary coils of L1, L2, and L3. Make sure the current flows from the front
of the system.
of the current probe to the back (see the arrow label on the clamp probe).
d.
Press SETUP to enter the SETUP menu.
e.
Press SETUP several times until the CT symbol is highlighted.
f.
Press the ▲ or ▼ button to increment or decrement the RATIO specified by the CT.
15
382095 V4.1 7/06
g.
Press the SETUP button several times until the VT symbol is highlighted.
h.
Press the ▲ or ▼ button to increment or decrement the RATIO specified by the VT.
i.
All 35 system parameters will be shown in the LCD
For a description of each parameter, refer to XIV. NOMENCLATURE.
Harmonic Analysis of Voltage or Current
(Normal Voltage without Distortion and Harmonics)
(Distorted Current with Harmonics)
a. Setup the analyzer for measurement of any power system (3P4W, 3P3W, 1P2W, or 1P3W). To view
16
382095 V4.1 7/06
the harmonic analysis of voltage or current, press the HARMO button.
b. Once the HARMO button is pressed, the waveform will be shown in the left-hand portion of the LCD,
st
th
and the 1 to 50 order harmonics will be shown in the right-hand portion of the LCD.
c. The positive and negative peak values will be shown in the waveform (Vpk).
d. The true RMS value & total harmonic distortion of voltage or current is shown under the waveform.
e. The cursor (↑ arrow) will point to the current order of harmonics. The frequency (HZ) will be displayed
next to the cursor. The percentage of harmonics (%) will be displayed below the cursor. The
magnitude of the harmonics (V or A) or phase angle will be displayed next to the %.
f. Press the SETUP button several times until HAR is highlighted.
g. To move the cursor to the next harmonic, use the ◄or ► button.
st
th
th
h. To see the next page (51 to 99 order) press the ► button to pass the 50 order or press the ◄
st
button to pass the 1 order.
NOTE: If the waveform is clipped at the peak or too small in the LCD, press the RANGE button to
select HIGH or LOW range for a better display. The range indicator is the symbol after the unit of
RMS value, L or H.
Display the Phase Angle of Harmonics
When the HARMO button is pressed the magnitude of each harmonic is displayed. To review the phase
angle of each harmonic, press the PHASE button. The phase angle will be displayed next to the % display
icon. V1 does not trigger at exactly 0 degrees; it may be a few degrees after ‘0’. The remaining signals (V2,
V3, I1, I2, I3) are sampled when V1 is triggered. In other words, the phase angles for V2, V3, I1, I2, and I3
are sampled with respect to V1. For example, if V1, I1 have a phase difference of 30 degrees, they are
displayed as V1 (2 degrees), I1 (32 degrees) in the harmonics analysis.
NOTE: If the waveform is clipped at the peak or too small in the LCD, press the RANGE button to
select HIGH or LOW range for a better display. The range indicator is the symbol after the unit of
RMS value, L or H.
17
382095 V4.1 7/06
Measurement of Maximum Demand
1.
Set the time interval for maximum demand (refer to section V)
2.
The analyzer will integrate the KW and KVA over the specified interval.
3.
The maximum demand (MD) updates if new demand is greater than the previous value.
In the following example, the maximum demand is 527.4VA and 527.4W. The time interval for maximum
demand is 2 minutes.
Waveform of Voltage and Current
Press this button to display the waveforms for voltage and current simultaneously.
Press this to select different inputs (V1, I1), (V2, I2), or (V3, I3).
NOTE: The triggering point is the zero crossing point of V1 for V2, V3, I2, and I3. The triggering point
for I1 is its own zero crossing point in case V1 is not present.
NOTE: In the waveform display mode, one period/cycle of 1024 data points is displayed.
18
382095 V4.1 7/06
Waveform for Voltage Only
Press this button to display the voltage waveform only. The true RMS value of voltage will
be displayed at the bottom of the LCD.
Press this button to select V1, V2, or V3.
NOTE: The triggering point is the zero crossing point of V1 for V2 and V3.
NOTE: In the waveform mode, one period/cycle of 1024 data points is displayed.
Graphic Phase Diagram
Press this button to display the phase diagram.
The voltage and current signals are displayed in phase format (magnitude, angle).
V1 is the reference. The V1 angle is always 0 degrees.
19
382095 V4.1 7/06
The phase angles of V2, V3, I1, I2, and I3 are displayed with respect to V1.
V1, V2, V3, I1, I2, I3, V12, V23, and V31 are displayed in vector form graphically.
V1, V2, V3: Phase voltages in phase format with respect to V1
I1, I2, I3: Line currents in phase format with respect to V1.
IVn: Calculated voltage and current of the neutral with respect to ground.
V12, V23, V31: Line voltage in phase format with respect to V1.
Ave: Average of line voltage V12, V23, and V31 and line current I1, I2, and I3
dV%: Historical maximum % value of (Max (V1, V2, V3) – Min (V1, V2, V3)) / Min (V1, V2, V3) * 100%
VUR: Voltage (Unbalanced Ratio)
d02: The first number is Zero Sequence Unbalanced Ratio in % (d0) of voltage; the second number is the
Negative Sequence Unbalanced Ratio in % (d2) of voltage. When VUR is displayed before d02, d02
represents the Zero and Negative Sequence Unbalanced Ratios for voltage.
REF: nominal voltage for transient detection reference
Sd%: threshold in % for transient detection with respect to nominal voltage (REF).
NOTE: The phase is drawn only when the reading exceeds 200 counts. If V is zero, the phase of the current
will not be drawn.
Press this button to change the display from VUR to IUR
dA%: Historical max % value of (Max (I1, I2, I3) – Min (I1, I2, I3) ) / Min (I1, I2, I3) * 100%
IUR: Current Unbalance Ratio
d02: The first number is Zero Sequence Unbalanced Ratio in % (d0) for current; the second number is the
Negative Sequence Unbalanced Ratio in % (d2) for current. When IUR is displayed before d02, d02
represents the Zero (d0) and Negative (d2) Sequence Unbalanced Ratios for current.
REF: Nominal voltage for transient detection reference
Sd%: Threshold in % for transient detection with respect to nominal voltage (REF).
NOTE: If the voltage of L1, L2, and L3 is not connected in the correct sequence, the analyzer will show
L1-3-2 in the right top corner, and it will beep to warn of an incorrect phase sequence.
20
382095 V4.1 7/06
Phase Sequence of a 3 Phase System
Press this button to display the phase diagram.
In this mode, the analyzer also detects the phase sequence. If the voltage of L1, L2, and L3 is not
connected in the correct sequence, the analyzer will show L1-3-2 in the right top corner, and it will beep to
warn of an incorrect phase sequence.
Balanced and Unbalanced 3 Phase (3P3W, 3P4W) Power Source System
In order to check if a system is balanced, press this button to display the phase diagram
along with the VUR.
Balanced System
If a 3 phase power source system is balanced, the parameters should be as follows:
V1 = V2 = V3
V12 = V23 = V31
The phase angle of V2 = -120; the phase angle of V3 = 120
Vn (voltage of neutral with respect to ground) = 0V
VUR = 0%
d0% = 0%
d2% = 0%
21
382095 V4.1 7/06
Unbalanced Systems
If the values differ from the numbers above, an unbalanced power source system may be the reason. The
magnitude of the differences can be used as an indication of an unbalanced power source system. The
larger the difference, the further unbalanced the system will be.
Balanced and Unbalanced 3 Phase (3P3W or 3P4W) Load System
In order to check if current of a system is balanced, press the button twice to display the
phase diagram with the IUR displayed.
Balanced System
If a 3 phase load system is balanced, the parameters should be as follows:
I1 = I2 = I3
The phase angle for I2 and I1 (I2 ± I1) = ±120
The phase angles of I3 and I2 (I3 ± I2) = ±120
In (current of neutral) = 0A
IUR = 0%
d0% = 0%
d2% = 0%
Unbalanced Systems
If the values differ from the numbers above, an unbalanced load system may be the reason. The magnitude
of the difference can be used as an indication of an unbalanced power source system. The larger the
difference, the more unbalanced the load will be.
22
382095 V4.1 7/06
Transient Capture (Dips, Swells, Outage)
1.
Press to enter the PHASE DIAGRAM mode.
2.
Press the SETUP button until TRANS REF in reverse video is shown in the LCD.
3.
Press the ▲ or ▼ button to increment or decrement the nominal voltage for a reference. To exit,
4.
Press the SETUP button several times until SDVP is shown in the right bottom corner of the LCD.
press the EXIT button.
23
382095 V4.1 7/06
5.
Press the ▲ or ▼ button to increment or decrement the threshold in % (SDVP). To exit, press the
6.
Press the TRANSIENT button to start the “Transient Capture”
EXIT button.
7.
The backlight will switch off when the TRANSIENT button is pressed.
8.
If the analyzer captures any transient events (DIP, SWELL, or OUTAGE), the backlight will switch on.
Press the TRANSIENT button to review the recorded TRANSIENT events.
9.
To exit TRANSIENT CAPTURE, press the EXIT TRANSIENT button.
Definition of SWELL, DIP, and OUTAGE:
SWELL:
VRMS > [VREF + (VREF * SD%)]
Code for SWELL:
1
If the true RMS value of either phase (V1, V2, or V3) rises above the nominal value plus the threshold (REF
+ SD%), it is regarded as SWELL. Code for SWELL is 1.
DIP:
VRMS < [VREF – (VREF * SD%)]
Code for DIP:
2
If the true RMS value of either phase (V1, V2, or V3) falls below the nominal value plus the threshold, it is
regarded as DIP. The code for DIP is 2.
OUTAGE:
VRMS < 30 to 40V
Code for OUTAGE:
4
If the true RMS value of either phase is less than 30 to 40V, it is regarded as OUTAGE. The code for
OUTAGE is 4.
Code Table:
CODE
SWELL
1
DIP
2
OUTAGE
4
COMMENT
Codes can be added together
DISPLAY FORMAT:
First column: Sequential number of events.
Second column: Elapsed time (the elapsed time format is DAYS, HOURS, MINUTES) 99 days 24 hours 60
minutes max
The third column: Number of cycles.
The fourth column: Code of transient events. There can be more than one transient condition occurring in
one event.
NOTE: In the TRANSIENT CAPTURE mode, the analyzer takes 128 samples of each cycle for each
phase continuously.
NOTE: When the user presses the TRANSIENT button to review the recorded events, the capture
operation is paused until TRANSIENT is pressed again. The timer is also stopped when TRANSIENT
is pressed. Therefore, the time stamp is not correct when the user presses the TRANSIENT button to
resume operation.
NOTE: The analyzer can record up to 28 events. When the analyzer has recorded 28 events, it stops
the capture operation, turns the backlight on, and displays the 28 transient events.
NOTE: The codes can be summed to indicate two or three conditions. For example, if the code is 6,
DIP and OUTAGE (2+4) have been added.
NOTE: The longest duration for a capture operation is 99 days. Use the external 12V DC power
adaptor for long capture operation.
24
382095 V4.1 7/06
WARNING: Select 50 or 60 Hz for transient capture. If AUTO is selected for frequency, the unit will not
allow entrance to the TRANSIENT capture mode (an audible beep will sound).
Down Load Transient Data
When the TRANSIENT button is pressed to display CAPTURED EVENTS, the data is also output through
the RS-232 interface simultaneously.
The data output is in the same format as the LCD display format (ASCII)
YEAR MONTH DAY HOUR MINUTE SECOND CT REF CODE
01 ELAPSED_TIME CYCLES CODE
02 ELAPSED_TIME CYCLES CODE
03 ELAPSED_TIME CYCLES CODE
04 ELAPSED_TIME CYCLES CODE
Datalogging Power Data (3P4W, 3P3W, 1P2W, 1P3W)
1.
Set the datalogger sampling time (rate)
2.
Press the POWER button to enter the power measurement mode.
3.
Press the 1Φ3Φ button to select the appropriate system (3P4W, 3P3W, 1P3W, or 1P2W).
4.
Press the REC button to start logging. A REC symbol will display.
5.
To stop logging, press the REC button again.
NOTE: To download data, send a CTRL+D command to the analyzer through RS-232C interface.
WARNING: The sampling time could be longer than the set value if there is no input at V1.
Down Load Power Data
1.
Press the SETUP button.
2.
“Down Load File” will be shown in reverse video.
3.
Press the ▲ or ▼ button to select the file number.
4.
If the data stored in a selected file is power data, a leading symbol “P” will precede the file name
5.
Press the EXIT button.
6.
When a CTRL D command is received through the RS-232C port, it downloads stored power data.
NOTE: In the setup mode, the unit will not accept commands through the RS-232C port. To down load
data, press the EXIT button to return to normal measurement mode.
25
382095 V4.1 7/06
Data Logging Harmonics Data
1.
Set the sampling time (rate) for data logging
2.
Press the HARMO button to enter the harmonics measurement mode.
3.
Press the VI button to select the desired input (V1, I1, V2, I2, V3, or I3).
4.
Press the REC button to start data logging. A REC symbol will be displayed at the bottom of the LCD.
5.
To stop data logging, press the REC button again.
WARNING: If there is no input at V1, the sampling rate could be longer than the programmed value.
Down Load Harmonics Data
1.
Press the SETUP button.
2.
“Down Load File” will be shown in reverse video.
3.
Press the ▲ or ▼ button to select the file number.
4.
If the data stored in a selected file is harmonics data, a leading symbol “H” will precede the file name.
5.
Press the EXIT button.
6.
When the unit receives a CTRL D command through the RS-232C port, it will down load previously
saved harmonic data.
NOTE: In the setup mode, the unit will not accept any commands through the RS-232C port. To down
load data, press the EXIT button to return to normal measurement mode.
26
382095 V4.1 7/06
HARDCOPY of SCREEN
1.
2.
Press the HOLD button.
Press the REC button. It takes a few seconds to hardcopy the screen, and store the screen in an
internal file. The LCD will show REC in reverse video when in operation. The number following REC
is the file number.
3.
Users can store up to 85 screens (if no power or harmonics data is stored).
27
382095 V4.1 7/06
READ the SAVED SCREEN
1.
Press the SETUP button. ‘DOWN LOAD FILE’ is displayed in reverse video. If the data in the
selected file is a hardcopy of the screen, a leading symbol of H is displayed in reverse video.
2.
Press the ▲ or ▼ to select the saved screen.
3.
Press the HOLD/READ button to restore the saved screen.
NOTE: If the data saved in a specific file is a HARDCOPY of a screen, a leading symbol of H is displayed in
reverse video.
NOTE: Hardcopy data can not be downloaded.
28
382095 V4.1 7/06
SET THE CT AND VT (PT) RATIO
Press the SETUP button several times until CT or VT is shown in reverse video.
Press the ▲ or ▼ button to increment or decrement the value by 1. Holding the ▲ or ▼ button will
speed up the process of incrementing or decrementing. To exit, press the EXIT button.
The CT ratio range is 1 to 600. The VT ratio range is 1 to 3000. Once the CT or VT (PT) is set, the voltage
and current readings are as follows:
CURRENT (displayed) = CURRENT (measured) x CT Ratio
VOLTAGE (displayed) = VOLTAGE (measured) x VT Ratio
29
382095 V4.1 7/06
SET THE TIME INTERVAL FOR MAXIMUM DEMAND
Press the SETUP button until MD TIME is displayed in reverse video.
Press the ▲ or ▼ button to increment or decrement the value by 1.
Holding the ▲ or ▼ button will speed up the process of incrementing or decrementing. To exit, press
the EXIT button.
The MD (max. demand) time interval range is 1 to 60 minutes. Once the time interval is set, the unit will
calculate the maximum demand and average demand in watts (W) or VA. To toggle between W and
VA, press the POWER button.
30
382095 V4.1 7/06
SET THE SAMPLING TIME FOR DATA LOGGING
Press the SETUP button several times until SEC is displayed in reverse video.
Press the ▲ or ▼ button to increment or decrement the value by 2.
Holding the ▲ or ▼ button will speed up the process of incrementing or decrementing.
To exit, press the EXIT button.
31
382095 V4.1 7/06
SET THE CALENDER CLOCK
1.
Press the SETUP button to select (Year, Month, Date, Hour, and Minute).
2.
Press the ▲ or ▼ to increment or decrement the number.
Note: The ‘seconds’ field cannot be adjusted.
32
382095 V4.1 7/06
PROTOCOL (RS-232C INTERFACE)
RS-232C Interface:
Baud Rate 19200
Data bits 8
Stop bit 1
No Parity
SPECIFICATIONS (23°C± 5°C)
AC Watts (50 or 60 Hz, PF 0.5 to 1. CT = 1, Voltage > AC 20V, Current > AC 4A for 100A range,
Current > AC 40A for 1000A range and continuous waveform)
Model 382095 + 1000A clamp
Range (0 to 1000A)
5.0 – 999.9 W
1.000 – 9.999 KW
10.00 – 99.99 KW
100.0 – 999.9 KW
1000 – 9999 KW
0.000 – 9.999MW
Resolution
0.1W
0.001 KW
0.01 KW
0.1 KW
1 KW
0.001MW
1
Accuracy of Readings
±1% ± 0.8W
±1% ± 8W
±1% ± 80W
±1% ± 0.8kW
±1% ± 8kW
±1% ± 80kW
AC Watt (50 or 60 Hz, PF 0.5 to 1. CT = 1, Voltage > AC 20V, Current > AC 40mA for 1A range, and
Current > AC 0.4A for 10A range, Current > AC 04A for 100A range and continuous waveform)
Model 382095 + 100A clamp
Range (0 to 100A)
5.0 – 999.9 W
1.000 – 9.999 KW
10.00 – 99.99 KW
100.0 – 999.9 KW
1000 – 9999 KW
Resolution
0.1W
0.001 KW
0.01 KW
0.1 KW
1 KW
2
Accuracy of Readings
±1% ± 0.8W
±1% ± 8W
±1% ± 80W
±1% ± 0.8kW
±1% ± 8kW
For CT ≠ 1, the accuracy in percentage is the same (±1%). The additional digits should be
1,2
multiplied by the CT ratio. For example, ±8dgts becomes ±8dgts * CT ratio
Range of CT (Current Transformer) Ratio: 1 to 600
Model 382095 + 3000A flexible clamp
Range (0 to 3000A)
Resolution
10.0 – 999.9 W
1.000 – 9.999 KW
10.00 – 99.99 KW
100.0 – 999.9 KW
1000 – 9999 KW
0.1W
0.001 KW
0.01 KW
0.1 KW
1 KW
1
Accuracy of Readings
>20V & >30A
<20V or <30A
±1% of range
±2% of range
±2% of range
±1% of range
±2% of range
±1% of range
±2% of range
±1% of range
±2% of range
±1% of range
For VT ≠ 1, the accuracy in percentage is the same (±1%). The additional wattage should be
1
33
382095 V4.1 7/06
multiplied by the VT ratio. For example, ±0.2W becomes ±0.2W * VT ratio
AC Apparent Power (VA, from 0.000VA to 9999 KVA)
VA = V r.m.s. x A r.m.s
AC Reactive Power (VAR, from 0.000 VAR to 9999 KVAR)
2
2
VAR = √ (VA – W )
Range of VT (Voltage Transformer) Ratio: 1 to 3000
AC Active Energy (WH, or KWH, from 0 WH to 999,999 KWH)
WH = W * Time (in hours)
AC Current (50 or 60 Hz, Auto Range, True RMS, Crest Factor < 4, CT=1)
1000A Clamp (Overload Protection AC 2000A)
Range
10.00A
100.0A
40A to 1000.A
Resolution
0.001A/0.01A
0.01A/0.1A
0.1A/1A
3
Accuracy of Readings
–
±0.5% ± 0.5A
±0.5% ± 5A
100A Clamp (Overload Protection AC 200A)
Range
0.04A to 1A
0.4A to 10A
4A to 100A
3,4
Resolution
0.001 A
0.01 A
0.1 A
4
Accuracy of Readings
±0.5% ± 0.05A
±0.5% ± 0.5A
±1.0% ± 0.5A
For CT ≠ 1, the accuracy in percentage is the same (±0.5%). The additional digits should be
multiplied by the CT ratio. For example, ±5 digits becomes ±5 digits * CT ratio
3000A Flexible Clamp
Range
0 to 300.0 A
300.0 to 999.9 A
1000 to 3000 A
4
Resolution
0.1 A
0.1 A
1A
4
Accuracy of Readings
±1% of range
±1% of range
±1% of range
For CT ≠ 1, the accuracy in percentage is the same (±1.0%).
AC Voltage (50 or 60 Hz, Auto Range, True RMS, Crest Factor < 4, Input Impedance 10 MΩ, VT (PT) = 1,
Overload Protection AC 800V)
Range
20.0 V to 500.0 V (Phase to Neutral)
20.0 V to 600.0 V (Phase to Phase)
6
Resolution
0.1 V
0.1 V
6
Accuracy of Readings
±0.5% ± 5dgts
±0.5% ± 5dgts
For VT (PT) ≠ 1, the accuracy in percentage is the same (±0.5%). The additional digits should be
multiplied by the CT ratio. For example, ±5 digits becomes ±5 digits * VT (PT) ratio
34
382095 V4.1 7/06
th
Harmonics of AC Voltage in Percentage (1 to 99 order, minimum voltage at 50 or 60 Hz > AC 80V. If
the voltage is 0 at 50 or 60 Hz, all the percentage displays will be 0.)
Range
th
1 to 20
th
20 to 49
th
50 to 99
Resolution
0.1%
0.1%
0.1%
Accuracy
±2%
4% of reading ±2.0%
6% of reading ±2.0%
th
Harmonics of AC Voltage in Magnitude (1 to 99 order, minimum voltage at the 50 or 60 Hz > AC 80V,
VT=1)
Range
th
1 to 20
th
20 to 49
th
50 to 99
Resolution
Accuracy
±2% ± 0.5V
4% of reading ±0.5V
6% of reading ±0.5V
0.1V
th
Harmonics of AC Current in Percentage (1 to 99 order, minimum current at the 50 or 60 Hz > 20 A. If the
current is 0 at 50 or 60 Hz, all the percentage (%) display is 0.)
1000A Clamp
Range
th
1 to 20
th
20 to 49
th
50 to 99
Resolution
0.1%
0.1%
0.1%
Accuracy
±2%
4% of reading ±2.0%
6% of reading ±2.0%
th
Harmonics of AC Current in Magnitude (1 to 99 order, minimum current at the 50 or 60 Hz > 20A,
CT=1)
1000A Clamp
Range
th
1 to 20
th
20 to 49
th
50 to 99
Resolution
0.1A
Accuracy
±2% of reading ±0.4A
±4% of reading ±0.4A
±6% of reading ±0.4A
th
Harmonic of AC Current in Percentage (1 to 99 order, minimum current at the 50 or 60 Hz > 20 A. If the
current is 0 at 50 or 60 Hz, all the percentage (%) display is 0.)
100A Clamp
Range
th
1 to 10
th
11 to 20
th
21 to 50 (A range)
th
21 to 50 (mA range)
th
51 to 99
Resolution
0.1 %
0.1 %
0.1 %
0.1 %
0.1 %
35
Accuracy
±0.2% of reading ±1%
±2% of reading ±1%
±5% of reading ±1%
±10% of reading ±1%
±35% of reading ±1%
382095 V4.1 7/06
th
Harmonics of AC Current in Magnitude (1 to 99 order, minimum current at the 50 or 60 Hz > 20A,
CT=1)
100A Clamp
Range
th
1 to 10
th
11 to 20
th
21 to 50 (A range)
th
21 to 50 (mA range)
th
51 to 99
Resolution
0.1mA / 0.1A
Accuracy
±0.2% of reading ±7dgts
±2% of reading ±7dgts
±5% of reading ±7dgts
±10% of reading ±7dgts
±35% of reading ±7dgts
th
Harmonic of AC Current in Percentage (1 to 99 order, minimum current at 50 or 60 Hz is greater than
20A. If the current is 0 at 50 or 60 Hz, all the percentage (%) display is 0)
3000A Flexible Clamp
Range
th
1 to 20
th
21 to 50
th
51 to 99
Resolution
0.1 %
0.1 %
0.1 %
Accuracy
±2%
±6%
±10%
th
Harmonics of AC Current in Magnitude (1 to 99 order, minimum current at the 50 or 60 Hz > 20A,
CT=1)
3000A Flexible Clamp
Range
th
1 to 20
th
21 to 50
th
51 to 99
Resolution
0.1A
Accuracy
±2% of range ±0.4A
±4% of range ±0.4A
±6% of range ±0.4A
th
Harmonics of AC Current in Magnitude (1 to 99 order, minimum current at 50 or 60 Hz is greater than
300A)
3000A Flexible Clamp
Range
th
1 to 20
th
21 to 50
th
51 to 99
Resolution
0.1A
Accuracy
±2% of range ±40A
±4% of range ±40A
±6% of range ±40A
Power Factor (PF)
Range
0.00 to 1.00
Resolution
0.01
Accuracy
± 0.04 (>20V and >30A)
Resolution
0.1°
Accuracy
± 1°
Phase Angle (Φ)
Range
-180° to 180°
36
382095 V4.1 7/06
Total Harmonic Distortion (THD-F with respect to the 50 or 60 Hz, min. value at the 50 or 60 Hz > 80V
th
and > 20 A, 1 to 50 Harmonics. If the voltage or current is 0 at 50 or 60 Hz, all of the percentage (%)
displays are 0)
1000A Clamp
Range
0.0 to 20%
20 to 100%
100 to 999.9 %
Resolution
0.1%
01%
0.1%
Accuracy
± 2%
± 6% of reading ± 1%
± 10% of reading ± 1%
Total Harmonic Distortion (THD-F with respect to the fundamental frequency, min. value at 50 or 60 Hz is
th
greater than AC 80V, greater than 10% of the range. Calculation is done over 1 to 50 Harmonics. If the
voltage or current is 0 at 50 or 60 Hz, all the percentage (%) displays are 0).
100A Clamp
Range
0.0 to 20.0 %
20.0 to 100%
100 to 999.9%
Resolution
0.1%
0.1%
0.1%
Accuracy
± 1%
±3% of reading ± 5%
±10% of reading ±10%
Resolution
0.1%
0.1%
0.1%
Accuracy
± 2% of range
±6% of range ± 1%
±10% of range ±1%
3000A Flexible Clamp
Range
0.0 to 20%
20 to 100%
100 to 999.9%
Peak Value of AC Voltage (peak value > 5V) or AC Current (peak value > 20A), VT=1
Model 382095 + 1000A Clamp
Range
50 Hz
60 Hz
Sampling Time
39 µs
33 µs
Accuracy of Reading
± 5% ± 30 digits
± 5% ± 30 digits
Peak Value of AC Voltage (peak value > 5V) or AC Current (peak value > 10% of the range), VT=1
Model 382095 + 100A Clamp
Range
50 Hz
60 Hz
Sampling Time
19µs
16µs
37
Accuracy of Reading
± 5% ± 30 digits
± 5% ± 30 digits
382095 V4.1 7/06
Peak Value of AC Voltage (peak value > 5V) or AC Current (peak value > 20A), VT=1
Model 382095 + 3000A Flexible Clamp
Range
50 Hz
60 Hz
Sampling Time
39 µs
33 µs
Accuracy of Reading
± 5% ± 30 digits
± 5% ± 30 digits
Crest Factor (C.F.) of ACV (peak value > 5V) or ACA (peak value > 20A), VT=1
Model 382095 + 1000A Clamp
Range
1.00 to 99.99
Resolution
0.01
Accuracy of Readings
± 5% ± 30 digits
Crest Factor (C.F.) of AC Voltage (peak value > 5V) or AC Current (peak value > 10% of the range),
VT=1
Model 382095 + 100A Clamp
Range
1.00 to 99.99
Resolution
0.01
Accuracy of Readings
± 5% ± 30 digits
Crest Factor (C.F.) of AC Current (RMS value > 30A)
Model 382095 + 3000A Flexible Clamp
Range
1.00 to 99.99
Resolution
0.01
Accuracy of Readings
± 5% ± 30 digits
Frequency in AUTO mode
Range
45 – 65 Hz
Resolution
0.1Hz
38
Accuracy of Reading
0.1Hz
0.2Hz (3000A flex clamp)
382095 V4.1 7/06
Model 382095
For indoor use only
Battery Type:
Eight (8) 1.5V ‘AA’ batteries
Display:
Dot Matrix LCD (240x128) with backlight
LCD Update Rate:
once per second
Power Consumption:
140mA (approx.)
No. of Samples:
1024 samples / period
Data Logging Capacity:
17474 records (3P4W, 3P3W)
26210 records (1P3W)
52420 records (1P2W)
4096 records (50 Harmonics / record)
Sampling Time:
2 to 3000 seconds for data logging
Low battery Indication:
Overload Indication:
OL
Dimensions:
257 (L) x 155 (W) x 57 (H) mm
10.1” (L) x 6.1” (W) x 2.3” (H)
Weight:
Accessories:
2.5 lbs. (1160g) Batteries included
Four (4) test leads 9.8’ (3m) in length
Alligator clips x 4
Carrying bag x 1
Users manual x 1
Batteries ‘AA’ 1.5V x 8
1000A Current Probe
Conductor Size:
2.2” (55mm), 2.5” x 1.0” (64 x 24mm) bus bar
Range Selection:
Manual (10A, 100A, 1000A)
Dimensions:
244mm (L) x 97mm (W) x 46mm (H)
Weight:
1.3 lbs. (600g)
9.6" (L) x 3.8" (W) x 1.8" (H)
Operating Temperature:
14 to 122°F (-10°C to 50°C)
Operating Humidity:
< 85% relative humidity
Altitude:
< 2000 meters
Storage Temperature:
-4 to 140°F (-20°C to 60°C)
Storage Humidity:
< 75% relative
39
382095 V4.1 7/06
100A Current Probe
Conductor Size:
1.2” (30mm) approx.
Range Selection:
Manual (1A, 10A, 100A)
Dimensions:
210mm (L) x 62mm (W) x 36mm (H)
Weight:
7 oz. (200g)
Operating Temperature:
14 to 122°F (-10°C to 50°C)
Operating Humidity:
< 85% relative humidity
Altitude:
< 2000 meters
8.3" (L) x 2.5" (W) x 1.4" (H)
Storage Temperature:
-4 to 140°F (-20°C to 60°C)
Storage Humidity:
< 75% relative
3000A Flexible Current Probe
Probe Length:
24” (610mm)
Range Selection:
Manual (300A, 3000A)
Minimum Bending Diameter
1.37” (35mm)
Connector Diameter
0.9” (23mm)
Cable Diameter
0.55” (14mm)
Cable Length
6.7”/170mm (probe to box)
6.7”/170mm (box to output)
Dimensions (box):
5.1” (L) x 3.1” (W) x 1.7” (H)
Weight:
14.4 oz. (410g)
130mm (L) x 80mm (W) x 43mm (H)
Operating Temperature:
14 to 185°F (-10°C to 85°C)
Operating Humidity:
< 85% relative humidity
Altitude:
< 2000 meters
Storage Temperature:
-4 to 185°F (-20°C to 85°C)
Storage Humidity:
< 85% relative
40
382095 V4.1 7/06
BATTERY REPLACEMENT
When the low battery symbol is displayed on the LCD, replace the batteries.
1. Turn power off and remove all of the test leads and current probes from the unit.
2. Remove the screw on the battery cover.
3. Lift and remove the battery cover.
4. Remove the old batteries.
5. Insert eight (8) new 1.5V ‘AA’ batteries.
6. Replace the battery cover and secure the screw.
MAINTENANCE & CLEANING
Service not covered in this manual should only be performed by qualified personnel. Repairs should only be
performed by qualified personnel. Periodically wipe the case with a damp cloth and detergent; do not use
abrasives or solvents.
41
382095 V4.1 7/06
NOMENCLATURE
V12, V23, V31: Line Voltage
V1, V2, V3: Phase Voltage
I1, I2, I3: Line Current
P1, P2, P3: True Power (W) of Each Phase
S1, S2, S3: Apparent (VA) Power of Each Phase
Q1, Q2, Q3: Reactive Power (VAR) of Each Phase
PΣ: Total System Power (W)
SΣ: Total System Apparent Power (VA)
QΣ: Total Reactive Power (VAR)
PFΣ: Total System Power Factor (PF)
PF1, PF2, PF3: Power Factor of Each Phase
PFH: Long Term Average Power Factor (WH / SH)
Φ1, Φ2, Φ3: Phase Angle of Each Phase
WH: Watt Hours
SH: VA hours
QH: VAR hours
HZ: Selected Frequency 50, 60 or Auto.
MD: Maximum Demand in W and VA over Specified Interval
3P4W: 3 Phase 4 Wire System
3P3W: 3 Phase 3 Wire System
1P2W: Single Phase 2 Wire System
1P3W: Single Phase 3 Wire System
SEC: sampling interval (0 to 3000 seconds) for data logging
CT: Current Transformer Ratio from 1 to 600
VT: Voltage Transformer Ratio from 1 to 3000
42
382095 V4.1 7/06