1
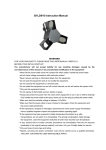
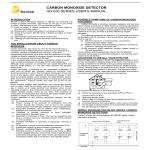
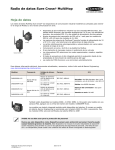
SDI-12 USB Adapter User Manual Dr. John Liu 2015-10-31 Introduction .................................................................................................................................................. 2 SDI-12 sensors tested.................................................................................................................................... 2 Sensor wiring................................................................................................................................................. 2 Setting up an SDI-12 sensor (Windows)........................................................................................................ 3 Data Logging (Windows) ............................................................................................................................... 5 Plotting and automatic plot update .............................................................................................................. 7 Sending Data to the Internet ...................................................................................................................... 11 Updating Adapter Firmware (Windows) ..................................................................................................... 12 Need Help with Your Project? ..................................................................................................................... 12 SDI-12 sensor general guide (WIN/Mac/Linux) .......................................................................................... 12 1 Introduction SDI-12 sensors are widely used in environmental monitoring including soil, streams, plants etc. On the other hand, data loggers designed for SDI-12 sensors are usually expensive and proprietary, making it harder to monitor and study soils and streams on a budget. This SDI-12 USB adapter makes it possible to directly interface SDI-12 sensors with a PC/Mac/Linux, on a budget. I have built numerous SDI-12 sensor data loggers. This is my latest design that is very easy to use. All you need is the adapter and a PC. It also comes with free data logger program (script) for Windows. Although this manual is tailored to windows users, you can easily use the adapter on a Mac or Linux. All you need is a terminal program. A section on SDI-12 sensors will guide you through it. FYI, a $150 windows 10 netbook running on Intel ATOM Z3000 series or faster is more than enough to log data. All of the examples in this manual came from one such netbook. SDI-12 sensors tested So far, I have been able to get hold of the following sensors and tested them all with the adapter. Apogee’s sensors all require command re-send, which is implemented in the adapter. Decagon’s sensors all claim to have 4V digital logic but their engineers confirmed that they are 5V tolerant. In theory, all SDI-12 sensors should work with my adapter but in practice not all sensors were made equal. The following list will keep expand as I get more sensors to test. Apogee: SI-411 (standard field of view infrared radiometer sensor) Aquacheck: CKC 6 sensor probe Decagon: DS-2 (Sonic Anemometer) VP-3 (temperature, barometer, humidity sensor) PRI (spectral reflectance sensor) NDVI (spectral reflectance sensor) GS3 (Ruggedized Soil Moisture, Temperature, and Electrical Conductivity Sensor) MPS-6 (Calibrated Water Potential Sensor) 5TM (Soil Moisture and Temperature Sensor) Ponsel: Digital turbidity sensor Sentek: TriSCAN (12 moisture salinity temperature sensor probes) Sensor wiring An SDI-12 sensor has 3 connections, positive and negative power supply, and SDI-12 bus line. Most SDI12 sensors run fine with 5V supply although the standard requires them to accept 12V supply. If your 2 sensor is one of those that requires 12V, you can power it with an AC adapter. Just connect the grounds together. 1. Connect your sensor’s Vcc to +, GND to -, and SDI-12 bus to S on the 3-pole screw terminal block. These are printed on the bottom of the circuit board. If your sensor comes with a stereo plug (Decagon), order an adapter for wire leads. Stereo plugs are not good. Inserting the plug causes short circuits. Don’t connect or disconnect a stereo plug when the adapter is connected to a USB port. 2. Connect the adapter to your computer. Your computer should automatically find the driver for the adapter. If your computer didn’t find the proper driver, visit this website for the driver: http://www.ftdichip.com/Drivers/VCP.htm 3. You may use any serial terminal program to talk with your SDI-12 sensor such as termite, MobaXterm, Terminal by Bray++, or Tera Term. I like Tera Term for its superior scripting capabilities. I literally developed a data logger program using Tera Term scripts. I also use Terminal by Bray++ when I am testing and configuring multiple sensors. It not only separates send and receive, but also has buttons to send custom strings such as “1M!”. Tera Term: https://ttssh2.osdn.jp/index.html.en Terminal by Bray++: https://sites.google.com/site/terminalbpp/ Fig. SDI-12 USB adapter wiring Setting up an SDI-12 sensor (Windows) Most SDI-12 sensors are shipped with default address, zero (0). Decagon’s sensors will send some data using DDI-serial protocol if their SDI-12 addresses are zero (0). The data in DDI-serial protocol will conflict with SDI-12 standard and confuse an SDI-12 data logger. I highly recommend you to change Decagon sensors from default address to another address, such as one (1). Once you have connected the sensor to the adapter and to a USB port, you can do some initial tests. I will use Tera Term for tests and data collection. Assume you already installed the USB adapter driver and it is on COM3. Start Tera Term and it will ask you to establish a new connection: 3 Fig. Connect to serial port. Make sure you select the correct port. Once connected, type “zI!” and you should see response from the adapter “z13Liudr SDITRD101”. The adapter itself has address z. It has some basic functions to read the analog voltage on pin S but I may add more functions to it in future firmware. If you don’t receive any response, you may need to install the driver or select the correct COM port or maybe the COM port property is incorrect. Go to Setup menu and select Serial Port and make sure the settings are correct: Fig. Serial port settings: 9600 Baud rate, 8-bit data, no parity, 1-bit stop, no flow control. Once you have established connection to the adapter, you can set up your SDI-12 sensor. I have a sensor configuration script to automate the process. Remember, you can only set up one SDI-12 sensor at a time, 4 without any other sensors connected to the adapter. Once set up, several sensors can be connected to one adapter. Run the script "SDI_12_Sensor_config_V1_0.ttl" by selecting menu Control then Macro. The script will automatically detect the address of your sensor, display its information, and asks you to set a new address. I recommend address 1 thru 9. Don’t set it to z since that is what the adapter uses. If the script didn’t work, check your wiring, restart Tera Term, and try again. Fig. Configuration script dialogs. Now your sensor is set up. You can start logging data. Data Logging (Windows) You can sit back and watch the PC data collection script collect data automatically on the sensor address of your choice, with a configurable total data points, delay between data points, and GMT or Local time zone setting. Just run the “SDI_12_PC_Logger_V1_0.ttl” script in Tera Term. Your data will be stored where this script is so if you store the script in a cloud drive, you will be able to view your data remotely. File Format Your data will be stored in comma-separated-value (.CSV) format. The file name is the date and time when the script starts logging data. There are at least three columns. The first column is the date and time the data point is collected. Depending on your choice, it is either in GMT/UTC or local time. The next column is the sensor address. The third column is the first value returned by your sensor. If your sensor returns more than one value, additional columns will contain additional values. This file format is ready to be read by any major data analysis tools such as Excel, Open Office Calc, or the more expensive Origin Pro. Here is a sample of data collected from a Decagon 5TM soil temperature and moisture sensor. The first data column is the relative dielectric constant (1 for air, yes, it’s NOT in soil). The second data column is temperature. 2015/10/31 18:30:59, 1, +1.04, +25.0 2015/10/31 18:31:27, 1, +1.04, +24.9 2015/10/31 18:31:56, 1, +1.04, +24.9 2015/10/31 18:32:24, 1, +1.04, +24.9 2015/10/31 18:32:53, 1, +1.04, +24.8 2015/10/31 18:33:21, 1, +1.04, +24.8 2015/10/31 18:33:50, 1, +1.04, +24.8 2015/10/31 18:34:18, 1, +1.04, +24.7 5 Running the script Frist start Tera Term and connect to the adapter (see figures in the previous section). Next, run the script from menu Control then Macro. The Macro will display a number of dialogs so you can configure your data collection. The following are the displayed or collected: credit (not shown), sensor address, total data points, delays between data points, time zone. Fig. Dialogs in the data logger script. Once the Macro is running, you will see data appearing in the terminal window: 6 Fig. Tera Term window while the data logger script is running. You may pause or end the script at any time but I recommend doing so while the script is doing delay between data points, indicated by “:pause” on the control box. Plotting and automatic plot update Once your data logging has started, you can use Microsoft Excel to plot the sensor data while recording and set the spreadsheet and plot to automatically update as more data are collected. Fig. Select a text file as external data source in Excel. 7 Fig. Choose delimited data when importing. Fig. Select “Comma” as delimiters for data columns. 8 Fig. Specify “Date: YMD” format for column 1. Fig. Choose Properties to make Excel automatically refresh data, optional. 9 Fig. Uncheck “Prompt for file name on refresh” and check “Refresh every X minutes”. Fig. You may insert a chart (scatter) with time and data columns. More data will be added to the plot and spreadsheet when Excel automatically refreshes. 10 Fig. Format column 1 to unhide seconds. Use custom format and type in “mm/dd/yyyy h:mm:ss”. Fig. Time column now shows seconds. Sending Data to the Internet If you think the above is already what you need, great! I have even more cool stuff for you. If you are a researcher or data analyst or just interested in storing data online, you would love to send your data to a database, and have it plotted on a plot real-time, for everyone to see, of course only those you intend to share your data with. I plan to add more to this section. Here is an overview of what will come in details: Sparkfun.com has a wonderful database service for free. You can easily post your data to the server using a modified data logger script. No programming experience is needed. You can execute cURL from within the script to send a “GET” command to the server to post your data. Then you can view and download all 11 your data from the server using a simple web interface sparkfun provides. You can also construct more sophisticated dashboards with graphs, downloads and other features using HTML, ajax etc. Sparkfun: https://data.sparkfun.com/ Updating Adapter Firmware (Windows) The current version of firmware is 1.1. You may update the firmware of the adapter when new firmware becomes available. Follow these steps to update your firmware: 1. Make sure your adapter is not connected to any sensors before proceeding. 2. Execute XLoader.exe and select “Uno”. Select the Com port with the highest number. Select 115200 Baud rate. All of the above should be automatic once you select the adapter. 3. Select the firmware file and press upload. Wait until upload complete. 4. Do a quick test by sensing SDI-12 address Zee (z). XLoader: http://russemotto.com/xloader/ Fig. XLoader dialog Need Help with Your Project? If you need more sophisticated data logging scripts such as logging multiple sensors or sensor with more than 6 output values or integrating SDI-12 sensors in projects using Arduino, I might be able to help. Contact me on inmojo.com or leave a message on my blog. I am a full-time physics professor so my time during semesters may be limited. I have more time during the summer though. Inmojo: http://www.inmojo.com/store/liudr-arduino-and-physics-gadgets/contact/ Blog: https://liudr.wordpress.com/ SDI-12 sensor general guide (WIN/Mac/Linux) Each SDI-12 sensor has a one-character alphanumerical address, 0-9, A-Z, a-z. There is only one data line. The sensor shares it with the host/master. The line is usually pulled down using 100𝐾Ω resistor. Some sensors have internal pull-down resistors but others don’t seem to have them. My adapter has this resistor. I think Decagon sensors have some strong internal pull-down resistors. They work even without the pull12 down resistor on the adapter. But if you gang up a number of them, the effective pull-down may become too strong for non-Decagon brand sensors to respond. SDI-12 commands To communicate with a sensor, you need to send a command to it. Each command starts with the SDI-12 sensor address and ends with “!”. Each sensor response also starts with its address but ends with \r then \n. I will use n to represent an SDI-12 address. I will omit \r and \n in the list below. The following commands are the most common ones: n! This makes the sensor respond with its address: n nI! This makes the sensor respond with its identification: n13DECAGON 5TM 387 nAm! This changes the sensor address from n to m. The sensor will respond with the new address: m nM! This causes the sensor to start a measurement. It will respond with the number of seconds it will take to do the measurement and the number of returned values. When it completes the measurement earlier, it will send a service request, which is the sensor address. So the following is from a sensor at address 1 that needs 1 second to do the measurement and return two values. It finishes early and sends a service request. 10012 1 nD0! This causes the sensor to return its measurement. Using nM! alone only carries out the measurement. The results are only returned when nD0! is received. Following the above example, the sensor response will be its address and two values: 1+1.03+24.5 nD1! If the sensor says it returns 6 values but only returns 3, then you need to keep asking it for the rest, using nD1!, nD2! etc. until you receive all 6 values. The maximal number of returned value is 9, limited by the single-digit response in nM! nM1! If the sensor is a probe with multiple sensors in it, then it will likely have a dozen or more values to return. The standard way is to use nM! to request the first 9 values, then use nD0!, nD1! etc. to extract the first 9 values. Then use nM1! paired with nD0!, nD1! etc. to retrieve up to 9 more values, until you retrieve all 13 values. Some sensors pretends to return 9 values but actually returns more. An example is an AquaCheck multi-sensor probe with 12 sensors. It rarely packs 9 sensors in one probe so if it says 9, then it means 12. It is kind of outside the SDI-12 spec. There are also concurrent measurement commands that you can use to speed up the measurements but you can read all about them from the SDI-12 support group: SDI-12 support group: http://www.sdi-12.org/specification.php 14