1
Performance of Networked Applications:
The Challenges in Capturing the User’s Perception
Diana Joumblatt, Renata Teixeira
Jaideep Chandrashekar, Nina Taft
CNRS and UPMC Sorbonne Universites
Technicolor
{diana.joumblatt,renata.teixeira}@lip6.fr {jaideep.chandrashekar,nina.taft}@technicolor.com
ABSTRACT
performance and configuration problems from an end-host upon the
user request [15].
The ultimate goal of such tools is to improve the user experience,
yet such efforts rarely engage the user in the process in order to understand their perception of how the network is performing. Studies of user quality of experience have been limited to a few niche
applications, for instance VoIP [9], online-gaming [2], and video
playback [3,19]. We believe it is important to understand the user’s
perspective in assessing performance degradation. Clearly, a user’s
perspective of what constitutes a problem is a subjective matter.
Such a perspective could potentially be used to decide whether or
not to launch a diagnosis process. For example, if a user’s network
experiences a problem, but the application masks it and the result
doesn’t affect the user, it may not necessary to launch a diagnosis
process.
The critical first step towards automated performance diagnosis and repair of end-hosts is to gather data directly from laptops
or desktops and annotate that data with the user’s perspective. Although some end-host datasets exist [6,8,17], none of them is annotated with the user perceived quality of the performance of the network and applications. The only exception is HomeMaestro [14],
which instrumented the gateway in a small set of homes to capture
all packets and asked home users to keep logs of how they perceive
the network performance. Because it collects traces for a home
and not per end-host and the logs are not automated, they cannot
have fine-grained correlation of each user’s perception of network
performance.
Towards this goal we designed and built HostView1 [11], an
end-host tracing tool that runs on Mac OS and Linux PCs.
HostView collects network traffic, system performance information, and the application associated with network traffic. Importantly, it also prompts the user for feedback on network performance. HostView incorporates two mechanisms for getting user
feedback: a system-triggered questionnaire based upon the Experience Sampling Methodology [5], and a user-triggered mechanism
called an “I’m annoyed!" button. The ESM mechanism prompts
the user no more than three times per day to respond to a questionnaire about their network experience in the five minutes preceding
the questionnaire. The “I’m annoyed!” button is always displayed
at the edge of the screen and we ask users to click on this button
when they are not happy with their network performance. Clicking
the button brings up the same feedback questionnaire as in the ESM
prompts. The particular questions in the questionnaire can be seen
in [12]. For more details on the design of HostView, please refer
to [11].
In this paper, we report on preliminary findings from our first
deployment with HostView. First, we find that there is a great deal
There is much interest recently in doing automated performance
diagnosis on user laptops or desktops. One interesting aspect of
performance diagnosis that has received little attention is the user
perspective on performance. To conduct research on both end-host
performance diagnosis and user perception of network and application performance, we designed an end-host data collection tool,
called HostView. HostView not only collects network, application
and machine level data, but also gathers feedback directly from
users. User feedback is obtained via two mechanisms, a systemtriggered questionnaire and a user-triggered feedback form, that for
example asks users to rate the performance of their network and applications. In this paper, we describe our experience with the first
deployment of HostView. Using data from 40 users, we illustrate
the diversity of our users, articulate the challenges in this line of
research, and report on initial findings in correlating user data to
system-level data.
Categories and Subject Descriptors
C.2.3 [Network Operations]: Network monitoring
General Terms
Human Factors, Measurement, Performance
Keywords
End-host measurement, Network performance diagnosis, User experience
1.
INTRODUCTION
Slow web downloads, choppy Skype calls and YouTube videos,
or broken access to your email server are just few examples of how
Internet disruptions can frustrate the user experience. A number
of research projects aim to help users with tools that automatically
diagnose performance problems. Some of this research has focused
on enterprise networks [1,13] and ISP networks supporting popular
applications such as VoIP [18] or IPTV [16]. Other efforts diagnose
Permission to make digital or hard copies of all or part of this work for
personal or classroom use is granted without fee provided that copies are
not made or distributed for profit or commercial advantage and that copies
bear this notice and the full citation on the first page. To copy otherwise, to
republish, to post on servers or to redistribute to lists, requires prior specific
permission and/or a fee.
W-MUST’11, August 19, 2011, Toronto, Ontario, Canada.
Copyright 2011 ACM 978-1-4503-0800-7/11/08 ...$10.00.
1
37
http://cmon.lip6.fr/EMD
1
Cumulative fraction of users
Cumulative fraction of users
1
0.8
0.6
0.4
0.2
0.8
0.6
0.4
0.2
Median
95th percentile
0
0
1 Kbit/s
10 Kbit/s
100 Kbit/s
1 Mbit/s 5 Mbit/s 30 Mbit/s
100 MB
Data rate = upload + download (logscale)
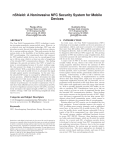
Figure 1: Median and 95th percentile of data rates.
10 GB
Figure 2: Trace size for the first two weeks of collection.
Ranking by users
1. Firefox
2. Skype
3. Safari
4. Mail
5. Google Chrome
6. Dropbox
7. iTunes
8. Thunderbird
9. Adium
10. VirtualBox
of diversity in the installed user base – in network speeds, application usage, and the level of network use (§ 2). While expected, the
extent of this diversity took us by surprise and necessitated several
modifications to Hostview after it was released (to support particular users). This experience leads us to believe that monitoring
tools must be designed so as to adapt to particular individuals. Second, collecting feedback from users, particularly about poor network performance, is fundamentally challenging because it is hard
to collect sufficient statistics about rare events. By allowing two
different mechanisms to register their feedback, our tool is able to
collect a reasonable number of reports (§ 3). We were able to collect 576 total reports from users in a 2 week period, 95 of which
were deemed instances of poor network performance. Finally, we
find that a small set (seven, to be exact) of relatively simple performance metrics are able to uncover problems in a vast majority
of cases where user’s report performance problems. In 82 out of
the 95 poor performance instance, at least one of the metrics also
exhibits “anomalous” behavior (§ 4).
2.
1 GB
Volume of traces uploaded to HostView server (logscale)
Ranking by bytes
1. uTorrent
2. Safari
3. SSH
4. Firefox
5. Google Chrome
9. smbd
6. Skype
7. Mail
8. VLC media player
10. Chromium
Table 1: Top-ten applications.
toolkit [7], so traffic to web-based applications such as Facebook
or YouTube will appear under the browser name. We see that a
number of our popular applications, such as web browsers, e-mail,
and Skype, are similar to popularity rankings by the broader community captured in the the wakoopa ranking2 . It is interesting to
contrast the most popular applications with the applications that
transfer the most bytes. The web browsers and Skype appear in
both lists. Given that Bittorent transfers files, videos and other (often large) content, it isn’t surprising that it tops the list in terms of
number of bytes. The fact that SSH appears in the top-ten reflects
the working habits of computer scientists.
Third, we observe behavioral diversity, even with a bias towards
computer scientists. For example, network usage varies considerably across the set of studied users. We compute data rates per
user as the number of bits downloaded plus the bits uploaded every
second. A user’s data rate reflects both the capacity of her access
network and the amount of data exchanged by applications. If a
user is connected to a 100 Mbits/s Ethernet but only reading text
email, the data rate will be low. Inversely, if a user is downloading
movies over a 512 Kbits/s DSL line, the download can only go as
fast as the DSL link. Fig. 1 presents the cumulative distribution
of the median and 95th percentile of data rates per user (computed
over the two week period) in log scale. This figure shows that both
statistics vary by orders of magnitude across users. There is also a
significant difference between the median and the 95th percentile
data rates, which indicates that individual users generate very different data rates over time.
This difference in network usage also reflects on the volume of
trace data collected for each user. Fig. 2 shows the cumulative distribution of the HostView trace size (in bytes) collected during the
first two weeks for each of the 40 users (x-axis is in log scale). This
figure shows that trace sizes vary from tens of megabytes to over
USER CHARACTERISTICS
Our first deployment of HostView was between November 2010
and February 2011. The data in this paper comes from 40 users
(26 on Mac OS and 14 Linux users). Although many users ran
HostView for over a month, this paper analyzes data from the
first two weeks of each of these users for the purposes of consistency. We gathered these users both via publicity and via incentives. We publicized HostView by distributing leaflets during
the ACM Internet Measurement Conference 2010 and by sending
emails to a number of CS mailing lists in November 2010. We
offered two types of incentives for users to install HostView. First,
HostView reports “network usage” summaries, where users can see
their throughput as well the fractional bandwidth of active applications. Second, we offered 50 USD Amazon gift cards to a set of 40
users randomly picked from the first 100 who run HostView for an
entire month.
Given that we mainly recruited users from the networking community and that HostView runs only for Mac OS and Linux, we
expect that most of our users are computer experts. Despite this
bias and the small number of users, our users exhibit a great deal
of diversity in many ways. First, our users come from 14 different
countries in Europe, North and South America, Asia-Pacific, and
Middle-East. Second, the total number of different applications
employed by these users over two weeks was 385. Table 1 presents
the top-ten applications in our traces in terms of the number of
users and the number of bytes transferred. Application names are
identified in HostView from the system process names using the gt
2
Wakoopa is a social networking site that tracks the applications
used by its members: http://social.wakoopa.com/software
38
ten gigabytes. The trace size depends not only on the data rates, but
also on other factors such as the amount of time a user spends online, the applications used, and a person’s use of HostView’s pause
feature. The offered pause function allows users to temporarily
halt data collection. Our analysis of HostView logs shows that 26
users never paused the data collection, other users paused it only
few times (at most 4 times during the two week period), except for
one user who paused it 13 times. The users with the smallest traces
never used the pause button; they simply spent little time online.
In summary, we observe user diversity over orders of magnitude
in terms of data rates and volume of network data generated; and
we observe some outlier user behavior in terms of their use of the
pause feature.
3.
Completed
541
ESM
Deferred
311
I’m annoyed!
Not Answered
448
35
Table 2: User feedback (1335 questionnaires)
3.2 Sampling users for feedback
The study of network disruptions as perceived by end-users
presents fundamental challenges in getting sufficient data for the
task at hand. The challenge is in figuring out at what time and
under what conditions to sample a user. By “sample a user” we
mean the act of popping up a questionnaire and getting the user
to complete it. We identify five issues in gathering both machine
and user data during the very moment of a performance problem.
First, poor performance events are by definition supposed to not
be the norm, and thus depending upon the user’s machine and network, such events could be far and few between. Second, in order
to avoid user annoyance, the questionnaire should pop up a limited
number of times per day. We selected to use 3 based upon the results of our 400-person survey [10]. Third, the questionnaires need
to be spaced somewhat far apart - again to minimize user annoyance. This is complicated by the fact that predicting user uptime is
hard [11] which makes the task of deciding when to next pop up a
questionnaire difficult. On days when the user doesn’t use her PC
much, fewer than 3 samples could be collected. Fourth, promising
the user that they will be asked to fill out the questionnaire less than
a small finite number (e.g. 3 times a day), means that once they are
all filled out, another questionnaire cannot be issued even if a poor
performance epoch occurs. Fifth, there is a large diversity of user
willingness [10] and we suspect that there will also be a wide range
in the consistency within users fill-in the questionnaires.
All of this means that popping up questionnaires randomly, when
limited to 3 a day and multiple hours in between questionnaires,
isn’t going to generate many surveys at poor performance epochs.
To improve the chances we designed HostView (described in [11])
to pop up the questionnaires using a scheme that weighs bad performance moments more heavily when deciding when to pop-up
the questionnaire. Remember, that our “I’m annoyed!" button also
increases the chances of getting feedback since the user can elect
to engage it at any time.
How did our users respond to the two mechanisms for gathering
data? Table 2 presents a summary of the responses we gathered.
The numbers in the first 3 columns, under the ESM heading, refer to system-triggered questionnaires. We received 541 completed
surveys that came from 35 users, indicating that most of our users
(88%) used the ESM mechanism regularly. This also implies that
5 of our users never responded to the system-triggered questionnaire. Unfortunately we found that 448 questionnaires were never
answered; this count refers to questionnaires that popped up and
either were closed by the user or timed out after 6 minutes because
the user ignored it. The 311 Deferred questionnaires refers to the
number of times a user hit the "Ask Me Later" button when the
survey popped up. Of the deferred questionnaires, we found that
roughly 23% were completed the following time the questionnaire
popped up. We found that 80% of the deferred questionnaires were
answered within a 12 hour period. This illustrates that the deferral option is a good feature to have in ESM system. Overall we
found that the majority of our users did use the ESM mechanism
and complete the questionnaires, however this same set of users
also left plenty of questionnaires empty and made regular use of
the deferral option. We obtained 28 reports from 8 users that were
generated from the “I’m annoyed!" button. Only 11 of our users
used both the ESM and “I’m annoyed!" button mechanisms. This
CHALLENGE: USER DIVERSITY
Although the diversity in user behavior is attractive for gathering
a broad set of data, and for subsequent analysis, this same diversity leads to challenges in this line of research, as discussed in this
section.
3.1 Monitoring tool design
There are often many ways to carry out the software design of a
particular component in the monitoring tool itself. The “best" design may in fact depend upon the configuration and usage patterns
of a user’s computer. We illustrate this point with one example and
discuss the implications for monitoring tool design.
A core component of an end-host monitoring tool is the ability to upload the collected data from an individual machine to a
back-end server for later processing. This should be done in a way
that does not impact the PC performance nor annoy the user. One
approach is to upload the most recent trace all at once, per each
data transfer attempt (we try every 4 hours). This way the task
completes quickly and removes potentially large trace files off a
user’s machine in one step. We tried this approach initially and
found that although it worked for the majority of users, there were
a few who reported problems because uploading traces was consuming too much bandwidth and impacting machine performance.
We learned that these users in fact suffered (with some regularity)
from very low bandwidth rates, illustrating that one cannot make
assumptions even about minimal upload quality.
We redesigned this mechanism following a second approach that
also attempts to upload every four hours, but that introduces two
features to avoid consuming too much bandwidth. First, it caps
the upload bandwidth at 100 Kbits/s. Second, it sends traces split
in 2 Mbytes chunks. After sending each chunk, if the chunk is
larger than 150 Kbytes and the achieved throughput is less than
10 Kbits/s, then HostView aborts uploading the trace and tries again
after four hours. This check ensures that if a user is at a place
with bad network connectivity, HostView will not exacerbate the
problem. Four of our users are running the new upload algorithm
and no uploading problems have since been reported.
We conclude that the diversity in trace sizes and network connectivity of an individual’s machine implies that a “one-size-fits-all"
approach isn’t necessarily the best design paradigm for end-host
tracing tools. Moreover it seems a shame to have to design a tool
for the worst case scenario, i.e. the few users with problems. We
have come to believe that developing monitoring software whose
configurations are adaptive is the right design paradigm for the future development of end-host tracing tools. For example, a tool
could be adaptive in that it first observes the user’s behavior or the
machine performance and then selects among a few options for uploading the trace data.
39
1.1
1.1
RTT
TCP RST
TCP RETR
1
0.9
0.9
0.8
0.8
0.7
0.7
0.6
0.6
0.5
0.5
0.4
0.4
0.3
0.3
0.2
0.2
0.1
0.1
0
0
-0.1
-0.1
-2
-1
0
Time in minutes
+1
Data Rate
Wireless noise
Wireless signal strength
1
+2
-2
-1
0
Time in minutes
+1
+2
(a) ‘I am annoyed : Speed rate: Slow; Application: iTerm; Problems: (b) I am annoyed: Speed rate: Super slow; Problems: “Slow down“Can’t connect to some sites or services”
load or upload”
Figure 3: Correlation of poor performance reports with system and network performance indicators
indicates that many users prefer one mechanism over the other and
thus having both definitely improves the chances of obtaining the
target user feedback data.
In the following, we focus on the poor performance reports out of
the 569 completed questionnaires (541 from ESM and 28 from the
“I’m annoyed!" button) . We say a completed questionnaire constitutes a poor performance report if the user rated their connection
quality as either a 1 or a 2, out of a 5-point scale (with 5 being the
fastest) or if the user explicitly named an application they believe
to be performing poorly or provided a description of the problem.
Among the 541 ESM questionnaires, 67 of them were poor performance reports, and these were generated by 23 users. So in total,
over our 2 week period, we received 95 poor performance reports
from 24 users.
All of this points to the fact that in order to get sufficient data, a
large number of users are needed, or the measurement experiment
needs to be run for a very long time. Simply scaling up the number
of users is at odds with well known practices in the HCI community. There, most surveys are done with a small set of users (say
20) [4] and the users agree to respond to the questionnaires. This
well accepted methodology has the advantage that the users participating will use the tool properly, thus enabling a qualitative study.
However the disadvantage of this approach is that the number of
users that participate is very limited (i.e. rarely in the hundreds).
In the Internet measurement community, we are used to data gathering activities that assembles thousands or millions of data points
from an ongoing stream of events. Further exploration is needed
in approaches that target a large user base, even if they are only
partially trained or aren’t guaranteed to be diligent in responding
to feedback questionnaires. (Although we only present data from
40 users here, our next deployment will target a much larger user
base.)
4.
1.1
1
0.9
0.8
0.7
0.6
RTT
Data Rate
0.5
0.4
0.3
0.2
0.1
0
-0.1
-2
-1
0
+1
+2
Time in minutes
Figure 4: ESM: Everything Good
TCP retransmissions, which counts the number of segments retransmitted (per second); TCP resets, measured as the number of
packets containing a RST flag (TCP reset); CPU load, the CPU
utilization measured at 30 second intervals. Finally, when the
end-host had an active and operational wireless interface, we also
logged wireless signal strength and wireless noise, as reported by
the airport or iwconfig utilities (on Mac OS and Linux, respectively).
For each of these seven performance indicators, we define an
anomaly as follows: we build a distribution of the values using two
weeks of data and identify the 5th and 95th percentile values of the
distribution. We consider an instance of a metric that falls inside
this range (5th to 95th percentile values) to be normal. We consider
the following cases to be anomalous: i) if the RTT, CPU load, TCP
retransmissions or wireless noise exceed the 95th percentile value;
ii) if the data rate or wireless signal strength fall below the 5th
percentile value; or iii) any instance of a any TCP reset.
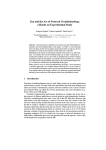
We now look at some detailed examples that illustrate the sequence of events in time that occur just before and after a user
completes a poor performance report. Figures 3(a), 3(b) and 4
all follow the same format; the time the user submitted the report
is marked 0 on the x-axis (indicated by the vertical line) and we
assume the poor performance epoch occurred close to this time.
The brief time series on the x-axis indicates what occurred for 2
minutes before and after the report was filed. Because the performance metrics all have different ranges, we rescaled them so
as to be able to view them (y-axis) on the same plot. The normal range is mapped to values between [0, 1] with the 5th (95th )
percentile value mapped to 0 (1), respectively. Values in the
range [min, 5th percentile] (and that in [95th percentile, max])
USER REPORTS ON PERFORMANCE
We now compare user reports of poor performance with system
and network performance metrics that are easily measured automatically. We start with a simple analysis in which we consider
seven basic metrics, and seek to understand if the poor performance
epochs (as flagged by the user) co-occur with any of our automated
metrics experiencing atypical, or “anomalous" behavior.
The specific performance indicators, seven in all, that we extracted from the traces are as follows: Round-trip times (RTTs),
computed as the elapsed time between sending a TCP packet and
receiving the corresponding acknowledgment; Data rate, the aggregate bandwidth (in both directions) measured in bits/second;
40
Problem (number of reports)
Slow browser (27)
Slow download or upload (24)
Poor voice or audio quality (14)
Poor video quality (11)
Can’t connect to some sites or services (10)
Total (95 reports)
Data rate
14
12
7
5
3
38
Wireless signal strength
2
2
0
2
1
8
Wireless noise
0
1
0
0
1
2
CPU load
10
7
2
2
3
24
RTT
18
17
8
7
8
56
TCP reset
23
22
9
9
8
74
TCP retransmissions
14
14
2
6
6
38
Table 3: Breakdown of anomalies across bad performance problems picked by users
are mapped to [−0.1, 0] (and [1, 1.1] respectively). Thus anomalies
are those falling below 0 or above 1 (depending upon the metric).
TCP RSTs are treated differently, and we simply mark the time that
the RST was observed.
In Figure 3(a) the user reported a bad performance epoch by
using the “I’m annoyed!" mechanism and provided the additional
context: “Speed rate: Slow”; “Application: iTerm”; “Problems:
Can’t connect to some sites or services”. Here we see that the RTTs
appear to rise and fall, and occasionally cross the y = 1 line (i.e.,
exceed the 95th percentile of the distribution), and we posit that
the performance problem experienced by the user was due to the
very large round trip times observed. This variation (pattern) in
RTTs is typical behavior when the user is behind a large buffer.
The stream of packets exchanged with the end-host gradually fills
up the buffer introducing additional latency. When the buffer fills
up, it starts dropping packets causing TCP connections to reduce
their rate; this buffer bloat issue is becoming a major problem for
ISPs (see http://www.bufferbloat.net/). To keep the
plot readable, we only indicate the performance metrics relevant to
this instance being anomalous.
Figure 3(b) is another instance where the user complained about
bad performance. Here, the metrics plotted are data rate, wireless
signal strength, and wireless noise. We see that the wireless signal
strength is consistently below the 5th percentile value (below the
y = 0 line) around the time the user complained. In this case, the
user annoyance with their performance may have been due to poor
wireless quality that adversely affected the available bandwidth.
In the above two cases we found anomalous events co-occurring
with the user’s poor performance report and thus could postulate
that when network performance was at the fringe of its normal behavior, this particular user unhappy with it. Two other scenarios
are possible in terms of the consistency between system metrics
and user reporting. If the performance metrics are anomalous, but
the user files a report indicating there is no problem, then this is an
indication that the user can tolerate such performance levels. On
the other hand, if a user files a report indicating poor performance
and none of our metrics exhibit anomalous behavior, then it means
that more metrics are needed to understand what annoyed the user.
(Clearly, our seven metrics considered here are merely a starting
point, and we plan to examine others, especially application level
metrics, shortly.)
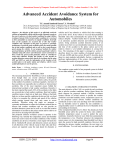
Figure 4 shows an example of a completed ESM performance
report. The user said there was no problem when completing the
report, yet it is very clear from the figure that the RTT values consistently exceed the 95th percentile values, and this is also reflected
in the low data rates. We looked into this case in more detail and
found that at the time the report was completed, the user had 3 processes running: a large file transfer to a foreign country, mail and
HostView. HostView was engaged in a data upload to a central
server but this activity was capped at 100 Kbps and the RTTs to
the server were between 0.7 and 0.8 in Figure 4; the mail activity
generated minimal traffic, however the RTTs for the file transfer
traffic were above 95th percentile. In this mix of applications, it is
possible that the user was happily reading emails and not bothered
if the file transfer occurred slowly.
We performed this type of analysis over all of the 95 poor performance reports we received. Overall, we found that in 82 out
of these 95 instances, at least one of our seven performance metrics exhibited anomalous behavior. The anomalies that we could
associate with each of these 82 poor performance reports are summarized in Table 3. The first column indicates the type of problem
the user selected (among a list of choices that included ‘Other’ and
‘None’). The number next to the problem indicates the number of
reports received of that problem type; for example, we received 27
reports about slow browsers. The count in the data rate column indicates that in 14 of those 27 reports (row 1), the data rate metric
crossed its threshold line for our simple definition of anomalous.
Note that the values in a single row can exceed the total number
of reports because sometimes in a single report, multiple metrics
can be anomalous. In order to explain the 13 reports for which we
found no anomalous event across our performance indicators, we
need to examine additional performance metrics.
We see in the table that all of our metrics, except wireless noise,
were implicated in some problem. We are not claiming that the
poor performance epoch a user experienced was caused by the
anomaly we observe; in fact our metrics often themselves indicate
some other underlying performance problem. We are merely claiming that there can often be simple indicators that track user annoyance, and the fact that our seven metrics are helpful in explaining 82
of the 95 poor performance reports we received is promising; one
may not need to look at hundreds of features to understand the majority of incidents. Pinpointing the exact root causes for poor network performance problems is a challenging task and much more
work needs to be done. Our work here is an initial foray toward the
eventual goal of detecting performance degradations on the fly and
performing proactive mitigation where possible.
5. CONCLUSION
We learned some interesting lessons in our first deployment of
HostView. First, we believe that designing for diversity is an
important paradigm in the design of end-host tracing tools. Designing for diversity implies that both the monitoring tool and the
user-feedback mechanism should be adaptive. Second, due to the
multiple challenges in getting user feedback data at poor performance epochs, we believe that the sampling mechanism should be
weighted to prompt users when anomalous events occur. Third, we
found that despite all of the challenges in collecting feedback for
performance diagnosis, the two sampling methods we used together
generated a fair amount of feedback. Fourth, we found that most
users reporting poor performance episodes did so consistently and
that reports often correlate with some performance metrics exhibiting outlier behaviors. This is promising for research in the area of
automated diagnosis at end-hosts.
Acknowledgements
This project is supported by the European Community’s Seventh
Framework Programme (FP7/2007-2013) no. 258378 (FIGARO)
and the ANR project C’MON.
41
6.
REFERENCES
[1] P. Bahl, R. Chandra, A. Greenberg, S. Kandula, D. Maltz,
and M. Zhang. Towards Highly Reliable Enterprise Network
Services via Inference of Multi-level Dependencies. In ACM
SIGCOMM, 2007.
[2] K.-T. Chen, P. Huang, and C.-L. Lei. How sensitive are
online gamers to network quality? Commun. ACM,
49(11):34–38, 2006.
[3] K.-T. Chen, C. C. Tu, and W.-C. Xiao. Oneclick: A
framework for measuring network quality of experience. In
Proceedings of IEEE INFOCOM 2009, 2009.
[4] S. Consolvo, J. Jung, D. Avrahami, P. Powledge,
B. Greenstein, and G. Maganis. The Wi-Fi Privacy Ticker:
Improving Awareness and Control of Personal Information
Exposure on Wi-Fi. In Proc. of Ubicomp, October 2010.
[5] S. Consolvo and M. Walker. Using the Experience Sampling
Method to Evaluate Ubicomp Applications. IEEE Pervasive
Computing Magazine, 2(2), 2003.
[6] E. Cooke, R. Mortier, A. Donnelly, P. Barham, and R. Isaacs.
Reclaiming Network-wide Visibility Using Ubiquitous
Endsystem Monitors. In Usenix Technical Conference, 2006.
[7] F. Gringoli, L. Salgarelli, M. Dusi, N. Cascarano, F. Risso,
and K. Claffy. Gt: picking up the truth from the ground for
internet traffic. In ACM SIGCOMM CCR, 2009.
[8] S. Guha, J. Chandrashekar, N. Taft, and D. Papagiannaki.
How Healthy are TodayŠs Enterprise Networks? In Proc. f
the Internet Measurement Conference, October 2008.
[9] W. Jiang and H. Schulzrinne. Modeling of packet loss and
delay and their effect on real-time multimedia service
quality. In Proc. NOSSDAV, 2000.
[10] D. Joumblatt, R. Teixeira, J. Chandrashekar, and N. Taft.
[11]
[12]
[13]
[14]
[15]
[16]
[17]
[18]
[19]
42
Perspectives on Tracing End-Hosts: A Survey Summary. In
SIGCOMM CCR, April 2009.
D. Joumblatt, R. Teixeira, J. Chandrashekar, and N. Taft.
HostView: Annotating End-Host Performance
Measurements with User Feedback. In HotMetrics, ACM
SIGMETRICS Workshop, 2010.
D. Joumblatt, R. Teixeira, J. Chandrashekar, and N. Taft.
HostView User Manual. http://cmon.lip6.fr/EMD/
Download_files/user-manual_Linux.pdf, 2010.
Pages 4,6.
S. Kandula, R. Mahajan, P. Verkaik, S. Agarwal, J. Padhye,
and P. Bahl. Detailed diagnosis in enterprise networks. In
ACM SIGCOMM, 2009.
T. Karagiannis, C. Gkantsidis, P. Key, E. Athanasopoulos,
and E. Raftopoulos. Homemaestro: Distributed monitoring
and diagnosis of performance anomalies in home networks.
Technical Report MSR-TR-2008-161, Microsoft Research,
2008.
C. Kreibich, N. Weaver, B. Nechaev, and V. Paxson.
Netalyzr: illuminating the edge network. In IMC, 2010.
A. Mahimkar, Z. Ge, A. Shaikh, J. Wang, J. Yates, Y. Zhang,
and Q. Zhao. Towards Automated Performance Diagnosis in
a Large IPTV Network. In ACM SIGCOMM, 2009.
C. R. Simpson, Jr. and G. F. Riley. NETI@home: A
distributed approach to collecting end-to-end network
performance measurements. In PAM2004, April 2004.
V. Singh, H. Schulzrinne, and K. Miao. DYSWIS: An
architecture for automated diagnosis of networks. In IEEE
Network Operations and Management Symposium, 2008.
S. Tao, J. Apostolopoulos, and R. Guérin. Real-time
monitoring of video quality in IP networks. IEEE/ACM
Trans. Netw., 16(5):1052–1065, October 2008.