1
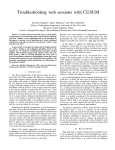
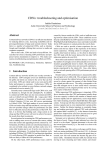
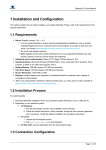
Troubleshooting Slow Webpage Downloads
Heng Cui and Ernst Biersack
EURECOM,
Sophia Antipolis, France
Email: [email protected]
Abstract—One common way to search and access information
available in the Internet is via a Web browser. When clicking on
a Web page, the user expects that the page gets rendered quickly,
otherwise he will lose interest and may abort the page load. The
causes for a Webpage to load slowly are multiple and not easy to
comprehend for an end-user. In this paper, we present FireLog,
a plugin for the Firefox Web browser that relies on passive
measurements during users’ browsing, and helps identify why
a web page loads slowly. We present details of our methodology
and illustrate it in a case study with real users.
I. I NTRODUCTION
Web browsing is a very common way of using the Internet
to access to a wealth of information. Examples for Web
browsing are consulting a Wikipedia entry, accessing a news
page, on-line shopping, or viewing user generated content such
as YouTube or Dailymotion. Results from both research [1]
and industry [2] have also shown that Web traffic dominates
over peer-to-peer traffic. Therefore, performance related to the
“Web” is especially important. For businesses, page load speed
is also closely linked to revenue. A survey [3] even shows
that for a $100, 000/day e-commerce web site, 1-second more
delay means the loss of 2% of its customers and a $2.5 million
reduction in the yearly revenue. Amazon.com [4] also reported
that, every 100 ms increase in the page load time decreases
their sales by 1%.
In this paper we present FireLog, a tool and methodology
to quantify web page load performance limitations. We define
a set of quantitative metrics that are computed from passively
measured performance metrics. We then use our classification
scheme to derive a root cause for a given web page load
performance. Finally, we apply our tool to set of real home
users over a period of 5 months.
II. D IAGNOSIS T OOL D ESIGN
A. Browsing Behavior at a Glance
Fig. 1 illustrates the underlying behavior when browsing
page: the main object usually comes first. After that, the web
browser can parse the page structure and load all the objects
refered to in the web page. In order to reduce download times,
parallel connections can be also used. After the page content
is completely downloaded and rendered, the load event is fired
by the browser and the status of the web pages becomes
fully loaded. Although modern web browsers can trigger other
object downloads even after the page status is fully loaded, in
this paper, we do not consider those cases and focus on the
ones that have occurred before page fully loaded.
Fig. 1. An example to show the downloading/rendering of a web page
containing four objects hosted on three different web servers.
B. Tool Description
Our diagnosis tool named FireLog is composed by two
different parts: client side engine for measurement and server
repository for analysis. The client-side part is a plugin to
Firefox, which can be easily integrated into the end users’
browser; While users are surfing their web pages, the plugin
will record a list of metrics (described later) and periodically
transfer them to the FireLog server located in EURECOM.
To protect user privacy, all URLs and server host names
can be also hashed before the transfer. Moreover, the user
also has the option to enable/disable the measurement. From
our evaluations, we observe the overhead of the plugin is
negligible and the recorded timestamps are accurate enough
for our needs. We do not show the evaluation results in this
paper due to space limitations. For the server repository, we
configure an Apache/PHP as front-end that accepts measurement data from the clients and then transfers the raw data into a
PostgreSQL database. The diagnosis modules are implemented
in the PL/PgSQL language.
C. Metrics
As it turns out, modern web browsers provide a rich set
of events useful for our task, which can be captured by our
plugin and used to derive the metrics of interest [5]. For the
illustration of the key metrics measured by FireLog, see Fig. 2:
When a given web page is accessed by the user, the browser
will start to fetch the objects that make up that web page. In
this case, there will be different status events appearing in
the browser. In Fig. 2, the downloading activity starts at t1
with a DNS name resolution. We measure the time elapsed
between the DNS query (t1 ) and its response (t2 ) as the DNS
delay (dns = t1,2 ). During this a period, a looking up
text message appears in the browser’s status bar. After the
Fig. 3.
Fig. 2.
Metrics
DNS lookup, at (t3 ), which corresponds to sending a SYN
packet, a connecting to text message appears in the status
bar until the client receives the SYN/ACK packet (t4 ), We
refer to this time interval as TCP connecting (or handshake)
delay (tcp = t3,4 ). Whenever the browser detects that its TCP
connection is established, it will immediately change its status
(t6 ), waiting for appears in the status bar, and an HTTP
′
query (t6 ) is sent. While we are waiting for the HTTP response
data from the web server, several things can happen: the web
′
server can either directly send back the data (t8 ), or first send
′
back the TCP ACK (t7 ) and then return the data. However, at
browser level, we can only capture a browser status event that
will be triggered at t8 when receiving the first data. We define
t6,8 as the total HTTP query delays (http = t6,8 ). After
a successful HTTP response, the browser keeps downloading
the object data from web servers until it is finished at t9 .
Besides the metrics just introduced, we can also measure in
the browser metrics such as page load time, total number of
objects downloaded and total number of bytes downloaded.
III. D IAGNOSIS S CHEME
From previous discussion we can see that a large number
of steps need to be executed to completely render a web
page and a number of components are involved in generating
transmitting and rendering the content. As is shown in Fig. 3
these components are (i) the PC of the client, (ii) the local
access link, (iii) the remaining part of the Internet, and (iv)
the servers. A slowdown at any of these components will affect
the page load time. The goal of our work is to identify which
of these components bears the major responsibility for the slow
web page load.
We are well aware that the “overall picture” is more
complicated and that, other factors may affect page load time
as well such as the web page size itself in terms of number
of objects or total bytes.
Also, we focus on the performance degradation problems
while ignoring connectivity issues that have been the focus
End to end path
Algorithm 1 Web Page Diagnosis Scheme
Input: current web page (P), page load time (P LT ), start
(tsistart ) and end (tsiend ) downloading timestamp for each
object, each object HTTP query delay (httpi ), each web
server TCP connecting delay (tcpip ), current page downloaded object number (N ) and bytes (B).
Output: web page limitation cause
1: function W EB D IAGNOSIS
2:
Idle ← null
3:
C.App.Score ← null
4:
Serv.Score ← null
5:
for P
all objects i ∈ P do
6:
Idle ← T OTAL
I DLE(P, tsistart , tsiend )
P
Idle
7:
C.App.Score ← P LT
8:
if C.App.Score ≥ thc then
9:
return client
side
limit
P
i
10:
HT T P ←P http
N
tcpip
11:
T CP ← #ip
12:
if HT T P ≥ thms then
⊲ either server side, or
network problems, empirical threshold
TP
13:
Serv.Score ← HT
T CP
14:
if Serv.Score ≥ ths then
15:
return server side limit
16:
else
17:
tcpip
base ← G ENERATE P ERF BASELINE(dataset)
18:
T ← current time ±5 minute ⊲ time window
19:
Res ← NetwDiagnosis(P, T , tcpip
base )
20:
21:
22:
23:
24:
if Res 6= null then
return Res
′
′′
if N ≥ thrsize or B ≥ thrsize then
return page size limit
return unknown ⊲ no performance anomalies found
of other – complementary – tools such as WebProfiler [6]
Netalyzr [7].
A. Proposed Heuristics
Based on the above limitation discussions, we describe our
proposed diagnosis heuristics in this section.
1) Main Scheme: Algorithm 1 shows the global diagnosis
scheme. While we do not have the space to explain all the
details, we focus on the main ideas. We check which of the
components in Fig. 3 makes the main contribution to a slow
page load and we proceed as follows:
Algorithm 2 Network Diagnosis Scheme
Input: current web page (P), current time window (T ),
network performance baselines (tcpip
base ).
Output: network limitation cause
ip
1: function N ETW D IAGNOSIS (P, T , tcpbase )
2:
U ← null ⊲ array for current page perf. degradation
3:
V ← null
⊲ array for recent perf. degradation
4:
∆ ← null
⊲ temp. variable
5:
for each ip ∈ P do
6:
∆ ← tcpip − tcpip
⊲ network degradation
base
7:
insert ∆ into U
8:
if mean(U) ≤ thms then
⊲ no network anomaly
9:
return null
10:
for each ip ∈ T do
google
11:
if tcpip
⊲ closer IP
base ≤ tcpbase + thms then
12:
∆ ← tcpip − tcpip
⊲
network
degradation
base
13:
insert ∆ into V
14:
remove min and max values from V ⊲ filter outlier
15:
if V is not diverse enough for its IP samples then
16:
return null
)−mean(V)
⊲ coincident with others
17:
F1 ← mean(U
stddev(V)
18:
19:
20:
21:
22:
mean(V)
⊲ local degradation contribution
F2 ← mean(U
)
if F1 ≤ thF 1 or F2 ≥ thF 2 then
return local network
else
return wild internet
Client side diagnosis: lines 5-9 are used to diagnose client
side causes. We defined the C.App.Score, which captures
the fraction of idle periods compared to the total time (see
also Fig. 1). A high C.App.Score is an indication that the
page rendering takes a long time, which could be due to the
fact that the client PC is overloaded.
Network and server side diagnosis: In case there is no
client side anomaly, we now check the quality of the communication between the client and servers, which comprises both,
the network path and the server response times. We first use
an empirical threshold thms in line 12 to check whether the
average http delay is too high. If this is the case, we use the
limitation score Serv.Score to further distinguish between
network causes and server side ones. Lines 13-15 show the
diagnosis for server side causes,while lines 16-19 correspond
to the network side diagnosis.
Other factor diagnosis: In case no previous abnormal
behaviors are found by the heuristic, we finally check the page
property itself in line 22. We use two empirical thresholds for
both object number and bytes to achieve that.
2) Network Case: As is discussed previously, for the
network causes, we try to narrow down whether it is the
local access or the “wild” Internet. To that purpose, we use
measurements for different servers made in a predefined time
window. Details are shown in Algorithm 2. In order to be able
to conclude the network degradation for a connection to given
server, we compute baseline performances for all the servers.
Algorithm 3 Network Performance Baseline Generation
Input: whole dataset for a single user (dataset)
Output: network performance baseline for each IP subnet
1: function G ENERATE P ERF BASELINE (dataset)
2:
if baseline data tcpip exist for this dataset then
3:
return all tcpip
⊲ do nothing
4:
BaseListip ← null
5:
for all objects from ip subnet do ⊲ IP/24 prefix as
subnet
ip
ip
6:
tcpip
base ← min(tcp10%th , http10%th )
ip
7:
insert tcpbase into baseline result table
8:
return all tcpip
base
Algorithm 3 shows the details of how to extract the baseline
where the basic idea is to choose a lower bound (e.g. currently
use 10-th percentile) value for each server in a /24 subnet.
We do this aggregation by the IP prefix to accumulate more
samples for each group and make the estimated baseline more
robust.
For the network diagnosis in Algorithm 2, we can divide
it as followings steps: lines 5-7 pick up the contacted servers
of current page and check their network performance degradation; lines 10-13 do similar degradation checking, but also
choose connections that can be also included by other pages.
The idea behind is to pick up the sharing information by different connections (belonging to diverse subnets), in case similar
network degradation is discovered, the cause is probably due
to the common links among those different servers which is
expected to be closer to the client side (e.g. local network
links). The tricky part is shown at line 11 meaning that we only
pick up recently contacted servers that are relatively closer to
the client. In this case, network degradation values are more
useful to detect local network problems. As we see at line 11,
we use Google as a reference1 since Google makes great
effort to place proxies close to the clients in order to cut down
the latency.
Lines 14-15 are used to filter outliers, and check diversity
of our recently selected servers. In order to make the diagnosis
more robust, while keeping enough samples, currently, we only
filter out the minimum and maximum values. To guarantee the
diversity of these servers, currently, we check whether the
number of distinct subnets for those servers is large enough
(e.g. ≥ 5 distinct subnets).
We finally use two criteria shown in line 17 and line 18
to identify a local network problem. F1 is to check whether
the current page experiences a network degradation that also
coincides (is experienced) by all the near-by connections;
while F2 checks whether local causes contribute mostly to the
current page download degradation. As is shown in line 19,
if any of these two criteria holds true, we consider it as local
network causes; otherwise as wild Internet.
1 We consider HTTP request Host headers containing google as key word
to be pointing to the Google domain.
B. Tuning of Thresholds
As we can see, our approach requires to define quite a
few thresholds. To calibrate these thresholds, we have done
multiple controlled experiments in the lab. We briefly illustrate
how we went about.
To set thc (line 8 of Algorithm 1), which is needed for
the client side limitation case, we set up a PC in the lab and
use a tool named CPULimit2 to limit the maximum allowed
CPU usage for Firefox browser. We browse a list of popular
web pages under different CPU limitations and observe the
browsing performance. We compute the C.App.Score for
all these test scenarios, and we find that a value around 0.2
allows to identify high client CPU load.
Next, we need to set the threshold thms to identify high
delays (e.g. line 12 in Algorithm 1, line 8 in Algorithm 2).
In our current version, we manually set thms = 100 ms.
Moreover, such value is also used to separate closer servers
from more remote ones (e.g. useful in line 11 in Algorithm 2),
the reason being that in 2011 and 2012, the minimum RTT
from France to US and east Asia were about 136 ms and 271
ms respectively [8].
To define the threshold ths (line 14 in Algorithm 1), which
is needed to separate network and server side causes, we also
set up a controlled experiment where different client PCs are
connected through a shared bottleneck. One PC is used for web
browsing while another keeps downloading files to generate a
competing traffic at the bottleneck. We browse several popular
web pages for long time and explore a range of values from
(1.0-4.0). We then compute the fraction of sessions classified
as local network limitation. We set the value to 2.5 as larger
threshold values do not improve the accuracy.
For the diagnosis of local network limitation, we use two
criteria in line 19 of Algorithm 2. For these threshold values,
we empirically choose thF 1 = 1, and thF 2 = 0.5.
Finally, we use recent results by Google3 based on billions
of existing Web pages to choose the thresholds for large page
size (line 22 in Algorithm 1). We use the 90-th percentile
values for the page object number and total bytes which are
86, 663.19 KBytes respectively.
IV. H OME U SER D EPLOYMENT
In the following, we present results of a deployment of
FireLog in three different homes for a duration of several
months each. While these results do not replace a careful
evaluation of the tool in a controlled lab environment they,
however, allow to demonstrate the potential of the tool. Although we have no “absolute ground truth”, the fact that we
know the access network characteristics of the three homes
and the web sites browsed allows us to some extend to check
the plausibility of the results.
A. Measurement and Dataset
We select three users that differ in age, education background, and geographical location to guarantee the diversity of
2 http://cpulimit.sourceforge.net/
3 https://developers.google.com/speed/articles/web-metrics
TABLE I
R ESULTS FROM THREE HOME USERS .
user
A(F R)
B(F R)
C(CN )
Totally Browsed
pg.
dom.
obj.
3,451
579
501,102
1,788
263
87,898
3,766
535
317,700
duration
5 month
3 month
2 month
pg.
808
281
466
Bad Performance
dom.
obj.
247
142,939
114
24,406
183
63,619
the browsed web pages. Two of our users are located in France
while another one is in China. A summary of our collected
data is shown in Tab. I4 . All these users have accessed a large
number of pages. Since our goal is to diagnose web pages
with high load times, we focus on the ones with whose page
load time larger than 10 seconds and refer to them as high
load time ones.
B. Main Limitations
Tab. II shows the main classification results by our diagnosis
scheme. We see that for all three users, there are always around
20% of the problems are due to the client side. Meanwhile,
user A suffers quite a lot from network performance problems,
both, local network and wild Internet. We also find for users
B and C that around 40% of the high load times are due to
the server side. In the following, we look at these results in
more detail.
TABLE II
L IMITATION C AUSES FOR W EB PAGES WITH HIGH LOAD TIMES
User
A
B
C
Client
21%
28%
21%
Server
4%
39%
44%
Main cause
Local access
29%
9%
9%
Internet
32%
10%
6%
others
14%
14%
20%
1) Client Limitation: We first focus on the client side
limitations. Fig. 4 shows the C.App.Score for all these high
load time web pages. We find that in around 80% of the cases
for all these users, the C.App.Score is quite small; while for
the remaining web pages, the score takes values up to more
than 0.9. Since the curve bends at a value of about 0.2 for
C.App.Score, we feel comforted in setting the threshold to
0.2.
2) Network Performance: The high page load times of user
A are in many cases due to poor network performance. User
A lives in a student residence with a shared WIFI link that
is frequently overloaded. As we can also see from Fig. 5, its
RTTs to Google are much higher than for user B. In Fig. 5,
around 80% TCP RTTs for user B are smaller than 30 ms
and 90% is smaller than 100 ms. Meanwhile, for user A,
performance is much worse and half of the values are larger
than 100 ms.
As we can also see from Tab. II, the poor performance in
wild Internet is another main limitation reason for high page
load times experienced by user A. In this case, we choose web
pages whose high page load are caused by the wild Internet
4 #pg.: number of web pages, #dom.: number of web domains, #obj.: total
number of objects in the web page.
All Google TCP Connecting Delays
1
1
1
0.8
0.6
0.6
CDF
CDF
0.6
0.8
CDF
0.8
0.4
0.4
User A
User B
User C
0.2
0
0
0.2
0.4
0.6
0.8
0.4
0.2
User A
User B
0
10
1.0
100
ms (log scale)
Real World "C.App.Score"
Fig. 4.
Fig. 5.
Client Limitation in the Real World
and compare them with the ones where the local network
causes high page load times. We look at the fraction of objects
that were downloaded from web servers identified as “furtheraway”. A given web server IP is considered as further-away if
ip
google
its baseline delay tip
base has tbase > tcpbase + 100 ms. From
Fig. 6 we can clearly see that the web pages where the wild
Internet and not the local network is identified as the main
cause of a high page load time fetch much more objects from
servers that have a higher RTT distance.
3) Server Side Cause: Another major cause for high page
load time can be server-side factors, which seem to be predominant for both, user B and C.
1
User A. NonServ.Limited Sessions
UserB. Server.Side.Limited Sessions
1
0.8
0.6
0.6
CDF
CDF
0.8
0.4
0.4
0.2
0
10
tcp
http
100
1,000
ms
(a) User B: Serv.Limit
Fig. 7.
user A: Network.Limited
Wild.Internet.Limit
Local.Netw.Limit
10,000
0.2
0
10
tcp
http
100
1,000
ms
10,000
(b) User A: Netw.Limit
Single Object TCP and HTTP Delay Comparisons
Here we look at one user to explore this issue for more
detail. In Fig. 7(a) we plot all the object TCP connecting and
HTTP query delays of server-side limited pages for user B.
We can clearly see that the network delay between client and
the web servers is low, 60% of the TCP delays are less than
100ms. Since the TCP handshake normally use 3 seconds as
its re-transmission timeout (RTO), we also observe very small
portion(< 2%) of TCP delays with values around 3 seconds,
which may due to network loss. However, if we look at the
HTTP delays in Fig. 7(a), we see much larger values: the
median value is already as large as 500 ms. As a comparison,
in Fig. 7(b), we also plot these metrics for user A, where the
server is rarely the cause for high page load times but rather the
network. Here the network delays are higher (in distribution)
than the http delays. We clearly see some TCP delays around
3 seconds and 9 seconds which are determined by the RTO
values.
1000
Google RTT
0.2
0
0
0.2
0.4
0.6
0.8
Fraction of "far.away" server contacted
1
Fig. 6. All Network Limited Pages for User A
C. Discussion
In this paper, we presented a methodology to diagnose the
cause for high page load times. As we said before, it is close
to impossible to address all possible causes. As an example,
DNS delay is not taken into our account in our approach,
since we find that – from our measured “wild” data – DNS
delays count much less than other delays to web servers. Due
to space constrains, we do not show the detailed results here.
Moreover, we focus on the limitation factors of time variant
metrics such as network delays or server load. While web
page properties such as object number or bytes also have
certain impact on the page load time [9]. However, when
focusing only on web page whose load times are high, these
static features are less important as indicate the correlations
for some of the key metrics with the page load time. Tab. III
reports the results5 for different limitation causes. We first find
that, all the web page property related metrics such as object
number or bytes have much weaker correlation with a given
cause for a high page load time than other dynamic factors
such as total tcp or http delays. Also and not surprisingly, we
find that, for the client limited case, page load time strongly
depends on the total client side idle time; while for the other
limitation scenarios, the total HTTP query delay and TCP
connecting delay impact most server limited and network
limited web browsing sessions respectively. Due to the use
of parallel connections during a page downloading, however,
these correlations are not as strong as for the total idle time
in the client limited case.
V. R ELATED W ORK
The related work can be classified into different categories:
The first one is about tools for web page debugging or
monitoring. For example, Firebug [10] is one of the most
well known tools, which has modules for the page element
inspection or activity visualization. However, Firebug lacks
a systematic troubleshooting model and also introduces a
significant execution overhead as measured by the authors for
Fathom [11].
5 In that table: Nr.Obj and Byte refer to the total object number and bytes
including the cached ones. Nr.Net.Obj. and Net.Byte refer to the total object
number and bytes that are not found in the local browser cache.
TABLE III
S PEARMAN C ORRELATION B ETWEEN D IFFERENT M ETRICS TO PAGE L OAD T IME FOR BAD P ERFORMED W EB PAGES OF A LL U SERS
P
Client.Limit
Serv.Side.Limit
N etw.(local & Internet) Limit
Idle
0.83
0.08
0.25
P
dns
0.18
0.07
0.32
P
tcp
0.24
-0.02
0.60
Another category is about tools for troubleshooting. For
example, Siekkinen et al. in [12] propose a root cause analysis
model for TCP throughput limitations of long connections.
However, this model does not apply in our case since web connections are often quite short in terms of the number of packets
transmitted. A very recent work that also uses a browser
plugin for network troubleshooting is Fathom [11]. However,
the focus is not the same. Fathom more broadly measures a
wide spectrum of metrics that characterize a particular Internet
access such as access bandwidth, bottleneck buffer size, DNS
behavior. In this sense Fathom is complementary to FireLog
since it can be used to further investigate the reasons of high
page load times that FireLog identifies as caused by the local
access link.
The third group of work correlates web browsing performance with page properties (e.g number of objects, use of
CDNs) [9]. Ihm et al. [13] provide a long longitudinal view of
web performance changes. Nah et al. [14] and Cui et al. [15]
include user participation during web page browsing. Both
studies show that page load times of 10 seconds or more will
lead to user dissatisfaction.
VI. C ONCLUSIONS AND F UTURE W ORK
We have presented FireLog, a tool for the end user to
diagnose the causes of slow web page loads. We described our
tool design, diagnosis model, and threshold settings. FireLog
was used by three users over several months, which allowed to
collect a large data set that provided interesting insights into
the diverse limitation categories and the potential of the tool.
There are several interesting extensions for this work:
The analysis in its current form uses thresholds whose
values need to be determined. An alternative approach could
be to simply describe each Webpage download by a vector
of the measured metrics and to use clustering. We have
used clustering in a previous work with good success and
determining the right number of clusters turned out to be
relatively simple.
Currently the measurements are transferred to a server and
the analysis is performed off-line. We plan to integrate the
analysis into the browser so that it can be performed in real
time.
It may be interesting to “combine” the measurement results
of several clients, e.g. of all the web clients using the different
devices in the same home, in order to improve the potential
of identifying more precisely the cause of the performance
impairment: For instance if the WIFI at home is overloaded
and some of the end systems access the internet via WIFI
while others are connected to the home gateway via Ethernet,
the use of multiple devices should allow to distinguish between
P
http
0.39
0.44
0.49
N r.Obj
0.24
0.14
0.36
N r.N et.Obj
0.19
0.13
0.38
Bytes
0.18
0.11
0.35
N et.Bytes
0.09
0.12
0.38
congestion of the WIFI link as compared to congestion of the
access link of the ISP.
There can be situations where not one single reason, but
a combination of several ones to explain a high page load
time; currently FireLog does not handle this case. We plan to
explore the use of Bayesian Networks for this purpose.
VII. ACKNOWLEDGEMENTS
This work is partly done as part of the Collaborative Project
FIGARO, which is supported by the European Commission
under the 7th Framework Program, Grant Agreement Number
258378.
R EFERENCES
[1] A. Reggani, F. Schneider, and R. Teixeira, “An End-Host View on Local
Traffic at Home and Work ,” in Proceedings of PAM’12, Vienna, Austria,
2012.
[2] “Ellacoya Networks News. Web Traffic Overtakes Peer-to-Peer (P2P).”
http://www.circleid.com/posts/web traffic overtakes p2p bandwidth.
[3] “Gomez White Paper: Why Web Performance Matters: Is Your Site
Driving Customers Away?” http://www.gomez.com/pdfs/wp why web
performance matters.pdf.
[4] R. Kohavi and R. Longbotham, “Online experiments: Lessons learned,”
IEEE Computer, vol. 40, no. 9, pp. 103–105, 2007.
[5] “Mozilla XPCOM API Reference,” https://developer.mozilla.org/en-US/
docs/XPCOM API Reference.
[6] S. Agarwal, N. Liogkas, P. Mohan, and V. Padmanabhan, “WebProfiler:
Cooperative Diagnosis of Web Failures,” in Proceedings of the 2nd
international conference on COMmunication systems and NETworks,
January 2010, pp. 288–298.
[7] C. Kreibich, N. Weaver, B. Nechaev, and V. Paxson, “Netalyzr: Illuminating The Edge Network,” in Proceedings of IMC ’10. New York,
NY, USA: ACM, 2010, pp. 246–259.
[8] “Internet End-to-end Performance Monitoring,” http://www-wanmon.
slac.stanford.edu/cgi-wrap/pingtable.pl.
[9] M. Butkiewicz, H. V. Madhyastha, and V. Sekar, “Understanding
Website Complexity: Measurements, Metrics, and Implications.” in
Proceedings of IMC’11, Berlin, Germany, November 2011.
[10] “Firebug,” http://getfirebug.com/.
[11] M. Dhawan, J. Samuel, R. Teixeira, C. Kreibich, M. Allman, N. Weaver,
and V. Paxson, “Fathom: A Browser-based Network Measurement
Platform,” in Proceedings of IMC’12, Boston, MA, USA, November
2012.
[12] M. Siekkinen, G. Urvoy-Keller, E. W. Biersack, and D. Collange, “A
Root Cause Analysis Toolkit for TCP,” Computer Networks, vol. 52,
no. 9, pp. 1846–1858, 2008.
[13] S. Ihm and V. S. Pai, “Towards Understanding Modern Web Traffic.” in
Proceedings of IMC’11, Berlin, Germany, November 2011.
[14] F. Nah, “A Study on Tolerable Waiting Time: How Long Are Web Users
Willing to Wait?” in Proceedings of AMCIS, 2003.
[15] H. Cui and E. Biersack, “On the Relationship Between QoS and
QoE for Web Sessions,” EURECOM, Sophia Antipolis, France,
Tech. Rep. RR-12-263, January 2012. [Online]. Available: http:
//www.eurecom.fr/∼cui/techrep/TechRep12263.pdf