1
1
Overview
This is the documentation for the IBM High Performance Computing Toolkit
MPI Profiling/Tracing library. This library collects profiling and tracing data
for MPI programs.
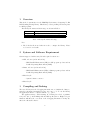
The library file names and their usage are shown in Table 1.
Name
libmpitrace.a
mpt.h
Usage
library file for both C and Fortran application
C header file
Table 1: Library file names and usage
Note:
1. The C header file is used when it needs to configure the library. Please
see Section 6 for details.
2
System and Software Requirement
Current supported architecture/OS and required software are:
• AIX on Power (32 bit and 64 bit)
– IBM Parallel Environment (PE) for AIX program product and its
Parallel Operating Environment (POE).
• Linux on Power (32 bit and 64 bit)
– IBM Parallel Environment (PE) for Linux program product and its
Parallel Operating Environment (POE).
• Blue Gene/L
– System Software version 3.
• Blue Gene/P
3
Compiling and Linking
The trace library uses the debugging information stored within the binary to
map the performance information back to the source code. To use the library,
the application must be compiled with the ”-g” option.
The application may consider turning off or having lower level of optimization (-O2, -O1,...) when linking with the MPI profiler/tracer. High level optimization will affect the correctness of the debugging information. It may also
affect the call stack behavior.
2