1
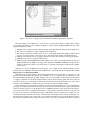
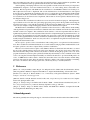
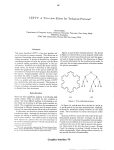
Figure 1: Two views of a graph created in an annotated minimum spanning tree algorithm
The main design goal for Swan was to create an easy-to-use annotation library combined with a simple,
yet powerful, user interface for the resulting visualization. Several features distinguish Swan from most other
program visualization systems:
1. Swan provides a compact annotation interface library. Fewer than 20 library functions are frequently used.
2. The viewer’s user interface is simple, straightforward and uniform.
3. The annotator decides the semantics of the views, i.e., with which variables the graphical elements in the
views are associated, and also controls the progress of the annotated program in a straightforward way.
4. Swan provides automatic layout of a graph so the annotator need only concentrate on its logical structure.
5. Swan allows the viewer to modify the data structure.
6. Swan was built on the GeoSim Interface Library [Hines, et al. 1994], a user interface library developed at
Virginia Tech that allows Swan to be easily ported to X Windows, MS-DOS and Macintosh computers. It is
crucial for educational software to run on the variety of operating systems that are widely used in computer
science classes.
Currently, two versions of Swan have been developed: one for UNIX systems with the X Window system
installed and one for MS-DOS. Information about Swan can be obtained through the World Wide Web at URL
http://geosim.cs.vt.edu/Swan/Swan.html.
Visualization can be applied either to the physical implementation for data structures in a program or to the
abstraction represented by the data structure. For example, two views of a graph can be provided as part of an
annotated minimum spanning tree algorithm. In Figure 1, the view on the right is an adjacency list representation
of a graph, a visualization of the physical implementation used by the annotated program. The view on the left
shows the logical topology of the graph, an abstraction represented by the adjacency list. These two views of data
structures coexist in Swan in a consistent form, since both are represented by Swan as graphs.
In the standard model for program visualization systems, program visualization is a one-way information
passing process: The programmer first writes a program, the annotator then annotates the program, and finally the
viewer can run the program to see the graphical views. In Swan, information can be passed from the annotator
to the viewer in the form of a graphical representation for data structures. Information can also be passed from
the viewer to the annotator via modification requests. Although this cannot be regarded as a complete two-way
communication between the annotator and the viewer because of the unequal status of the two participants (i.e.,
the annotator has complete control of the views to be constructed while the viewer can only modify the program’s
data structures under the restrictions imposed by the annotator), it provides a powerful mechanism to encourage