1
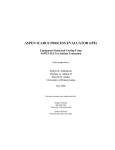
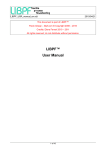
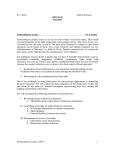
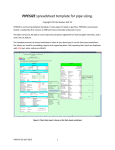
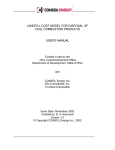
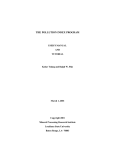
Reactor Analysis
User Manual
And
Tutorial
Jamal M. Saleh, Jack R. Hopper, and Carl L. Yaws
Lamar University
March 1,2001
Copyright 2001
Mineral Processing Research Institute
Louisiana State University
Baton Rouge, LA-70803
DISCLAIMER
Mineral Processing Research Institute (MPRI) makes no warranties,
express or implied, including without limitation the implied warranties of
merchantability and fitness for particular purpose, regarding the MPRI software.
MPRI does not warrant, guarantee or make any representation regarding the use
or the results of the use of the MPRI software in terms of its correctness,
accuracy, reliability, currentness or otherwise. The entire risk as to the results
and performance of the MPRI software is assumed by you.
In no event will MPRI, its director, officers, employees or agents be liable
to you for any consequential, incidental or indirect damages (including damage
for loss of business profits, business interruption, loss of business information,
and the like) arising out of the use or inability to use the MPRI software even if
MPRI has been advised of the possibility of such damages.
Operation Manual
Once ReaCat has been installed in your system open any of the case studies
from the examples folder.
Example for Gas liquid CSTR
Given below is the data input/output procedure for gas liquid reactors
using the captured images of different screens. Example used for demonstration
purpose is liquid phase oxidation of o-Xylene in an agitated gas liquid reactor
(example GasliqCSTR.rec in Examples folder .
The introductory screen of the program is shown in Figure D.1.
Figure D.1
ReaCat Startup Screen
The “File” menu has standard file handling options such as opening a file,
saving, printing etc. The “Reaction” menu is used to indicate the reaction phase.
“Reaction” Menu items are shown in Figure D.2.
Figure D.2
“Reaction Menu”
For the current case, the reaction phase is gas-liquid. This is selected by
clicking on it once. A check mark will appear next to the choice indicating that the
reaction phase has been chosen.
The next menu is “Reactor Type”. This is used to select appropriate
reactor. The items of this menu depend upon the choice of reaction phase. For
example, if user chooses homogeneous gas phase, then the “Reactor Type”
menu items will be PFR, CSTR and Batch reactor. Following is a list of reactors
available in ReaCat.
i-
Homogeneous Reactors ( Reaction: Homogenous Gas/ Liquid)
(Plug Flow, CSTR, Batch)
ii-
Heterogeneous Reactors
Two-phase Catalytic Reactors (Reaction: Catalytic Gas/ Liquid)
I-
Fixed-Bed
II-
Sulfuric Acid Production
III-
Fluidized-Bed
Gas- Liquid Noncatalytic Reactors (Reaction Phase: Gas-Liquid)
I.
Continuous Stirred Tank
II.
Packed Column
Three Phase Reactors (Reaction Phase: Gas-Liquid-Solid)
I-
Three-phase Trickle-bed
II-
Three-phase Bubble Fixed-Bed
III-
Three-phase Catalytic Gas-Liquid Slurry Stirred Tank
IV-
Three-phase Catalytic Gas-Liquid Slurry Bubble-Bed
V-
Three-phase Catalytic Gas-Liquid Fluidized-Bed
For the current example, reaction phase chosen is “gas-liquid”. For
this phase, “Reactor Type” menu is shown in Figure D.3.
Figure D.3
“Reactor Type” Menu for Gas Liquid Reactions
After choosing reaction phase and reactor type, next step is to input the
data required to run the simulation. Clicking on any of the icon in the toolbar
brings up an input screen. Brief Definition of each icon can be seen by resting the
mouse pointer over it. Data has to be entered in the same order in which the
buttons are placed. Following is a brief description of each icon and the
corresponding input screen.
Global options
The reactor program global option include (Figure B-4):
-
Number of reactions and number of species.
-
Number of calculation increments
-
Inlet temperature and pressure.
-
Energy model (isothermal, non-isothermal, or adiabatic)
-
Flow model (Plug Flow, Dispersion)
-
Data Type( Concentration, Partial Pressure)
Figure D.4
Global Options Input Screen
Physical properties
The species name, molecular weight, heat capacity and molecular
diffusivity are entered in the property screen. Also mixture properties such as
density (for liquid phase reactions only), viscosity are also entered here. See
Figure D.5. To display the physical property screen, click on the physical property
icon on the toolbar.
Figure D.5
Physical Properties Input Screen
Kinetic data
The user must also supply the reaction kinetic data such as: reaction
stoichiometry
, reaction rate orders, reaction constant expression
reaction rate and equilibrium constants
,
. The order in which this data
entered is important. The data must be supplied in the following order :
1- From the Global option screen
, number of reactions and the total
number of species including any inerts must be set.
2- Click at the stoichiometry
to enter the Kinetic Data. The first
screen displayed will allow the user to input the reaction stoichiometry
coefficients. Figure D.6 displays the Stoichiometry screen. A negative
stoichiometry coefficient indicates that this component is acting as a reactant
species for current reaction, while a positive coefficient indicates a reaction
product. Figure D.6 displays the input data for the following set of reactions:
1.5A + 1B ---> 1C + 1D
Where A represents Oxygen, B represents o-xylene and C represents omethylbenzoic acid.
Note: To check the data input click at the Display button to display the reactions
as above. For reaction number larger than 10 or for reactants more than 12, use
the campus like button to scroll up, down, left and right.
Figure D.6
Stoichiometry Input Screen
3- Click at the Reaction Rate icon
to enter the order of each reaction
with respect to each component that contribute in that reaction. Forward and
reverse reaction orders are entered in the Reaction Rate Screen, See Figure D.7
for illustration on how to enter following reaction rate expression:
(-r1A ) = k1 CA
(1)
where,
(-r1A )
- Rate of reaction 1 expressed in terms of disappearance of
component A
k1
- Rate constant for reaction Number 1.
CA
- Concentrations for components A
Figure D.7
Reaction Rate Order Screen
Note: If reaction order is zero with respect to one component, enter 0.0 in the
data entry above the component symbol. Use the spin button to scroll for reaction
numbers higher than 10.
4-Click at the Reaction Rate options button to enter the basis component
and the enhancement factor for each reaction. Each reaction rate should be
expressed based on a formation or depletion of a component that appears in the
stoichiometry of the reaction as a reactant or as a product. In case the user does
not enter a value of the enhancement factor it is calculated as discussed in
Chapter Three. For example, the reaction rate for reaction 1 is expressed in
terms of the depletion of Component A. So the basis for reaction 1 is -A (See
Figure D.8)
Figure D.8
Reaction Rate Options Screen
For non-isothermal systems; a second entry column for the heat of
reaction will be displayed. Heat of reaction for each reaction is also expressed
per unit mole of the basis component of the reaction.
Note: For exothermic reactions use a negative value for the heat of reaction,
while a positive value should be used for endothermic reactions.
5- Click at the Reaction Constant icon
to display the Reaction Rate
Constant input screen (Figure D.9). The forward reaction constant, k, and the
equilibrium constant, Ke for each reaction may be entered here according to an
Arrhenius-type equation:
k = A exp(-E/RT)
Ke = Ae exp( -Ee/RT)
Figure D.9
Reaction Rate Constants Screen
When E = 0, this indicate that the reaction rate constant is not a function of
temperature. The same applies to the equilibrium constants as well. Units for the
reaction constant are in Min, lbmol and ft3 . While T stands for temperature in oR,
E in BTU/lbmol, R is 1.987 Btu/lbmol/o R.
Reactor Specifications:
Each one of the reactor types has a unique data input screen. The user
may specify the reactor dimensions such as the length, diameter or volume. The
input volumetric flow rate is also set in this screen. To display the reactor data
input screen, click on the reactor specification icon. Data Input Screen for an
agitated gas liquid reactor is shown in Figure D.10.
Figure D.10
Reactor Specifications Screen
Feed Compositions
By clicking on the “FEED” in the reactor specification screen (Fig.D.10),
user can enter the inlet or initial feed composition; the following figure displays
the FEED screen for the case under consideration.
Figure D.11
Feed Composition Screen
Mass transfer Data
This input varies depending on the choice of reactor. For agitated
reactors, certain reactor configuration and operating parameters like stirrer
diameter, speed and height from base and liquid height from base are required.
In case of packed bed reactors reactor configuration and properties like specific
surface area of packing, void fraction, critical surface tension of liquid and gas
viscosity are required. Clicking the MSDATA button on the reactor specification
screen brings up the input screen where mass transfer data can be provided.
Figure D.12a and D.12b shows the input screen for an agitated gas liquid reactor
and packed bed reactor respectively.
Figure D.12a
MSDATA Input Screen for agitated gas liquid Reactor
Figure D.12b
MSDATA Input Screen for Packed Bed Reactor
Note: In case the value of mass transfer coefficient, kl (ft/hr), is entered in the
Physical properties screen, then the user would have to provide the value of the
interfacial area also. Clicking the MSDATA button on the reactor specification
screen brings up the input screen for interfacial area.
Heat Transfer Data
Whenever the energy model is other than isothermal (See Global Options
Screen Figure D.4), The reactor specification screen will have an active “Heat
Trans” button. This is used to input the reactor heat transfer specifications.
Data required include surrounding temperature, Overall heat transfer coefficient
based on unit area or length of reactor and area available for heat transfer. (See
Figure D.13)
Figure D.13
Heat Transfer Data Input Screen
Note: For the present case, “Heat Trans.” Button will be disabled, as the energy
model is isothermal.
Running the Simulation
As the data input procedure is complete, it is recommended that user
saves the work by using “Save/ Save as” from the file menu. The case can be
executed by clicking the “Run” key. The total reactor length will be divided by the
number of increments (Specified in the Global Option screen), and the
calculations will be performed for each increment. The results will be displayed
graphically as shown in Figure D.14. The user can display the data in a tabular
form by clicking on the Data option. The tabular display is shown in Figure D.15.
Graphical and tabular display have several options to display the different output
data such as concentration, conversion, temperature and pressure as a function
of the reactor volume. Display options may be selected from Figure D.14 or D.15.
Figure D.14
Graphical Output Display
Figure D.15
Tabular Output Display