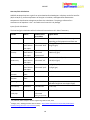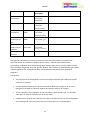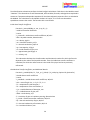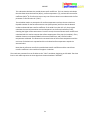
1
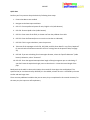
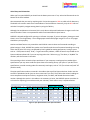
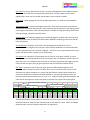
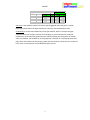
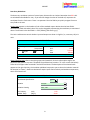
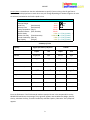
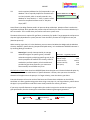
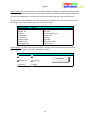
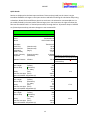
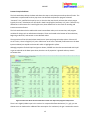
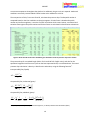
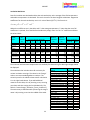
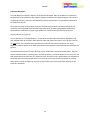
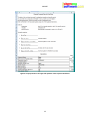
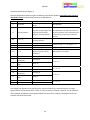
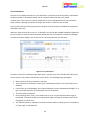
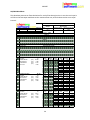
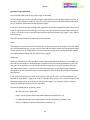
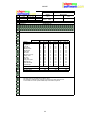
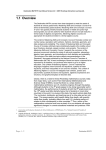
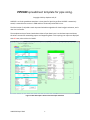
PIPESIZE spreadsheet template for pipe sizing. Copyright 2013 by Stephen Hall, PE PIPESIZE is an Excel spreadsheet template. It sizes pipes for liquid or gas flow. PIPESIZE is extensively tested; I created the first version in 1989 and have continually enhanced it since. The 2013 version (3.10) adds a much improved calculation algorithm for heat loss/gain estimates, and a new Line List feature. The template consists of several worksheets. Most of your data input is on the Data Input worksheet; the others are used for assembling reports and supporting data. Cells requiring User Input are displayed with RED text; other cells are in BLACK. Figure 1: Most data input is done on the Data Input worksheet UINS‐PS‐02 April 2013 1 PIPESIZE Table of Contents Quick Start ..................................................................................................................................................... 3 System Requirements ................................................................................................................................... 4 Initial Setup and Orientation......................................................................................................................... 5 Data Entry Worksheet ................................................................................................................................... 8 Quick Results ............................................................................................................................................... 12 Datasheet .................................................................................................................................................... 13 Errors and Warnings ................................................................................................................................... 14 Pressure Drop Calculations ......................................................................................................................... 15 Heat Loss/Gain Calculations ....................................................................................................................... 18 Insulation Worksheet .................................................................................................................................. 23 Properties Worksheet ................................................................................................................................. 24 Line List Worksheet ..................................................................................................................................... 29 LIQFLOW Worksheet ................................................................................................................................... 30 OPTLIQ Worksheet ...................................................................................................................................... 31 Equivalent Length Worksheet ..................................................................................................................... 32 Velocities Worksheet .................................................................................................................................. 34 2 PIPESIZE Quick Start Perform your first pressure drop calculation by following these steps: 1. Ensure that Macros are enabled 2. Navigate to the Data Input worksheet 3. Cell C17: Choose preferred system of units, English or SI (radio buttons) 4. Cell G32: Choose Liquid or Gas (radio buttons) 5. Cell F31: Enter name of the fluid, or choose one from the pulldown list at H31 6. Cell F33: Enter the flowrate (be sure to use the units that are indicated) 7. Cell F36: If this is a gas calculation, enter the pressure 8. Take note of the messages at Cells E32, G37, G38, and G39. Enter data if it says “Entry Required” (it means that the fluid name entered in Cell 31 is missing from the Properties Table, see page 24) 9. Cell D43: If you are calculating for a known pipe diameter, select the “Specific Diameter” (radio button). Otherwise, select “Economic” 10. Cell G47: Enter the approximate equivalent length of the pipe segment you are calculating. If you don’t know the equivalent length, enter a value that is 1.4 times the actual length of the pipe. Read results in the table in columns K:N. Notice that results for three pipe sizes are displayed. The specified size (or size determined by PIPESIZE) is in the middle, at Rows 35 to 41. It is flanked by the next smaller and next larger sizes. There are many additional variables that you can enter; they are explained in this manual. However, for the most part, the inputs are self‐explanatory. 3 PIPESIZE System Requirements •
Personal computer running Microsoft Excel with Visual Basic for Applications (VBA). This requirement means that Open Office and other programs capable of opening and editing basic Excel worksheets will not work – VBA is required. Excel 97 on the Mac lacks VBA and is therefore incompatible, however Office 2010 on the Mac is compatible •
Excel must be configured to allow macros to run. This can be done through Security settings, or by enabling macros each time PIPESIZE is opened 4 PIPESIZE Initial Setup and Orientation When you first open PIPESIZE you should see the Data Input screen. If not, select the leftmost tab at the bottom of the Excel window. We recommend that you start by exploring a bit. Entries that appear in RED are valid cells for data entry. The BLACK cells contain results from intermediate or final calculations. Generally, only the RED cells are unlocked. You quickly navigate among them by using the TAB key. Although the worksheets are Protected, this is only done to help avoid inadvertent changes to cells that contain formulas. There are no passwords and the entire workbook is Open Source. PIPESIZE is shipped configured for printing on US letter size paper. If you use A4 paper, please go to each sheet in turn. Go to Page Setup... Then change paper to A4 and left/right margins to 1.5 cm. The pages should then print properly. Number and date formats vary around the world. While numeric values are formatted according to global settings in Excel, PIPESIZE also makes use of text formulas that are formatted according to a string within the formula. This string is unaffected by Excel’s global formatting preferences, having a syntax such as: =TEXT(numeric value, “0.00”). To get around this problem, a table of formats is provided on the Pipes worksheet at Row 166. If you use anything other than “dd‐mmm‐yyyy” for dates, or “#,##0.0” for numbers, edit the formats in the table. The next thing to do is review the Pipes worksheet. If your company or workgroup has standard pipe specifications you may want to edit the Pipes sheet to accurately portray your specs. If you don't have specifications, consider creating codes for commonly used types, such as "CS" (for carbon steel) and "SS" (stainless steel). The pipe specification codes are entered in the table at the top of the Pipes worksheet. Codes must be entered in alphabetical order (you can insert new rows if you like). Then, follow the column headings to enter temperature and pressure limits, roughness value, cost data, and related dimensional table number. Although the entries in this table are in customary US units, the PIPESIZE reports use either US or SI units for reporting (in accordance with your selection). Each column entry is explained below. Cost Factors
Min Temp Max Temp Max Press Roughness Purchase
Ratio
Exponent
deg F
deg F
psig
ft
$/ft (1 inch) Fittings
150 lb Carbon Steel
-10
450
150
0.00015
$1.75
5
1.3
125 lb Carbon Steel
-10
450
125
0.00015
$1.75
5
1.3
300 lb Carbon Steel
-20
750
300
0.00015
$1.75
5
1.3
316L SS Pipe
-100
500
145
0.0001
$4.50
8
0.89
Copper Pipe
-100
250
110
0.000005
$4.50
8
0.89
316L SS Sanitary Tubin
-100
450
150
0.000001
$4.50
8
0.89
316L SS Zephyrweld Tu
-100
450
150
0.000005
$4.50
8
0.89
Teflon-Lined Pipe
-20
500
170
0.000005
$4.50
8
0.89
Spec CodeDescription
A
A3
B
C
CU
D1
D2
F1
Figure 2: Pipe Specifications on the Pipes worksheet 5 Size
Table
2
2
2
8
6
15
14
9
Emissivity Conductivity
W/m-K
0.79
45
0.79
54
0.79
54
0.85
16.2
0.78
401
0.1
16.2
0.1
16.2
0.79
0.3 PIPESIZE Spec Code may be any alphanumeric string. It is usually a designation used on P&IDs and other documents that references a complete pipe specification. The Spec Codes must be sorted alphabetically. Rows may be inserted into the table if more codes are needed. Description is plain language to describe the pipe specification. It is used on the printed data sheet. Temperature limits are entered in degrees Fahrenheit. These are the minimum and maximum temperatures allowed for the pipe class, often determined by components in your piping system such as gaskets and valves. If the fluid temperature is outside the range defined by these limits a warning message is printed on the data sheet. Pressure limit is the maximum gage pressure permitted (psig) for the pipe code. The only thing that temperature and pressure limits affects within PIPESIZE is a Warning in the event that the limits are violated. Pipe Roughness is entered in units of feet. See the Roughness worksheet for a list of recommendations. Roughness for new pipe is often listed in handbooks, but consider whether it's more appropriate to use a value for used pipe ‐‐ one that is more representative of how your system will operate after a couple of years of operation. Cost Factors are entered for a) initial capital cost of 1 foot of 1 inch pipe, installed, b) a ratio relating the cost of fittings and valves to the cost of pipe, and c) an exponent used to convert to other sizes. This is in accordance with the Peters and Timmerhaus method. We suggest you use values like the ones given until you gain experience with the OPTSIZE worksheet results. Size Table is a pointer to one of the many pipe dimension tables appearing below. Each dimension table contains five columns of data, which in turn can be formulas to look up wall thicknesses for a given schedule, etc. Use the Pipe Specification Lookup Tables at Row 44 to control the minimum and maximum allowed diameters in your pipe specifications. Also use them to eliminate unwanted sizes such as 1‐1/4" or 5". Study the tables given with PIPESIZE, and either edit an existing one or create new tables in columns to the right of the existing ones. Size Table
8
Size
0.125
0.25
0.375
0.50
0.75
Black values are formulas or constants
Column name is user-defined
Red values are variables
Stainless Steel Pipe
Schedule
O.D.
Thickness
40S
0.405
0.0680
40S
0.540
0.0880
40S
0.675
0.0910
40S
0.840
0.1090
40S
1.050
0.1130
I.D.
0.269
0.364
0.493
0.622
0.824
9
Size
0.50
0.75
1.00
1.50
2.00
Teflon-Lined Steel
Schedule
O.D.
Thickness
40
0.840
0.1630
40
1.050
0.1750
40
1.315
0.2630
40
1.900
0.2950
40
2.375
0.3140
I.D.
0.514
0.700
0.789
1.310
1.747
10
Stainless Steel Tubing (
Size
Gauge
O.D.
0.75
16
0.750
1.00
16
1.000
1.50
16
1.500
2.00
16
2.000
2.50
16
2.500
The Pipe Specification Lookup Tables can reference any of the several dimension tables found in the PIPES worksheet. Study the Pipe Table formulas to see how this is done. Here's an example dimension table, used to lookup the dimensions of copper pipe: 6 PIPESIZE Pipe Size Lookup Table
Copper and Red Brass Pipe
Nominal Size
0.125
0.25
0.375
0.50
0.75
OD
0.405
0.540
0.675
0.840
1.050
Wall Thickness
Std
XS
0.062
0.100
0.082
0.123
0.090
0.127
0.107
0.149
0.114
0.157 Emissivity is the radiation constant for a bare pipe. Suggested values are given in a table beginning at Row 138 on the Pipes worksheet; emissivity must be between 0 and 1. Conductivity is the thermal conductivity of the pipe material, W/m‐K. The heat loss/gain calculation does not include a provision for lined pipe, so use an estimate for combined conductivity, which should be greater than the material (usually the lining) with the smaller value. For example, the conductivity of polypropylene is 0.2 W/m‐K. For polypropylene‐lined pipe, where the thickness of the lining is greater than the thickness of the steel, use a value of 0.3 or 0.4 as an estimate for the combined lined pipe system. 7 PIPESIZE Data Entry Worksheet The data entry worksheet consists of several parts, discussed in turn below. Remember that RED cells are unlocked and available for entry. If you need to change the value of a locked cell, unprotect the worksheet from the Tools menu. There is no password. Use the TAB key to quickly navigate from one entry field to the next. Project Data appears on the headers of each of the standard reports. Notice that the Date field is automatically filled with today's date. This can be changed by unprotecting the worksheet, as mentioned above. The formula in the date field is: =TEXT(TODAY(),"dd‐mmm‐yyyy") The Units radio buttons control whether input and output are shown in English (i.e., customary US) or SI units. DATA INPUT
Project Data
S. Hall
Client
02-Apr-2013
W.O.
Unit
SI
Area
Line ID
Prepared by
Date
English
Sample
10314
Process
Utilities
Line Number:
HTF-151-0136 General Pipeline Data refers to the piping system and materials. Service is a descriptive tag for the purpose of the pipeline. Any text is accepted. The pulldown box (contains "A" in the screen shot below) shows all of the pipe codes contained in the PIPES worksheet. The description of the selected code appears to the right. Similarly, the Insulation pulldown box permits you to select the insulation material for the pipe (or "None"). Heat loss calculations require input of wind velocity and ambient temperature, which are entered next. Service:
Pipe Material Specification:
General Pipeline Data
Combustible Oil
<< 150 lb Carbon Steel
A
Insulation
Fiberglass
Insulation Covering
Plastic, white
Wind Velocity
Ambient Temp
(m/s)
(deg C)
5.00
30.00
8 PIPESIZE Process Data is entered next. Use the radio buttons to specify if you are sizing a line for gas flow or liquid. The units displayed next to each other entry will change depending on whether English or SI units are selected, and whether the fluid is Liquid or Gas. Fluid Name
Molecular Weight
Actual Flow
Maximum Flow
Flowing Temperature
Upstream Pressure
Specific Gravity
Absolute Viscosity
Thermal Conductivity
Heat Capacity
Process Data
Therminol XP
18.016
(liters/second)
20.00
(liters/second)
50.00
(deg C)
270.00
(kPa, absolute)
700.00
0.544
(Pascal-seconds)
0.000144
(W/m-K)
0.089
(kJ/kg-K)
3.875
Liquid
Gas
(<<<
(<<<
(<<<
(<<<
Entry
Entry
Entry
Entry
Ignored)
Ignored)
Ignored)
Ignored)
Summary of Units Property English (Customary US) Units SI Units Liquid Gas Liquid Gas US gal/min lb/h liters/s kg/h Deg F Deg F Deg C Deg C psia psia kPa kPa cP cP Pascal‐sec Pascal‐sec Density lb/ft3 lb/ft3 kg/m3 kg/m3 Length feet feet meters meters inches inches DN DN ft water ft water meters water meters water ft/s ft/s m/s m/s Flowrate Temperature Pressure Absolute Viscosity Diameter Head Velocity Enter the fluid name. If the fluid entered matches exactly with one in the compounds list on the PROPERTIES worksheet, the message "Entry Ignored" appears next to Molecular Weight, Specific Gravity, Absolute Viscosity, Thermal Conductivity and Heat Capacity. Otherwise "Entry Required" appears. 9 PIPESIZE TIP: Use the optional pulldown list of all compounds in your database. This is especially helpful for chemicals such as n‐butyl alcohol, which is actually entered in the database as "butyl alcohol, n‐". Also, it's easier to find entries for compound mixtures such as "Ethylene Glycol, 40%". Optional Pulldow n List of Fluids
Therminol XP
Actual Flow is the design flowrate used in all pressure drop calculations. Maximum flow is used on the worksheet LIQFLOW, which provides the pressure drop and velocity for flows from zero to Maximum, in 10% increments. This is useful when you need to construct a system curve. The Nominal Pressure is required for gas flows, unnecessary for liquids. The gas properties and pressure drop are highly dependent on system pressure. Enter the INLET pressure here. English units are psia (absolute pressure). When entering a gas that isn't in the database, you must enter the Molecular Weight and the Absolute Viscosity. However, Specific Gravity (compared to liquid water), isn't used because PIPESIZE estimates it by assuming ideal gas conditions. TIP: Natural gas is usually characterized by its average molecular weight or its specific gravity. Calculate molecular weight by multiplying specific gravity by 29. Use the properties of methane for viscosity, thermal conductivity and heat capacity. A little worksheet is provided to give these properties; you must enter them manually into the data entry area. Natural Gas -- suggested properties
Specific gravity
0.75
Molecular w eight:
21.75
Absolute viscosity
0.000011
Thermal conductivity
0.036
Heat capacity
2.220
Size Selection Criteria determines how PIPESIZE determines the pipe sizes. Choose the desired option by selecting one of the three radio buttons. If Specific Diameter is chosen, then you enter the nominal diameter of the pipe next to the prompt. For Target Velocity, enter the velocity you desire. Economic diameter will use the results of the Peters and Timmerhaus calculation on the OPTLIQ worksheet. It's often a good starting point when sizing a new pipe. Or, use Target Velocity, which selects the pipe in your specification code which most closely matches the velocity you enter. If you enter a specific diameter or target velocity that results in a pipe size outside the range of your pipe specification, then the closest pipe is selected and a Warning message is generated. Size Selection Criteria
Economic
Specific Diameter
Diameter:
Target Velocity
100 DN
10 PIPESIZE Physical Layout is an optional section. If you know the length of the pipeline, and count of fittings, enter the data here. Another way to enter this information is to input the total equivalent length you want to use, with zero fitting count. If this section is left blank, 100 equivalent feet (meters) are assumed. For gas pressure drop calculations, the total length of pipe is important. The calculation iterates on the total length, and is more accurate when you do enter the length. Physical Layout
Length of pipeline
90 deg Ell
Long Rad. Ell
45 deg Ell
180 deg Bend
TEE-Line Flow
TEE-Branch Flow
Bell Mouth Inlet
Square Mouth Inlet
(meters)
0
0
0
0
0
0
0
0
Globe Valve
Gate Valve
Ball Valve (reduced por
Butterfly Valve
Plug Valve
Angle Valve
Swing Check Valve
Re-Entrant Pipe
250
0
0
0
0
0
0
0
0 Report Selection controls which of the worksheets is printed. Use the checkboxes to indicate those reports you want. Then, click on the "Print Reports" button. Report Selection
Results Summary
LIQFLOW
Datasheet Style
EquivLength
Instructions
OPTLIQ
Print Reports
11 PIPESIZE Quick Results Results are displayed on the Data Input worksheet. These can be printed, but the intent is to give immediate feedback so changes to the inputs can be made before finalizing the calculation and printing a datasheet. Results for three different pipes sizes are shown: the selected or recommended size is in the middle, flanked by the next smaller and next larger sizes. Use the area on the right to find out the flow rate that would result in a “desired pressure drop” through the line. All pressure drops in PIPESIZE are frictional pressure drop; elevation changes are not accounted for. RESULTS
Line
Service
Material
HTF-151-0136
Combustible Oil
150 lb Carbon Steel
Fluid Name
Actual Flow
Maximum Flow
Temperature
Specific Gravity
Dynamic Viscosity
Roughness
(Pascal-seconds)
(millimeters)
Upstream Pressure
kPa abs
(liters/second)
(liters/second)
(deg C)
Therminol XP
20.00
50.00
270.00
0.711
0.000459
0.04572 Calculate flow rate based on pressure
drop, pipe diameter, and equivalent length
700.00 Desired
Pressure Drop
80.00
250
366.7
37.5
4.2
2996.7
251.6
100.00
250
91.2
9.3
2.4
3566.3
248.0
150.00
250
11.5
1.2
1.1
4624.6
241.5
Next Smaller Size
Equiv. Length
Pressure Drop
(DN)
(meters)
(kPa/250 m)
(m. water)
Velocity
(m/s)
Heat loss, bare pipe (W/m)
Approx downstream temperature (C)
Selected Size
(DN)
Equiv. Length
(meters)
Pressure Drop
(kPa/250 m)
(m. water)
Velocity
(m/s)
Heat loss, bare pipe (W/m)
Approx downstream temperature (C)
Next Larger Size
(DN)
Equiv. Length
(meters)
Pressure Drop
(kPa/250 m)
(m. water)
Velocity
(m/s)
Heat loss, bare pipe (W/m)
Approx downstream temperature (C)
12 69 kPa
9 l/s
17 l/s
49 l/s
PIPESIZE Datasheet The datasheet organizes your pipe information on a form that has the same look as datasheets used throughout the chemengsoftware family. PIPELINE SIZING CALCULATION
REV PREPARED BY
S. Hall
0
1
2
1
2
3
4
5
6
7
8
9
10
11
12
13
14
15
16
17
18
19
20
21
22
23
24
25
26
27
28
29
30
31
32
33
34
35
36
37
38
39
40
41
42
43
44
45
46
47
48
49
50
51
52
DATE
03-Apr-2013
Fluid Service
Pipe Specification
Surface Roughness
Insulation
Ambient Temperature
Fluid Pumped
Design Flow Rate
Maximum Flow Rate
Flow ing Temperature
Nominal Pressure
Specific Gravity
Viscosity
APPROVAL
CLIENT
Sam ple
W.O.
10314
UNIT
AREA
Process Utilities
LINE NO.
HTF-151-0136
REQUISITION NO. SPECIFICATION NO.
18103
PROCURED BY
INSTALLED BY
General
Combustible Oil
A: 150 lb Carbon Steel
0.04572
Fiberglass
30
(millimeters)
(deg C)
(liters/second)
(liters/second)
(deg C)
(kPa, absolute)
(Pascal-seconds)
Process Data
Therminol XP (liquid)
20
50
270
700
0.71107
0.00046
Basis for Sizing: Specified Diam eter @ 100 DN
Nom.
Size
80
===> 100
150
O.D.
Wall
Sched (mm) (mm)
40
88.900 5.486
40
114.30 6.020
40
168.27 7.112
I.D.
Reynolds
(mm) Number
77.92 5.06E+05
102.2 3.86E+05
154.0 2.56E+05
Friction
Factor
0.0183
0.0177
0.0173
Physical Layout
90 deg Ell
- TEE-Line Flow
- Globe Valve
Long Rad. Ell
- TEE-Brnch Flow
- Gate Valve
45 deg Ell
- Bell Mouth Inlet
- Ball Valve (red. port)
180 deg Bend
- Sq. Mouth Inlet
- Butterfly Valve
Straight Feet of Pipe (measured through centerline of fittings):
Pressure Drop/100 equiv m
(kPa)
(m w ater) (m. liq.)
146.69
14.98
21.07
5.24
36.50
3.73
4.60
0.47
0.66
Velocity
(m/sec)
4.19
2.44
1.07
Plug Valve
Angle Valve
Sw ing Check Valve
Re-Entrant Pipe
meters
-
250
Heat Loss
Fiberglass Insulation Thickness
Nom.
Bare
Size
units
13 mm
25 mm
38 mm
51 mm
148
110
90
80
Watts/m 2,997
181
133
108
Watts/m 3,566
===> 100
251
181
145
150
Watts/m 4,625
262
42
38
36
Approximate surface temperature C
Sum m ary of Results
Heat Loss (Gain), Watts
Nom. Eq Lgth
Pressure Drop
Bare
13 mm
25 mm
38 mm
51 mm
Size
(m)
(kPa) m w ater (m. liq.)
52.7
749,172
n/a
37,046
27,521
22,546
80
250 366.72 37.46
91.25 9.32
13.1
891,586
n/a
45,371
33,265
26,964
250
===> 100
11.50 1.17
1.7 1,156,152
n/a
62,856
45,294
36,180
150
250
76 mm
69
82
107
34
76 mm
17,353
20,423
26,771
13 PIPESIZE Errors and Warnings If you see #VALUE everywhere it means that Macros are not enabled. The procedure for enabling macros depends on your version of Excel and your security settings. If you are solving for gaseous flow and the results indicate “critical” it means that the flow rate and conditions result in a flow that exceeds critical velocity. Increase the pipe size, decrease the flow rate or decrease the gas density (increase pressure, decrease temperature). Additional warnings are printed at the bottom of the Datasheet. The possible messages are: **Warning**: Specified Size is non‐standard; <SIZE> is used **Warning**: Fluid Temperature exceeds maximum permitted by pipe specification **Warning**: Fluid Temperature is colder than minimum permitted by pipe specification **Warning**: <FLUID> not in databank; check physical properties entry **Warning**: Temperature exceeds insulation maximum recommendation **Warning**: Temperature lower than insulation minimum recommendation **Warning**: <CODE> is not a defined pipe specification; standard IPS pipe sizes are assumed **Error**: Pressure drop exceeds nominal pressure **Warning**: Viscosity for gas expected to be less than 0.1 cP 14 PIPESIZE Pressure Drop Calculations The Calcs worksheet collects the data and shows the steps to calculate pressure drop due to friction. The calculations are performed for three pipe sizes: the selected size (based on program‐selected “economic” size, specified size input by user, or the size that most closely achieves the velocity target input by the user). Calculations are also done in both SI and English (customary U.S.) units. There are tiny differences in the answers for SI and English units; these differences are the result of rounding and inexact conversion factors. The Calcs worksheet also has tables with some intermediate values, units conversions, and program variables for things such as radio button selections. These are located at the bottom of the worksheet, beginning at Row 107, and contain no user‐defined values. The top portion of the Calcs worksheet contains user inputs and program lookup values. Columns D:F are in SI units, I:K are in English (U.S.) units. Whichever set of units is selected (radio buttons on the Data Input worksheet) are copied to columns N:P which is highlighted in yellow. Although properties for both liquid and gas are shown, PIPESIZE uses the data set associated with liquid or gas as selected on the Data Input sheet; the other set of properties is ignored and may contain erroneous data. Figure 3: Rows 14 to 48 on the Calcs worksheet contain user inputs and program lookup values There is one slightly hidden input in this section. For compressible flow calculations (i.e., gas), you can choose to use an isothermal or adiabatic flow assumption. For isothermal, the gas is assumed to remain 15 PIPESIZE at constant temperature throughout the pipeline. For adiabatic, the gas cools as it expands. Isothermal conditions are usually recommended. Choose isothermal or adiabatic at cell C24. The next portion of Calcs, from rows 59 to 85, calculates the pressure drop. The Reynolds number is computed based on the inlet conditions to the pipe segment. Friction factor is based on Reynolds number and surface roughness; it uses the Churchill correlation which covers laminar, transitional and turbulent flow regimes. Reynolds number and friction factor are calculated in VBA function subroutines. Figure 4: Rows 59 to 85 on the Calcs worksheet give calculation results for pressure drop due to friction The pressure drop for a standard length (100 m for SI and 100 ft for English units), and also for the equivalent length derived from user inputs on the Data Input worksheet, are calculated next. The actual pressure drop calculation is done by a VBA function subroutine, using the following formulas1: Incompressible flow (liquids) f LU 2 ρ
ΔP =
2 gc D
Compressible flow, isothermal (gases) ΔP =
⎛P
RT Z G2 ⎡ f L
+ ln⎜⎜ 1
⎢
P M gc ⎣ 2 D
⎝ P2
⎞⎤
⎟⎟⎥ ⎠⎦
Compressible flow, adiabatic (gases) 2
⎞⎞
f L 1 ⎛⎜ 1
(
1
γ + 1) ⎛ N Ma
2 X1 ⎟
⎜
ln
=
−
−
2
2
⎜ N 2 X ⎟⎟ ⎟ D
2
γ ⎜⎝ N Ma
N Ma
1
2
⎝ Ma1 2 ⎠ ⎠
1
Hall, Stephen, Rules of Thumb for Chemical Engineers, 5th Edition, Butterworth‐Heinemann (2012). 16 PIPESIZE The variable definitions are: D = pipe diameter, m or ft f = Darcy friction factor, dimensionless G = mass flux, kg/s‐m2 or lb/s‐ft2 = W
3600 A
g c = conversion factor, 1 m/s2 or 32.17 ft/s2 L = pipe equivalent length, m or ft M = molecular weight N Ma = Mach number, dimensionless P = absolute pressure, Pa or psia R = gas constant, 8314.5 m3‐Pa/kgmol‐K or 10.73 ft3‐psi/lbmol‐R T = absolute temperature, °K or °R G
U = average fluid velocity at local conditions, m/s or ft/s = ρ
2 ⎡ (γ − 1) ⎤
X = 1 + N Ma
⎢⎣ 2 ⎥⎦ Z = compressibility factor =1 for a perfect gas γ = ratio of specific heats, Cp/Cv μ = fluid dynamic viscosity, kg/m‐s or lb/ft‐h ρ = density of gas at local conditions, kg/m3 or lb/ft3 = 17 PM
RT
PIPESIZE Heat Loss/Gain Calculations PIPESIZE calculates heat loss or gain from uninsulated and insulated pipes. It displays results for heat flux (W/m or Btu/h‐ft), surface temperature of the pipe or insulation, and approximate downstream temperature. VBA function subroutines performs the calculations. The primary reference for a consistent set of equations is Cao2. An excellent on‐line article is by Haslego3. Inputs for the Calculations The heat loss/gain calculations utilize SI values with conversion to U.S. Units if necessary. Variable Source Reynolds number Calculated Fluid Density Pipe Inside Diameter Pipe Outside Diameter Pipe Length Properties Data Table or User Input Properties Data Table or User Input Properties Data Table or User Input Properties Data Table or User Input Pipes Data Table Pipes Data Table Calculated Fluid Velocity Calculated Temperature inside pipe User Input Dynamic Viscosity Thermal Conductivity Heat Capacity Location in the Spreadsheet Calcs:Row 59 Typical Values Calcs:D90 Cell named “DynamicVisc” Calcs:D91 Cell named “kSI” 0.001 Pa‐s (liquids) 0.0002 m2/s (gas) Laminar, Transitional, or Turbulent region depending on fluid properties and flow rate Calcs:D89 1000 kg/m3 (liquids) Cell named “RoSI” 10 kg/m3 (gas) 0.06 to 0.6 W/m‐K (liquids) 0.03 W/m‐K (gas) Calcs:D92 4 kJ/kg‐K (liquids) Cell named “CpSI” 1 kJ/kg‐K (gas) Calcs:D18:F18 5 to 760 mm Calcs:D16:F16 5 to 760 mm Calcs:D47:F47 Any length, m (conservative assumption, uses equivalent length not actual pipe length) 0.5 to 5 m/s Calcs:D61:F61 Calcs:D88 Cell named ‐15°C to 500°C “flowing_temperatureSI” 2
Cao, Eduardo, Heat Transfer in Process Engineering, McGraw‐Hill, 2010 3
Haslego, Chris, “Making Decisions with Insulation,” http://www.cheresources.com/content/articles/heat‐
transfer/making‐decisions‐with‐insulation (2010). 18 PIPESIZE Variable Source Pipes Data Table Location in the Spreadsheet Calcs:J132 Cell named “ambientSI” Calcs:D96 Cell named “Wind_Velocity” Calcs:D98 Cell named “Emissivity_Bare” Calcs:D99 Cell named “_kp” Temperature environment User Input Wind Velocity User Input Insulation Data Table Calcs:D95 Cell named Emissivity of Pipe Pipes Data or Insulation Table Thermal Conductivity of Pipe Thermal Conductivity of Insulation Insulation Thickness Typical Values ‐15°C to 40°C 0 to 5 m/s 0.05 to 0.9 0.1 to 400 W/m‐K 0.02 to 0.06 W/m‐K “insulation_conductivity”
User Input Calcs:N101:S101 0 to 4 in Heat gain/loss calculations are inexact for several reasons: the film coefficient correlations are empirically based, air movement around the pipe is uneven, radiation losses depend on the surroundings, conductive heat transfer through pipe supports and structure are not included, and the effect of fittings, flanges and valves are ignored. However, the calculation in PIPESIZE does a good job of estimating the heat flux, surface temperature, and downstream fluid temperature given ideal conditions. Assumptions: •
The properties of the flowing fluid are constant through the pipeline (the inside heat transfer coefficient is constant) •
Constant ambient temperature and environmental conditions (the program has no way to distinguish if the pipeline is partially outdoors and partially indoors, for example) •
The environment is dry atmospheric air (no provisions for pipes buried in soil, run through a water bath, or weather conditions such as rain or snow) •
Radiation losses based on the emittance of the pipe or insulation jacket, but if the temperature of the flowing fluid is less than that of the environment there are no radiation gains 19 PIPESIZE Two VBA function subroutines perform the heat loss/gain calculations. Find them in the Module named “HeatLoss.” The subroutines are self‐documented, with variables, formulas, and algorithms explained in comments. Temperature‐dependent equations for the thermodynamic properties of air are included in the Module. The calculations in this Module are done in SI units; if U.S. units are selected the spreadsheet converts the results. The function calls are as follows: Inside Heat Transfer Coefficient Function h_internalSI(NRe, ro, mu, k, cp, di, L, v) ' Inside heat transfer coefficient ' SI units ' h_internalSI = inside heat transfer coefficient, W/m2‐C ' NRe = Reynolds number, dimensionless ' ro = density, kg/m3 ' mu = kinematic viscosity, m2/s ' k = thermal conductivity, W/m‐K ' cp = heat capacity, kJ/kg‐C ' di = inside diameter of pipe, mm ' L = approximate pipe length, m ' v = velocity, m/s This subroutine calculates the Prandl number and the Nusselt number for which the formula depends on the value of the Reynolds number. Then the inside heat transfer coefficient is calculated, for which the reference area is the inside of the pipe. See Cao as previously referenced. Outside Heat Transfer Coefficient, and Additional Results Function h_outsideSI(Calc, T1, T4, d_o, d_i, Wind, E, h_inside, kp, Optional ki, Optional kt) ' Outside heat transfer coefficient ' SI units ' h_outsideSI = outside heat transfer coefficient, W/m2‐C ' Calc = return flag 0 = ho, 1 = Q, 2 = T3, 3 = U ‘ T1 = temperature inside the pipe, C ‘ T4 = temperature of the environment, C ‘ d_o = outside diameter of bare pipe, mm ‘ d_i = inside diameter of pipe, mm ‘ Wind = wind velocity, m/s ‘ E = emissivity of pipe or insulation covering, dimensionless ‘ h_inside = inside heat transfer coefficient, W/m2‐C ‘ kp = thermal conductivity of pipe, W/m‐K ‘ ki = thermal conductivity of insulation, W/m‐K ‘ kt = insulation thickness, mm 20 PIPESIZE This subroutine calculates the outside heat transfer coefficient. This is an iterative calculation that also determines the heat flux (W/m2), surface temperature (°C), and overall heat transfer coefficient (W/m2‐K). The function returns any one of those values in accordance with the first parameter in the Function call (“Calc”). The calculation makes an assumption for surface temperature and uses that to calculate a Reynolds number for the forced convection case (wind present) and from that the Nusselt number and outside heat transfer coefficient. If the wind is less than 0.5 m/s, the program calculates the no‐wind convection case and compares it to the forced convection result, choosing the higher of the two answers. From this result, the overall heat transfer coefficient is calculated which is used to compute the surface temperature of the pipe (or insulation). Then, radiation losses are calculated, added to the overall coefficient, and a revised surface temperature calculated. This becomes the assumed value of the surface temperature and the entire set of calculations is repeated until the calculated surface temperature equals the assumed value. Note that the reference area for the outside heat transfer coefficient and the overall heat transfer coefficient is the outside of the pipe or insulation. The results are presented in a set of tables on the “Calcs” worksheet, beginning at Cell N100. The three lines in each table represent the three pipe sizes shown elsewhere in PIPESIZE . 21 PIPESIZE Heat Loss - W/m
Inside Coef
Insulation Thickness (in.):
hi
0
1
1.5
2
3
2,637
2,997
0.5
148
110
90
69
1,617
3,566
181
133
108
82
773
4,625
251
181
145
107
25
38
51
76
0
13
Insulation Thickness (m m ):
Surface Tem perature, C
0
0.5
1
1.5
2
3
264
41
37
35
33
262
42
38
36
34
256
43
39
36
34
Approxim ate Dow nstream Tem perature, C
R
1
1.5
2
3
251.6
0.5
269.1
269.3
269.4
269.6
248.0
268.9
269.2
269.3
269.5
241.5
268.5
268.9
269.1
269.3
Outside Heat Transfer Coefficient, W/m 2-C (includes radiation)
0
1
1.5
2
3
46
0.5
30
29
29
28
43
30
29
28
27
28
28
27
26
39
Overall Heat Transfer Coefficient, W/m 2-C (includes radiation)
Note: corrected to the outside surface area
0
1
1.5
2
3
12.5
0.5
1.4
0.9
0.6
0.4
14.9
1.5
0.93
0.66
0.41
19.3
1.5
1.0
0.7
0.4
Figure 5: Heat Loss/Gain Results (Therminol XP at 350°C, 50 DN pipe, 10°C environment, no wind) 22 PIPESIZE Insulation Worksheet Data for insulation are tabulated and the thermal conductivity at the average of the fluid temperature and ambient temperature is calculated. This result is used in the heat loss/gain calculations. Regression coefficients for thermal conductivity are in U.S. units of Btu‐in/(h‐ft2‐F). The formula is: k = m + pT + sT 2 + t T 3 + uT 4 Where the coefficients are in the table, and T is the average temperature, °F. Note that the use of all coefficients is optional; for a fixed thermal conductivity simply enter it in the “m” coefficient and leave the others blank. Insulation
Material
Min.
Thickness
Thermal Conductivity Coefficients
Maximum
Temperature
Minimum
Temperature
(ºF)
(ºF)
Thermal Conductivity, K
[Btu*in/
W/m-K
(h*ft2*ºF)]
250
0.384
0.055
-450
0.332
0.048
1
1
m
p
s
t
u
0.369 1.58E-04 3.92E-07 9.40E-11 0.00E+00
0.289 5.14E-04 4.36E-07 2.27E-10 2.76E-13
0.5
1
1
0.195 4.25E-04 0.00E+00 0.00E+00 0.00E+00
0.228 3.72E-04 6.00E-07 0.00E+00 0.00E+00
200
850
1200
-40
42
42
0.290
0.228
0.261
0.042
0.033
0.038
Perlite, expanded
Phenolic foam
1
0.388 4.73E-04 3.06E-07 -8.00E-11 0.00E+00
1 0.116667 6.67E-04
1000
300
250
75
0.427
0.169
0.062
0.024
Polystyrene foam
1
165
-65
0.230
0.033
Polyurethane/
Polyisocyanurate
foams
1
250
-200
0.164
0.024
(in)
Calcium Silicate
Cellular glass
Elastometric
foam
Fiberglass
Mineral Wool
0.174 -1.55E-04 -3.39E-07 8.38E-09 1.82E-11
1000
900
The minimum and maximum temperatures are used only for determining if a Warning message should be displayed. The worksheet also includes values for emissivity for various insulation coverings. The values in the “Range” column are recommended guidance numbers. The emissivity used in the radiative heat transfer calculation is in the right‐hand column. If you add additional materials to this table, do it by inserting a row, entering your data, and then sorting the list alphabetically. The table is a named range (“Insulation_Cover_Emittance”). The easiest way to add data while preserving the range’s name is by inserting a row into the middle of the table. 23 Value for
Calc
Material
Range
Aluminum jacketing, gray-dull .10 to .40
0.2
Aluminum jacketing, oxidized .10 to .60
0.4
Aluminum jacketing, polished .03 to .10
0.1
Aluminum paint, new
.20 to .30
0.25
Aluminum paint, weathered
.40 to .70
0.5
Asbestos fabric, white
0.78
Asphalt mastic
.90 to .95
0.95
Galvanized steel jacketing, dull .20 to .60
0.5
Galvanized steel jacketing, new .06 to .10
0.1
Paint, black
.90 to .95
0.95
Paint, gray
.80 to .90
0.85
Paint, green
.65 to .80
0.75
Paint, white
.55 to .70
0.6
Plastic, black
0.95
Plastic, white
0.84
PVA mastic, black
.85 to .95
0.9
PVA mastic, gray
.85 to .90
0.9
PVA mastic, green
.70 to .80
0.75
PVA mastic, white
.60 to .79
0.75
0.4
Stainless steel jacket, mill finish.35 to .40
Stainless steel jacket, oxidized .80 to .85
0.85
Stainless steel jacket, polished .22 to .26
0.25
Styrofoam
0.6
PIPESIZE Properties Worksheet Find and add physical property data on the Properties worksheet. Most of the data are correlated to temperature, so the properties table contains equation coefficients for liquids and gases. You can new compounds to the list, and if you have properties at three temperatures, the spreadsheet determines the coefficients for you. The Properties sheet has three parts. 1) Upper left quadrant gives brief instructions and shows the results for the current fluid (from the Data Input worksheet); 2) Lower right quadrant tabulates the fluids and their coefficients; 3) Upper right quadrant is used for entering new fluids into the list. Property Results (see Figure 6) The current fluid, or “Compound Name,” as entered on the Data Input worksheet is displayed in Cell C29. PIPESIZE looks up the fluid in the Properties Table and reports the result in Cell C30. If the there is an exact match, the properties from the table are used in the calculations. Otherwise, the “Entry Required” prompts appear on the Data Input sheet and the properties returned from this worksheet are ignored. The values listed in Column D, Rows 28 to 38, are the coefficients pulled from the data table. They are used to calculate viscosity, specific gravity, thermal conductivity, and heat capacity in C33, C34, C37, and C38. Notice that these values are all in American units; conversion to SI is performed on the Calculations worksheet. Also notice that temperature is in Celsius for each of the correlations except for viscosity where Kelvin is used. Apologies for the mixed units of measure, but be careful when working on the Properties worksheet. 24 PIPESIZE Figure 6: Property Results in the upper left quadrant of the Properties worksheet
25 PIPESIZE Properties Data Table (see Figure 7) Data are tabulated for liquids and gases as defined in the column headers. Compounds must remain in alphabetical order. The data fields (columns) are defined here. Column F G Name Compound Viscosity Equation H:K b, m, c, d L M N Liquid Sp. Gr. Sp Gr slope Mol. Wt. O:Q R S T U V W X Y Z b, c, d Cp/Cv Liquid Thermal Conductivity Thermal Conductivity Slope Liquid Heat Capacity Heat Capacity Slope Gaseous Thermal Conductivity Thermal Conductivity Slope Gaseous Heat Capacity Heat Capacity Slope Content
Fluid name, in alphabetical order Number corresponding to the equation used for liquid viscosity. See Cells A15:A25 Coefficients for the liquid viscosity equation Intercept, b
Slope, m
Molecular weight
Coefficients for the gas viscosity equation, always Equation 5 Ratio of specific heats
Equation
Not applicable See equations in Cells B15:B25. Viscosity data published in the literature will fit one of these equations. New compounds are fit to Equation 4 (see discussion in the next section). Specific Gravity = m t + b, where t = °C Required for gases See Equation 5 in Cell B23 Required for gases Intercept, b k = m t + b Slope, m Intercept, b
Slope, m
Cp = m t + b Intercept, b k = m t + b Slope, m Intercept, b
Slope, m
Cp = m t + b The straight line regressions for specific gravity, thermal conductivity, and heat capacity are rough approximations for the actual values. There are more accurate correlations. However, for the purposes of the PIPESIZE spreadsheet, these approximations are better than needed to obtain good results for pressure drop and heat transfer. 26 PIPESIZE Figure 7: Physical Properties Data Table in the lower right quadrant of the Properties worksheet 27 PIPESIZE Entering New Fluids into the Properties Table (see Figure 8) This is a handy tool for determining the regression coefficients for each of the temperature‐dependant physical properties. The input section, within the black boxes, has three parts: units of measure, liquid properties, and gaseous properties. After entering data, the program converts it to the US Units used in the Physical Properties Data Table and fits the data to straight lines or, in the case of viscosity, to Equation 4 or Equation 5. The viscosity equations are not, technically “fit” since there are three coefficients and three data points. However, as long as your initial viscosity data is good, the resulting equations will do an excellent job interpolating to other values. When done, click on the “Add compound or update data” button. If your fluid is not already in the Properties Table, the macro inserts a new row and copies the values into the table. However, if your fluid is already in the table, the macro gives you a choice of overwriting existing data, or just adding any new data that you may have entered. For instance, there is no data for gaseous acetone in the table. If you enter values for gaseous acetone then click the button, you could add that data to the table without affecting the existing values for liquid acetone. Alternatively, you can Unprotect the worksheet (there is no password) and enter or edit the data in the Properties Table directly. To use a single constant value for any property, just enter it (in the proper units) under the “b” column. For example, the value for specific gravity of acetaldehyde is a constant 0.778 in the distribution version of PIPESIZE (see Cell L41). To delete a fluid from the Properties table, first Unprotect the worksheet (there is no password), highlight the row you want to delete, and use the Excel menu selection Delete… Delete Sheet Rows. Figure 8: Enter New Fluids or Data in the upper right quadrant of the Properties worksheet 28 PIPESIZE Line List Worksheet The Line List is a flexible repository for your calculations. Each column that corresponds to a workbook variable is named. In the example below, Cell C9 is selected. Notice that the cell is named “LineList_Spec”. Each column is similarly named; this is how the VBA Macro finds its way around the sheet. You may rearrange the columns as long as the column’s named cells are retained. You may also insert blank rows (to group lines into plant areas for example, and add other explanatory information and notes. When the “Save Current Calc to Line List” is selected, a new line of data is added immediately below the last line. If there are notes or other information below your line list, the Macro is somewhat intelligent: it finds the last piece of data in the “Pressure Out” column and puts the new line there. Figure 9: Line List worksheet To restore a line to the calculation page (“Data Input”), you select any cell in the Row with the line you want to restore. Click “Restore Selected Line to Calc Sheet.” The following things will happen: •
•
•
•
•
•
Macro checks to be sure a valid row is selected The Fluid name is transferred to “Data Input” and the Macro checks to see if the Fluid is in the database. If the Fluid is not in the database, the viscosity and density values, and Molecular Weight if it’s a gas, are transferred to the “Entry Required” cells on “Data Input” The other data is transferred Since the fitting count, if any, is not saved to the Line List, only the total equivalent length is transferred. To ensure that the correct equivalent length is utilized, the number of each of the fitting types is reset to zero. The “Specific Diameter” calculation method is selected, and the nominal pipe size is transferred to “Data Input” as that diameter 29 PIPESIZE LIQFLOW Worksheet This datasheet presents ten flow calculations for each of the three pipe sizes. It uses the user input in cell F34 on the Data Input worksheet as the maximum flow rate, and calculates results at ten equal intervals. EFFECT OF FLOW VARIATION
REV
0
1
2
1
2
3
4
5
6
7
8
9
10
11
12
13
14
15
16
17
18
19
20
21
22
23
24
25
26
27
28
29
30
31
32
33
34
35
36
37
38
39
40
41
42
43
44
45
46
47
48
49
50
51
52
PREPARED BY
S. Hall
DATE
02-Apr-2013
Fluid Service
Pipe Specification
Surface Roughness
Insulation
Ambient Temperature
Fluid Pumped
Design Flow Rate
Maximum Flow Rate
Flow ing Temperature
Nominal Pressure
Specific Gravity
Viscosity
APPROVAL
(millimeters)
(deg C)
(liters/second)
(liters/second)
(deg C)
(kPa, absolute)
(m-Pascal-seconds)
(mm)
(mm)
(mm)
(m2)
80 DN
40
88.900
5.486
77.927
0.005
(mm)
(mm)
(mm)
(m2)
100 DN
40
114.30
6.020
102.26
0.008
Next Larger Pipe Size
Schedule
Outside Diameter
(mm)
Wall Thickness
(mm)
Inside Diameter
(mm)
(m2)
Flow Area
150 DN
40
168.27
7.112
154.05
0.019
Sm aller Pipe Size
Schedule
Outside Diameter
Wall Thickness
Inside Diameter
Flow Area
Selected Pipe Size
Schedule
Outside Diameter
Wall Thickness
Inside Diameter
Flow Area
CLIENT
Sam ple
W.O.
10314
UNIT
AREA
Process Utilities
LINE NO.
HTF-151-0136
REQUISITION NO. SPECIFICATION NO.
18103
PROCURED BY
INSTALLED BY
General
Combustible Oil
A: 150 lb Carbon Steel
0.04572
Fiberglass
30
Process Data
Therminol XP (liquid)
20
50
270
700
0.71107
0.45929
Flow
(kg/h)
Friction
DeltaP/100 equiv m Velocity
Factor
(kPa)
(m w ater)
(m/s)
12,799
126,478
1.04
0.0202
10.1
1.05
25,598
252,956
3.90
0.0190
38.2
2.10
38,398
379,434
8.54
0.0185
83.7
3.15
51,197
505,911
14.98
0.0183
146.7
4.19
63,996
632,389
23.19
0.0181
227.1
5.24
76,795
758,867
33.17
0.0180
324.9
6.29
89,594
885,345
44.94
0.0179
440.2
7.34
102,394
1,011,823
58.48
0.0178
572.8
8.39
115,193
1,138,301
73.79
0.0178
722.8
9.44
90.88
127,992
1,264,779
0.0178
890.2
10.48
Flow
Reynolds Friction
DeltaP/100 equiv m Velocity
(kg/h)
Number
Factor
(kPa)
(m w ater)
(m/s)
12,799
96,382
0.27
0.0203
2.6
0.61
25,598
192,764
0.98
0.0187
9.6
1.22
38,398
289,146
2.14
0.0181
21.0
1.83
51,197
385,529
3.73
0.0177
36.5
2.44
63,996
481,911
5.75
0.0175
56.3
3.04
76,795
578,293
8.19
0.0173
80.3
3.65
89,594
674,675
11.07
0.0172
108.5
4.26
102,394
771,057
14.39
0.0171
140.9
4.87
115,193
867,439
18.13
0.0170
177.5
5.48
22.29
127,992
963,822
0.0169
218.4
6.09
Flow
Reynolds Friction
DeltaP/100 equiv m Velocity
(kg/h)
Number
Factor
(kPa)
(m w ater)
(m/s)
12,799
63,979
0.3
0.04
0.0210
0.27
25,598
127,959
1.2
0.13
0.0188
0.54
38,398
191,938
2.7
0.27
0.0179
0.80
51,197
255,918
4.6
0.47
0.0173
1.07
63,996
319,897
7.0
0.72
0.0169
1.34
76,795
383,877
10.0
1.02
0.0167
1.61
89,594
447,856
13.4
1.37
0.0165
1.88
102,394
511,836
17.3
1.77
0.0163
2.15
115,193
575,815
21.8
2.22
0.0162
2.41
127,992
639,795
0.0161
26.7
2.73
2.68 30 Reynolds
Number
PIPESIZE OPTLIQ Worksheet When the “Economic” pipe sizing criteria is selected on the Data Input worksheet, the result is calculated on this OPTLIQ sheet. SELECTED PIPE DIAMETER
REV PREPARED BY
S. Hall
0
1
2
1
2
3
4
5
6
7
8
9
10
11
12
13
14
15
16
17
18
19
20
21
22
23
24
25
26
27
28
29
30
31
32
33
34
35
36
37
38
39
40
41
42
43
44
45
47
48
49
50
51
52
53
DATE
02-Apr-2013
Fluid Service
Pipe Specification
Surface Roughness
Insulation
Ambient Temperature
Fluid Pumped
Design Flow Rate
Maximum Flow Rate
Flow ing Temperature
Nominal Pressure
Specific Gravity
Viscosity
APPROVAL
(millimeters)
(deg C)
(liters/second)
(liters/second)
(deg C)
(kPa, absolute)
(Pascal-seconds)
CLIENT
Sam ple
W.O.
10314
UNIT
AREA
Process Utilities
LINE NO.
HTF-151-0136
REQUISITION NO. SPECIFICATION NO.
18103
PROCURED BY
INSTALLED BY
General
Combustible Oil
A: 150 lb Carbon Steel
0.04572
Fiberglass
30
Process Data
Therminol XP (liquid)
20
50
270
700
0.71107
0.00046
Econom ic Data
Purchase cost of new pipe, 1 inch diameter, $/ft
Ratio of costs for fittings & installation to purch. cost of pipe
Factor relating pipe cost to diameter (exponential)
Frictional loss due to fittings and bends, % of straight pipe
Operation, hours/yr
Cost of electricity, $/kw hr
Efficiency of motor and pump, %
Annual fixed charges for maintenance, % of pipe cost
$1.75
5
1.30
35%
8,000
$0.15
60%
20%
Basis for Sizing: Specified Diam eter @ 100 DN
Optimum diameter calculated using Peters & Timmerhaus formula
Closest pipe size from specified material class
Smaller
Size
Actual Size
Velocity
Reynolds No.
Friction Factor
Pressure Drop
inch nominal size
inch actual inside diame
feet/second
psi/100 equiv ft
3
3.068
13.74
505,076
0.0183
6.466
Selected
Size
4
4.026
7.98
384,892
0.0177
1.609
4.21
4
Next Larger
Size
6
6.065
3.52
255,495
0.0173
0.203
Calculated Costs, $ per year per foot of installed piping:
Pumping Cost
Initial Piping
Annual Piping
Total
Reference:
(pow er)
(capital expenditure)
(maintenance)
3
$25.83
$43.80
$8.76
$34.59
4
$6.93
$63.66
$12.73
$19.66
6
$0.95
$107.84
$21.57
$22.52
Peters & Timmerhaus
Plant Design and Economics for Chemical Engineers
31 PIPESIZE Equivalent Length Worksheet This worksheet shows how the equivalent length is calculated. For most fittings and sizes, the equivalent length is obtained from a table of values (using U.S. units), at Cell Q91 in the worksheet. To edit the values first Unprotect the sheet. If the table lacks the value then the “K” method is used to estimate the equivalent length. If you don’t know the number of fittings, then a good rule of thumb is to add 35% to 40% to the physical length of pipe to account for the fittings. In this case, first estimate the total length of pipe. Multiply by 1.35 or 1.4. Enter the value on the Data Input worksheet (Cell G47 named “Pipe_Length”). Put a value of 0 for all fittings. The results are tabulated in the data sheet on this worksheet. Valves The worksheet has instructions and an example for calculating the equivalent length of a valve for which only the flow coefficient (Cv) is known. You can either edit the table of values with the equivalent length of your specific valve, or simply add the calculated equivalent length to the overall pipe length entered on the Data Input worksheet (Cell G47 named “Pipe_Length”). Equipment Equipment manufacturers often provide a pressure drop at specified flow conditions. For example, the tube‐side pressure drop for a heat exchanger is reported on the heat exchanger datasheet, at the flow rate given on the datasheet. You can find the equivalent length by entering the flow data (fluid, flow rate, temperature, density, viscosity) on the Data Input worksheet, then change the pipe length (all fittings set to 0) until the calculated pressure drop equals the pressure drop reported by the equipment manufacturer. If your pressure drop data is for water at 60°F (which is the case for valves – the flow coefficient is the flow rate of water at 60°F, in gpm, that results in a pressure drop of 1 psi), then use the calculator on the Equivalent Length worksheet to determine the equivalent length. This calculator utilizes a Function subroutine called EqLUSa which has four arguments: Function EqLUSa(W, Pdrop, d, epsilon), where W = flow rate, lb/h (= gpm x 500) Pdrop = known pressure drop (reported by equipment manufacturer), psi d = inside pipe diameter of the pipe segment that the equipment is installed in, inch epsilon = roughness of pipe that equipment is installed in, ft 32 PIPESIZE EQUIVALENT LENGTH OF PIPE
REV
0
1
2
1
2
3
4
5
6
7
8
9
10
11
12
13
14
15
16
17
18
19
20
21
22
23
24
25
26
27
28
29
30
31
32
33
34
35
36
37
38
39
40
41
42
43
44
45
46
47
48
49
50
51
52
PREPARED BY
S. Hall
DATE
02-Apr-2013
APPROVAL
LINE NO.
HTF-151-0136
REQUISITION NO. SPECIFICATION NO.
18103
PROCURED BY
INSTALLED BY
General
Combustible Oil
A: 150 lb Carbon Steel
Fluid Service
Pipe Specification
Pipe Size
Fittings
90 deg Ell
Long Rad. Ell
45 deg Ell
TEE-Line Flow
TEE-Branch Flow
180 deg Bend
Globe Valve
Gate Valve
Ball Valve (red. port)
Butterfly Valve
Plug Valve
Angle Valve
Sw ing Check Valve
Bell Mouth Inlet
Square Mouth Inlet
Re-Entrant Pipe
CLIENT
Sam ple
W.O.
10314
UNIT
AREA
Process Utilities
80 DN
Qty
Equiv. M.
0
0.0
0
0.0
0
0.0
0
0.0
0
0.0
0
0.0
0
0.0
0
0.0
0
0.0
0
0.0
0
0.0
0
0.0
0
0.0
0
0.0
0
0.0
0
0.0
100 DN
Qty
Equiv. M.
0
0.0
0
0.0
0
0.0
0
0.0
0
0.0
0
0.0
0
0.0
0
0.0
0
0.0
0
0.0
0
0.0
0
0.0
0
0.0
0
0.0
0
0.0
0
0.0
150 DN
Qty
Equiv. M.
0
0.0
0
0.0
0
0.0
0
0.0
0
0.0
0
0.0
0
0.0
0
0.0
0
0.0
0
0.0
0
0.0
0
0.0
0
0.0
0
0.0
0
0.0
0
0.0
Straight Pipe
250
250
250
Total Equiv Meters
250
250
250
Equivalent lengths are calculated using a table of values.
If the fitting/size combination does not appear in the table, the "K Value" method is used.
"K Value" data are from the Hydraulic Institute, Pipe Friction Manual, regressed.
33 PIPESIZE Velocities Worksheet This worksheet tabulates recommended velocities for various services. The information contained on this sheet was compiled from several sources, and is intended to be a simple starting point, not a definitive declaration. *** END OF DOCUMENT *** 34