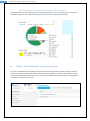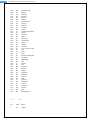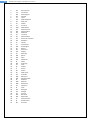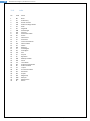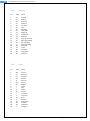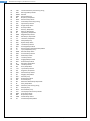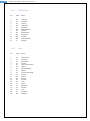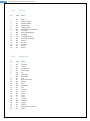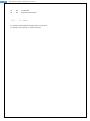
1
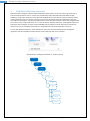
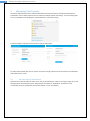
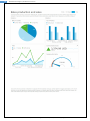
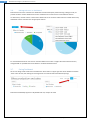
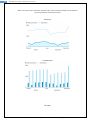
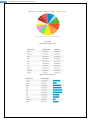
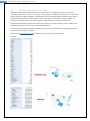
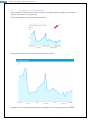
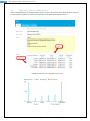
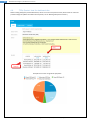
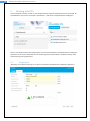
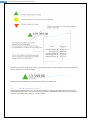
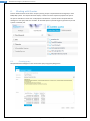
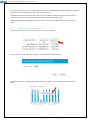
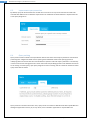
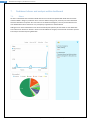
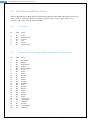
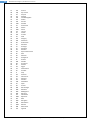
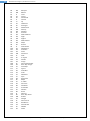
Dashboard features with Kyubit Business Intelligence www.kyubit.com Dashboards - User Manual Using dashboard features of Kyubit Business Intelligence © 2015, All rights reserved www.kyubit.com 2 Kyubit Business Intelligence, Dashboards user manual Contents 1. Dashboard features overview ........................................................................................................................ 4 2. Managing Data Sources .................................................................................................................................. 5 2.1. 3. Creating and designing dashboards ............................................................................................................... 6 3.1. Dashboard area, tiles and columns ....................................................................................................... 6 3.2. Working with Tiles ................................................................................................................................. 6 3.2.1. Add tile to dashboard ................................................................................................................... 7 3.2.2. Remove tile from dashboard ........................................................................................................ 7 3.2.3. Rearrange tiles on dashboard ....................................................................................................... 8 3.2.4. Configure tile to show visualization .............................................................................................. 9 3.3. Tile automatic data refresh ................................................................................................................. 13 3.4. Open custom link in a context of dashboard data............................................................................... 14 3.5. Dashboard title, header and footer ..................................................................................................... 15 3.6. 4. 5. 6. 7. 8. Set Data Source permissions ................................................................................................................. 5 Manage columns on dashboard ...................................................................................................... 17 3.7. Saving Dashboard ................................................................................................................................ 17 3.8. Enter and exit ‘Design’ view for dashboard......................................................................................... 18 Configuring dashboard tiles ......................................................................................................................... 19 4.1. Data usage within tiles (Categories and series) ................................................................................... 19 4.2. ‘Analysis’ data for dashboard tiles ....................................................................................................... 19 4.3. ‘Geo Maps’ configuration and usage ................................................................................................... 22 4.4. Enlarged view on dashboard tile ......................................................................................................... 23 4.5. ‘MDX query’ data for dashboard tiles ................................................................................................. 24 4.6. ‘TSQL Queries’ data for dashboard tiles .............................................................................................. 25 Working with KPIs ........................................................................................................................................ 26 5.1. Designing KPI ....................................................................................................................................... 26 5.2. Understanding data usage for KPI design ............................................................................................ 27 5.3. Setting permissions for KPI .................................................................................................................. 28 Working with Queries .................................................................................................................................. 29 6.1. Creating query ..................................................................................................................................... 29 6.2. Query values measure units ................................................................................................................ 30 6.3. Impersonate query execution ............................................................................................................. 31 6.4. Query caching ...................................................................................................................................... 31 6.5. Setting Query permissions ................................................................................................................... 32 Dashboard slicers and analysis within dashboard ........................................................................................ 33 7.1. Slicers ................................................................................................................................................... 33 7.2. Tiles drilldown, drill-through OLAP actions within dashboard ............................................................ 34 Folders and dashboards access permissions ................................................................................................ 34 Dashboards with Kyubit Business Intelligence User Manual, www.kyubit.com - [email protected] 3 Kyubit Business Intelligence, Dashboards user manual 8.1. 9. Setting object permissions .................................................................................................................. 35 Subscriptions ................................................................................................................................................ 37 9.1. My subscriptions.................................................................................................................................. 37 9.2. Subscriptions within dashboard .......................................................................................................... 37 9.3. Subscription details ............................................................................................................................. 38 9.4. Send subscriptions conditionally ......................................................................................................... 39 9.5. Impersonate subscriptions data usage ................................................................................................ 39 10. Integrate dashboards with other web applications and sites .................................................................. 41 11. Geo Maps available lists of keys .............................................................................................................. 43 11.1. Continents ........................................................................................................................................... 43 11.2. World, Africa, Asia, Europe, Oceania, South America, North America ................................................ 43 11.3. USA ...................................................................................................................................................... 46 11.4. India ..................................................................................................................................................... 48 11.5. Norway ................................................................................................................................................ 49 11.6. Spain .................................................................................................................................................... 49 11.7. Australia ............................................................................................................................................... 50 11.8. France .................................................................................................................................................. 51 11.9. Thailand ............................................................................................................................................... 51 11.10. Russia .............................................................................................................................................. 53 11.11. Netherlands ..................................................................................................................................... 55 11.12. Italy .................................................................................................................................................. 55 11.13. Germany .......................................................................................................................................... 56 11.14. Switzerland ...................................................................................................................................... 56 11.15. US – States....................................................................................................................................... 57 Dashboards with Kyubit Business Intelligence User Manual, www.kyubit.com - [email protected] 4 Kyubit Business Intelligence, Dashboards user manual 1. Dashboard features overview Kyubit Business Intelligence supports dashboard features starting from version 3.0, delivering monitoring of business essential data to users in various ways. Dashboard presents data from Microsoft OLAP and SQL databases, trying to give simple and comprehensive feedback about critical business values and trends. While creating dashboard, user has various visual options to present data most efficiently regarding the nature of data and user expectations. Easy drag-and-drop features makes dashboard creation simple and straightforward task, which is easy to adopt and fun to use. To retrieve data for dashboard elements, existing OLAP analyses on Kyubit Business Intelligence could be used or SQL/MDX queries could be created. Dashboards could be also delivered to users on scheduled subscriptions or integrated within third web applications and sites. To work with dashboard features, select ‘Dashboards’ tab on the top of the Kyubit Business Intelligence application and other dashboard related section will be shown left side of user interface. (Kyubit Business Intelligence Dashboards - Entities schema) AnalysisPortal Folders Dashboards Columns Tiles Chart KPI OLAP Analysis MDX Query TSQL Query Dashboards with Kyubit Business Intelligence User Manual, www.kyubit.com - [email protected] 5 Kyubit Business Intelligence, Dashboards user manual 2. Managing Data Sources All data for dashboard elements is retrieved from data sources that contains interesting business data for presentation. Once created, data sources are used from multiple queries and analysis. To see all existing data sources in Kyubit Business Intelligence, open Dashboards -> Data Source (tab). Create new OLAP or SQL data source for future queries and analysis. For both, OLAP and SQL data sources, custom connection strings could be set and connection could be tested before data source is save. 2.1. Set Data Source permissions If Data Source should be visible to other users, click on the ‘Permissions’ options in the upper-right corner and add appropriate Active Directory users and groups to have ‘Read’ or ‘Read/Write’ permissions or set unrestricted access to created Data Source. (See chapter 7.1. for more details) Dashboards with Kyubit Business Intelligence User Manual, www.kyubit.com - [email protected] 6 Kyubit Business Intelligence, Dashboards user manual 3. Creating and designing dashboards All users with access to Kyubit Business Intelligence application could create new dashboards. To start creation of new dashboard, click ‘Create New Dashboard’ button on the dashboards view. New Dashboard will be opened in design view, ready to be designed and configured. 3.1. Dashboard area, tiles and columns Dashboards consist of dashboard elements (tiles) that are arranged in dashboard columns. Dashboard columns can accept any number of tiles that will be displayed vertically. Each tile needs to be defined what kind of visualization and data it will display. By default, dashboard contains two columns and columns could be added and removed. 3.2. Working with Tiles On every dashboard user can add 6 different types of dashboard element (tiles) that present some kind of data visualization. On the toolbar on the right, tile types are presented with descriptive icons. Dashboards with Kyubit Business Intelligence User Manual, www.kyubit.com - [email protected] 7 Kyubit Business Intelligence, Dashboards user manual Line chart Column chart Pie chart KPI Gauge meter List Geo Map 3.2.1. Add tile to dashboard To add tile to dashboard, drag-and-drop preferred tile type (visualization) from toolbar on the left to one of the column on the right. 3.2.2. Remove tile from dashboard To remove tile (delete) from dashboard drag-and-drop tile from dashboard column to trash icon on the left, that is visible when drag-and-drop operation is started. Dashboards with Kyubit Business Intelligence User Manual, www.kyubit.com - [email protected] 8 Kyubit Business Intelligence, Dashboards user manual 3.2.3. Rearrange tiles on dashboard At any time in design view, tiles could be rearranged with same dashboard column or moved to any position on another dashboard column. Simply drag-and-drop tiles to preferred location on any of the columns. New location of drag-and-drop tile will be displayed in blue color. Dashboards with Kyubit Business Intelligence User Manual, www.kyubit.com - [email protected] 9 Kyubit Business Intelligence, Dashboards user manual 3.2.4. Configure tile to show visualization When moving mouse over tile (while dashboard is in design mode) ‘Pen’ icon is displayed, which allows user to click and open tile configuration form. Enter dashboard general information: like title, description and, if you like, set child dashboard that will be opened as more detailed view on the same data, enabling users to have ‘drill down’ experience while using dashboards. ‘Tile Details’ is second tab on the tile form, where data to visualize will be defined. Dashboards with Kyubit Business Intelligence User Manual, www.kyubit.com - [email protected] 10 Kyubit Business Intelligence, Dashboards user manual ‘Query/Analysis’ is input where user selects existing Analysis or Query (TSQL or MDX) to retrieve data to show in this tile visualization (‘Pie’ in this case). Existing ‘Analysis’ means that OLAP analysis is created in ‘Analysis’ part of Kyubit Business Intelligence application and current user has permissions to read at least. Existing Query (TSQL or MDX) means, that query is created in ‘Dashboards’ part of Kyubit Business Intelligence application and current user has permissions to read at least. If query user needs still does not exists, user could click on ‘New’ button and right away from tile form create new MDX or TSQL query. To select existing analysis or query, click on the ‘Select’ button and selection form of existing Analyses and Queries will be displayed. ANALYSIS SELECTION… … OR QUERY SELECTION … Dashboards with Kyubit Business Intelligence User Manual, www.kyubit.com - [email protected] 11 Kyubit Business Intelligence, Dashboards user manual All analysis created within Kyubit Business Intelligence for which current user has at least ‘Read’ permission are displayed in selection form. Displayed list could be filtered by ‘Data Source’ for environments with many analyses. Same principles works for Query selection. After Analysis/Query is selected, click on ‘Test’ button in tile form to test visualization with selected analysis/query data. In tile configuration form, user still can change tile (visualization) type, if concludes that given data is more appropriate to show with different chart type. Finally, click ‘OK’ in tile configuration form and tile will present data within dashboard area. Dashboards with Kyubit Business Intelligence User Manual, www.kyubit.com - [email protected] 12 Kyubit Business Intelligence, Dashboards user manual Using same principles configure other tiles to appropriate visualize other relevant business data on dashboard… Dashboards with Kyubit Business Intelligence User Manual, www.kyubit.com - [email protected] 13 Kyubit Business Intelligence, Dashboards user manual 3.3. Tile automatic data refresh Every dashboard tile could be configured to automatically refresh data in a defined period of time in minutes. Only tiles with defined ‘Tile Refresh’ attribute will be refreshed with new data. If option ‘Show last refresh time’ is checked, dashboard tile will display time passed since last data refresh in dashboard. Dashboards with Kyubit Business Intelligence User Manual, www.kyubit.com - [email protected] 14 Kyubit Business Intelligence, Dashboards user manual 3.4. Open custom link in a context of dashboard data To open custom link when user clicks on a dashboard tile element, set ‘Open custom URL’ attribute of tile. By clicking on a dashboard tile element, new browser tab will be opened with URL that is defined, but also with additional URL query string that is created within context of point/bar/wedge which is actually clicked/selected. For example: http://www.adventureworks.com?Details=1&pointName=United States&pointUnique=[Geography].[Geography Hierarchy].[Region Country Name].&[United States] If data source is based on SQL data, added query string will be based category id defined in query object. Dashboards with Kyubit Business Intelligence User Manual, www.kyubit.com - [email protected] 15 Kyubit Business Intelligence, Dashboards user manual 3.5. Dashboard title, header and footer While in dashboard ‘design view’ click on the ‘Details’ button to define dashboard ‘Title’, ‘Description’ on the ‘General’ tab. On the ‘Header/Footer’ tab set appropriately dashboard header and/or footer and its alignments text and alignments… Dashboards with Kyubit Business Intelligence User Manual, www.kyubit.com - [email protected] 16 Kyubit Business Intelligence, Dashboards user manual Dashboards with Kyubit Business Intelligence User Manual, www.kyubit.com - [email protected] 17 Kyubit Business Intelligence, Dashboards user manual 3.6. Manage columns on dashboard Dashboard columns are containers for dashboard visual elements (tiles). While working in design mode, it is possible to add or remove dashboard columns. Dashboard can contain from 1 to 5 dashboard columns. To add column, remove column or edit column width click on the ‘Column’ button which is located above every dashboard column and select one of appropriate actions. For each dashboard column new column could be added on the ‘Left’ or ‘Right’ side of the selected column, changed width to 4 predefined column widths or to delete selected column. 3.7. Saving Dashboard All work in design mode needs to be saved with the ‘Save’ button in upper-right area of the dashboard. Within ‘Save’ action all tiles, their settings and arrangements are saved for future dashboard openings. Dashboard immediately appears in ‘My Dashboards’ list, ready to be used. Dashboards with Kyubit Business Intelligence User Manual, www.kyubit.com - [email protected] 18 Kyubit Business Intelligence, Dashboards user manual 3.8. Enter and exit ‘Design’ view for dashboard After existing dashboard is opened, design options are disabled and only users with ‘Read/Write’ permissions on the dashboard could choose to continue design work on the dashboard. While user is not in ‘design’ view, dashboard data, tiles and all dashboard arrangements are not available to change. ‘Design’ mode is just slightly different than ‘Regular’ view, so at the end of design, user should ‘Exit design’ to see exactly how other users will see dashboard while consuming prepared dashboard details. Dashboards with Kyubit Business Intelligence User Manual, www.kyubit.com - [email protected] 19 Kyubit Business Intelligence, Dashboards user manual 4. Configuring dashboard tiles After adopting general dashboard design and construction details, this chapter describes how to create all visual details on the dashboard elements (tiles) to best reflect business data situations and give end-users clear and easy-to-understand status of business important values and indicators. Dashboard could display 2 group of visual elements, Chart and Key Performance Indicators (KPIs). Charts: Line Chart, most appropriate to show time related data. Column Chart, most appropriate to show multiple series data. Pie Chart, most appropriate to show single data with one-series data. List, most appropriate to show ordered list with names and numbers. Geo Map, most appropriate to show data related to geography ( world countries and regions ) KPIs: 4.1. Standard KPI, show KPI icon, KPI value, last change and optionally small line chart that describes KPI values in the past to the current one. Gauge Meter, is KPI presentation with Gauge visualization, giving feeling to end user, how much current value is successful. Data usage within tiles (Categories and series) After drag-and-drop tile to dashboard, click to edit tile (Pen icon), choose dashboard title and select or create analysis/query that will feed current tile with data we like to visualize. Essentially, each dashboard tile is receiving data in the format of categories and series. Column and line charts could accept many series of values, list chart accepts one or two series of values, while Pie chart, KPI and Gauge meter accepts only one series of values to visualize data. 4.2. ‘Analysis’ data for dashboard tiles Analysis created in Kyubit Business Intelligence could be used as data for dashboard tile. Analysis rows presents are categories while columns in analysis presents series. In this example ‘Month of Year’ presents categories, while ‘(Product) Subcategories’ present two series of values (‘Mountain bikes’ and ‘Road Bikes’). Dashboards with Kyubit Business Intelligence User Manual, www.kyubit.com - [email protected] 20 Kyubit Business Intelligence, Dashboards user manual When this analysis data is defined for dashboard tile, it will could be presented on these different ways using different visualizations (charts) LINE CHART COLUMN CHART PIE CHART Dashboards with Kyubit Business Intelligence User Manual, www.kyubit.com - [email protected] 21 Kyubit Business Intelligence, Dashboards user manual (Note: pie chart shows only first series) LIST CHART (Data contains two series) (Data contains one series) Dashboards with Kyubit Business Intelligence User Manual, www.kyubit.com - [email protected] 22 Kyubit Business Intelligence, Dashboards user manual 4.3. ‘Geo Maps’ configuration and usage ‘Geo Maps’ displays data related to world countries and regions in a geographical context. To correctly interpret retrieve data to ‘countries’ or ‘regions’, certain convention is expected. For countries, country names could be defined in English language or using two letter country codes (ISO 3166). Two letter country codes is recommended approach. For country regions, names of the regions are required in English language. For example, for US region data is expected as "Virginia", "North Carolina", "District of Columbia" etc. Kyubit Business Intelligence support Geo maps for all continents and major countries. List of available maps is expanded with almost every new version of Kyubit BI application. Check end section of this document for detailed list of values that are supported when supplying data for Geo maps for various countries and regions. Please, contact [email protected] for additional maps and region name conventions. Examples… Dashboards with Kyubit Business Intelligence User Manual, www.kyubit.com - [email protected] 23 Kyubit Business Intelligence, Dashboards user manual 4.4. Enlarged view on dashboard tile Data visualization on dashboard tile in certain moments is not large enough, for example, for presentation purposes, when focus is on a particular tile. All tiles have ‘Magnify’ icon that enlarges tile visualization. Enlarge action transforms view to single tile visualization on the screen. Enlarged view also enables OLAP actions (if data is from OLAP data source) and single point visualization. Dashboards with Kyubit Business Intelligence User Manual, www.kyubit.com - [email protected] 24 Kyubit Business Intelligence, Dashboards user manual 4.5. ‘MDX query’ data for dashboard tiles While creating MDX query for dashboard tiles, values on column axis presents series, while values on rows axis presents categories. (More information about queries, see ‘6. Working with queries section’) Example of ‘Column chart’ using above query data… Dashboards with Kyubit Business Intelligence User Manual, www.kyubit.com - [email protected] 25 Kyubit Business Intelligence, Dashboards user manual 4.6. ‘TSQL Queries’ data for dashboard tiles While creating TSQL query for dashboard tiles, values on column axis presents series, while values on rows axis presents categories. (More information about queries, see ‘6. Working with queries section’) Example of ‘Pie chart’ using above query data… Dashboards with Kyubit Business Intelligence User Manual, www.kyubit.com - [email protected] 26 Kyubit Business Intelligence, Dashboards user manual 5. Working with KPIs Once created, KPI could be re-used on many dashboards with respect to defined permissions on the KPI. All available KPIs to current user are visible in ‘Dashboards’ -> ‘KPI’ section of Kyubit Business Intelligence. When one of dashboard tiles should display KPI, one must first be defined in the Kyubit Business Intelligence application to be used on dashboard itself. It could be right away created while in dashboard ‘Design’ view, without leaving working dashboard. 5.1. Designing KPI ‘KPI Design’ form offers everything on one place to create KPI in Kyubit Business Intelligence application. Dashboards with Kyubit Business Intelligence User Manual, www.kyubit.com - [email protected] 27 Kyubit Business Intelligence, Dashboards user manual ‘KPI Name’, defines full name of the KPI in the system. ‘KPI Short Name’, will be used on places (mobile device), where space is limited ‘KPI Description’, simply described KPI structure for other users. ‘Success Model’, defines if higher values are more successful or lower values are more successful. ‘KPI Value’ is actual value that is tested for KPI success. Could be configured as ‘Fixed numeric value’ or value from ‘Query/Analysis’. ‘Success threshold’, defines limit above KPI status is consider as ‘Success’ and marked with green arrow icon. Could be configured as ‘Fixed numeric value’ or value from ‘Query/Analysis’. ‘Fail threshold’, defines limit bellow KPI status is considered as ‘Failed’ and marked with red arrow icon. Could be configured as ‘Fixed numeric value’ or value from ‘Query/Analysis’. If ‘KPI value’ is between ‘Success’ and ‘Fail’ limit, KPI is in the ‘Even’ status and marked with yellow circle. ‘Last change as percentage’, defines if last change will be displayed as percentage or regular delta value. ‘Show KPI values line chart’, defined if line chart will be visible next to KPI to reflect changing of data through time, up to last (current) value. KPI data feed is based on series of values (first series of analysis/query) and last value in series is considered as current value to be evaluated for KPI, previous values are considered as historic and could be displayed as list chart next to KPI indicator. When all inputs are selected, click on ‘Test KPI’ to immediately display KPI visualization and perhaps make correction, before it is closed. 5.2. Understanding data usage for KPI design Data to display KPI comes from ‘Analysis’ (existing analysis within Kyubit Business Intelligence application), ‘MDX Query’ or ‘TSQL Query’. Value to be evaluated as relevant for KPI is the last value in the first series of values retrieved from analysis or query. All other values before last values are considered as historic supplement of values and are used to describe trend and last value change (delta). Dashboards with Kyubit Business Intelligence User Manual, www.kyubit.com - [email protected] 28 Kyubit Business Intelligence, Dashboards user manual KPI value is first value in first series of query values, other values are used to draw line chart and penultimate value is used to show ‘last value change’. Same principles are used if data is retrieved from ‘Analysis’ or ‘MDX query’. 5.3. Setting permissions for KPI If KPI should be visible to other users, click on the ‘Permissions’ options in the upper-right corner and add appropriate Active Directory users and groups to have ‘Read’ or ‘Read/Write’ permissions or set unrestricted access to created KPI. (See chapter 7.1. for more details) Dashboards with Kyubit Business Intelligence User Manual, www.kyubit.com - [email protected] 29 Kyubit Business Intelligence, Dashboards user manual 6. Working with Queries Data for dashboard tiles comes from ‘Analysis’ (existing analysis in Kyubit Business Intelligence) or from MDX/TSQL queries. This chapter describes ‘Query’ creation and some important properties of queries. All queries available to current user are displayed in Dashboards -> Queries section of Kyubit Business Intelligence. Two query views are available: ‘All available Queries’ (considering query permissions) and all queries ‘Created by me’. 6.1. Creating query All Kyubit Business Intelligence users could create query using Query design form. Dashboards with Kyubit Business Intelligence User Manual, www.kyubit.com - [email protected] 30 Kyubit Business Intelligence, Dashboards user manual For each query ‘Data source’ have to be selected. If data source is OLAP database, MDX query will be expected and if data source is SQL database, TSQL query will be expected. Both MDX and TSQL queries always expect first column as category column with any type of data, while all subsequent columns are considered as series of values and must be of numeric type. Both MDX and TSQL queries expects at least one series of values (one category and one series columns of data). 6.2. Query values measure units For each of query series of values, measure unit has to be set individually. Click on the column ‘Set units’ option and fill-in measure units for selected column. Same measure unit will be displayed wherever this query is used on any of the dashboard visual elements (tiles). Dashboards with Kyubit Business Intelligence User Manual, www.kyubit.com - [email protected] 31 Kyubit Business Intelligence, Dashboards user manual 6.3. Impersonate query execution By default, query will be executed in the context of current user. If for any reason data source needs to be accessed with different user credentials. Impersonate user credentials could be defined on ‘Impersonate’ tab on the query design form. 6.4. Query caching Query results could be cached to avoid production data sources from constant query execution and save their processing time. Imagine hundreds of users opening same dashboard and for each opening queries to underlying data sources executes each time dashboard is opened. That kind of query execution is unnecessary in most scenarios and caching queries for certain amount of time perfectly good for most dashboard scenarios. To set caching on certain query, open query design form and on ‘Caching’ tab set number of minutes for which query results will be cached. Query results are cached on two levels. First, query results are cached on ASP.NET level within Kyubit Business Intelligence application memory. If, for any reason, IIS is restarted or application is recycled within IIS Dashboards with Kyubit Business Intelligence User Manual, www.kyubit.com - [email protected] 32 Kyubit Business Intelligence, Dashboards user manual execution, query results are stored in Kyubit Business Intelligence internal database. In both cases, cached query results will expired after defined amount of time and original data source will be queries afterwards. 6.5. Setting Query permissions If Query should be visible to other users, click on the ‘Permissions’ options in the upper-right corner and add appropriate Active Directory users and groups to have ‘Read’ or ‘Read/Write’ permissions or set unrestricted access to created Query. (See chapter 7.1. for more details) Dashboards with Kyubit Business Intelligence User Manual, www.kyubit.com - [email protected] 33 Kyubit Business Intelligence, Dashboards user manual 7. 7.1. Dashboard slicers and analysis within dashboard Slicers All data on dashboards that is based on OLAP data source could be manipulated with OLAP data slicers that could be added in design or production time. If slicer is added in design time, it will be part of the dashboard whenever dashboard is opened. Also users who are not dashboard designers, but only use dashboard could also add dashboard slicer that will be only a temporary supplement to the dashboard. Adding slicer for certain OLAP data source will automatically filter (refresh) all tiles based on same OLAP data source with slicer dimension members. Slicers could be additional changed, reordered and removed to provide fine analysis tool while exploring OLAP data. Dashboards with Kyubit Business Intelligence User Manual, www.kyubit.com - [email protected] 34 Kyubit Business Intelligence, Dashboards user manual 7.2. Tiles drilldown, drill-through OLAP actions within dashboard All dashboard tiles based on OLAP data source could be drilled down, sliced or drilled through in place within dashboard. Right click on the OLAP dashboard tile and selected one of available OLAP actions. 8. Folders and dashboards access permissions To group more dashboards into logical group that shares same user permissions, folders could be created to contain any number of dashboards. When created, dashboard by default is located in ‘My Dashboards’ folder, visible only to dashboard creator. At any time user can share dashboard with other users by moving dashboard to folder that is shared by other users. Dashboards with Kyubit Business Intelligence User Manual, www.kyubit.com - [email protected] 35 Kyubit Business Intelligence, Dashboards user manual To create folder, choose option ‘Create New Folder’, fill-in folder title and click save. New folder will appear in the list of folders. New folder is by default visible only to creator and administrators. To give other people access to folder, open the same folder (Edit option) and select ‘Permissions’ in the upper-right corner. 8.1. Setting object permissions To set permissions for any Kyubit Business Intelligence object, click on the ‘Permissions’ option in the upperright corner of the form and edit object permission. Search for domain users and groups to set appropriate permissions. Read/Write permission gives full rights on folder and dashboards within folder. Read permission give right to see folder and open all dashboards within folder. No changes are allowed. By setting permissions to ‘Everyone’ (unrestricted) gives (Read or Read/Write) permission to any user that is trying to access folder and all dashboards within folder. Dashboards with Kyubit Business Intelligence User Manual, www.kyubit.com - [email protected] 36 Kyubit Business Intelligence, Dashboards user manual Dashboards with Kyubit Business Intelligence User Manual, www.kyubit.com - [email protected] 37 Kyubit Business Intelligence, Dashboards user manual 9. Subscriptions Important aspect of Kyubit Business Intelligence dashboards usage is to deliver dashboards to users using email subscriptions, which contain dashboard data in form of HTML with embedded dashboard image or attached PDF document with dashboard details. Every user of Kyubit Business Intelligence with at least ‘Read’ permission has privileges to make a subscription to dashboard and receive dashboard on email within scheduled time of delivery. 9.1. My subscriptions Every user can see all his own subscriptions (Analysis and Dashboards) in Kyubit Business Intelligence -> Dashboards section, where all his subscriptions could be managed. 9.2. Subscriptions within dashboard When user opens certain dashboard, he can immediately see if he already has some subscriptions created to the same dashboard. By click on “Subscribe” link, form with existing subscriptions of current user will be displayed with option to create new subscription, edit or delete existing. Dashboards with Kyubit Business Intelligence User Manual, www.kyubit.com - [email protected] 38 Kyubit Business Intelligence, Dashboards user manual 9.3. Subscription details There are several subscription settings that could impact the way users are receiving subscriptions. Subscription title, sets the name that will appear when delivering dashboard/analysis inside email message. Subscription item, selects Kyubit Business Intelligence content (Analysis or Dashboard) to deliver within subscription. User can subscribe to all content with at least ‘Read’ permissions. Dashboards with Kyubit Business Intelligence User Manual, www.kyubit.com - [email protected] 39 Kyubit Business Intelligence, Dashboards user manual 9.4. Occurs, defines scheduled time to deliver subscription. There are three different time scheduling categories: o Weekly, set the week days to deliver subscription o Monthly, set the month days to deliver subscription o Once, set single day to deliver subscription Time, sets time within day to deliver subscription Recipients, list of email addresses to deliver subscription (separated by semicolon) Include, type of delivered content o Only link to Kyubit Business Intelligence dashboard o Link + embedded dashboard image (user immediately sees dashboard image when opens email message) o Link + PDF dashboard document Disable, all subscriptions marked disable will not be delivered at scheduled time. Send subscriptions conditionally Dashboard subscriptions have ability to be sent conditionally, depending on the one of containing KPI status. If dashboard contains at least one KPI, it could be used to set condition to send subscription. For example, if some Key performance indicator is in status “Fail”, subscription could be sent to alarm and inform appropriate users. 9.5. Impersonate subscriptions data usage By default, subscriptions are performed in the context of “Kyubit Subscription” windows service logon user. In some cases, same user does not have access to dashboard or analysis data source. If impersonate user Dashboards with Kyubit Business Intelligence User Manual, www.kyubit.com - [email protected] 40 Kyubit Business Intelligence, Dashboards user manual credentials are provided, subscription will be performed in the context of impersonated user, regardless of “Kyubit Subscription” windows service logon user. Impersonate feature could be also used to deliver data relevant for specific user. For example, one user could have permissions to see OLAP dimensions and measures, other user is not permitted. By setting specific user credentials subscribed content could be different for same analysis or dashboard than to other users. Dashboards with Kyubit Business Intelligence User Manual, www.kyubit.com - [email protected] 41 Kyubit Business Intelligence, Dashboards user manual 10. Integrate dashboards with other web applications and sites Dashboard created within Kyubit Business Intelligence could be easily embedded/included in any HTML page using IFRAME element, allowing number of configuration options to customize dashboard appearance to best fit visually into existing HTML page. Simple example of embedded dashboard using IFRAME element: <iframe id="dashFrame" src="http://KyubitBI/Forms/Dashboard.aspx?DashboardID=3" width="800px" height="1000px" frameborder="0" scrolling="no"></iframe> Add IFRAME element and set SRC attribute to URL of the dashboard from Kyubit Business Intelligence application (Same URL if opened from Kyubit Business Intelligence application). Additional URL attributes to customize dashboard appearance: Align, alignment of the dashboard within IFRAME element Font, dashboard fonts FontColor, dashboard font color TileFontSize, dashboard title size HideDesignButton, hides ‘Design’ button Dashboards with Kyubit Business Intelligence User Manual, www.kyubit.com - [email protected] 42 Kyubit Business Intelligence, Dashboards user manual HideCloseButton, hides ‘Close’ button HideOpenPDFbutton, hides ‘Open PDF’ button HideSubscribeButton, hides ‘Subscribe’ button Example with all attributes: <iframe id="dashFrame" src="http://KyubitBI/Forms/Dashboard.aspx?DashboardID=3&align=right&font=helvetica&fontColor=red&tileF ontSize=11px&hideDesignButton=1&hideCloseButton=1&hideOpenPDFbutton=1&hideSubscribeButton=1" width="800px" height="1000px" frameborder="0" scrolling="no"></iframe> Dashboards with Kyubit Business Intelligence User Manual, www.kyubit.com - [email protected] 43 Kyubit Business Intelligence, Dashboards user manual 11. Geo Maps available lists of keys OLAP and SQL data that are geographically related could be displayed in Geo Maps dashboard tile. Data has to match “codes” or “names” for specific Geo map that presents certain country or region. Below is list of available “codes” and “names” for specific Geo Map. 11.1. Continents No Code Name 1 2 3 4 5 6 AF NA OC AS EU SA Africa North America Oceania Asia Europe South America 11.2. World, Africa, Asia, Europe, Oceania, South America, North America No Code Name 1 2 3 4 5 6 7 8 9 10 11 12 13 14 15 16 17 18 19 20 21 22 23 24 25 26 BD BE BF BG BA BN BO JP BI BJ BT JM BW BR BS BY BZ RU RW RS TL TM TJ RO GW GT Bangladesh Belgium Burkina Faso Bulgaria Bosnia and Herz. Brunei Bolivia Japan Burundi Benin Bhutan Jamaica Botswana Brazil Bahamas Belarus Belize Russia Rwanda Serbia Timor-Leste Turkmenistan Tajikistan Romania Guinea-Bissau Guatemala Dashboards with Kyubit Business Intelligence User Manual, www.kyubit.com - [email protected] 44 Kyubit Business Intelligence, Dashboards user manual 27 28 29 30 31 32 33 34 35 36 37 38 39 40 41 42 43 44 45 46 47 48 49 50 51 52 53 54 55 56 57 58 59 60 61 62 63 64 65 66 67 68 69 70 71 72 73 74 75 76 77 78 79 GR GQ GY GE GB GA GN GM GL GH OM TN JO HR HT HU HN PR PS PT PY PA PG PE PK PH PL ZM EH EE EG ZA EC IT VN SB ET SO ZW ES ER ME MD MG MA UZ MM ML MN MK MW MR UG Greece Eq. Guinea Guyana Georgia United Kingdom Gabon Guinea Gambia Greenland Ghana Oman Tunisia Jordan Croatia Haiti Hungary Honduras Puerto Rico Palestine Portugal Paraguay Panama Papua New Guinea Peru Pakistan Philippines Poland Zambia W. Sahara Estonia Egypt South Africa Ecuador Italy Vietnam Solomon Is. Ethiopia Somalia Zimbabwe Spain Eritrea Montenegro Moldova Madagascar Morocco Uzbekistan Myanmar Mali Mongolia Macedonia Malawi Mauritania Uganda Dashboards with Kyubit Business Intelligence User Manual, www.kyubit.com - [email protected] 45 Kyubit Business Intelligence, Dashboards user manual 80 81 82 83 84 85 86 87 88 89 90 91 92 93 94 95 96 97 98 99 100 101 102 103 104 105 106 107 108 109 110 111 112 113 114 115 116 117 118 119 120 121 122 123 124 125 126 127 128 129 130 131 132 MY MX IL FR XS FI FJ FK NI NL NO NA VU NC NE NG NZ NP XK CI CH CO CN CM CL XC CA CG CF CD CZ CY CR CU SZ SY KG KE SS SR KH SV SK KR SI KP KW SN SL KZ SA SE SD Malaysia Mexico Israel France Somaliland Finland Fiji Falkland Is. Nicaragua Netherlands Norway Namibia Vanuatu New Caledonia Niger Nigeria New Zealand Nepal Kosovo Côte d'Ivoire Switzerland Colombia China Cameroon Chile N. Cyprus Canada Congo Central African Rep. Dem. Rep. Congo Czech Rep. Cyprus Costa Rica Cuba Swaziland Syria Kyrgyzstan Kenya S. Sudan Suriname Cambodia El Salvador Slovakia Korea Slovenia Dem. Rep. Korea Kuwait Senegal Sierra Leone Kazakhstan Saudi Arabia Sweden Sudan Dashboards with Kyubit Business Intelligence User Manual, www.kyubit.com - [email protected] 46 Kyubit Business Intelligence, Dashboards user manual 133 134 135 136 137 138 139 140 141 142 143 144 145 146 147 148 149 150 151 152 153 154 155 156 157 158 159 160 161 162 163 164 165 166 167 168 169 170 171 172 173 174 175 176 DO DJ DK DE YE DZ US UY LB LA TW TT TR LK LV LT LU LR LS TH TF TG TD LY AE VE AF IQ IS IR AM AL AO AR AU AT IN TZ AZ IE ID UA QA MZ 11.3. Dominican Rep. Djibouti Denmark Germany Yemen Algeria United States Uruguay Lebanon Lao PDR Taiwan Trinidad and Tobago Turkey Sri Lanka Latvia Lithuania Luxembourg Liberia Lesotho Thailand Fr. S. Antarctic Lands Togo Chad Libya United Arab Emirates Venezuela Afghanistan Iraq Iceland Iran Armenia Albania Angola Argentina Australia Austria India Tanzania Azerbaijan Ireland Indonesia Ukraine Qatar Mozambique USA No Code Name 1 VA Virginia Dashboards with Kyubit Business Intelligence User Manual, www.kyubit.com - [email protected] 47 Kyubit Business Intelligence, Dashboards user manual 2 3 4 5 6 7 8 9 10 11 12 13 14 15 16 17 18 19 20 21 22 23 24 25 26 27 28 29 30 31 32 33 34 35 36 37 38 39 40 41 42 43 44 45 46 47 48 49 50 51 PA TN WV NV TX NH NY HI VT NM NC ND NE LA SD DC DE FL CT WA KS WI OR KY ME OH OK ID WY UT IN IL AK NJ CO MD MA AL MO MN CA IA MI GA AZ MT MS SC RI AR Pennsylvania Tennessee West Virginia Nevada Texas New Hampshire New York Hawaii Vermont New Mexico North Carolina North Dakota Nebraska Louisiana South Dakota District of Columbia Delaware Florida Connecticut Washington Kansas Wisconsin Oregon Kentucky Maine Ohio Oklahoma Idaho Wyoming Utah Indiana Illinois Alaska New Jersey Colorado Maryland Massachusetts Alabama Missouri Minnesota California Iowa Michigan Georgia Arizona Montana Mississippi South Carolina Rhode Island Arkansas Dashboards with Kyubit Business Intelligence User Manual, www.kyubit.com - [email protected] 48 Kyubit Business Intelligence, Dashboards user manual 11.4. India No Code Name 1 2 3 4 5 6 7 8 9 10 11 12 13 14 15 16 17 18 19 20 21 22 23 24 25 26 27 28 29 30 31 32 33 34 BR PY DD DN DL NL WB HR HP AS UT JH JK UP SK MZ CT CH GA GJ RJ MP OR TN AN AP TR AR KA PB ML MN MH KL Bihar Puducherry Daman and Diu Dadra and Nagar Haveli Delhi Nagaland West Bengal Haryana Himachal Pradesh Assam Uttaranchal Jharkhand Jammu and Kashmir Uttar Pradesh Sikkim Mizoram Chhattisgarh Chandigarh Goa Gujarat Rajasthan Madhya Pradesh Orissa Tamil Nadu Andaman and Nicobar Andhra Pradesh Tripura Arunachal Pradesh Karnataka Punjab Meghalaya Manipur Maharashtra Kerala Dashboards with Kyubit Business Intelligence User Manual, www.kyubit.com - [email protected] 49 Kyubit Business Intelligence, Dashboards user manual 11.5. Norway No Code Name 1 2 3 4 5 6 7 8 9 10 11 12 13 14 15 16 17 18 19 20 07 01 06 21 20 03 05 10 11 12 04 14 15 16 17 18 19 08 09 02 Vestfold Østfold Buskerud Svalbard Finnmark Oslo Oppland Vest-Agder Rogaland Hordaland Hedmark Sogn og Fjordane Møre og Romsdal Sør-Trøndelag Nord-Trøndelag Nordland Troms Telemark Aust-Agder Akershus 11.6. Spain No Code Name 1 2 3 4 5 6 7 8 9 10 11 12 13 14 15 16 17 18 19 NA B CS ZA O OR M L J H CU T C AV A CR CO VA Z Navarra Barcelona Castellón Zamora Asturias Orense Madrid Lérida Jaén Huelva Cuenca Tarragona La Coruña Ávila Alicante Ciudad Real Córdoba Valladolid Zaragoza Dashboards with Kyubit Business Intelligence User Manual, www.kyubit.com - [email protected] 50 Kyubit Business Intelligence, Dashboards user manual 20 21 22 23 24 25 26 27 28 29 30 31 32 33 34 35 36 37 38 39 40 41 42 43 44 45 46 47 48 49 50 11.7. MA AL CE PM VI S TE CC P PO GI TO MU GR GU AB SO ML LU SE CA SG BU SA V LE BI HU LO SS BA Málaga Almería Ceuta Baleares Álava Cantabria Teruel Cáceres Palencia Pontevedra Gerona Toledo Murcia Granada Guadalajara Albacete Soria Melilla Lugo Sevilla Cádiz Segovia Burgos Salamanca Valencia León Bizkaia Huesca La Rioja Gipuzkoa Badajoz Australia No Code Name 1 2 3 4 5 6 7 8 ACT WA TAS VIC NT QLD SA NSW Australian Capital Territory Western Australia Tasmania Victoria Northern Territory Queensland South Australia New South Wales Dashboards with Kyubit Business Intelligence User Manual, www.kyubit.com - [email protected] 51 Kyubit Business Intelligence, Dashboards user manual 11.8. France No Code Name 1 2 3 4 5 6 7 8 9 10 11 12 13 14 15 16 17 18 19 20 21 22 23 24 25 26 27 C B A G F E D K J I YT O N M L S R Q P V U T RE GF H MQ GP Auvergne Aquitaine Alsace Champagne-Ardenne Centre Bretagne Bourgogne Languedoc-Roussillon Île-de-France Franche-Comté Mayotte Nord-Pas-de-Calais Midi-Pyrénées Lorraine Limousin Picardie Pays de la Loire Haute-Normandie Basse-Normandie Rhône-Alpes Provence-Alpes-Côte-d'Azur Poitou-Charentes Réunion Guyane française Corse Martinique Guadeloupe 11.9. Thailand No Code Name 1 2 3 4 5 6 7 8 9 10 11 12 13 14 57 56 55 54 53 52 51 50 93 92 91 90 96 95 Chiang Rai Phayao Nan Phrae Uttaradit Lampang Lamphun Chiang Mai Phatthalung Trang Satun Songkhla Narathiwat Yala Dashboards with Kyubit Business Intelligence User Manual, www.kyubit.com - [email protected] 52 Kyubit Business Intelligence, Dashboards user manual 15 16 17 18 19 20 21 22 23 24 25 26 27 28 29 30 31 32 33 34 35 36 37 38 39 40 41 42 43 44 45 46 47 48 49 50 51 52 53 54 55 56 57 58 59 60 61 62 63 64 65 66 67 58 13 12 11 10 17 16 15 14 71 70 19 72 75 73 77 76 18 39 74 84 85 86 80 81 82 83 32 40 41 42 43 44 45 46 47 48 49 26 27 24 25 22 23 20 21 62 63 60 61 66 67 64 Mae Hong Son Pathum Thani Nonthaburi Samut Prakan Bangkok Metropolis Sing Buri Lop Buri Ang Thong Phra Nakhon Si Ayutthaya Kanchanaburi Ratchaburi Saraburi Suphan Buri Samut Songkhram Nakhon Pathom Prachuap Khiri Khan Phetchaburi Chai Nat Nong Bua Lam Phu Samut Sakhon Surat Thani Ranong Chumphon Nakhon Si Thammarat Krabi Phangnga Phuket Surin Khon Kaen Udon Thani Loei Nong Khai Maha Sarakham Roi Et Kalasin Sakon Nakhon Nakhon Phanom Mukdahan Nakhon Nayok Sa Kaeo Chachoengsao Prachin Buri Chanthaburi Trat Chon Buri Rayong Kamphaeng Phet Tak Nakhon Sawan Uthai Thani Phichit Phetchabun Sukhothai Dashboards with Kyubit Business Intelligence User Manual, www.kyubit.com - [email protected] 53 Kyubit Business Intelligence, Dashboards user manual 68 69 70 71 72 73 74 75 76 77 11.10. 65 35 34 37 33 38 36 31 94 30 Phitsanulok Yasothon Ubon Ratchathani Amnat Charoen Si Sa Ket Bueng Kan Chaiyaphum Buri Ram Pattani Nakhon Ratchasima Russia No Code Name 1 2 3 4 5 6 7 8 9 10 11 12 13 14 15 16 17 18 19 20 21 22 23 24 25 26 27 28 29 30 31 32 33 34 35 PNZ VLA LEN SAK KYA UD IVA LIP AST CE KHA ORE KIR BA NGR KLU OMS SAR ORL STA SE SAM SA SVE KK SPE MOS BEL KHM VLG CHE YAR TUL IRK NIZ Penzenskaya oblast Vladimirskaya oblast Leningradskaya oblast Sakhalinskaya oblast Krasnoyarskiy kray Udmurtskaya Respublika Ivanovskaya oblast Lipetskaya oblast Astrakhanskaya oblast Chechenskaya Respublika Khabarovskiy kray Orenburgskaya oblast Kirovskaya oblast Bashkortostan, Respublika Novgorodskaya oblast Kaluzhskaya oblast Omskaya oblast Saratovskaya oblast Orlovskaya oblast Stavropolskiy kray Severnaya Osetiya-Alaniya, Respublika Samarskaya oblast Sakha, Respublika Sverdlovskaya oblast Khakasiya, Respublika Sankt-Peterburg Moskovskaya oblast Belgorodskaya oblast Khanty-Mansiyskiy avtonomnyy okrug Vologodskaya oblast Chelyabinskaya oblast Yaroslavskaya oblast Tulskaya oblast Irkutskaya oblast Nizhegorodskaya oblast Dashboards with Kyubit Business Intelligence User Manual, www.kyubit.com - [email protected] 54 Kyubit Business Intelligence, Dashboards user manual 36 37 38 39 40 41 42 43 44 45 46 47 48 49 50 51 52 53 54 55 56 57 58 59 60 61 62 63 64 65 66 67 68 69 70 71 72 73 74 75 76 77 78 79 80 81 82 83 YAN KGD MOW KAM BU KEM CHU ULY KGN KRS KR ME IN MAG MO TA ZAB RYA TAM ARK KC TY MUR VOR PSK TVE VGG KOS KL TOM KO TYU DA NVS AD PER ROS PRI KB AL NEN ALT KDA YEV AMU BRY SMO CU Yamalo-Nenetskiy avtonomnyy okrug Kaliningradskaya oblast Moskva Kamchatskiy kray Buryatiya, Respublika Kemerovskaya oblast Chukotskiy avtonomnyy okrug Ulyanovskaya oblast Kurganskaya oblast Kurskaya oblast Kareliya, Respublika Mariy El, Respublika Ingushetiya, Respublika Magadanskaya oblast Mordoviya, Respublika Tatarstan, Respublika Zabaykalskiy kray Ryazanskaya oblast Tambovskaya oblast Arkhangelskaya oblast Karachayevo-Cherkesskaya Respublika Tyva, Respublika [Tuva] Murmanskaya oblast Voronezhskaya oblast Pskovskaya oblast Tverskaya oblast Volgogradskaya oblast Kostromskaya oblast Kalmykiya, Respublika Tomskaya oblast Komi, Respublika Tyumenskaya oblast Dagestan, Respublika Novosibirskaya oblast Adygeya, Respublika Permskiy kray Rostovskaya oblast Primorskiy kray Kabardino-Balkarskaya Respublika Altay, Respublika Nenetskiy avtonomnyy okrug Altayskiy kray Krasnodarskiy kray Yevreyskaya avtonomnaya oblast Amurskaya oblast Bryanskaya oblast Smolenskaya oblast Chuvashskaya Respublika Dashboards with Kyubit Business Intelligence User Manual, www.kyubit.com - [email protected] 55 Kyubit Business Intelligence, Dashboards user manual 11.11. Netherlands No Code Name 1 2 3 4 5 6 7 8 9 10 11 12 OV FR UT GE FL NH ZE ZH GR DR NB LI Overijssel Friesland Utrecht Gelderland Flevoland Noord-Holland Zeeland Zuid-Holland Groningen Drenthe Noord-Brabant Limburg 11.12. Italy No Code Name 1 2 3 4 5 6 7 8 9 10 11 12 13 14 15 16 17 18 19 20 23 21 25 52 36 42 45 57 32 55 67 34 65 62 75 77 78 82 72 88 Valle d'Aosta Piemonte Lombardia Toscana Friuli-Venezia Giulia Liguria Emilia-Romagna Marche Trentino-Alto Adige Umbria Molise Veneto Abruzzo Lazio Apulia Basilicata Calabria Sicily Campania Sardegna Dashboards with Kyubit Business Intelligence User Manual, www.kyubit.com - [email protected] 56 Kyubit Business Intelligence, Dashboards user manual 11.13. Germany No Code Name 1 2 3 4 5 6 7 8 9 10 11 12 13 14 15 16 BE ST RP BB NI MV TH BW HH SH NW SN HB SL BY HE Berlin Sachsen-Anhalt Rheinland-Pfalz Brandenburg Niedersachsen Mecklenburg-Vorpommern Thüringen Baden-Württemberg Hamburg Schleswig-Holstein Nordrhein-Westfalen Sachsen Bremen Saarland Bayern Hessen 11.14. Switzerland No Code Name 1 2 3 4 5 6 7 8 9 10 11 12 13 14 15 16 17 18 19 20 21 22 23 24 SO LU SH SG UR NE BS JU BL SZ BE NW ZG FR ZH VS VD TI TG OW AG GE AI GL Solothurn Lucerne Schaffhausen Sankt Gallen Uri Neuchâtel Basel-Stadt Jura Basel-Landschaft Schwyz Bern Nidwalden Zug Fribourg Zürich Valais Vaud Ticino Thurgau Obwalden Aargau Genève Appenzell Innerrhoden Glarus Dashboards with Kyubit Business Intelligence User Manual, www.kyubit.com - [email protected] 57 Kyubit Business Intelligence, Dashboards user manual 25 26 11.15. GR AR Graubünden Appenzell Ausserrhoden US – States For US states provide data that exactly match county name. For example, “Knox County” or “Belmont County”. Dashboards with Kyubit Business Intelligence User Manual, www.kyubit.com - [email protected]