1
Pipeline Current Mapper
User Guide
Revision 7 04.11.02
Pipeline Current Mapper User Guide
Trouble Shooting
When reporting any problem to your Radiodetection Dealer/Supplier it is important to quote the following:
Equipment Serial Number.
Software Revision Number.
Software Revision Number is displayed on the LCD during switch on.
Warning
Radiodetection Receivers detect almost all buried cables and most conductors, but there are
some which do not radiate signals and which Radiodetection receivers cannot detect.
Radiodetection receivers do not indicate whether a signal is from a single cable, several buried
side by side or one above another.
This equipment is NOT approved for use in areas where hazardous gases may be present.
Reduce audio level before using headphones.
Ni-Cad batteries should be disposed of in accordance with your Company's work practice, and/or
the relevant law or guidelines in your country.
Warning
The operation of any cable and pipe locator may be affected when used in close proximity to
ferrous materials such as manhole covers and parked cars. Keep a one or two meter distance
from these objects when taking critical measurements such as depth and current readings.
Standing too close to the locator when wearing steel toe capped boots may also affect the
readings.
This instrument, or family of instruments, will not be permanently damaged by reasonable electrostatic
discharge and has been tested in accordance with IEC 801-2. However, in extreme cases temporary
malfunction may occur. If this happens, switch off, wait and switch on again. If the instrument still
malfunctions, disconnect the batteries for a few seconds.
Pipeline Current Mapper User Guide
CONTENTS
Title
Section
Page
Introduction .................................................................................................................................................1
Step by Step Guide to Current Mapping
PCM System...............................................................................................................................................3
PCM Transmitter Functions........................................................................ 1.............................................4
Signal Connection ...............................................................................................................................6
PCM Receiver Functions............................................................................ 2...........................................11
Steps in Pipeline Current Measurement............................................................................................15
PCM Receiver Use – Basic Locating, Technique, Depthing ...................... 3...........................................18
Mapping Current Theory using dBmA ........................................................ 4...........................................22
Taking Measurements ................................................................................ 5...........................................24
Applications case studies ........................................................................... 6...........................................27
Using Accessory A Frame with PCM ......................................................... 7...........................................30
Identifying Interference ............................................................................... 8...........................................33
Avoiding errors and Interpreting Results .................................................... 8...........................................34
Error Codes ................................................................................................ 9...........................................36
Changing LCD Display .............................................................................. 10..........................................37
PCM Software Instructions, versions V 1.1 and V 2.1 .............................. 11..........................................39
Preparing PCM Graphs using Microsoft Excel Spreadsheets................... 12..........................................44
Distance/Current................................................................................................................................45
Distance/Current & Depth .................................................................................................................49
Distance/Current & Current Loss Rate..............................................................................................57
Using PCM system with Datalogger and GPS .......................................... 13..........................................63
PCM Features and Specifications ............................................................. 14..........................................69
Configuration and operation of Trimble GPS Pathfinder……………………Appendix 1…….…………….80
Pipeline Current Mapper User Guide
Pipeline Current Mapper User Guide
Introduction
The Pipeline Current Mapper (PCM) system from Radiodetection enables the pipeline industry to
overcome the limitations of existing techniques used in evaluating the effectiveness of cathodicly
protected pipes. This new technology enables shorts caused by contact with other metallic structures and
coating defects to be identified. The system is the subject of patent applications.
Traditional Cathodic Protection (CP) surveys measure the voltage potential of the pipe with respect to the
earth around it to show that the pipe is protected against corrosion. Some pipes, due to coating
degradation or damage have low protection voltages and are at risk of increased corrosion damage.
Simple Ohms law shows that adding more current will cause more voltage, but higher rectifier output
voltages have been shown to speed the degradation of coatings. Another side effect is that more current
flowing can cause embrittlement of the pipeline metal leading to premature (and possibly catastrophic)
failures.
The PCM provides a new method to quickly locate faults and poor coating that is draining the current,
resulting in improved potentials and minimising damaging side effects. A PCM does not replace a Close
Interval Potential Survey (CIPS) as current flow and voltage potentials are related but other factors vary
this relation. The use of a Potential Survey is still required to verify protection levels, usually after the
rehabilitation work designed around PCM results is completed.
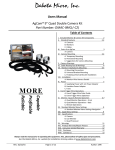
The PCM System:
•
Consists of a portable transmitter and a hand held receiver. The transmitter applies a special near
DC signal to the pipeline.
•
The receiver locates this unique signal on the pipeline and displays the signal's current magnitude
and direction without connection to the pipeline.
•
Accurately and easily locates and maps the pipeline even in areas where there is contact with other
metallic structures, interference, or congestion.
•
Provides a current profile and current direction that is virtually the same as the CP currents on the
pipeline. (* see footnote)
•
Provides an accurate evaluation of the condition of the coating of a section of pipe.
•
Reduces false indications and thereby minimises unnecessary excavations.
•
Provides data logging and on-site review of readings (receiver stores 100 or 399 readings) and
permits a graph to be printed from stored readings via a PC or Laptop.
•
Can be supplied with Accessory A frame, and used to pinpoint coating defects.
•
Reduces operational and maintenance costs and speeds up survey time.
•
Eliminates the need for the operator to perform 'current spans' and manual calculations to determine
CP currents along the pipeline that require connection to the pipeline.
•
Is designed for the Pipeline Industry with guidance and support from Gas Industry leaders.
•
The PCM is one part of the Radiodetection Pipeline Product range, which also includes the Stray
Current Mapper, Precision Pipe Locator, Pipeline Vector Bar and Smart Interrupter.
*Investigation of PCM Current relative to DC pipeline current, 29 November 1997, by Martin J. Frazier,
Corr Comp Co, Schaumburg, IL 60193. Copies of this paper can be purchased from Radiodetection.
Page 1
Pipeline Current Mapper User Guide
Step by Step Guide to Mapping
Section
Pages
PCM Transmitter Set Up
•
Connect output leads
WHITE to pipeline.
GREEN to anode, EIJ or suitable
grounding point
1
1
1
1
6&7
6&7
6&7
6&7
•
Select Mapping frequency.
1
4
•
Connect Power source.
1
10
•
Switch on transmitter.
1
4&5
•
Set current output level.
1
4&5
PCM Receiver Set Up
•
Slide on and connect PCM Magnetometer foot
•
Check Battery level, replace if necessary.
2
11
•
Set to same mapping frequency as transmitter.
2
12
•
Set to Peak mode.
2
12
Good local knowledge, a map and a notepad are
essential to obtaining the correct information
•
Use the map, locate the pipeline and move at least
30 - 50 M from the transmitter.
•
1. Use the receiver and verify that the PEAK and NULL
positions are within 15 cm/6 inches.
3
18&19
•
2. Obtain depth reading. A sensible reading indicates
a site free from interference.
3
20
•
3. Press mapping key to obtain PCM current reading.
2
15
•
4. Press the ü key to save result and note log number
on notepad and map.
2
15
•
5. Use map to select next mapping location, or continue
along the pipeline for predetermined distance. 50 – 100
Metres is adequate.
•
6. Select Null mode and trace pipeline to next mapping
location.
3
18&19
•
Repeat procedures 1 – 6 until pipeline survey is complete.
•
Use Accessory A Frame to pinpoint fault
7
30-32
•
Upload results to PC, and prepare graph of current
against distance (see Upload and Software section)
•
Archive results for future reference
2
11
12
12
17
39-43
44-63
44-63
Page 2
Pipeline Current Mapper User Guide
PCM System
PCM Transmitter
The PCM system's specialised constant current
high-power transmitter allows for long range signal
detection of up to 30 km (20 miles). Significantly
fewer pipeline connection points are needed
thereby reducing the time required to evaluate a
section of pipeline.
The transmitter has three operating modes that
enable both distribution and transmission pipeline
systems to be effectively mapped.
Connecting the PCM is straightforward, and the
transmitter’s current reading LCD and power
indicating LED’s help the operator to choose the
best settings for the specific pipeline application.
Use of PCM Transmitter see section 1.
PCM Receiver
The hand held receiver unit is used to locate the
pipeline, even in heavily congested areas, and then
provides the operator with a measurement of depth
current strength and direction of the near DC signal
applied by the system's transmitter.
The receiver makes the required calculations and
instantaneously displays the results. This provides
the operator with an improved method that
accurately troubleshoots the CP system by
pinpointing metallic contacts and locating areas of
coating defects.
Use of PCM receiver see section 2.
PCM Attachment (magfoot)
This contains the magnetometer (mag foot) that
detects the near DC mapping current
The PCM magnetometer foot is switched on when
the PCM current key is pressed to take a PCM
measurement.
When the PCM foot is fitted to the PCM receiver
there will be a confirming “beep” from the
loudspeaker.
The PCM magfoot also stores the pipeline current
mapping results in the built in datalogger, and it
must be attached to the receiver to upload results
to PC.
Use of PCM magfoot attachment see section 2.
Page 3
Pipeline Current Mapper User Guide
Section 1
PCM Transmitter Functions
The PCM transmitter is housed in a rugged
waterproof case which can be opened easily by
applying a slight pressure to the top of the case just
above the clips. The clips will then open freely.
In certain situations the air pressure within the
case may need to be equalised by unscrewing
the small knob located by the handle.
The case needs to remain open during
operation to allow the heat sink to cool.
When closing case ensure connection cables
are kept away from the heat sink and the
support strut.
PCM-Tx
Serial No.
Output OK
1 .00
Temerature
Over Temperature
Power Limit
Output Current (A)
The three-position rotary switch selects the applied
mapping frequencies as follows:
Voltage Limit
Output Voltage Level
1A
600 mA
ELF
ELF
LF
2A
300 mA
Frequency Select
The 4 Hz output current is shown on the LCD.
100 mA
3A
Output Level
TRANSMISSION LINES
ELF maximum range.
• 35% 4 Hz
• 65% ELF (128 Hz or 98 Hz)
TRANSMISSION AND DISTRIBUTION LINES
ELF current direction, medium range.
• 35% 4 Hz
• 30% 8 Hz (current direction)
• 35% ELF (128 Hz or 98 Hz)
Frequency Select
DISTRIBUTION LINES
LF current direction, alternative frequency.
• 35% 4 Hz
• 30% 8 Hz (current direction)
• 35% LF (640 Hz or 512 Hz)
PCM-Tx
Serial No.
Output OK
1 .00
Over Temerature
Power Limit
Output Current (A)
Voltage Limit
Output Voltage Level
600 mA
1A
ELF
ELF
2A
300 mA
100 mA
3A
Output Level
Page 4
The 4 Hz mapping frequency is always present.
The operator has a choice of selecting the locate
frequency and current direction indication if
required for identification in congested areas or for
fault finding.
LF
Current Select
The six position Current Select rotary switch
selects the following rms 4 Hz current settings: 100
mA, 300 mA, 600 mA, 1 A, 2 A, 3 A.
When the PCM Transmitter is in operation, the
selected current will remain at a constant level,
unless input power supply limit is reached.
Frequency Select
Pipeline Current Mapper User Guide
Section 1
Warning Lights and output indication
PCM-Tx
Serial No.
Output voltage indicated by yellow output voltage
level LED ‘s.
If no lights are lit the voltage is below 20V.
If the 20V LED is lit, the voltage applied is between 20 – 40V.
If the 40V LED is lit, the voltage applied is between 40 – 60V.
If the 60V is lit the voltage applied is between 60 – 80V.
If the 80V LED is lit the voltage is between 80 – 100V.
Output OK
1 .00
Over Temerature
Voltage Limit
Transmitter is at the 100V output voltage limit.
The resistance of the pipe or ground connection
is too high. Check all connections.
Power Limit
Output Current (A)
Voltage Limit
Output Voltage Level
600 mA
1A
ELF
ELF
2A
300 mA
100 mA
LF
Warning
3A
Output Level
Frequency Select
If the pipeline being surveyed has coating that is
known to be in good condition, it is probable that
the voltage warning LED’s will illuminate as the
current is increased.
If the 60V/80V/100V lights are illuminated, do not
use excessive voltage or current, as this may result
in high current density through small holidays and
coating defects. This may cause minor corrosion if
the transmitter is left switched on for very long
periods.
LCD display
The 3 digit LCD displays the 4 Hz signal current in
amps that is being delivered onto the pipe.
Transmitter status indicated by the following LEDs:
GREEN
RED
RED
RED
Output OK
Over Temperature
Power Limit
Voltage Limit
Over Temperature
The transmitter will automatically shut down, and
can be switched on again when it has cooled.
Power Limit
External power supply not capable of supplying
the demanded power to support transmission at
the selected current. The transmitter has
reached its own power limit.
Switch to a lower current setting until the
GREEN Output OK LED comes on. Allow a few
seconds to settle between selections.
Page 5
Pipeline Current Mapper User Guide
Section 1
SIGNAL CONNECTION
Warning
Appropriate safety procedures must be
followed before removing pipeline CP
connection.
A.C. Input
50/60 Hz
300 W
DC Input
Warning
Before handling connection leads switch
transmitter OFF.
Battery 20-50 V
Rectified 100/120 Hz
15-35 V RMS
OUTPUT
BOTH LEADS
HAZARDOUS LIVE
White To Pipe
REFER TO
USER MANUAL
- Ensure the transmitter is turned off.
On
Off
Power
- Disconnect both pipe and anode cables from
the rectifier
AC Supply
Fuse 5A (F)
Green To Ground
- Connect the White signal output lead to the
pipe cable.
- Connect the Green signal output lead to a
suitable anode cable.
Note: If connections are reversed the current
direction arrow on the PCM Receiver will point
in the wrong direction.
Use an isolated low resistance ground such as
a sacrificial magnesium anode or ground bed.
When connecting to an electrical isolation joint
the other pipe section can often provide a
suitable ground connection.
Care must be taken when using an earth stake as
the resistance is often not low enough. The stake
must be positioned at least 45 M /150 feet from the
pipe to ensure an even current distribution.
Using portable transmitter to provide locate signal
It is sometimes helpful to use a portable transmitter
such as the RD433 HCTx2 to provide a better
location signal, if the ELF signal from the PCM
transmitter is insufficient.
- Very long distance from PCM transmitter.
- Locating distribution pipes from buildings where
isolation joints are fitted.
The portable transmitter can be connected to the
pipeline/network at a test point or isolation joint
using LF, Low Frequency (512/640 Hz).The PCM
transmitter should not be set to the LF frequency.
Both connection and induction may be used for 8kHz.
PCM 4Hz measurements can be taken if the PCM
transmitter is switched on.
Page 6
Pipeline Current Mapper User Guide
Section 1
Rectifier
PCM transmitter to pipeline connections using
Cathodic Protection Rectifier.
Mains
Supply
0
I
Single rectifier providing impressed CP current to
single pipeline.
A
V
+
Insulating
Joint
Rectifier is connected to anode and pipeline. Power
supply from 110/220V AC mains.
Anode
Rectifier
(Disconnected)
Mains
Supply
0
I
V
A
+
Disconnect both cables for pipeline and anode from
the rectifier terminals.
Failure to disconnect cables from rectifier will cause
unstable PCM signals, and may cause possible
damage to the PCM transmitter.
PCM Txer
Connect PCM transmitter to the cables, White lead
to pipeline cable, Green lead to anode cable. Use
the mains power supply for the transmitter.
Insulating
Joint
Anode
If Isolation Joints are not used PCM signal will be
present in both directions from the connection
point.
Single rectifier providing impressed CP current to
multiple pipelines.
As above, disconnect pipeline and anode cables
from rectifier.
Try to identify individual pipeline cables if they can
be separated at the rectifier, so that each pipeline
can be surveyed individually. This allows the
maximum range to be surveyed.
Connect the white PCM Transmitter lead to one of
the pipeline cables, and the green connection lead
to the Anode cable. Use the PCM receiver to help
identify the cables to the individual pipelines.
Mains
Supply
PCM Txer
V
A
If the PCM transmitter signal is applied to more
than one pipeline at a time, the signal will be
divided between them, so the maximum range will
be reduced.
Note; The pipe section which needs the most
cathodic protection current will also have the most
PCM current, so using the PCM receiver to
measure the current on all the pipe sections fed
from the rectifier will indicate the section with the
worst CP faults. This is a quick and easy guide to
coating quality.
Shared
Anode
Page 7
Pipeline Current Mapper User Guide
Section 1
Wire Link
or Shunt
PCM Transmitter to pipeline connections when
rectifier is not available.
Test Point
Test Points.
At some test points there are Isolation Joints with
cables to the surface.
Insulating
Joint
PCM Txer
(Remove Link
or Shunt)
Connect the PCM transmitter across the Isolation
Joint. White cable to the side of the pipeline that
you want to survey, Green cable to the other side
for ground.
Test Point
Note: Make sure that the pipes run in opposite
directions, If your connections are on pipes in the
same direction this may effect the survey results.
Insulating
Joint
Sacrificial Anodes.
Wire Link
or Shunt
Sacrificial anodes can be used as a grounding
point for the PCM transmitter, and this type of
connection can be used when there are no
Isolation Joints.
Test Point
Sacrificial
Anode
Disconnect the link wire from pipeline to sacrificial
anode in the test point.
Connect the White cable from the PCM Transmitter
to the pipeline connection, and the Green cable
from the PCM transmitter to the anode.
PCM Txer
(Remove Link
or Shunt)
Note. Some sacrificial anodes are connected
directly to the pipeline and not linked to test points.
These can be easily located as they cause large
PCM current loss.
Test Point
Note: If the Anode is heavily depleted it will be high
resistance, and the PCM transmitter signal lights
will indicate higher voltage.
Sacrificial
Anode
Insulating
Joint
Page 8
In this case it is advisable to use a series of long
ground stakes to provide low resistance grounding
for the PCM transmitter.
Pipeline Current Mapper User Guide
Section 1
PCM Txer
R < 20ohm
Insulating
Joint
Whatever grounding is used for the PCM
transmitter, it should have resistance less than 20
Ohms to ensure good current output from the
transmitter.
PCM Txer
Using another pipeline as a ground for the PCM
transmitter is an effective way of applying the
signal.
Note: Make sure that the other pipeline runs in a
different direction from the pipeline to be surveyed.
Pipe used as Ground
Pipe to be Surveyed
PCM Txer
Streams, drainage ditches, dykes, marshes, or any
mass of water can be used to ground the
transmitter.
Connect the Green lead to any large metal object
and submerge it in the water.
Note: Make sure that the pipeline is not running
through the same wet area.
Street Lamp
PCM Txer
Insulating
Joint
Other electrical fixtures can be used to ground the
PCM transmitter. However this will cause all
electrical cables in the area to carry the PCM
transmitter signal.
If these cables run near the pipeline, they may
affect the survey results.
Page 9
Pipeline Current Mapper User Guide
Section 1
PCM Transmitter Power Supply Connections.
Switch transmitter OFF before connecting to either:
• 230 V (110 V) AC supply
• 20-50 V DC source
• 15-35 V rectified source
230 V (110 V) AC Supply or Generator.
Warning
The equipment must be earthed through the plug.
The transmitter is rated at 300 W at 230 V AC 50
Hz (110 V AC 60 Hz)
Connect the mains power lead to the rectifier, or
use 230V (110V) generator that provides 300W or
more for the transmitter to operate at its maximum
output capacity
PCM Txer
Vehicle DC to AC Inverter
Power supply from a vehicle DC to AC inverter
which provides 300W or more at 230V (110V) from
12/24V DC, can also be used.
DC Supply
This allows the PCM Transmitter to be powered
from 2 X 12V or 1 X 24 V auto batteries, and the
output from the rectifier to the pipe and anode.
12v D.C
20-50 V DC and 15-35V rectified AC supply
The input voltage range is 20-50 V DC (14-35 V
rectified AC). The current drawn from the supply
will be a maximum of 5 A.
PCM Txer
Ensure that the rectifier is switched off.
Then connect the black lead to the negative supply
and the red lead to the positive supply, and switch
the receiver on.
Mains
Supply
0
I
V
A
+
PCM Txer
If the supply cannot provide 5 A, this will be
indicated by the power limit warning light.
Turn the six position Current Select switch to the
minimum position and switch on the PCM transmitter.
Progressively increase to obtain a current output
setting which does not overload the input.
Maximum output power is dependent upon voltage.
For example, on a particular pipe an input voltage
of 20 V may only allow a maximum output of
300 mA, whereas an input voltage of 50 V may
allow an output of 3 A.
The transmitter DC input is protected against
reverse polarity and over-voltage, and will not
operate unless connected correctly.
Page 10
Pipeline Current Mapper User Guide
Section 2
ELF LF 8k
PCM Receiver Functions
CPS
mA
Review
On/Off (1)
Press for On and Off. If no control key is pressed
for 5 minutes an audible beep warning is sounded.
The PCM will automatically shut off 30 seconds
after the warning. Pressing any of the operator
keys will reset the automatic power-off timer.
When the PCM is switched off, it automatically
saves the operating settings for the next start up.
1
ELF LF 8k
CPS
Review
On/Off Peak/Null
Depth
Current
Mode
To replace batteries unscrew the battery
compartment cover and insert 12 x LR6 (AA)
Alkaline or Ni-Cad batteries.
Note:
When installing batteries always observe the
correct battery polarity as indicated on battery
holder.
Shift
2
ELF LF 8k
Batteries (2)
Display provides 4-level continuous indication of
battery status. When battery replacement is
necessary, display shows flashing battery symbol
and ‘Lo bat’. The expected battery life with normal
use is 20 hours.
CPS
Shift Key (3)
Review
Use the Shift key to access 3 secondary functions
on the following keys:
Shift + Mode Key (4) Sound level.
3
ELF LF 8k
CPS
Hold down the Shift key and press the mode key
(#) to increase, decrease or silence the sound
output.
Sound level is displayed on speaker volume icon.
Warning
To avoid possible injury, always test the audio
level prior to using earphones.
Shift + Depth Key (5)
4
5
6
Saves data from Accessory
A Frame Fault Find when
this is connected.
Shift + Locate Current Key (6)
Datalog erase (only when
in the Datalog Review
Mode and the PCM
magfoot is fitted)).
Page 11
Pipeline Current Mapper User Guide
Section 2
ELF LF 8k
CPS
Review
Operating Frequency - Mode (7)
Press the Mode key (#) to move through the choice
of operating frequencies - modes available.
Mapping Modes
ELF Extra Low Frequency128 Hz/98 Hz
LF
Low Frequency 640 Hz/512 Hz
8 kHz Standard locate frequency from battery
powered Radiodetection transmitters.
Current Direction arrows are displayed only with
the PCM measurement, and not in locate modes,
unless the PCM is supplied with CD frequency.
7
ELF LF 8k
CPS
Review
Extra Locate Modes
Detects 50 Hz/60 Hz from power cables.
CPS
Detects 100 Hz/120 Hz ripple from CP
transformer rectifier.
Review Mode
Review
Allows information stored in the
data log to be accessed.
A Frame
Indicates when Fault Find
Accessory A Frame is connected.
8
ELF LF 8k
CPS
Review
Peak/Null (8)
Used to pinpoint target line. Press to select either Peak
or Null response. The pointer indicates selection.
Peak and null locate modes are shown in basic
location technique section 3.
Note:
Peak is the preferred method.
Left/Right Indication (9)
Indicates direction to pipe centre in Null mode.
This is useful for fast pipe tracing and checking for
interference.
9
ELF LF 8k
CPS
Review
Accessory Socket (10)
Peak/Null key can also be used to select accessories
that have been connected to the PCM via the plug on
the back panel. The icon indicates that the accessory
has been selected. This selection is automatic with
some types of accessory.
Note:
The PCM magnetometer foot will be disabled if an
accessory is connected.
Example accessories are:
10
Page 12
•
•
External antenna – Ask Radiodetection
A-Frame – See section 7, Page 30-32
Pipeline Current Mapper User Guide
Section 2
ELF LF 8k
CPS
Review
Touch Gain Control and Bargraph (11)
Turn gain paddle clockwise or counter clockwise to
increase or decrease PCM gain level. Actual PCM
dB gain level (0 to 100) is displayed next to gain
symbol top left of the LCD. The lower the gain
reading, the stronger the signal source.
Signal strength is shown on the bargraph.
The numerical display shows the bargraph
percentage.
If bargraph indicates full scale, the numerical
display indicates 99.9, touch the gain control once
counter clockwise to reduce to 60% of full scale.
11
ELF LF 8k
Note: Gain control paddle operates by small
angular touch turn, and NOT full rotation.
CPS
m
Review
Depth (12)
Once the target has been pinpointed press to
display the distance between the bottom of PCM
blade or attachment and the center of the pipe.
Depth measurements are displayed as follows:
Less than 1 Metre, depth displayed in cm.
Greater than 1 Metre, depth displayed in M.cm
Less than 3 feet - distance is displayed in inches.
Greater than 3 feet - distance is displayed in feet.
12
ELF LF 8k
Note: To obtain accurate depth measurement
the PCM must be directly over pipe with the
blade at right angles to the target.
CPS
mA
Review
Locate Current (13)
Press once to obtain current value (mA) of locate
signal when directly over pipe.
Note: This is the locate current, not the PCM
current.
13
Locate Current is available in the ELF, LF and
8kHz frequencies.
Locate current is also available in CPS mode,
except PCM model versions -CO and –CP.
Not available in 50/60 Hz Power modes.
Page 13
Pipeline Current Mapper User Guide
Section 2
Current Direction CD
Keypad of PCM version – CT uses extra key “CD”.
This uses 320/640 Hz CD signal from standard
Radiodetection transmitter types RD433 HCTx,
RD433 HCTX2 and PTX-3 providing CD output.
Current Direction arrows identify pipeline in locate
mode frequencies.
Locate the pipeline and touch CD key. CD arrows
on the display will point away from transmitter on
correct pipeline and towards the transmitter on the
wrong pipeline. Analogue Bargraph should be
100% scale or near 0% on the scale.
CD
To exit CD and return to normal locate mode, touch
the CD key.
Correct
Pipeline
Antenna Pos. A
A
B
Antenna Pos. B
Resetting CD.
Transmitter with CD
signal
If the Bargraph is only partially full, or the arrows
are unstable, reset CD.
Set the PCM on the ground in CD mode, facing
along the pipeline away from the transmitter (the
user’s back towards the transmitter). Touch and
hold Shift key and touch CD key. The display will
show “rSt”, and then “SEt”. The arrow will point
away from the transmitter and the Bargraph display
will be 100%.
To change the direction of the CD arrows, repeat
the Reset process above with the PCM facing the
transmitter direction.
Reset
CD
Page 14
Pipeline Current Mapper User Guide
Section 2
STEPS IN PIPELINE CURRENT MEASUREMENT
When a PCM reading is taken and saved, the datalogger
in the PCM magfoot will store log number, PCM current
in mA, and dB, current direction and depth.
PCM Magfoot Attachment
Two types of PCM Magfoot are available, and can
be identified when they are connected to the PCM
Receiver.
The standard Magfoot has 100 datalogs, and the
Magfoot2 has 399 datalogs.
When the standard Magfoot is connected the
receiver will beep and the top left corner of the
display will show “Pc”.
The central digital display will show “100”. Magfoot2
will also beep and show “Pc” on connection. The
central digital display will show “399”.
Pipeline Current Measurement (14)
See PCM receiver use section 3.
Note: This function is only available when the
magnetometer foot is attached to the PCM.
To achieve accurate results the receiver must be
kept as still as possible during this countdown.
Press once to initiate PCM current measurement.
The LCD will indicate the letters 'Pc' and in the top
left hand corner a 4 second countdown will
commence (i.e. 04-03-02-01-00).
ELF LF 8k
CPS
Review
On/Off
Peak/Null
Depth
Measurement Cycle
After 4 seconds the measurement cycle is complete.
The PCM current reading, direction arrow and next
available log number are displayed until the
acceptance or rejection buttons are pressed.
Current
+
+
+
Mode
Shift
14
ELF LF 8k
CPS
mA
Review
If 'rPt' (repeat) is displayed take the reading again.
Note: A flashing reading means reading is marginal
and should be taken again. This may be caused by
moving metal or nearby vehicles.
Note:
If the Magfoot2 with 399 datalogs is used, datalog
numbers from 1-99 will be shown in the top left
hand corner of the display. Datalog numbers from
100-199 will be indicated by the addition of a flag
by the Peak mode indicator. Datalog numbers from
200-299 will be indicated by 2 flags against the
Peak and Null mode indicators. Datalog numbers
from 300-399 will be shown by 3 flags against the
Peak, Null and Accessory indicators.
Page 15
Pipeline Current Mapper User Guide
Section 2
ELF LF 8k
CPS
Review
Saving or Rejecting PCM Current Reading (15)
Once a PCM current reading has been obtained a
log number (1-100 or 1–399) is shown in the top
left hand corner of the screen. This is the log
number that will be used if the reading is saved.
Press ü
+
+
+
Press X to reject - returns to locate mode.
Overwriting previously stored results.
Previously stored measurements can be
overwritten. Use the gain paddle to select the
required log number before pressing the
acceptance (ü) button.
15
ELF LF 8k
to accept - displays 'SAv' and returns to
locate mode.
CPS
Review
Review mode (7)
To review previously stored data, attach the
magnetometer foot to the PCM. Use Mode key (#)
7 to select review mode.
The LCD will show “Log”, then the most recent log
number will be displayed at the top left corner of
the LCD. The mA value of the PCM result and the
current direction arrows will be shown on the LCD.
7
Use the gain paddle to step backwards or forwards
through the stored data logs.
If the datalogger is empty “no LOg” will be shown.
Page 16
Pipeline Current Mapper User Guide
Section 2
Upload (16)
ELF LF 8k
Note: Radiodetection upload software is required
on the target PC. See PC Software section for
further details.
CPS
Review
With the magnetometer foot attached and the unit
in Review mode stored datalogs can be uploaded
to a PC. Use the full 9 pin D-type RS232 serial
cable provided with the PCM to connect the PCM
Receiver to the PC.
Press the Depth key and 'uLd' is displayed.
17
Data stored in the receiver is not erased until
confirmation is received from the PC. With Upload
software version 32 user can select if log data is
erased or retained. (See PC Software section11
page 41)
16
Upon successful completion the data is erased
from the PCM and “cLr” followed by "no Log" is
displayed.
ELF LF 8k
CPS
Review
Note: Using PCM32 Download Software the user
can choose to copy data to PC, and not to erase
stored data. Please refer to software section 11.
Erase All Stored Datalogs (6)
While in the Review mode the entire log can be
deleted. To prevent accidental erasure both the
Shift and Locate Current keys have to be pressed
simultaneously.
6
Displays 'cLr' while erasing and 'no LOg' when
empty.
Page 17
Pipeline Current Mapper User Guide
Section 3
PCM Receiver use, basic location technique
If the PCM transmitter is connected and switched
on, use ELF or LF frequency. If no transmitter is
connected use CPS frequency to locate 100/120
Hz from CP system.
Switch on the PCM receiver and use # key to select
operating frequency to locate the pipeline.
Pinpointing a Target Line
PEAK
PIPE LINE
Pinpointing defines the exact position and direction
of a pipeline after it has been traced and its position
is approximately known. Pinpointing is important
as the depth and current readings are affected by
misalignment error.
25
75
23
Peak Procedure
Adjust the PCM Receiver sensitivity to half scale. If
bargraph is full, touch the gain paddle
counterclockwise once, this will reduce sensitivity
and bargraph to 60%. It may be necessary to
adjust the gain during the procedure to keep the
bargraph on scale.
•
Hold the detection blade near the ground and
with the blade vertical.
•
Make traverses from side to side of the
pipeline and define the point of maximum
response.
•
Turn the Receiver around as if it is a pivot.
Stop at the maximum response and note
receiver direction. Reduce sensitivity if
necessary.
•
Continue to rotate receiver until display shows
zero response; the blade is now parallel with
the pipeline, and this shows the exact direction
of the pipeline. Rotate the receiver through 90
degrees. The response is now maximum.
•
Move the Receiver gently from side to side to
define the exact position of the peak response.
The detection blade will then be directly over
the pipeline and at right angles to it.
NULL
PIPE LINE
75
5
73
Mark the pipeline position.
Null Procedure
Follow the procedure for pinpointing with a peak
response and mark the position.
Switch to null response and follow the left/right
arrows. Note the position of the null response over
the target.
Page 18
Pipeline Current Mapper User Guide
Section 3
If the positions of the peak and the null pinpoints
correspond, it can be assumed that the pinpoint is
precise; If the positions do not correspond the
pinpoint is not precise. Note that both peak and
null pinpoints will show an error to the same side.
True position will be close to peak position.
NULL
PEAK
Accurate PCM results are only obtained when the
Peak and Null positions are within 15 cm/6 inches
of each other.
Effects of interference from parallel pipes and
valves on the Peak and Null positions.
PEAK
If Peak and Null locates are different by more than
15 cm/6 inches, assume that magnetic field is
distorted and take PCM readings at a different
position.
NULL
?
When searching for a service, 'Tie-ins' or 'L' then
perform a box sweep of the area. Walk to the side
of the pipe, turn the gain up until a 50% reading is
obtained.
When walking around the box remember to keep
the PCM receiver in position so that the blade is
never in line with the pipe.
Page 19
Pipeline Current Mapper User Guide
Section 3
Depth and Current measurements
When taking depth and current measurements, it is
always important to position the PCM directly
above the pipeline and at 900 to it.
Pipeline depth measurements can be taken in all of
the location frequencies except 50/60Hz Power
frequency.
Current measurements can be taken in the ELF, LF
and 8kHz location frequencies.
PCM versions - CR, - CS and - CT will also provide
current measurement in the CPS frequency.
When the PCM magnetometer foot is attached to
take PCM readings, make sure that the PCM
magfoot arrow is pointing along the direction of the
pipeline.
On a slope the attachment allows a certain degree
of adjustment to help maintain this position.
Try to flatten the ground to allow PCM magfoot to
be parallel to the pipeline.
Incorrect depth and current measurements will be
obtained if the receiver is held at this angle.
Do not take readings like this.
Note: Accurate PCM results rely on accurate
depth measurement. As magnetic field
distortion is likely at T’s, junctions, bends or
depth changes of the pipeline, try to avoid
taking PCM measurements above these points.
Page 20
Pipeline Current Mapper User Guide
Section 4
Current Mapping Theory
Current Measurements – Obtaining and
understanding results
mA
mA
mA
A current flowing on a buried conductive structure
produces a magnetic field directly proportional to
the magnitude of the applied current. By resolving
components of the magnetic field from above
surface the original current can be precisely
determined.
At the heart of the PCM system is the current
mapping near DC signal applied by the transmitter.
A pipeline's electrical characteristics of current
attenuation and distribution at this very low
frequency (4 Hz) signal are virtually the same as
they are for the Cathodic Protection current from
the rectifier.
Tx
mA
mA
Tx
The PCM receiver contains a precision, high
performance sensor known as a magnetometer
which remotely detects and measures very low
frequency magnetic fields. Advanced signal
processing technology provides push button
current measurement (and direction) of the near
DC (4 Hz) signal and a datalogging function
enables graph of current loss against distance to
be plotted after downloading to PC.
In all diagrams the arrows indicate the direction of
current flow to the transmitter. Their relative size
reflects the magnitude of the current.
mA
Tx
mA
The PCM transmitter applies a current to the
pipeline and this current reduces in strength as the
distance from the transmitter increases. The rate
of reduction depends on the condition of the pipe
coating, ground resistivity and pipe electrical
resistance.
The PCM receiver compensates for depth changes
during current measurements, and current readings
remain constant even when the depth of the
pipeline changes.
When a fault is encountered the current quickly
drops. A fault will result from coating damage,
contacts with other services, etc.
The loss of PCM current will be virtually
proportional to the amount of CP current being
used at the fault.
Note: Linear current loss may naturally occur along
the pipeline due to the age of the pipe and coating
conditions.
Page 21
Pipeline Current Mapper User Guide
Section 4
Using dBmA for Pipeline Current Mapping.
The PCM receiver can display current as amps/mA
or dBmA, and when results are saved to the
internal datalogger, both mA and dBmA are stored
in the memory.
To change the PCM display current from mA to
dBmA, please see method in section 10 page 37.
The AC signal current applied to a coated pipeline
in perfect condition will be lost by capacitance as
distance increases from the point where the signal
is applied. The PCM uses near DC signal (4Hz) for
current measurement, so capacitative losses are
minimal. The resulting graph drawn using A/mA will
have an exponential slope, because there is a
greater current loss rate close to the transmitter.
Converting the exponential mA result to logarithmic
dBmA will show the same graph as a straight line
slope.
Displaying the results using dBmA loss per
distance has the advantage that the resulting graph
is easier to analyse.
mA
Example; There was a coated pipeline which had
three defects of equal electrical resistance, one
near the beginning, the next in the middle and one
at the end. If the current loss graph is prepared
using mA on the vertical scale the second and third
faults would be shown as progressively smaller
steps in the graph. This is due to Ohms law, and
the loss of current at the previous fault.
Distance
Using dBmA as the vertical scale would result in
equal steps in the graph for equal size faults,
regardless of how much current was lost at the first
fault.
dBmA
The graphs below show three equal faults and the
effects on a graph showing mA and dBmA.
Distance
Page 22
Note that the graph showing mA at first glance
suggests that the faults are of diminishing
magnitude. The graph showing dBmA clearly
shows the magnitude of the faults are equal.
Therefore dBmA shows the ratio of the faults,
whereas mA alone may give rise to
misinterpretation of data due to the high current
loss near the transmitter and lower losses further
away.
Pipeline Current Mapper User Guide
Section 4
Graph 1:- The line marked "A" to "E" is the data
collected, whilst the line "1" to "4" is the interpreted
data.
Note that at position "A" the current falls and then
returns to almost its original level. This is probably
due to field distortion of the locate signal possibly
caused by another utility line above the pipeline
and should be ignored or further investigation
undertaken.
Steps "B" to "E" show definite steps (with some
field distortion at the point of fault) and loss of
signal. Note the recovered reading is less than the
signal before the trouble.
Graph 1
62
Same level
60
A
dBmA
58
B
Different levels
C
56
D
E
54
1
52
2
3
50
4
48
46
0
200
Distance
400
600
Further investigations using the PCM A-Frame
should now be undertaken so as to pinpoint the
exact position of the faults.
Page 23
Pipeline Current Mapper User Guide
Section 5
TAKING MEASUREMENTS – Pipelines and
Distribution systems – Basic Technique
mA
mA
'Tie-ins' and 'L'
The current will be split between the two lines.
i.e. 800 = 700 + 100
Tx
The pipeline with the greatest reading indicates
where the majority of current is flowing from and is
the direction to follow in order to locate the fault
(short or poor coating).
mA
mA
mA
The current will be split between the three lines.
mA
i.e. 800 = 600 + 150 + 50
The pipeline with the greatest reading indicates
where the majority of current is flowing from and is
the direction to follow in order to locate the fault
(short or poor coating).
Tx
mA
mA
mA
Loops
If the current arrow changes direction it could
indicate the pipe has changed location. Use the
PCM in Locate mode to relocate it.
Tx
mA
mA
Current flow within a Loop system
mA
A
Tx
If all distances and coatings are equal, and the rate
of loss is constant, the current measured at Point A
will be zero.
mA
B
A
Tx
Page 24
In practice, with pipes of different ages and coating
the points reading zero (0) could be anywhere.
The respective current readings will indicate the
direction to follow.
Pipeline Current Mapper User Guide
Section 5
Taking Measurements – Distribution Systems.
Below are some typical results which can be found from using the PCM for CP system diagnosis on a
distribution system.
Good local knowledge, and a map of the pipe network is essential to determine suitable positions to
connect the PCM transmitter and where to take readings. It is worthwhile taking measurements over the
complete site before concentrating on any particular area.
The following diagram is a typical street involving 'Tie-ins' and an 'L'. The readings from the PCM and
distances to prevent interference have been included. By working around the map a short was quickly
and easily detected.
In this example measurements were taken at key areas to determine direction of major current flow.
Read 2 indicated initial direction to follow.
Read 5 indicated which section on tie-in to follow.
Read 9 indicated that the short had been passed and was between Read 9 and Read 8.
Short found by dividing the distance between a good and bad read until located.
Page 25
Pipeline Current Mapper User Guide
Section 5
Pipelines and Pipeline defects
Interpretation of Readings and Graphs
See Upload section 11, pages 39-43.
See Drawing Graphs section 12, pages 44-63.
1A
900
800
1A
750
500
1A
900
1A
800
900
500
Pipe coating in good condition is shown as very
little loss of current.
700
Pipe coating in poor condition is shown as a rapid
loss of in current.
250
300 200
800
250
Mixture of good and poor coating which is shown
as greater current loss over the section of pipe with
poor coating.
The effect of a short or contact with another service
is a sudden current loss.
The effect of a poorly coated steel shield in contact
with the pipeline is to show reduced current in one
measurement section.
1A 950 900
750 700 650
This effect is either a section of perfect coating or
ground conditions that are shielding the signal – dry
or rocky ground.
1A 950 900 900 900 850 700
Page 26
Pipeline Current Mapper User Guide
Section 6
Applications – Parallel Pipes
B
New distribution pipe with the old pipe running
parallel and about 30 cm/10 inches away.
mA
mA
mA
A
A 1 Amp signal was applied
mA
mA
To make the explanation easier the pipe has been
divided into section A & B.
Tx
Section A
Good peak and null locate, with peak
and null locates in the same position.
Results indicate a good coating on the
pipe (600 and 550 mA).
Section B
Poor peak and null locate shifted to
one side from the previous alignment.
Readings start to decrease rapidly.
A
In this case the old pipe had been shorted to the
new pipe. The poor coating on the old pipe
provided a good path for the PCM transmitter
current.
This is indicated by the locate being offset to one
side and the rapid decrease in current reading.
When plotted the graph illustrated this effect with
the bend indicating the position of the short/contact.
A
mA
mA
mA
B
mA
Tx
A
To verify the fault location the transmitter was
repositioned to the other end of the pipeline and the
following results obtained.
mA
mA
C
Section A
Good Peak and Null locate, reading
decreasing at a steady rate.
Section B
Poor peak and Null locate with a sharp
fall in current reading.
Section C
Short/Contact.
The easiest path for the current to flow is down the
old discarded pipe. As this is in the opposite
direction to the flow on the new pipe it has a
cancellation effect which accounts for the sharp
drop in reading.
The short would be at the point where the current
drops close to zero.
The graph is used to illustrate this effect.
Page 27
Pipeline Current Mapper User Guide
Section 6
Typical application where a short piece of
parallel pipeline interfered with the result.
mA
C
mA
For ease of explanation the pipeline has been
divided into three parts A, B & C.
mA
B
In this situation a 1 Amp signal was applied to the
new pipeline and the direction of maximum current
flow followed.
mA
mA
A
mA
Section A
Good Peak and Null locate and a
steady rate of decrease that indicated
a good coating.
Section B
Poor Peak and Null locate (outside
15cm/6 in. requirement) and a
significant drop in current reading.
Section C
Good Peak and Null locate with a rise
in current and then a steady rate of
decrease.
Tx
A
Another service was found to be close to the new
pipeline in Section B and had a small amount of
current flowing in the opposite direction. This had a
cancellation effect, which caused the current on the
new pipeline to fall.
When plotted the graph illustrated this effect.
Survey on new pipeline where the current on
one side of the transmitter flowed away from
the transmitter.
mA
The PCM transmitter was connected and a 1 Amp
current selected.
mA
mA
Tx
mA
mA
A reading of 900 mA was detected on one side with
the arrows pointing towards the transmitter.
The other side gave a poor Peak and Null with the
current pointing away from the transmitter.
Another reading was taken further away from the
transmitter with the same result.
It was found that another service was shorted to
the pipeline as shown and at some stage ran
parallel to the new pipeline. The current on the new
pipeline had no effect as it was so small compared
to this other service.
Page 28
Pipeline Current Mapper User Guide
Section 6
Locating bonding cables between new and old pipelines by moving PCM Transmitter to both ends
of a new transmission pipeline that had an older discarded pipeline running parallel and about 3 M
/10' away.
mA
mA
mA
mA
mA
Tx
The PCM Tx was connected at a rectifier and a current measurement of 800 mA confirmed the
direction to follow.
At a distance of about 3 Km/2 miles from the transmitter, two readings were obtained, 300mA on the new
pipeline and 100mA on the old pipeline. The PCM current arrows pointed towards the PCM Tx indicating
that somewhere within the 3Km/2 miles the new pipeline had been bonded to the old pipeline.
mA
mA
Tx
mA
mA
mA
The Tx was then connected to the other end of the new pipeline and measurements taken at exactly the
same positions. A reading of 800 mA was detected on the new pipe, but there was no reading on the old
pipeline.
As a series of readings were taken on both pipelines closer to the point of bonding, current appeared on both
pipelines and with the arrows in opposite direction. This indicated that the bonding point was further ahead.
The point of bonding was located, and a measurement of 500 mA, concluded that the other faults existed
closer to the rectifier.
Page 29
Pipeline Current Mapper User Guide
Section 7
Using the Accessory A Frame with the PCM.
Overview.
The accessory A Frame is used with the PCM
receiver to precisely pinpoint coating defects and
isolation faults.
-
The A Frame spikes need to make good
electrical contact with the ground, preferably
with damp conductive earth.
-
The PCM receiver display indicates direction
to the fault, using the CD direction arrows, and
this makes fault position easy to locate.
-
The PCM also displays the dB microvolts
reading across the A Frame spikes, and this
allows a comparison to be made between
different faults to determine the most severe.
This numeric value can be stored in the PCM's
second datalogging facility, recalled, and
uploaded later to a PC.
Operation.
After obtaining PCM current loss results, decide
which sections of the pipeline require Fault Find
survey.
The PCM transmitter is connected and switched
on, using frequencies of ELF with 4 and 8 Hz, or LF
with 4 and 8 Hz.
PCM Fault Find readings can be taken with or
without the PCM magnetometer foot connected to
the PCM receiver.
Note: With the Accessory A Frame plugged in, it is
not possible to take PCM Current readings.
-
Plug the 3 pin connection lead into the A
Frame, and the multipin connector into the
accessory socket on the rear of the PCM Rx.
The PCM Rx will beep, switch to the accessory
socket position, and indicate a flag against the
A Frame position on the PCM LCD label. The
PCM LCD shows "FF".
Use the "peak/null/accessory" key 8 to switch
between locate and faultfinding.
-
Locate the pipeline. Position the A frame
above and in line with the pipeline, and the
spike marked with Green tag away from the
transmitter connection point, Red spike tag
towards transmitter.
8
Green
Red
Distant Faultno indication
"No CD" displayed
Line fault
ahead
Line fault
behind
PCM
Tx
Fault on the line
Page 30
Pipeline Current Mapper User Guide
Section 7
ELF LF 8k
-
Push the A Frame spikes into the ground to
take a reading. It will then automatically adjust
its signal level and calculate the current
direction and the dB microvolt reading. Note
that the gain numbers will flash during
calculations. No user adjustment is necessary.
-
Display arrows indicate PCM Transmitter
current direction through the ground, for user
convenience this is arranged to display
direction to fault. If no arrows are displayed
there is unlikely to be a fault close by, and
there is too little current in the ground to
activate the fault direction arrows, or by
chance the A Frame is directly over a fault.
CPS
mA
Review
A
Make sure that there is good ground contact.
Pouring a small amount of Water on a road
surface will improve results.
The display also indicates the dB microvolt reading.
If reading is around 30 or less, there is unlikely to
be a fault nearby.
-
Move further along the pipeline and make
ground contact with the A Frame spikes again.
When a new position gives CD arrow
indication forwards, and the next gives CD
arrow indication backwards, the operator has
walked over a fault. A numerical dB microvolt
reading of around 60 can be expected.
-
Move backwards along the pipeline taking
tests at 1 Metre intervals. See that the
numerical dB microvolt reading value rises,
briefly falls, and rises again, before gradually
reducing. The CD arrows will also change
direction either side of the fault point.
-
Retest by taking small movements forwards or
backwards until the position is found where
the arrows just change direction, and the dB
microvolt reading is lowest. This will confirm
the fault is directly under the centre of the A
Frame.
Turn the A Frame through 90 degrees so that it is
now across the pipeline.
Repeat previous stage. The fault point is now
exactly under the centre of the A Frame.
Mark this point with a wooden stake or paint.
Continue along the pipeline section until all faults
have been found and marked.
Page 31
Pipeline Current Mapper User Guide
Section 7
Comparing fault severity.
To determine the severity of the fault, and compare
different faults on the pipeline to decide repair
priorities, take the dB microvolt readings with the A
Frame at 90 degrees to the pipeline.
Place one of the A Frame's spikes directly above
the pipeline, and the other away from the pipeline.
Start approximately 1 Metre from the fault position,
testing at 25cm (or smaller) intervals. Note the
highest dB microvolt reading, or save it in the
datalogger and note log number.
At any time during the survey the user can switch
to locating the pipeline using the
"Peak/null/accessory" key 8, or pulling out the
connection plug from the accessory socket on the
PCM Rx, and taking current gradient readings.
ELF LF 8k
SAV
CPS
Review
A
15
Saving PCM FF Readings (15)
You may use the datalogging facility to record up to
190 A Frame results. Take readings at regular
intervals, or write down the distance between
measurements and the log number. To save
readings keep the A Frame in ground contact and
push "Shift" key, and touch "Depth" key.
The Display will show “Sav”, and the log number in
the top left corner of the LCD.
Reviewing PCM FF data.
Remove the PCM Magnetometer foot if it is fitted.
Press Peak/Null key (8) to change to peak, and
press (#) mode key (7) to select Review mode.
The LCD will show “Log”, then the most recent log
number will be displayed at the top left corner of
the LCD. The dB microvolt value of the PCM FF
result and the direction of the faultfind arrows will
be shown on the LCD.
Data Upload – PCM FF Data.
When the survey is completed the stored data can
be uploaded to PC/laptop, but the magnetometer
foot must be detached from the PCM receiver to
access the stored Fault Find data. Upload
procedure is the same as for the 4 Hz current
gradient readings using the PCM data upload utility
program, and the file name is FFData.TXT
Please see software section 11, page 40 for more
information.
Page 32
Pipeline Current Mapper User Guide
Section 8
Avoiding sources of error to achieve consistent results.
Always use the standard techniques to ensure measurements are valid. Confirm that peak and null
signals coincide. If in doubt check for field distortion by taking a depth reading and then raise the receiver
a known height (say 0.5M) and confirm the depth measurement increases by the corresponding amount.
As the PCM uses such a low frequency the sources of error are much reduced. However there are still
certain circumstances that will create errors.
Identifying Interference
•
Poor Peak and Null locate, outside 15 cm/6 inch maximum.
Errors due to locate (ELF/LF) signal distortion can result in errors in 4Hz current measurement. This is
because the 4Hz current measurement process relies on depth as measured by the ELF or LF signal.
•
•
•
Unreasonable depth measurement.
Reading on LCD bargraph not stable.
LCD displays “Err” numbers 11 or 29.
Reason for Interference
•
•
Parallel pipes.
Too close to transmitter. Tie-ins, T-junctions and L bends.
Measurements at Ts, bends, abrupt changes in depth etc. should be avoided, as there will always be a
degree of field distortion at these points.
•
Taking readings too close to large parked vehicles, moving vehicles, boots or shoes with steel toe
caps or large metal structures.
•
Taking readings near to PCM transmitter and anode cables or anode groundbed.
Measurements taken near the transmitter anode bed or earth stake can be misleading. This is because all
the signal current passes through the earth stake or anode bed. The signal ground currents close to the
transmitter are therefore significant and opposite to the pipe current.
The effect is that for the first 30 - 50 meters or so (depending on ground conditions) the measured current
may increase. In fact the current on the pipe is probably at a constant level.
If it is necessary to survey this section of pipe it will be necessary to apply the transmitter at a different
location and work back to this point.
Locate current
•
In ELF and with a locate reading current below 15 mA the PCM readings will not be accurate.
•
In LF and with a locate reading current below 2 mA the PCM reading will not be accurate.
PCM Current.
•
PCM current results depend on locate current. If the PCM current has fallen below 100mA on a
long survey, it is likely that the locate current is also low. It is possible to obtain results by using a
portable transmitter nearby to provide a locate signal. Use a different frequency from the PCM
transmitter locate frequency. Please see section 1, page 6.
Direction Arrows
•
The direction arrow indicates current flow to the transmitter.
•
A direction arrow will not be displayed if the transmitter is set to the ELF(4Hz + 128Hz) mode.
Please see PCM transmitter section 1.
A direction arrow will not be displayed if the PCM receiver is unsure of the current direction.
However the current reading will still be accurate.
•
Page 33
Pipeline Current Mapper User Guide
Section 8
Interpretation of PCM results.
Introduction
The principle of the PCM is that the frequency used is so low (4Hz) that the effects of induced and
capacitance coupling to other lines are reduced to almost zero. Also natural decay of the signal due to
these effects is also reduced to almost zero.
The losses are due completely to resistive losses i.e. coating defects or contact to other structures.
Interpreting results from a survey:-
A
mA
B
Distance
TX
C
fault
pipe
Fault current opposite to pipe current
Fault current same direction as pipe current
Taking a classical situation as above, graph "A" shows the ideal response which is a loss of signal current
and a step response, but excludes any effects from fault currents in the ground.
In practice the results obtained require some interpretation because sometimes the magnetic field
detected from the pipe may be affected by other signal paths in the ground, including around the position
of coating defects.
Graph "B" shows the theoretical effects of the fault current in the ground. Note that the local fault current
enters the pipe from both directions and this distorts the magnetic field around the pipeline close to the
fault. A short distance from the fault the ground currents subtract from the pipe current, which is measured
as current reduction. A short distance after the fault they add to the pipe current, which is measured as
current increase. At some distance from the fault, current settles to a steady state.
- If this local effect is observed, it is useful for detecting defects.
Graph "C" shows what would be expected in the real situation if PCM currents were plotted over a section
of pipe with a coating defect.
Depending on the fault characteristics, the effect of the magnetic field distortion will spread over a
distance of perhaps 2 to 10 meters either side of the fault, and the effect will vary depending on the type
and severity of the fault.
Page 34
Pipeline Current Mapper User Guide
Section 8
A fault caused by the surveyed pipeline being in contact with another structure, such as another pipe or
cable running across the pipeline, will show some distortion of the magnetic field directly over the contact,
but is unlikely to show the rise in current after the fault.
These effects are more noticeable when the survey is performed over a short distance either side of a
fault.
This highlights the need to perform surveys over a complete section before attempting a more detailed
survey of suspect areas.
Page 35
Pipeline Current Mapper User Guide
Section 9
Error Codes
ELF LF 8k
The PCM will display ‘Err’ when it is operated in
unfavourable electromagnetic conditions or there is an
equipment fault.
CPS
Review
Many of the errors can be overcome by alternative
signal application or measurement positions.
On/Off Peak/Null
Mode
Depth
Current
Shift
Error Codes are indicated by the words 'Err', with the
specific code being displayed in the top left hand
corner.
Some error codes will require the PCM receiver to be
returned to your Radiodetection or your Distributor for
examination.
Operational Errors
Error #9 - Indicates that the signal is too small or too
large to measure depth/current. Check Transmitter
settings.
Error #11 - Indicates a strong overhead signal.
Error #21 - Indicates that depth to target line is beyond
depth measurement range.
Error #26 - PCM ERROR, Problem communicating
with PCM attachment. Check attachment is properly
connected and repeat operation.
Error #27 - PCM LOG ERROR, PCM attachment
datalog has been corrupted. You may ignore this in
order to salvage the data in the log. An upload or log
erase will clear this error.
Error #28 - NOT ENOUGH MEM, software error. Turn
the locator off then on to reset software.
Error #29 - AGC FAIL, locator unable to automatically
set gain for depth or current measurement.
Either insufficient ELF or LF signal, or there is
interference. Try measurement again.
Equipment Errors
Errors #12 to 19 inclusive and 23, 24, 45 require the
unit to be returned to Radiodetection for rectification.
Error #26 may require return of unit to Radiodetection.
Page 36
Pipeline Current Mapper User Guide
Section 10
Changing LCD Display
Options for PCM Receiver
The PCM receiver display configuration may be
changed by the user, but incorrect key presses may
cause PCM to “lock”, so these instructions must be
followed EXACTLY.
ELF LF 8k
Options available:
CPS
mA
Review
A
On/Off Peak/Null
Depth
Current
+
+
+
Mode
1. Language.
The language on the display can be changed
between “Gb” English, “Fr” French, “Ger”
German, “nL” Dutch, “ItL” Italian. Choosing
different language change translations for
Depth, Current, Error, Log review etc.
Shift
2. Depth Calculation.
Depth can be changed between Metric (M/cm)
and Imperial (Feet and Inches).
Additionally this can be chosen at the point of
downloading to PC on the Download software
main control panel.
3. Current Measurement and PCM 4 Hz Current
Measurement.
Current Measurement can be changed between
A/mA and dBmA.
Data displayed on the LCD will be shown either
in mA or dBmA depending on this selection.
Note: It is generally easier to discover pipeline faults
using mA on the display, as there is a larger numerical
change in the review mode using mA instead of dBmA.
This selection is best chosen by user experience.
Data stored in the PCM datalogger will always be in
both A/mA and dBmA, and either of these can be
selected from the spreadsheet after download.
The datastream output from the RS232 socket on
PCM’s with software up to 5.02 for use by an
external datalogger or datalogging GPS system will
include current mA or dBmA dependent on this
selection. PCM’s with software version 5.03 include
both mA and dBmA independently of this selection.
Please see Section 13 of this manual.
4. Power frequency filter selection.
The software contains different digital filter settings
for either 50 Hz or 60 Hz power environments.
Note: The CPS frequency 100 Hz or 120 Hz and the LF
and ELF frequency remain at their original factory settings.
5. 50/60 Hz Power mode activate.
Activates (on) or deactivates (off) the Power mode.
Page 37
Pipeline Current Mapper User Guide
Section 10
Changing the PCM Display.
There are 2 “invisible” operating keys (?) located
between the mode (# 7) key and the shift key 3,
these are used to change selection, and the mode
(# 7) key is used as “Enter” key.
If no change is needed press the mode (# 7) key to
enter and move to the next stage. When all stages
have been completed the PCM will return to its last
used settings, like a normal start up.
To start the process, follow the instructions below.
Start with the PCM receiver switched off and hold
down PCM (ü) key (14), push On key, and
continue to hold down PCM (ü) (14) until display
shows language as in 1. Above.
1. To change the language:
Use the 2 “invisible” (?) keys to change and (#
7) to enter.
2. Display will show a small cm for Metric or ‘ “
for Imperial. Use the invisible keys to change
and (# 7) to enter.
3. Display will show a small mA for milliamps or
dB for decibels. Use invisible keys to change
and (# 7) to enter.
4. Display will show 50 or 60 for power frequency.
Use invisible keys to change and (#) to enter.
5. Display will show “on” or “off”. On means that
the 50/60 Hz Power mode is activated, off
means that it is deactivated. Use the invisible
keys to change and (# 7) to enter.
Display will now return to it’s normal operation
with any new settings functioning.
To alter any function, switch off the receiver and
repeat the process again.
Page 38
Pipeline Current Mapper User Guide
Section 11
PCM Upload Software Instructions- for software
up to version 1.01
The PCM upload software supplied by Radiodetection
needs to be installed onto a PC/Laptop.
If the PC forms part of a network then the IT department
needs to perform the installation.
Software Installation Procedure
From the window screen
open
- File Manager/Windows Explorer
select drive - A
select
- install.exe and press return.
A test will now be performed to verify that enough
disk space is available.
select - OK and press return.
enter - required file destination and
press return.
The software will automatically be loaded onto the
PC/Laptop. When complete a new window group
containing the following icons 'UPLOAD' and 'SURVEY
DATA' will appear.
Data Upload - PCM Current data.
Fit the PCM magfoot to the PCM receiver, switch on,
and select Review Mode.
Connect a standard RS232 pin-to-pin serial lead
between the PCM and PC/Laptop.
Open the windows PCM work group
Select - 'Upload ' icon and press return.
The Upload screen will appear. Before Uploading make
the selections for port, measurement units and
Delimiter.
Select Com ports from COM1 or COM2
Select Measurement units (inches or centimetres).
Note that whichever is chosen now will appear on
download data independently of the PCM receiver
settings.
Select Delimiter from comma, space, colon, semicolon, Tab.
Comma is normally used with Lotus 123 spreadsheet,
and Tab is normally used with Microsoft Excel
Spreadsheet.
Select-
Upload and press return.
On the PCM receiver- press the upload (Depth) key (16).
Upon a successful completion the data is erased from
the PCM and a 'no log' message is displayed on the
PCM receiver LCD
The data is stored under the name MAPDATA.txt
This allows the information to be imported into a
spreadsheet.
Page 39
Pipeline Current Mapper User Guide
Section 11
Survey Data
This allows the operator to quickly check the data
without entering the spreadsheet. To view the
survey data, click on the PCM survey data icon.
Spreadsheet
After importing the information into a spreadsheet it
is essential to enter the measurement distances
and save the spreadsheet under a new name.
Data Upload PCM FF Data
Do not connect the PCM magnetometer foot.
Switch on the PCM receiver and select Review
mode. The PCM LCD will display Review and the A
Frame indicator flags.
Connect a standard RS232 pin-to-pin serial lead
between the PCM and PC/Laptop, and Upload as
PCM Survey data.
The file will be named FFDATA.txt.
PCM faultfind data
The PCM Faultfind Data can be viewed by opening
the PCM FF Datalog icon.
Page 40
Pipeline Current Mapper User Guide
Section 11
Software Installation Procedure – using PCM
Data Utility Upload version V.2.1 (Pcm32)
From the window screen
Open
Select drive
Select
- Windows Explorer
-A
- install.exe and press return.
A test will now be performed to verify that enough
disk space is available.
Select - OK and press return.
Enter -
required file destination and
press return.
The software will automatically be loaded onto the
PC/Laptop. When complete a new window group
containing the following icons 'PCM32 UPLOAD'
and 'PCM32 Datalog' and ‘PCM32 FF Datalog’ will
appear.
Viewing PCM Survey Data
The download data can be viewed by opening PCM
32 Datalog icon.
Viewing PCM faultfind Data
The PCM Faultfind Data can be viewed by opening
the PCM 32 FF Datalog icon.
Data Upload Version 2.1
– Uploading PCM FF data.
Do not connect the PCM magnetometer foot.
Switch on the PCM receiver and select Review
mode. The PCM LCD will display Review and the A
Frame indicator flags.
DATAREPORT Software.
In addition to the PCM data upload utility program,
there is the alternative DATAREPORT software for
storing and archiving PCM data.
The Dongle for operating the software is available
from Radiodetection (part number 52/PM2093PC)
and the latest software can be downloaded from
Intermedia's website. http://www.imedia.fr.
Please contact Radiodetection for more information
Page 41
Pipeline Current Mapper User Guide
Section 11
PCM Upload Version 2.1
- Uploading PCM Current data.
Fit the PCM magfoot to the PCM receiver, switch on, and select Review Mode.
Connect the standard RS232 pip-to-pin serial lead between the PCM and PC/Laptop.
To Start PCM32 Upload, click on the Icon.
Once Started the PCM32 main control panel will be
displayed. This panel allows full control of PCM32
setup and options.
Set up the software selection when using it for the first
time. Set up options will be saved for future use.
Select the required Com port to be used for connecting
the PCM receiver.
The PCM receiver records its data in a text delimited file. During upload
you can select the type of delimiter used by the spreadsheet application
that will display the data. For example Lotus123 uses ‘Comma’ and
Microsoft Excel prefers ‘Space or Tab’.
During data upload the Depth measurement units can be set to either Metric
or Imperial units.
Page 42
Pipeline Current Mapper User Guide
Section 11
With ‘Copy Last Upload’ checked the uploaded data will be
automatically copied to the PC’s Clipboard for easy pasting into a
spreadsheet. Note this ONLY works with MS Excel.
With ‘Add Loss formula’ checked an extra column of data
will be included during upload. PCM32 will automatically
calculate the dB loss per kilometer, when the distance
between PCM readings is entered in the Excel spreadsheet.
With ‘Erase log on PCM’ checked the PCM boot will be
erased after a successful upload, with the check removed
the data will be copied from the boot to the PC and
remain on the boot for future removal.
To delete the datalogger readings stored in the PCM foot,
select Review mode and use the Shift + Current keys on
the PCM receiver.
Once PCM32 is setup with the required
options you are ready to upload the data from
your PCM receiver. Using a standard
RS232C lead connect the selected Comm
port of your computer to the RS232 socket on
the back of your PCM receiver.
Switch on the PCM and using the mode key
select the ‘Review’ mode.
Press the Upload
button on PCM32, the
status window will
briefly show Opening
port then Waiting for
PCM (see pics)
Once PCM32 is waiting for the PCM, press the
Depth key (16) on the PCM receiver, this will
initiate the Upload, a brief message will indicate
that data is being uploaded. The data will be
transferred to the PC Clipboard
If for some reason the upload needs to be
stopped, press the abort button. For example,
poor comms between PCM32 and the PCM
receiver, or an incorrect setup.
Once the Upload is complete PCM32 can be
closed down and the data is ready for display.
Viewing Survey Data
Uploaded data can be viewed by opening the
PCM32 Datalog icon, or the data can be
opened in the Spreadsheet.
Page 43
Pipeline Current Mapper User Guide
Section 12
Preparing the PCM graph using Microsoft Excel
Three methods to present the PCM results are shown in the following pages of this section.
Pages 45-49 explain basic 2 axis graph of Distance against Current (X) & (Y).
Pages 50-58 explain method to include 2 (Y) axes, using Distance against Current dBmA and Depth.
Pages 59-67 explain Distance against Current dBmA and Rate of Current loss MilleBels per Metre (mB/M)
Spreadsheet – PCM current data
Open MS Excel, File, new.
Select Edit from toolbar, and Paste from pull
down menu (or use Crtl +V)
This will open the clipboard contents in MS
Excel and your data will appear in columns
A-F. Column G will also be used if “Add
LOSS Formula “box was ticked.
Save and name your file now if you did not
previously
1. Enter the distance information from your
survey notes in column B. If you took
measurements at regular distances, use
the summation formula.
Page 44
Pipeline Current Mapper User Guide
Section 12
2. Highlight Distance column B
3. Hold down CTRL and highlight 4 Hz dBmA column D.
4. Click on Chart Wizard from the Toolbar
5. From chart type select “XY Scatter”.
6. Choose a graph form.
7. Press and hold bar to view sample and click on
“Next”
Page 45
Pipeline Current Mapper User Guide
Section 12
8. Move to step 2 on Chart Wizard. This shows a
graph picture and the data ranges; different
data ranges can be selected at this stage if a small
part of the total data is needed.
9. Move to step 3 of Chart Wizard
and insert Chart Title, Values of X
Axis and Title (Distance Metres)
and Y Axis (Current dBmA).
10. Choose if the data chart and
graph are to be placed on the
same page or the graph is to
be placed on a new sheet.
(New sheet is preferable).
11. Click on “Finish” and the
graph will appear.
Page 46
Pipeline Current Mapper User Guide
Section 12
•
12. Make some changes and improvements
by clicking on current dBmA numbers
and changing the min and max values.
Format axis menu appears. Click on
each max and min and use a
appropriate value to make graph of
current loss easier to understand.
Page 47
Pipeline Current Mapper User Guide
Section 12
13. Set up “X and Y Axis” tick marks to
make graph more readable.
14. Change fill colour according to
preference.
Page 48
Pipeline Current Mapper User Guide
Section 12
Using MS Excel to prepare a graph which used 2 (Y) Axes, such as Distance against Current in
dBmA and Depth, or Distance against dBmA and Current Loss Rate in milliBels/metre.
1. Do NOT highlight any
columns – this is done at a
later stage – instead click on
any worksheet box outside
the data columns.
2. Click on Chart Wizard
Page 49
Pipeline Current Mapper User Guide
Section 12
3. Click on Custom Types
from the menu tab, scroll
down the chart types and
click on “lines on 2 axes”
for dBmA and Depth, or
“line - column on 2 axes”
for dBmA and Current
Loss Rate. Click on
“Next”.
4. This shows Chart Wizard steps 2 of 4.
Do not enter anything in the Data range
box.
5
Page 50
Click on “Series” in Menu Tabs.
Pipeline Current Mapper User Guide
Section 12
6. Click on “Add” – Series box will display
“Series 1” and Blank Graph will appear.
7. “Series 1” will be replaced when you click
in the Name: box and type in “Current
dBmA”.
8. In the “Category (X) axis labels”, Click on
the small red arrow: the box will change
into a long rectangular box Chart Wizard –
step 2 of 4 – Chart so…”
9. On the worksheet, highlight/click and
drag Distance column B – This data
will appear in this box.
10. Click on the small red icon in
this box, and the data will
reappear in the “category (X)
axis labels”, and the graph
will have a dot on it.
11.Click on the small red arrow
icon in “Values” box. This
shows ={1}
Page 51
Pipeline Current Mapper User Guide
Section 12
12. The long rectangular box shows “Source Data – Values”.
13. Highlight/Click and drag the dBmA Current
column D. These values will appear in the
box. Click on the small red icon.
14. The graph now shows
Distance on (X) and dBma
on (Y) axis.
15. Click on “Add” – Series box
now shows “Series 2”. Values
box shows “={1}”. Type
“Depth CM” in the Name Box.
16. Click on the small red icon in
the Values box.
Page 52
Pipeline Current Mapper User Guide
Section 12
17. On the worksheet highlight/click and drag Depth Column F. The data will appear in the box.
Click on the small red icon.
18. Now the values are shown
and the graph now has 2
(Y) axes.
19. Click on the small red icon
in the “secondary
category (X) axis labels”
box. (Click on the small
red icon.) On the
worksheet highlight then
click and drag distance
column B, this data will
appear in the box (as step
9). Click on the small red
icon and the data will
appear in “Secondary
category (x) labels box.
20. Click on “Next” – Chart Wizard step 3 of 4 – Chart options – This stage is for Titles,
Axes, Grid lines, legends etc.
Page 53
Pipeline Current Mapper User Guide
Section 12
Type these in now.
The Title will appear at the top
of the graph example.
In ‘Category (X) Axis’ type in
“Distance Metres”.
In ‘Value (Y) Axis’ type in
“Current dBmA”.
In ‘Second Value (Y) Axis’ type
in “Depth cm”.
These will appear on the graph
example.
Click on “Next”.
21. Chart Wizard- Step 4 of 4
The chart can be placed as a
new Sheet (which is preferable),
or as an object in the worksheet.
Click on the ‘As new sheet’
option button. Then click on
Finish-the graph will
appear.
Page 54
Pipeline Current Mapper User Guide
Section 12
22. The next stage is to improve the appearance of the graph, and make it easier to interpret. The dBmA
current does not need full scale from zero to maximum, at present the depth also starts at the same
zero axis, with the greatest depth at the top of the chart. All of these can be changed.
Page 55
Pipeline Current Mapper User Guide
Section 12
25. The final stage is
to change the colours
and fill colours, as in
previous instructions
23. Double Click on the numbers beside the current dBmA (Value/Y1) axis. This shows the
‘Format Axis’ box. From the menu tabs, click on ‘Scale’. Change the maximum and
minimum values and the major and minor units – this will allow the curve/slope of the
graph of the current loss to be steeper and makes the faulty sections easier to observe.
Click on ‘Ok’ when finished.
24. Double click on the numbers beside the Depth (Secondary Value/Y2) axis. Change the maximum,
Minimum and major and minor unit values as necessary. To set the zero depth at the top of the graph
and greatest depth at the lowest part of the graph (to give a representation of the pipeline’s depth
position), click in the ‘Values in reverse order’ box.
Page 56
Pipeline Current Mapper User Guide
Section 12
25. The final stage is to change the colours and fill colours, as in the previous instructions.
Page 57
Pipeline Current Mapper User Guide
Section 12
Using Ms Excel to prepare a graph which uses 2 (Y) Axes, such as Distance against Current in
dBmA and Depth, or Distance against dBmA and Current Loss Rate in milliBels/metre.
1. Do NOT highlight any
columns – this is done at a
later stage – instead click on
any worksheet box outside
the data columns.
2. Click on Chart Wizard
Note: To calculate the loss in milliBels/meter use the formula shown in the formula bar (insert a new
column if necessary or use the next blank column). Type in zero (0) in the first line cell.
Highlight the second line cell and type in the formula in the formula bar. Click on the green tick
next to the formula bar Highlight the column and click and drag to the last line. Click ‘edit’ on the
toolbar. Click ‘Fill’ from the pull down menu. Click on the down arrow from the next menu.
Page 58
Pipeline Current Mapper User Guide
Section 12
3. Click on Custom
Types from the menu
tab, scroll down the
chart types and click
on “line-column
on 2 Axes” for dBmA
and Current Loss
Rate. Click on
‘Next’
4. This shows Chart Wizard steps 2 of 4.
Do not enter anything in the Data range
box.
5. Click on “Series” in Menu Tabs.
Page 59
Pipeline Current Mapper User Guide
Section 12
6. Click on “Add” – Series box will display
“Series 1” and Blank Graph will appear.
7. “Series 1” will be replaced by name in
the Name box. Click the Name box and
type in “Current loss mB/m”
8. In the “Category (X) axis labels”, Click
on the small red arrow: The box will
change into a long rectangular box Chart
Wizard – step 2 of 4 – “Chart so…”
9. On the worksheet, highlight/click,
and drag Distance column B – this
data will appear in this box.
10. Click on the small red icon in
this box, and the data will
reappear in the category (X)
axis labels, and the graph
will have a square dot or
part filled on it.
11. Click on the small red arrow
icon in ‘values’ box. This
shows = {1}
12. The long rectangular box shows
“Source Data-Values”
Page 60
Pipeline Current Mapper User Guide
Section 12
13. Highlight/Click and drag the Loss
(mB/Metre) Column G. These
values will appear in the box. Click
on the small red icon.
13. Highlight/click and drag the loss(mB/metre)
column G. These values will appear in the box.
Click on the small red icon.
14. The graph now shows Distance
on (X) axis and Loss (mB/metre)
on (Y) axis
15. Click on ‘Add’-series box shows
series 2 and values box shows
{1}. Name the series in the
“Name” box “Current loss rate
mB/m”.
16. Click on the small red icon, the
long rectangular box shows
‘Source Data-Values’.
Page 61
Pipeline Current Mapper User Guide
Section 12
17. On the worksheet Highlight/Click and drag Current 4Hz (dBmA) column D. The data will appear in
the box. Click on the small red icon.
18. Now the values are shown and
the graph now has 2 (Y) axes
19. Click on the small red icon in the
“secondary category (X) axis
labels” box. On the worksheet
highlight/click and drag distance
column B. This data will appear
in the rectangular box.
20. Click on ‘Next’-Chart
wizard step 3 of 4-Chart
options-This stage is for
Titles, Axes, grid lines,
legends etc.
Type these in now
The Title will appear at the
top of the graph example.
In ‘Category (X) Axis’ type in
“Distance Metres”.
In ‘Value (Y) Axis’ type in
“Current Loss Rate mB/M”.
In ‘Second Value (Y) Axis’
type in “Current dBmA”.
These will appear on the
graph example.
Click on ‘Next’.
Page 62
Pipeline Current Mapper User Guide
Section 12
21. Chart Wizard- Step 4 of 4Chart location
The chart can be placed as
a new sheet (which is
preferable), or as an object
in the worksheet.
Click on the ‘New Sheet’
point. Then Click on’ Finish’
the graph. will appear.
22. The next stage is to improve the appearance of the graph, and make it easier to interpret.
The dB mA current does not need full scale from zero to maximum and this can be changed.
Page 63
Pipeline Current Mapper User Guide
Section 12
23. Double Click on the numbers beside the Current dBmA (Value/Y2) axis. This shows the ‘Format Axis’
box. From the menu tabs, click on ‘Scale’. Change the maximum and minimum values and the major
and minor units – this will allow the curve/slope of the graph of the current loss to be steeper and
makes the faulty sections easier to observe.
Page 64
Pipeline Current Mapper User Guide
Section 12
24. The final stage is to
change colours and fill
colours, as previous
instructions.
Page 65
Pipeline Current Mapper User Guide
Section 13
The finished graph
Page 66
Pipeline Current Mapper User Guide
Section 13
Using the PCM system with GPS and Dataloggers.
Global Positioning Systems (GPS) are increasingly used to provide location references for surveyors.
Recently GPS systems have become more accurate and less costly to purchase.
Making a PCM survey with GPS means that the results can be combined with a Geographical
Information System (GIS), providing very useful information for defect analysis and simplifying future
comparison of survey results.
All Radiodetection PCM and RD400 locator receivers with a RS232 socket can provide output to GPS
and Dataloggers.
Below are explanations of the data transmission protocol, describing use with different dataloggers
and special set up instructions for the Trimble pathfinder TDC1 and TSC1 GPS systems. Full
configuration and operating instructions for the Trimble GPS Pathfinder Pro XR, Pro XRS, and Power
systems are given at Appendix 1.
System Overview
The RS232 port fitted to the receivers allows the operator to log measurement operations carried out by
the receiver.
If connected to a PSION LZ 64 type datalogger a complete update is transmitted at 2400 baud
whenever a key is pressed or the gain altered, ensuring that no operations are lost. This system does
not provide PCM current data.
If connected to any other datalogger which appears as a DTE a complete update is transmitted
whenever the Shift + Depth keys are pressed, providing that depth is still on the screen, and no more
than 6 seconds has elapsed since performing a Depth or Current Measurement.
With a PCM, the data is transmitted when the PCM current reading is accepted with the “check” key
(even if the internal PCM datalogger is full). This provides compatibility with GPS based dataloggers and
ensures that only user-requested operations are logged. Typical datalogger types are Psion Workabout
and Trimble TDC 1 and TDC2. This system provides 4 different data streams, all at 19200 baud.
Mechanical and Electrical connection.
The RS232 socket used is as follows: IBM PC style D-shell 9-way socket.
The hardware used by the RD400 Series 2 and series 4 Locators satisfies the EIA electrical requirement
for RS232D signals with limited handshaking. The minimum signals required are TXD, RXD and Ground.
The pin number and intended destination at the DTE are shown below:Pin 1 = DCD
Pin 2 = RXD
Pin 3 = TXD
Pin 4 = DTR
Pin 5 = GND
Pin 6 = DSR
Pin 7 = RTS
Pin 8 = CTS
Pin 9 = Open circuit
1
6
5
9
Page 67
Pipeline Current Mapper User Guide
Section 13
Interface
Connection to DTE
The locator is implemented as a DCE and provides the necessary handshaking signals required by an
external system configured as a DTE. The Locator loops back the DTE control signals as follows: DCD,
DTR and DSR linked together. RTS and CTS linked together. Data transmission does not require
handshaking.
A direct pin to pin connection between the locator and DTE will provide the correct interface in situations
that require the F00 data format (see below). This provides compatibility with the PSION LZ64 system,
operating at 2400 baud.
For all other data formats it will be necessary to de-assert DTR by using a modified connecting cable,
which is made by removing Pin 4 from the 9 Pin female plug on a standard 9 Pin RS232 connecting lead
(see diagram above). This switches the PCM data output to 19200 baud and the locator behaves like it
does when connected to a DCE system.
Connection to DCE
A three wire system using TXD, RXD and GND is used, allowing a direct pin to pin connection between
the locator and DCE to provide the correct interface.
Data Format
In order to conserve power the locator RS232 interface will remain in an inactive state except when data
transmission is being made.
The data format depends on the implementation of the external system.
For RD400 Series 2 locators only:- If the external system appears as a DTE (e.g. PSION system) which
asserts DTR then the data will be transmitted at 2400BPS with eight data bits, no parity and one stop bit.
A line of the data will be transmitted when any front panel key is pressed. The data string will be in
format F00 as defined below.
If the external system is a DCE (or uses a 3 wire system) and does not assert DTR then the data will be
transmitted at 19200 BPS with eight data bits, no parity and one stop bit. A line of the data will be
transmitted when Shift-Depth is pressed.
An entire line will be transmitted in 1 second and will represent the state of the receiver at the time when
the depth or current measurement was performed.
The data consists of an identifying Format Reference number (Fxx) followed by the data string. The
Reference number identifies the following data string so that the receiving computer system can identify
the data type.
Format Reference.
Connection
Description
F00
DTE
Data (not PCM) output for 2400 Baud Psion type LZ64 and
Trimble GPS type TSC1.
F02
DCE
Data and PCM output for 19200 Baud Psion workabout, Trimble
GPS type TDC1 and TDC2.
F04
DCE
Data and PCM output for 19200 Baud Psion workabout, Trimble
GPS type TDC1 and TDC2.
Page 68
Pipeline Current Mapper User Guide
Section 13
Format F02
Use with PCM software versions 1.02, 1.03, 4.00, 4.01, 4.02,4.03, 4.04, 4.05, 5.00, 5.01, 5.02. Production
up to July 2001.
The F02 format provides the most useful transmitted data, and this system is the preferred method for PCM data.
The standard format of the string F02 is as follows :F02,Line_number,Mode_type,Frequency,gain,signal,mode,response,
volume,battery,Depth,Current,CD_direction,FF_direction,FF_Current,4Hz_Current,
4Hz_Current_Direction,CR,LF
The data string will consist of the Format Reference F02, followed by the data information :i) A line number.
The line number will be a number in the zero to 9999 range. i.e. [0000..9999]. The line number will begin
at 0000 at switch-on.
ii)The type of Mode.
The type of Mode will be one of the following ASCII strings, denoting the type of mode currently in
operation:
ACTIVE, CD, PCM FF, PASSIVE, POWER.
iii) The currently selected frequency.
The frequency will consist of a number which represents the operating frequency in Hz. In Power, Radio
and Passive modes the frequency will be approximately the band centre frequency.
iv) The gain.
The gain will be a number in the 8 to 100 range i.e. [008-100].
v) The received signal strength.
The received signal will be in the range [000-999] or will be set to --- if the depth or current is to be displayed.
vi) The Line or Sonde Mode.
The mode will be indicated by the upper case letters L or S for Line or Sonde modes.
vii) The aerial response i.e. Peak or Null.
The response will be indicated by the upper case letters P or N for Peak or Null modes.
viii) A number indicating the volume setting.
The Volume setting will be in the range [0-3]
Where 0 = Off, 1 = Minimum Volume, 2 = Medium Volume, 3 = Maximum Volume.
ix) The battery voltage in levels.
The battery level will be in the range [0-4]
Where 0 = Battery Empty, 1 = 25% Full, 2 = 50% Full, 3 = 75% Full, 4 = 100% Full
Page 69
Pipeline Current Mapper User Guide
Section 13
x) The Depth.
The depth and current will be displayed if either the depth or current buttons have been pressed and a
valid reading obtained. If the receiver is configured for metric measurement the reported format will be as
follows :The metric measurement will be in the form M,[0.00-9.99] which is the depth in metres. The "M,"
preceding the number denotes Metric measurement.
If the receiver is in the Imperial mode of measurement the depth will be reported as follows :The parameters will be in the form I,[00.0-15.0]. This represents feet to the left of the decimal point and
inches to the right. The inches are displayed up to 9.If the number of inches is greater than 9 the feet are
incremented by one and the inches set to zero. The "I" preceding the number denotes imperial
measurement.
xi) The Current.
Current is displayed with either mA or dB microamps scaling as set by the receiver’s LCD set up..
xii) The CD current direction. (PCM Version –CT only)
The current direction will only be displayed if the CD button has been pressed and a result obtained. The
current direction will be one of the following:fd = Forward
bk = Backward
no = No current direction.
xiii) The Fault direction.
The Fault-find direction is displayed in the same way as CD
fd = Forward
bk = Backward
no = No current direction.
xiv) Fault Find Current.
Fault find current is displayed in dB microvolts
xv) 4 Hz PCM Current.
Current is displayed with either mA or dB scaling as set by the receiver’s LCD set up.
xvi) 4 Hz Current Direction.
The 4Hz current direction will be one of the following:fd = Forward
bk = Backward
no = No current direction.
Page 70
Pipeline Current Mapper User Guide
Section 13
Examples of Parameters F02 format.
Four different outputs can be provided by the PCM when using DCE interface at 19200 Baud.
1. In the normal locate mode, the full screen information is transmitted when Shift and Depth keys are
pressed.
F02,0001,ACTIVE,128HZ,032,629,L,P,0,4, , , , , , , ,
2. When locate Depth or locate Current is required, either Depth or Current keys are pressed. When
the Depth or Current is displayed on LCD, Pressing Shift and Depth will transmit both Depth and
Current to the datalogger.
F02,0002,ACTIVE,128HZ,032,---,L,P,0,4,M,1.29,0.52A, , , , ,
3. When the PCM magnetometer foot is activated to display a 4 Hz Pipeline Current reading, and then
the result is saved by a second press of the PCM Check key, the data is saved in the magnetometer
foot, It is also transmitted to the datalogger.
F02,0003,ACTIVE,128HZ,033,---,L,P,0,4,M,1.29, , , ,490mA,bk,
Please note that software versions 4.00, 4.01, 4.02, 4.03, 4.04, 4.05, 5.00 and 5.01 do not transmit
depth reading at the same time as PCM reading. Versions 1.02, 1.03 and 5.02 transmit complete
information as above. Depth is always saved in the PCM’s magnetometer foot.
4. If the PCM is used with the accessory A Frame plugged in to the accessory socket, and the result is
saved in the PCM receiver by pressing the Shift and Depth keys and the readings will also be
transmitted to the datalogger.
FO2,0004,PCMFF,8HZ,--,---,L,P,0,4, , , , ,fd, , ,073dB
In examples 2 and 3 Depth will be in either Metric or Imperial units as defined in paragraph (x)
above, depending on the PCM receiver LCD set up. Current Measurement units will be either in mA
or dB depending on the receiver LCD set up. To change PCM receiver LCD setup see section 10
page 37.
In each case the end of line is followed by carriage return (CR) and line feed (LF)
Format for PCM (F04)
Use with PCM software versions 5.03 onwards. Production after July 2001.
The F04 format provides the most useful transmitted data, and this system is the preferred method for
PCM data.
The standard format of the string is as follows :F04,Line_number,Mode_type,Frequency,gain,signal,mode,response,
Depth_unit,Depth,Current_unit_mA,Current_mA,Current_unit_dB,Current_dB,
CD_current_direction,Fault_direction, 4Hz_Current_unit_mA,4Hz_Current_mA,
4Hz_Current_unit_dB or Fault_unit_dB,4Hz_Current_dB or Fault_Voltage_dB,
4Hz_Current_direction,CR,LF
Page 71
Pipeline Current Mapper User Guide
Section 13
The data string will consist of the Format Reference F04, followed by the data information :i) A line number.
The line number will be a number in the zero to 9999 range. i.e. [0000..9999]. The line number will begin
at 0000 at switch-on.
ii) The type of Mode.
The type of Mode will be one of the following ASCII strings, denoting the type of mode currently in
operation:
ACTIVE, CD, PCM FF, PASSIVE, POWER.
iii) The currently selected frequency.
The frequency will consist of a number that represents the operating frequency in Hz. In Power, Radio
and Passive modes the frequency will be approximately the band centre frequency.
iv) The gain.
The gain will be a number in the 8 to 100 range i.e. [008-100].
v) The received signal strength.
The received signal will be in the range [000-999] or will be set to --- if the depth or current is to be
displayed.
vi) The Line or Sonde Mode.
The mode will be indicated by the upper case letters L or S for Line or Sonde modes.
vii) The aerial response.
The response will be indicated by upper case letters as follows.
P
N
M
A
C
D
S
Peak
Null
Standard accessory
A Frame
CM Clamp
Double Depth antenna
CD Stethoscope
viii) Depth units.
ix) Depth.
If either the depth key or the current key has been pressed and a valid reading obtained the depth will be
transmitted. The depth will be in the range 000 to 999 cm if the receiver is configured for metric
measurement. The depth will be in the range 000 to 180 inches if the receiver is configured for Imperial
measurement.
x) Current units mA.
xi) Current in mA.
xii) Current units dB.
xiii) Current in dB (microamps) *
*Note: Software version 5.04 produces current in dB milliamps
The current will be transmitted with both mA and dB scaling.
Page 72
Pipeline Current Mapper User Guide
Section 13
xiv) The CD current direction. (PCM Version –CT only)
The current direction will only be displayed if the CD button has been pressed and a result obtained. The
current direction will be one of the following:fd = Forward
bk = Backward
no = No current direction.
xv)
The Fault-find direction.
The Fault-find direction is displayed in the same way as CD
fd = Forward
bk = Backward
no = No current direction.
xvi) Fault-find units
Fault-find units are Decibel microvolts*
*Note: With software version 5.04 FaultFind units are Decibel millivolts.
xvii) Fault Find Voltage.
Fault-find voltage is transmitted with dB microvolts scaling.
xviii) 4 Hz PCM Current unit mA.
xviv)4 Hz PCM current in mA.
xx) 4 Hz PCM current unit dB
xxi) 4 Hz PCM current in dB
PCM 4 Hz Current is displayed in both mA and dB. The units mA precede the numerical value in mA,
and are followed by dB unit and the numerical dB current value.
Note: Software versions up to revision 5.03 display in dB microamps.
Software version 5.04 displays in dB milliamps
xxii) PCM 4 Hz Current Direction.
The PCM 4Hz current direction will be one of the following:fd = Forward
bk = Backward
no = No current direction.
The exact content of each transmitted data string will depend on the current operating status of the
locator, details can be found in the examples below.
Examples of Parameters
Four different outputs can be provided by the PCM when using DCE interface at 19200 Baud.
1.
In the normal locate mode, the screen information is transmitted when Shift and Depth keys are
pressed. This provides little useful information, but verifies system function.
F04,0001,ACTIVE,128Hz,034,471,L,P, , , , , , , , , , , , ,CR,LF
Page 73
Pipeline Current Mapper User Guide
Section 13
2.
When locate Depth or locate Current is required, either Depth or Current keys are pressed. When
the Depth or Current is displayed on LCD, Pressing Shift and Depth will transmit both Depth and
Current to the datalogger.
F04,0002,ACTIVE,128Hz,037,---,L,P,cm,145,mA,103.68,dB,100.31, , , , , , ,CR,LF
Using Imperial Depth settings for LCD display;
F04,0003,ACTIVE,98Hz,034,---,L,P,inches,50,mA,269.43,dB,108.61, , , , , , ,CR,LF
Version –CR with CPS frequency;
F04,0004,ACTIVE,100Hz,046,---,L,P,cm,112,mA,99.35,dB,99.94, , , , , , ,CR,LF
3.
When the PCM magnetometer foot is activated to display a 4 Hz Pipeline Current reading, and then
the result is saved by a second press of the PCM Check key, the data is saved in the
magnetometer foot, It is also transmitted to the datalogger.
F04,0005,ACTIVE,128HZ, ,---,L,P,cm,89, , , , , , ,mA,272.20,dB,108.70,bk,CR,LF
Using Imperial Depth settings for the LCD display;
F04,0006,ACTIVE,98Hz,034,---,L,P,inches,43, , , , , , ,mA,268.72,dB,108.59,bk,CR,LF
4.
If the PCM is used with the accessory A Frame plugged in to the accessory socket, and the result is
saved in the PCM receiver by pressing the Shift and Depth keys and the readings will also be
transmitted to the datalogger.
FO4,0007,PCMFF,8HZ, , , ,A, , , , , , , , fd, , ,dB,63.41,CR,LF
In examples 2 and 3 Depth will be in either Metric or Imperial units as defined in paragraphs (vii and ix)
above, depending on the PCM receiver LCD set up. Current Measurement units will be displayed in mA
and dB.
Please note that the PCM receiver LCD scale values will depend on the receiver setup. To change the
LCD display settings, please see section 10, page 37 of this manual.
In each case the end of line is followed by carriage return (CR) and line feed (LF)
Page 74
Pipeline Current Mapper User Guide
Section 13
Set up instructions for Trimble GPS systems.
Configuration of Trimble TDC1 Data Logger with External Sensor (PCM Rx.)
Check the integrity of all connections to the equipment, that is, Antenna, RD400 Receiver, Datalogger
(TDC1), and batteries.
Switch the TDC1 on.
Under the Main Menu, select Data Capture.
Under the Data Capture menu, select Create Rover File.
This will display the Create File screen. Within this screen the user can change the name of the new
rover file and can also choose the appropriate data dictionary for use whilst collecting GPS positions.
Press OK to reveal the Start Feature menu. Press F4 to select EXT from the extra menus at the bottom of
this screen.
Pressing F4 displays the Select Sensor menu. From this menu choose Sensor 1 and a tick should appear
to mark its selection. Press F1 to select Setup from the extra menus at the bottom of this screen.
This will display the Setup Screen for sensor 1. Adjust the settings as follows:
Sensor 1
Auto connect:Yes
Name:PCM (or name of choice)
Channel:0
Connect:\01
Disconnect:\04
Data request:?
Intervals
Point feature:All
Line/area:All
Not in feature:All
Attribute:None
Data received
Prefix:?
Suffix:LF
Max bytes?
Time-out:0.100s
Audible click:Yes
Status line:No
Another important thing to check, is the logging interval. To do this, use the Clear button to get back to
the Start Feature menu. From this menu, press the Func and GPS buttons together.
This will display the Configuration menu; select GPS and press Enter, to reveal the Configure GPS menu.
Select Rover Options and press Enter to reveal the Rover Options screen. Set the logging intervals to
maximum, that is 3600s and press OK. The configuration will be saved and the Configure GPS menu will
re-appear. Press the Clear button to return to the Configuration Menu. Press the Clear button again to
return to the Start Feature menu.
Page 75
Pipeline Current Mapper User Guide
Section 13
Under the Start Feature menu press F4 to select EXT, then press F3 to reveal the Status screen. This will
show any data that comes from the PCM receiver as well as the number of GPS positions logged.
The TDC1 can stay in this screen for the period of the PCM survey.
The TDC1 will receive data when the PCM saves a 4Hz measurement in the data log.
This data is transferred through the RS232 port on the back of the PCM Receiver. However, the TDC1
will initiate two GPS measurements at the same time, which it stores with the PCM data to create a
record.
Page 76
Pipeline Current Mapper User Guide
Section 13
PCM as 'External Sensor' for TSC1 with Asset Surveyor Software
Version 2.1 - August 8, 2000
This application note is designed to guide users, sales and support staff through connecting a Trimble
TSC1 collector (TSC1) with Asset Surveyor software to a Radiodetection Pipeline Current Mapper (PCM),
for the purposes of using the PCM to aid the mapping technician in gathering accurate positional data of
buried utilities for inclusion into a Geographic Information System (GIS). These two products together also
aid the corrosion technician with very accurate distance measurements between PCM readings for
accurate current loss / distance measurements.
Trimble Survey Controller Software (not Asset Surveyor) in the data collector is currently not supported as
that software does not allow external sensors to be added.
With practice, users will find this system is a fast, convenient, and accurate method of collecting data.
Several steps are required, including setting up the Trimble Data Dictionary (TDD), setting up the PDL as
an external sensor and connecting the PDL to the TSC. The basic of gathering data is also included.
Future developments may include a predefined setup in the TSC1 to make the configuration an easy,
one-step process.
IMPORTANT NOTE: The PCM sends out several different measurements including: current in
milliamperes (mA), depth, and current direction. The TSC1/Asset Surveyor is not capable of getting each
of these information fields and separately storing them. The user has 2 choices: copy all the information
into a text data field where the user has to break it up, or copy just one of the numeric data fields (PCM
current OR depth) into a numeric data field. If it is stored as text data, there may be a possibility of the PC
software, Pathfinder Office (PFO) being able to break it up.
1)
To properly set up the Data Dictionary to accept the PCM data, you must include a new feature
(F3) of type Point and a Feature name of ‘Depth Point’ or 'Current Point' or generically "PCM
Data" or similar in the TDD. Within that feature, a new attribute (F7) of either Numeric or Text has
to be defined based on the information in the important note above.
If Numeric, it must have the following settings:
- Attribute Name of ‘Depth’, 'Current' or similar.
- Comments as desired
- Decimal Places: 2
- Minimum: 0
- Maximum: 50
- Default: 0
- Field Entry: Required or Normal (users choice)
If Text, it must have the following settings:
- Attribute Name of ‘Data’ or similar.
- Comments as desired
- Length: 24 (or more)
- Field Entry: Required or Normal (users choice)
Using a numeric data type for the depth attribute will help GIS systems in to recognise the depth as a
number value when analysing data to find installation problems such as too little depth of cover. Other
components of the TDD would likely include a feature of type Line to mark the position of the pipe or cable
being located that included attributes describing the type, nature, owner, size, pressure, etc. of the line. If
multiple utilities are being located at once, multiple line (for position) and point (for depth) features would
likely be required, one pair for each utility type.
Page 77
Pipeline Current Mapper User Guide
Section 13
Another important part of setting up this system for data gathering is the positional data recording rate.
The trade off is accuracy versus data set size. Users may be tempted to use a relatively long period
between position points. While this may be adequate for a long, straight utility, the accuracy of the corner
positions may be severely compromised. Nor can we assume that all corners are basically the same.
Some systems such as gas pipes are typically all 90 degree elbows and “T’s” and laid square to the
property lines. Cables are sometimes laid diagonally or with large radius bends. If the TSC is set to
record data every say 10 seconds, that may show up a sharp 90 degree bend as a longer, larger radius
path. To put a number on this, if the user is walking at 1 meter per second (an average walking speed),
corners could be out 5 - 9 meters with a 10 second sample rate. A more frequent recording rate of once
every 1 or 2 seconds would reduce these errors substantially.
2) To properly set up the TSC to accept the PCM as an external sensor users have to enter the TSC
External Sensor Setup.
Other locator data may be gathered, refer to the Radiodetection / PCM locate serial data sheet for full
formats. A couple of sample strings are included here:
F02,0010,ACTIVE,98HZ,040,---,L,P,1,4,M,0.06,,,,3.10mA,no,
F02,0011,ACTIVE,98HZ,040,---,L,P,1,4,M,0.06,,,,3.20mA,no,
For the different data fields to record, set up next paragraph with the following values (without double
quotes): NOTE: Please re-read paragraphs on previous page “IMPORTANT NOTE” and the differences
between text and numeric data.
To record just depth, prefix of ",M,", suffix of "," and Max Bytes of 8.
To record just current, prefix of ",,,,", suffix of "mA" and Max Bytes of 11.
To record complete text info, prefix of ",M,", suffix of "?" and Max Bytes of 24.
Auto Connect
Name
Channel
Connect
Disconnect
Data Request
Intervals
Point Feature
Line/Area
Not in feature
Attribute
Data Received
Prefix
Suffix
Max Bytes
Timeout
Audible Click
Status Line
No
Radiodetection PCM
0
?
?
?
All
All
All
(Must be same as defined in Data Dictionary - CRITICAL!!)
As above
As above
As above
0.100 s
Yes
Yes
Remember that most values, such as gain and battery strength will change and as such will not be
suitable for use as a prefix or suffix.
Also, ‘Auto Connect’ may be set to yes to automatically make the RD the default external sensor. This
will select it and make it active every time a data file is started.
Page 78
Pipeline Current Mapper User Guide
Section 13
It is also required to change the ‘Comms’ setup for this external sensor with the following settings:
Serial port:
Baud Rate
Data Bits
Stop Bits
Parity
Top (typically)
19200
8
1
None
With this configuration the GPS Trimble Data Logger will receive depth data when either depth or current
data is sent from the PCM as described in section 4.
3) Connecting the TSC to the PCM is quite simple, connect a Trimble cable, part number 32287-00 into
the top port of the TSC and into the Radiodetection serial port. It is the same cable that connects the TSC
to the GPS receiver hardware and will likely have to be purchased in addition to the GPS equipment from
your vendor.
The Radiodetection locator will transmit the depth or current readings to the TSC only when the Check
(Accept PCM Data) key is pressed to store the data into the PCM internal memory. Even if the PCM
internal memory is full, the data will still be transmitted from the serial port.
It is recommended that the PCM be set up in metric depth mode for easiest data interpretation as the data
coming out of the PCM serial port will always be in metric format. This will allow the user to easily verify
the values being recorded.
4) Use of the systems together. The full scope of data collection is far beyond the intention of this
application note. We will cover the basic steps of collection, pipe or cable position, and depth data.
In general, users will likely first find the start of a segment of the utility that they wish to map with the use
of the PCM receiver and transmitter. Start the data capture procedure and make the Radiodetection
Locator the current input source from the EXTernal sensor menu. The next step is to start recording the
position of the pipe or cable in the TSC as a line feature. Then, within the positions of the line, depth
readings would be ‘nested’. Nesting is a Trimble term referring to recording one bit of information within
another and is accessed with the ‘Nest’. Before starting to capture the nested feature, users will likely
want to Pause the gathering of the line feature to avoid having many extra points there that will clutter up
the display. After pushing the Nest button, a menu comes up with features that can be nested and we
wish to choose the point feature we created in the data dictionary and likely called Depth. An input line
appears with the default value of the utility (that we defined in the TDD as 0). The 0 is a default so that
any readings accidentally accepted with the default value will show up as obviously incorrect data. After a
successful PCM reading has been taken, when the 'Check' (data accept) key is pressed, the default value
is replaced with the value the PCM locator reports. If multiple depth readings are sent in, only the last one
is recorded. Any other attributes of the point should also then be recorded. The user must finally press
‘Enter’ on the TSC to accept the data.
Users should also remember to ‘Pause’ the line feature position gathering if they are required to move off
the path of the line to avoid traffic, take a break, etc.
5) Data Processing and Exporting into a GIS system. This is a substantial part of the processing and use
of the data and what follows here is just a basic introduction of one sample application.
Data is processed as normal for data cleanup, differential correction, and file naming and archiving.
Page 79
Pipeline Current Mapper User Guide
Section 13
The data export setup is configured within the Utilities/Export menu. In the upper window select corrected
rover file. The “Output Folder” should contain the “export” subdirectory for the current project. “Choose
an Export Setup”, like “Sample ArcView Shape file Setup.” Adjust the export options via the “Change
Setup Options” button. If going to ArcView, use lat./long, WGS84. Hit “OK” in upper right corner. The
Rover file is converted to a shape file and placed in “export” subdirectory. Open ArcView, either go to
View/Add A Theme or follow opening window (1) Create a project with a new view (2) “would you like to
add data to the new view?” In either case, go to project export directory under pfdata. Select and bring
shape files into ArcView window view.
6) Intended Purpose
This system is intended only to assist in record keeping and system planning. It is not intended to replace
onsite utility locating, measuring and verification procedures which are essential to accurate placement of
new underground installations and avoidance of existing utilities.
All local city, state/provincial, and federal laws and guidelines must be followed including calling local 1call organisations and/or facility owners.
Author:
Gord Parker
Applications Specialist, Western Canada
Radiodetection Canada Ltd.
Ph.: 403-281-1808, Fax.: 403-281-1828
Website: http://www.radiodetection.ca
Email: [email protected]
Page 80
Pipeline Current Mapper User Guide
Section 14
Product Group
Product Code
Product Description
Frequency selection
Power – Standard
ELF
CD
LF
Custom Frequency CPS
Product features
Depth – Active mode
Scaling – Line
Current measurement
Aerials – Peak mode
Left/Right Null mode
CDR –Standard
PCM Fault Find
Variable Volume Speaker
CPS Depth measurement
CPS Current measurement
GPS compatible Data Logging
PCM Data Logging
Data and Connection sockets
RS232 Socket
Accessory socket
Headphone socket
Gain control paddle
Accessories (Optional)
Ni-Cad battery pack
Display backlight
Accessory A Frame
Product Group
Part number – standard or
removable lid
Mains power supply
PCM
- CP
PXL-2
PCM
- CO
PXL-2
PCM
- CR
PXL-2
PCM
- CS
PXL-2
PCM
- CT
PDL-2
60Hz
98
50Hz
128
50Hz
128
60Hz
98
512
120Hz
640
100Hz
640
100Hz
512
120Hz
50Hz
128
320
640
100Hz
#
#
#
#
#
#
#
#
#
#
#
#
#
#
#
#
#
#
#
#
#
#
#
#
#
#
#
#
#
#
#
#
#
#
#
#
#
#
#
#
#
#
#
#
#
#
#
#
#
#
#
#
#
#
#
#
#
#
#
#
#
#
#
#
#
#
#
#
#
#
#
#
#
#
Opt
Opt
10/AC1793
PCM Transmitter
52/PM1748 - ??
52/PM1748 – RL - ??
- USA
- EURO
- EURO
- USA
- EURO
60Hz 110V
50Hz
50Hz
60Hz 110V
50Hz
220/230V 220/230V
220/230V
Transmitter connection leads – Part numbers
Mains lead - USA
Mains lead – UK
Mains lead – Europlug
DC power lead (red/black)
Signal output lead (green/white)
PCM to PC Upload lead
PC Software
PCM to PC Upload software
discs
17/PM1748 E14 – USA
17/PM1748 E14 – UK
17/PM1748 E14 – EURO
17/PM1748 E10
17/PM1748 E11
17/CS Lead 76
52/PM2093 PC
.
Page 81
Pipeline Current Mapper User Guide
Section 14
Acknowledgements
The author thanks the following contributors;Gordon Parker,
Barney Walker,
Radiodetection Canada,
Radiodetection Bristol,
Applications Specialist.
Technical Support.
New information is always available from Radiodetection’s website
http://www.radiodection.com
Page 82
Pipeline Current Mapper User Guide
Appendix 1
Interfacing the Trimble GPS Pathfinder Pro XR, Pro XRS,
and Power systems with the PCM
Introduction
This bulletin outlines the configuration and operation of Trimble’s GPS Pathfinder Pro XR, Pro XRS and
Power systems with the PCM devices manufactured by Radiodetection Limited.
These notes apply particularly to the following product versions:
• TSC1 Asset Surveyor version 5.21
• Pathfinder Office version 2.80
• Radiodetection PCM receivers built after July 2001 using software version 5.03 or later.
Procedure Overview
There are four steps to obtain results with the PCM system and the Trimble TSC1 GPS datalogger.
1. Before taking measurements, create a suitable Data Dictionary on the PC.
2. Download this data dictionary to the TSC1.
3. Configure the TSC1 to interface to the PCM.
4. Take the measurements with the PCM while collecting GPS data with the GPS Pathfinder system.
5. Using Pathfinder Office software, export the results in csv ASCII format to the PC.
6. Import these results into MS Excel to prepare the graphs.
Creating a Data Dictionary on your PC
A Data Dictionary is a description of the data format you wish to collect in the field with Trimble’s Asset
Surveyor software. Once a Data Dictionary has been created on your PC, you must transfer the Data
Dictionary to the TSC1 Datalogger prior to fieldwork.
Use the following procedure to create a suitable Data Dictionary on the PC:
1)
2)
3)
4)
5)
6)
Run the Pathfinder Office software, and select “Utilities/Data Directory Editor”.
Select ‘Points’ and Name the file (File name)
Select ‘New feature’: Feature Name, “measuring points”.
Click on ‘Points’ then click on ‘OK’
Now touch key ‘F7’: “New Attributes”. Choose ‘Text’. Add Attribute name.
The comments field defaults to 30 characters, and it is possible to amend the default for up to 100
characters.
7) Click on ‘close’, ‘save’, and ‘close’. Now the Data Dictionary is ready to upload to the TSC1
datalogger.
Transferring the configuration to the TSC1.
1)
2)
3)
4)
5)
6)
7)
8)
9)
10)
11)
Connect the TSC1 and the PC using the Trimble serial cable.
Switch on the TSC1 (green button).
From the TSC1 Main Menu, select “File Manager”.
In the “File Manager” menu, scroll down to ‘File Transfer’; press Enter.
On the PC, run the Pathfinder Office software.
Select ‘Utilities/Data Transfer’.
After successful connection has been established between the PC and the TSC1, you will see “ID
sent” followed by “directory sent” on the TSC1 screen and the PC will display “Connected to GIS
Datalogger”.
Click on the ‘Send’ tab on the PC.
Select the “Add” option; Scroll down to ‘Data Directory’ and select the Data Dictionary you
created in the previous step.
Press the ‘Transfer all’ button. After transferring the selected Data Dictionary to the TSC1, the PC
will display the following message: “1 file successfully transferred”.
Select ‘Close’ on the PC.
Page 83
Pipeline Current Mapper User Guide
Appendix 1
Your Data Dictionary TSC1 has now been transferred to the TSC1.
Programming the TSC1
Do not connect the TSC1 to the GPS system until after configuration has been completed. This
configuration process is necessary to set up the TSC1 to interface with the PCM. In the terminology of
Trimble’s Asset Surveyor software, the PCM is treated as an “external sensor”.
The configuration procedure is as follows:
1) Turn on the TSC1. The “Main Menu” will appear on the screen:
2) From the TSC1’s “Main Menu”, select “Configuration”. The “Configuration” menu appears:
Page 84
Pipeline Current Mapper User Guide
Appendix 1
3) Select ‘External sensors’ from the “Configuration” menu. The “Select sensor” menu appears:
4) Press the F1 key (“Setup”) to configure “Sensor 1”. The configuration form appears. Change
each of the lines as illustrated in the following two screens:
Page 85
Pipeline Current Mapper User Guide
Appendix 1
5) The PCM sensor has now been configured, with the exception of its Serial RS232
communications parameters. To configure these parameters, press the F1 (Comms) key. The
“Comms Setup” screen will appear. Enter the configuration exactly as it appears in the following
illustration, with the exception that the designated Serial Port should be “Top”:
Note: If the “Comms” button is not available, it’s possible that another pre-configured sensor or laser
already has the sensor port open. If this is the case, check the other sensor/laser options and make
sure none are enabled (this is indicated by a tick next to the device).
6) Press ‘Enter’ to save the Comms parameters for Sensor 1. Press “Enter” again to save the
configuration for the PCM sensor. The list of available sensors should now appear as illustrated in
the following screen snap. Activate the PCM interface by selecting it from the menu (a tick will
appear next to its name in the list):
The TSC1 Asset Surveyor software is now configured for use with the PCM as an external sensor.
Taking measurements with the TSC1 and PCM
1) Connect the TSC1 to the GPS backpack by plugging the cable into the Bottom port of the TSC1.
2) Connect the PCM to the TSC1 by plugging the cable into the Top port of the TSC1 (and the port
on the back of the PCM receiver).
Note: The cable that connects the PCM to the TSC1 is different from the standard 9 pin, pin to pin PCM
Upload Cable. To change the PCM output baud rate to 19200, pin 4 should be removed on a
standard 9 pin, pin to pin RS232 cable. Data transmission from the PCM will be in the format F04.
3) Switch on the PCM and the TSC1. Move to the first measuring point and locate and pinpoint the
pipeline.
Page 86
Pipeline Current Mapper User Guide
Appendix 1
4) On the TSC1 create a new data file. Select ‘Measuring point’. Press ‘Enter’. Then press ‘F3’. This
prepares the TSC1 to receive the datastream from the PCM as an “External sensor”.
5) On the PCM, Press the PCM key to take the pipeline current measurement. Confirm the reading
by pressing the PCM key a second time. This will save the PCM data in the PCM magnetometer
foot, and at the same time transmit the data to the TSC1 datalogger.
6) The TSC1 will beep and the counter in the bottom right hand corner of the LCD screen will count
while this happens. The TSC1 will beep a second time. Press ‘F3’ again. The data is now saved
in the TSC1. Move to the next measuring point.
7) This routine of ‘Enter’, ‘F3’, PCM key, PCM key, ‘F3’ is repeated at every measurement point
until the survey is completed.
8) The latest data stored can be viewed by pressing’F3’ Status and F3 Ext. Note that only the first
part of the datastream is shown on the TSC1 LCD.
When you return to the office, you should download data from the TSC1 to Trimble’s Pathfinder Office
software using the normal data transfer procedure as documented in the Pathfinder Office on-line help
and/or User Manual.
Exporting TSC1 data to Trimble’s Pathfinder Office Software
1. In the Pathfinder Office software, select “Utilities/ Export”. The “Export” Utility will appear:
2. Click on the “Properties” button and choose the settings shown in each of the following windows.
First the Data Tab:
Page 87
Pipeline Current Mapper User Guide
Appendix 1
3. Then the Output Tab:
4. The Attributes tab:
Note: No generated attributes should be ticked.
Page 88
Pipeline Current Mapper User Guide
Appendix 1
5. The Units tab:
6. The Position Filter tab:
Page 89
Pipeline Current Mapper User Guide
Appendix 1
7.The Coordinate System tab:
8.The Configurable ASCII tab:
Page 90
Pipeline Current Mapper User Guide
Appendix 1
9. You now need to create a “Template”. Carefully enter the template format illustrated in the next screen:
10. Save all these settings and the file will export as a list of coordinates with corresponding PCM
measurements.
You will notice that you now have a list of all the readings with coordinates, followed by a list of all the
coordinates again. These can easily be deleted.
Note: If you do not need to reference the positions of the measuring points in real time you do not need to
create them. When you send the data from the PCM foot, the Asset Surveyor software actually
takes a position automatically when it receives each measurement. Then when you export data
from the Pathfinder Office software you will have only the coordinates and the measurement data.
(i.e. not a repeat of the coordinates afterwards). However in this case there would be no way to
navigate back to points in the field unless you create one. The advantage with this though is that
whenever you send data from the foot you will always get a position – even if you forget to go into a
“measuring point “ feature. This results in always having data at the correct point.
Importing Data into Excel
When you import data into Excel, you will have columns representing the North and East coordinates for
each measurement, followed by all the Attributes (being the PCM datastream in F04 format).
Below these will be a second list of the same coordinates in real time. These can be deleted if not
required for navigating back to the points in the field???
To Do:
1. Snaps of initial DD creation?
2. Iron out the format issues
3. Illustrate the final data
4. Show how it’s graphed in Excel.
Page 91
Pipeline Current Mapper User Guide
Appendix 1
Radiodetection Ltd
Western Drive
Bristol BS14 0AZ, UK
Tel: +44 (0) 117 976 7776
Fax: +44 (0) 117 976 7775
email:[email protected]
http://www.radiodetection.com
Radiodetection products are under continuous development
and are subject to change without notice.
90/UG14EN07
All rights reserved