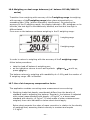
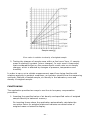
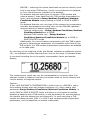
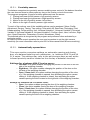
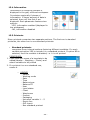
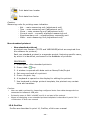
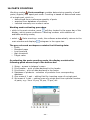
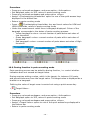
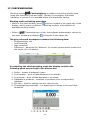
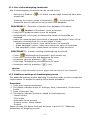
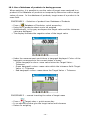
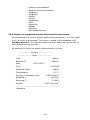
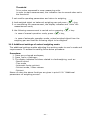
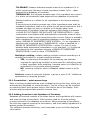
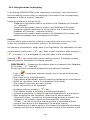
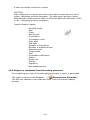
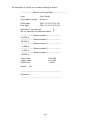
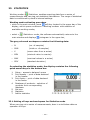
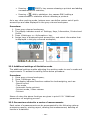
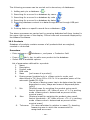
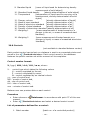
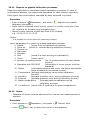
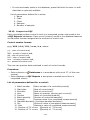
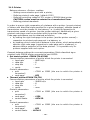
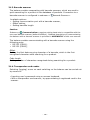
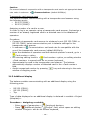
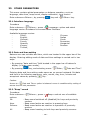
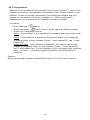
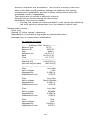
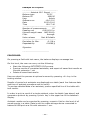
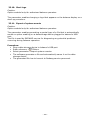
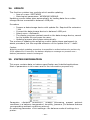
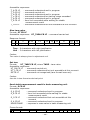
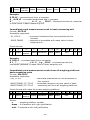
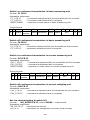
1
User manual no.: IMMU-02-03-04-14-ENG BALANCES 3Y SERIES ultra-microbalances UYA 3Y analytical balances XA 3Y analytical balances XA 3Y.A analytical balances AS 3Y precision balances PS 3Y − precision balances APP 3Y − − − − − BALANCES AND SCALES RADWAG 26 – 600 Radom, Bracka 28, POLAND Phone: +48 (0-48) 38 48 800, fax. +48 (0-48) 385 00 10 [email protected] www.radwag.com Inc. www.medicaldevicedepot.com 1-877-646-3300 Table of contents 1. BASIC INFORMATION ....................................................................... 8 2. UNPACKING AND INSTALLATION ...................................................... 9 2.1. 2.2. 2.3. 2.4. 2.5. 2.6. 2.7. 2.8. Ultra-microbalaces UYA 3Y .................................................................... 10 Balances XA 3Y; XA 3Y.A ....................................................................... 11 Balances AS 3Y series ........................................................................... 12 Balances PS 3Y series ........................................................................... 13 Balances APP 3Y series ......................................................................... 13 Balance cleaning .................................................................................. 14 Plugging to mains ................................................................................. 20 Connecting peripheral equipment ........................................................... 20 3. BALANCE DESIGN ........................................................................... 21 3.1. Dimensions ......................................................................................... 21 3.2. Interfaces............................................................................................ 25 3.3. Balances with a wireless connection between the terminal and the weighing module (an option) .............................................................. 25 3.3.1. 3.3.2. 3.3.3. Start-up procedure ............................................................................... 26 Icons description .................................................................................. 27 Settings .............................................................................................. 28 4. STARTUP ......................................................................................... 29 5. BALANCE KEYBOARD – FUNCTION KEYS ......................................... 29 6. SOFTWARE STRUCTURE .................................................................. 30 7. SOFTWARE WEIGHING WINDOW .................................................... 31 8. LOGGING ........................................................................................ 32 9. OPERATING USER MENU ................................................................. 34 9.1. Terminal’s keyboard ............................................................................. 34 9.2. Return to weighing mode ...................................................................... 35 10. WEIGHING ...................................................................................... 36 10.1. Selection of measuring unit ................................................................... 36 10.2. Means of correct weighing procedure ...................................................... 37 10.3. Balance leveling ................................................................................... 38 10.4. Zeroing ............................................................................................... 38 10.5. Tarring ................................................................................................ 39 10.6. Weighing on dual range balances (ref. balance PS 200/2000.3Y series)...... 40 10.7. Use of air buoyancy compensation factor................................................. 40 10.8. Additional parameters on weighing process ............................................. 44 10.9. Minimum sample .................................................................................. 46 11. ADJUSTMENT .................................................................................. 50 11.1. Internal adjustment .............................................................................. 50 11.2. External adjustment ............................................................................. 50 11.3. User adjustment .................................................................................. 51 11.4. Adjustment test ................................................................................... 51 11.5. Automatic adjustment ........................................................................... 51 11.6. Automatic adjustment time ................................................................... 52 11.7. Adjustment report printout .................................................................... 52 -3- 11.8. GLP project ......................................................................................... 52 11.9. Adjustment history ............................................................................... 53 12. USERS ............................................................................................. 54 13. ACCESS LEVEL ................................................................................. 55 14. PROFILES ........................................................................................ 57 14.1. Creating a profile ................................................................................. 57 14.2. Profile structure ................................................................................... 58 14.2.1. 14.2.2. 14.2.3. 14.2.4. Settings .............................................................................................. 59 Working modes .................................................................................... 59 Readout .............................................................................................. 59 Measuring units.................................................................................... 61 15. WORKING MODES – general information ........................................ 62 15.1. Working mode selection ........................................................................ 63 15.2. Parameters related to working modes ..................................................... 64 15.3. Quick access keys ................................................................................ 64 15.3.1. 15.3.2. Proximity sensors ................................................................................. 65 Automatically opened door .................................................................... 65 15.4. Information ......................................................................................... 66 15.5. Printouts ............................................................................................. 66 15.6. Profiles ............................................................................................... 68 16. PARTS COUNTING ........................................................................... 69 16.1. Additional settings of part counting mode ................................................ 70 16.2. Parts counting – quick access keys ......................................................... 71 16.3. Setting standard (reference) mass by inserting determined part mass ........ 71 16.4. Setting standard (reference) mass by weighing ........................................ 71 16.5. Acquiring part mass from database......................................................... 72 16.6. Updating part mass in the database........................................................ 72 16.7. Parts counting procedure....................................................................... 73 16.8. Checkweighing function in parts counting mode ....................................... 73 16.9. Dosing function in parts counting mode................................................... 74 17. CHECKWEIGHING............................................................................ 76 17.1. Use of checkweighing thresholds ............................................................ 77 17.2. Additional settings of checkweighing mode .............................................. 77 18. DOSING .......................................................................................... 78 18.1. Use of database of products in dosing process ......................................... 79 18.2. Additional settings of dosing mode ......................................................... 80 19. PERCENT SETUP .............................................................................. 81 19.1. Comparison of sample and (reference) mass standard .............................. 82 19.2. Checkweighing, dosing functions in percent setup mode............................ 83 19.3. Interpreting the function by use of a bargraph ......................................... 84 19.4. Additional settings of Percent Setup mode ............................................... 84 20. DENSITY ......................................................................................... 85 20.1. Set for density estimation of liquids and solid objects ............................... 86 20.2. Assembly ............................................................................................ 87 20.3. Determining density of solid object ......................................................... 88 20.4. Determining density of liquids ................................................................ 89 20.5. Density of air ....................................................................................... 90 -4- 20.6. Additional settings of density mode ........................................................ 91 20.7. Printouts ............................................................................................. 92 20.8. Report on completed density determination processes .............................. 94 21. ANIMAL WEIGHING ........................................................................ 95 21.1. Setting of animal weighing mode............................................................ 96 21.2. Additional settings of animal weighing mode ............................................ 97 22. FORMULATION ................................................................................ 98 22.1. Additional settings of formulation mode .................................................. 99 22.2. Formulation – quick access keys ...........................................................100 22.3. Adding formulas to the Database of Formulas .........................................100 22.4. Using formulas in weighing ...................................................................102 22.5. Printouts ............................................................................................104 22.6. Report on completed formula making processes ......................................105 23. STATISTICS .................................................................................. 107 23.1. Setting of keys and workspace for Statistics mode ..................................107 23.2. Additional settings of Statistics mode .....................................................108 23.3. Parameters related to a series of measurements .....................................108 24. PIPETTE CALIBRATION ................................................................. 111 24.1. Additional settings of pipettes calibration mode .......................................115 24.2. Pipettes calibration – quick access keys .................................................115 24.3. Adding a pipette to the Database of Pipettes ...........................................116 24.4. Printouts ............................................................................................117 24.5. Activating procedure ............................................................................118 24.6. Report on completed calibration processes .............................................119 25. DIFFERENTIAL WEIGHING ............................................................ 121 25.1. Additional settings of differential weighing mode .....................................122 25.2. Differential weighing – quick access keys ...............................................122 25.3. Introducing a series to the Database of Series ........................................124 25.4. An example of process for differential weighing mode ..............................124 25.5. Copy tare ...........................................................................................131 25.6. Using option “SAMPLE SELECTION”........................................................131 25.7. Deleting a value ..................................................................................132 25.8. Printouts ............................................................................................132 26. STATISTICAL QUALITY CONTROL – SQC ....................................... 134 26.1. Working mode activating procedure .......................................................135 26.2. Additional settings of the SQC mode ......................................................137 26.3. Carrying out a control process ..............................................................137 26.4. Report on product control .....................................................................138 27. PREPACKAGED GOODS CONTROL .................................................. 140 27.1. Working mode activating procedure .......................................................140 27.2. Control settings...................................................................................141 27.3. Local settings of PGC mode ..................................................................142 27.4. Editing product for control ....................................................................142 27.5. Control start procedure ........................................................................145 27.6. Abort control procedure .......................................................................146 27.7. Aborted control restoring procedure, power loss case ..............................146 -5- 27.8. Non-destructive average tare control mode ............................................147 27.9. Non-destructive empty – full control mode .............................................153 27.10. Destructive empty-full and full-empty control mode ............................155 27.11. Control according to internal criteria ..................................................155 27.12. A report on determining average tare value ........................................157 27.13. A report on product control ..............................................................158 28. MASS CONTROL............................................................................. 159 28.1. Working mode activating procedure .......................................................159 28.2. Mass control global settings ..................................................................159 28.3. Mass control process............................................................................159 28.4. Printouts ............................................................................................161 28.5. Report on completed mass control processes ..........................................162 29. DATABASES................................................................................... 163 29.1. Processes carried out on databases .......................................................164 29.2. Products.............................................................................................165 29.3. Weighing records ................................................................................167 29.4. Clients ...............................................................................................168 29.5. Formulation ........................................................................................168 29.6. Reports on formulation ........................................................................168 29.7. Reports on density ..............................................................................169 29.8. Controls .............................................................................................170 29.9. Average tares .....................................................................................171 29.10. Pipettes .........................................................................................172 29.11. Reports on pipette calibration processes ............................................173 29.12. Series ............................................................................................173 29.13. A report on SQC..............................................................................174 29.14. Minimal sample weight.....................................................................175 29.15. Mass controls..................................................................................177 29.16. Ambient conditions ..........................................................................179 29.17. Packages........................................................................................179 29.18. Warehouses ...................................................................................179 29.19. Printouts ........................................................................................180 29.20. Universal variables ..........................................................................182 29.21. Operating database .........................................................................182 29.21.1. 29.21.2. 29.21.3. Export database of weighing records to file ........................................... 182 Delete database ................................................................................ 184 Delete weighments and reports ........................................................... 185 30. COMMUNICATION ......................................................................... 186 30.1. RS 232 port settings ............................................................................186 30.2. ETHERNET port settings .......................................................................186 30.3. TCP protocol settings ...........................................................................186 31. PERIPHERAL DEVICES................................................................... 187 31.1. Computer ...........................................................................................187 31.2. Printer ...............................................................................................188 31.3. Barcode scanner .................................................................................190 31.4. Transponder card reader ......................................................................190 31.5. Additional display ................................................................................191 -6- 31.6. Ambient conditions module ...................................................................192 31.7. Tablet feeder (automatic feeder) ...........................................................192 32. INPUTS / OUTPUTS ....................................................................... 193 33. OTHER PARAMETERS..................................................................... 195 33.1. Interface language ..............................................................................195 33.2. Date and time setting ..........................................................................195 33.3. “Beep” sound ......................................................................................195 33.4. Sleep mode ........................................................................................196 33.5. Display brightness ...............................................................................196 33.6. Touch panel calibration ........................................................................196 33.7. Level control .......................................................................................197 33.8. Sensor sensitivity ................................................................................198 33.9. Autotest .............................................................................................198 33.10. Start logo .......................................................................................202 33.11. Export of system events...................................................................202 34. UPDATE ......................................................................................... 203 35. SYSTEM INFORMATION ................................................................. 203 36. COMMUNICATION PROTOCOL ....................................................... 204 36.1. A set of commands ..............................................................................204 36.2. Responses format for commands sent from computer level ......................205 36.3. Manual printout / Automatic printout .....................................................212 37. CONNECTING PERIPHERAL DEVICES............................................. 214 38. DIAGRAMS OF CONNECTING CABLES ............................................ 214 39. ERROR MESSAGES ......................................................................... 215 40. ADDITIONAL EQUIPMENT ............................................................. 216 41. APPENDIX A – Variables for printouts........................................... 217 41.1. List of variables ...................................................................................217 41.2. Variables formatting ............................................................................226 42. APPENDIX D – Settings of CITIZEN printer ................................... 228 43. APPENDINX E - Settings of ZEBRA printers .................................. 229 44. APPENDIX F – Communication with barcode scanners.................. 229 45. APPENDIX G – Menu structure ...................................................... 230 -7- 1. BASIC INFORMATION INTENDED USE Balances 3Y series are intended to precise mass measurement of weighed loads conducted in laboratory conditions. PRECAUTION MEASURES Before first use of the balance, it is highly recommended to carefully read this User Manual, and operate the balance as intended. Do not operate the touch panel using sharp edged tools (knife, screwdriver, etc.). Place weighed loads in the center of balance’s weighing pan. Load the balance’s weighing pan with loads that gross mass does not exceed instrument’s measuring range (maximal capacity). Do not leave heavy loads on balance’s weighing pan for a longer period of time. In case of defect immediately unplug the instrument from mains. Balances to be decommissioned, should be decommissioned in accordance with valid legal regulations. Do not use the balance is areas endangered with explosion. Balance Y2 series is not designed to operate in EX zones. WARRANTY CONDITIONS A. RADWAG feels obliged to repair or exchange all elements that appear to be faulty by production or their construction, B. Defining defects of unclear origin defects and means of their elimination can only be realized with assistance of manufacturer and user representatives, C. RADWAG does not bear any responsibility for defects, losses or accidents resulting from unauthorized or inadequate performing of production or service processes, D. Warranty does not cover: • Mechanical defects caused by product exploitation other than intended, defects of thermal and chemical origin, defects caused by lightning, overvoltage in the power network or other random event, • Balance defects if it is utilized contrary to its intended use, -8- • Balance defects, if service claims removing or destroying product’s protective stickers which protect the balance’s housing against unauthorized access. • Mechanical defects or defects caused by liquids and natural wear, • Balance defects caused by inappropriate setting of a defect of electric power network, • Defects caused by overloading balance’s mechanical measuring system, • Maintenance activities (cleaning). E. Loss of warranty takes place if: • A repair is carried out outside RADWAG sales office or authorized service point, • Service claims intrusion into mechanical or electronic construction by unauthorized people, • Other version of the operating system is installed in a balance, • The balance does not bear company’s protective stickers. F. Detailed warranty conditions are listed on a service card. Supervision over balance’s metrological parameters Metrological parameters of a balance need to be checked by a user in determined time intervals. Inspection frequency is conditioned by ambient conditions in which a balance is used, kind of carried out processes and adopted quality management system. The manual’s significance It is very important to read the user manual carefully before switching on and starting up balance operation, even if the user is experienced and has worked with the this type of balance before. Balance user training A balance should be utilized and supervised only by users who are trained and experienced in such type of weighing instruments. 2. UNPACKING AND INSTALLATION -9- 2.1. Ultra-microbalaces UYA 3Y Carefully unpack the balance, remove plastic, cardboard and foil packagings together with protective elements and using gently movements place the balance onto its location. Assembly the weighing pan and other elements following the diagram. After ultra-microbalance installing at operating place, following should be set: 1 – pan shield 2 – bottom ring 3 – balance pan 4 – glass cover After the elements setting, additional devices should be connected and balance should be plugged to power source. Power socket is located on back side of electronic module. - 10 - 2.2. Balances XA 3Y; XA 3Y.A A – balance with d=0,01mg unit B – balance with d=0,1mg unit After balance installation at operating place, remove the transport protection (9) press the safety catch gently and turn it accordingly to <OPEN> instruction, next remove the safety catch but remember to retain it should the device be transported in the future. Next, assembly the following parts: − bottom shield of the drying chamber (5) − centering ring (4) − weighing pan (2) − pan shield (3) or (1) After the elements setting, additional devices should be connected and balance should be plugged to power source. Power socket is located on back side of balance housing. Balances XA 3Y.F Pipettes calibration Remove the pan and put on its place: - pipettes calibration chamber - inside the chamber, pan and other elements should be set up. After placing the balance in its intended place of use, assembly all of its standard components: - bottom shield of the weighing chamber (4) - bottom ring (3) - standard weighing pan (1) - pan shield (2) After assembling all of the components and connecting peripheral devices plug the balance to power source using a dedicated power adapter. Power socket is located on back side of balance housing. Before weighing filters remove the pan shield (2), the standard weighing pan (1) and the bottom ring (3). Next, inside the weighing chamber place a glass shield (6) and assembly a pan-stand for weighing filters (5). on completing the above process zero/tare balance indication. The system is ready weighing filters procedures. - 11 - CAUTION! Any activities have to be carried out very carefully and gently not to damage the measuring system of the balance. 2.3. Balances AS 3Y series Carefully remove the balance from its packaging, remove the plastic and foil transport protective elements. Gently place the balance in its intended place of use. Install the weighing pan, and other elements according to below scheme. Analytical balances AS 3Y series A – balance with reading unit d=0,01mg B – balance with reading unit d=0,1mg On installing the balance in its intended place of use, remove transport lock (1) – press the lock gently and turn it accordingly to OPEN/CLOSE instruction, next remove the lock. Please retain the lock should the device be transported in the future. Next assembly: 2 – bottom shield of the weighing chamber 3 – centering ring 4 – weighing pan 5 – pan shield On assembling all components, connect peripheral devices to the balance, and plug the balance to mains. Power socket is located at the back of balance’s housing. Balance with transport lock mounted on - 12 - 2.4. Balances PS 3Y series Carefully remove the balance from its packaging, remove the plastic and foil transport protective elements, and gently place the balance in its intended place of use. Install the weighing pan, and other elements according to below scheme. Precision balances PS 3Y series A – balance with reading unit d=1mg B – balance with reading unit d=10mg On installing the balance in its intended place of use, assembly: 1 – weighing pan mandrels 2 – weighing pan 3 – pan shield /in case of d=1mg/ On assembling all components, connect peripheral devices to the balance, and plug the balance to mains. Power socket is located at the back of balance’s housing. 2.5. Balances APP 3Y series Gently take the balance out of its packaging, remove plastic, carton, foil and transport protections, and gently place the balance in its intended place of use. After unpacking unscrew bolt 1 which locks the adjustment mechanism. - 13 - Before installing the balance in its intended place of use, remove transport protections (1) and assembly the weighing pan (2) (for APP 10.3Y, one of the pans only). On assembling the components, connect all peripheral devices to the balance and then plug the instrument to the mains. Power socket is located at the back of balance’s housing. On removing the protections and assembling the weighing pan, connect the terminal to the socket located at the back of balance’s housing, and connect all peripheral devices. Only then plug the balance to mains (mains socket is located at the back of balance’s housing). 2.6. Balance cleaning 1. Disassembly the weighing pan and portable elements, depending on the balance type the elements differ (refer to UNPACKING AND INSTALLATION for details). Use the most gentle movements so as not to damage the mechanism. It is recommended to use tweezers while removing the pan from microbalances. 2. If possible, use vacuum keyboard cleaner to remove the dust from the weighing chamber (especially recommended for microbalances) 3. Glass parts should be cleaned using a dry flannel cloth (mild cleanser may be used if it does not contain any abrasive substances) – for draft shield disassembly instruction go to the next section of this manual 4. Use a dry flannel cloth in order to clean disassembled parts (mild cleanser may be used if it does not contain any abrasive substances) CAUTION: Cleaning balance’s weighing pan if installed may damage instrument’s measuring mechanism. For ease of draft shield cleaning process it is allowed to remove its glass parts as it has been presented below. - 14 - XA 3YA series balances Steps: 5. Unscrew and remove top glass protection, next slide the top glass out. 6. Remove left and right side glass. Before removing the glass completely pull its protection as it has been presented in the picture. Left and right side glass are not interchangeable therefore it must be remembered which is left, which is right. Upon cleaning procedure completion left and right side glass must be mounted to a correct place. 7. Undo the screws protecting the front glass to remove it. - 15 - 8. Remove the weighing pan and the pan shield so as not to damage the mechanism while carrying out the cleaning process. Thus prepared draft shield and its glass parts may be thoroughly cleaned. Carry out the cleaning process carefully using the most gentle movements. Pay attention to dirt and any small items, they could affect balance operation if they got inside the balance through the opening that serves to mount the weighing pan. Upon completion of the cleaning process assembly the balance, take actions like before but in a reverse order. Pay a special attention to left and right side glass, assembly it on the correct side of the balance. While sliding the glass back onto its place remember to pull the protection (like before when dismantling the draft shield). XA 3Y series balance Steps: 1. Unscrew and remove top glass protection, next slide the top glass out. - 16 - 2. Replace the back glass. 3. Remove left and right side glass. Left and right side glass are not interchangeable therefore it must be remembered which is left, which is right. Upon cleaning procedure completion left and right side glass must be mounted to a correct place. 4. CAUTION: the front glass cannot be dismounted. 5. Remove the weighing pan, the pan shield and the bottom shield of the weighing chamber so as not to damage the mechanism while carrying out the cleaning process. - 17 - Thus prepared draft shield and its glass parts may be thoroughly cleaned. Carry out the cleaning process carefully using the most gentle movements. Pay attention to dirt and any small items, they could affect balance operation if they got inside the balance through the opening that serves to mount the weighing pan. Upon completion of the cleaning process assembly the balance, take actions like before but in a reverse order. Pay a special attention to left and right side glass, assembly it on the correct side of the balance. While sliding the glass back onto its place remember to pull the protection (like before when dismantling the draft shield). AS 3Y series balance Steps: 1. Unscrew and remove top glass protection, next slide the top glass out. - 18 - 2. Remove the back glass 3. Remove left and right side glass. Left and right side glass are not interchangeable therefore it must be remembered which is left, which is right. Upon cleaning procedure completion left and right side glass must be mounted to a correct place. 4. CAUTION: the front glass cannot be dismounted. 5. Remove the weighing pan, the pan shield and the bottom shield of the weighing chamber so as not to damage the mechanism while carrying out the cleaning process. - 19 - Thus prepared draft shield and its glass parts may be thoroughly cleaned. Carry out the cleaning process carefully using the most gentle movements. Pay attention to dirt and any small items, they could affect balance operation if they got inside the balance through the opening that serves to mount the weighing pan. Upon completion of the cleaning process assembly the balance, take actions like before but in a reverse order. Pay a special attention to left and right side glass, assembly it on the correct side of the balance. While sliding the glass back onto its place remember to pull the protection (like before when dismantling the draft shield). 2.7. Plugging to mains The balance should be plugged to mains using the original power adapter, which is balance’s standard equipment. Plug the power adapter’s plug to balance’s socket located at the back of the housing. 2.8. Connecting peripheral equipment Use only accessories and peripheral equipment recommended by the manufacturer of your balance. The balance must be disconnected from the mains before connecting or disconnecting any peripherals (printer, PC computer, computer keyboard). On connecting the peripherals, plug the balance to mains. - 20 - 3. BALANCE DESIGN 3.1. Dimensions Ulctramicrobalance UYA 3Y series Balance XA 3Y.A series - 21 - Balance XA 3Y series Balance XA 3Y.F series - 22 - Balance AS 3Y series Balance PS 3Y series - 23 - Balance APP 3Y series - 24 - 3.2. Interfaces Description of available interfaces 1 – Ethernet RJ45 2 – RS232 interface (COM1) 3 – USB port 4 – IN / OUT, RS232 (COM2) Interfaces RS232 and IN/OUT RS232 - socket DB9/M (male), front view: Pin2 - RxD Pin3 - TxD Pin5 - GND IN/OUT, RS232 socket DSUB15/F (female), front view: Pin1 - GNDWE Pin2 - OUT1 Pin3 - OUT2 Pin4 - COMM Pin5 - 6÷9VDC Pin6 - IN4 Pin7 - IN3 Pin8 - TxD2 Pin9 - 5VDC Pin10 - GNDRS Pin11 - IN2 Pin12 - IN1 Pin13 - RxD2 Pin14 - OUT4 Pin15 - OUT3 3.3. Balances with a wireless connection between the terminal and the weighing module (an option) - 25 - The terminal operates on bateries, wireless connection ensures its cooperation with the weighing module. This, in contrast to a standard design, allows to eliminate cable connecting the devices. Wireless connection solution is marked by letter <B>, eg. AS 220.3Y.B. Features: Maksimum range: 10 m Maxumum operation time of the terminal (without the necessity to charge baterries): 8 h Usage: 1. Lack of additional sources of vibration Terminal located elsewhere than the weighing bench eliminates vibrations being a result of operation. This ensures stable working conditions for balances with the highest. No specific weighing benches are needed. 2. Comfort of weighing in fume cupboards and laminar flow cabinets Wireless connection between a terminal and a weighing module positively influences weighment process making it more comfortable and safer. 3. Elimination of unfavourable influence factors Due to wireless connection the weighing module may be completely separated from the operator by being placed in an anti-draft chamber. This makes weighing of contaminated and toxic substances possible without putting one’s health and life to risk. 4. Improved pipetting ergonomics Pipettes calibration process requires precision and quickness of operation. Wireless connection redefines comfort of operation which will definitely be appreciated by the user. Wireless solutions are equipped with 2 power suppliers. One used for supplying the weighing module, the other for powering the terminal. 3.3.1. Start-up procedure On unpacking and placing the balance onto its workstation it is necessary to connect the weighing module and the terminal to mains. Next the user shall proceed like in case of a standard design (description to be found further down this manual). Main window preview for a wireless connection solution is presented below. - 26 - 1 2 Main window of a wireless connection solution features two extra icons when compared to a standard design: 1. battery charge status icon 2. wireless connection icon Operation and functions are identical like for standard design balances. 3.3.2. Icons description Battery charge status icon: No. Icon Description 1 Battery charging 2 Battery charged, terminal connected to mains 3 Battery charged, terminal not connected to mains 4 Battery status (about 50%), terminal not connected to mains 5 Minimal battery status, necessity of connecting the terminal to mains Wireless connection icon: No. Icon Description 1 Correct connection of wireless modules – correct cooperation 2 Connection interrupted – loss of connection - 27 - Terminal connected to mains, battery charged, no connection of the terminal with the weighing module. 3.3.3. Settings For ensuring long enough operation while powering the device by means of battery, the correct parameters of group OTHER must be set, <Sleep mode> <Display brightness>. For more information refer to point 33 of this manual titled Other Parameters. - 28 - 4. STARTUP • On plugging the balance to mains, instrument’s diode ON/LOAD located on indicator’s housing is lit up. • Press powering key located on the upper left section of terminal’s overlay. Within a few seconds, the OS Windows CE and RADWAG software start loading, which is signaled by flickering red diode ON/LOAD. • On completing the startup procedure, the instrument’s displays main window of the balance software. • The balance starts up with no user logged in. In order to start operation, a user has to log in. (logging procedure is described further in this user manual). CAUTION: Remember to start the balance with no load on the weighing pan. 5. BALANCE KEYBOARD – FUNCTION KEYS Key Description Switching the instrument ON / OFF Zeroing Tarring Sending measurement result to a plugged printer or computer Function key (entering instrument’s menu) Working mode selection, (programmable key) User profile selection, (programmable key) Internal adjustment, (programmable key) - 29 - 6. SOFTWARE STRUCTURE The structure of balance’s main menu is divided into function groups. Each group comprises parameters grouped by their reference. Description of each menu group is provided further in this user manual. List of groups - Parameters Balance’s main menu is accessed by pressing SETUP function key or soft key located in the bottom tool bar of balance’s display. The menu comprises parameters referring to balance settings, functions and profiles. ADJUSTMENT USERS PROFILES DATABASES COMMUNICATION PERIPHERALS INPUTS/OUTPUTS ACCESS LEVEL OTHERS UPDATE INFORMATION ON SYSTEM - 30 - 7. SOFTWARE WEIGHING WINDOW The software’s main window is divided into 4 main sections: • The upper part of the touch panel displays data on active working mode, logged operator, date, time, active connection to a computer and current level status of a balance. • Below there is a weighing window, indicating measurement result and current measuring unit • Under which there is a grey coloured workspace containing additional data on weighing process and activities Caution: Data contained in the workspace is optionally configurable. Configuring process is described in point 15.4 of this user manual; • Below the workspace there is a set of soft keys: Caution: Balance user can declare the presence of function (quick access) keys. Declaring process is described in point 15.3 of this user manual; - 31 - 8. LOGGING Full access to balance’s parameters and editing databases requires logging to instrument’s software as an operator with <Administrator> access level. The logging procedure should be carried out on each switching on the balance. Log in procedure • While in main weighing window of the application, press <Log in> text located in the upper window bar, which opens a window with operators database including < Admin>entry, • On entering the < Admin> entry, the software activates on-screen keyboard for entering operator’s password, • Insert password “1111” and accept it by pressing • The software automatically returns to displaying the main window, and the display’s upper bar indicates word <Admin> instead of <Log in>, • After first logging in, the administrator should add user profiles and set their corresponding access level (the procedure of assigning access levels is described further in this user manual, see point 12 and 13). key, On future logging in, select a user from the list, and on entering password balance’s software initiates operation with access level set for a corresponding user. Log out procedure • While in main weighing window of the application, press name of a logged operator located in the display’s upper bar. A window with operators database is opened, • Press <Log out> soft key (located as position no. 1 in the list of operators) • The software returns to the main window, and the display’s upper bar indicates word <Log in> instead of name of a logged operator. - 32 - Access level Software of balances Y2 series provides four access levels: administrator, advanced operator, operator and none (anonymous logging). On switching on the balance, its display is constantly active, enabling carrying out mass measuring processes. These measurements, however, cannot be saved in balance’s database unless a user with at least minimal access level is logged in. The minimal access level enables carrying out mass measuring processes and saving them in balance’s databases using available function keys. Below table indicates access to editing user parameters, databases and software functions depending on active access level. Authorization None (guest) Operator Access level No access to editing all of user parameters. it is not possible to accept a weighing record nor to start a process. No access to menu <Databases>. Access to editing parameters in submenu: <Profiles; Readout> and settings in group of parameters <Others>, except for <Date and Time>. The operator can start and carry out all weighing processes, and has access to <Export weighing database to a file> and preview data in <Databases>. An operator can define universal variables. Advanced operator Access to editing parameters in submenu: <Profiles; Readout>; <Working modes>; <Communication>; <Peripherals>; <Others> except for <Date and Time>. The advanced operator can start and carry out all weighing processes, and can erase old data from the <Databases>. Administrator Access to all user parameters, functions and editing databases. - 33 - 9. OPERATING USER MENU Moving in menu of balances 3Y series is intuitive. The touch panel makes the operation of balance’s software very simple. Pressing a function key, a soft key or area on the display initiates an assigned function or process. 9.1. Terminal’s keyboard or Enter main menu Scroll menu upwards Scroll menu downwards, Fast up and down menu scrolling, Accept changes, Leave a function unchanged (without saving changes), Add items to a database, Search for items in a database by date Search for items in a database by name Search for items in a database by code Printout of an item from a database Clear the editing field Activate / deactivate on-screen keyboard Reading printout template from a file format *.lb (function key is active on plugging a data storage device to terminal’s USB port) Selection of variables from a list for a printout Moving (exiting) one level up in menu structure - 34 - 9.2. Return to weighing mode Changes in instrument’s memory are saved permanently on returning to weighing mode. Procedure: - Press mode. key for a few times, until the display indicates to the weighing - press soft key in the upper bar on the display. The software immediately returns to displaying the main window. - 35 - 10. WEIGHING Load a weighed object on balance’s weighing pan. On stabilization of weighing result, indicated by stability marker visible on the side of balance’s display, read the measurement result. Saving / printout of the measurement result is available on pressing <PRINT> key: • In case of verified balances – only stable measurement result can be saved or printed (stability marker visible on balance’s display) • In case of non-verified balances – stable or unstable measurement result can be saved or printed (regardless of stability marker presence). If unstable measurement result is printed then it is accompanied by question mark <?> in front of printed mass value. 10.1. Selection of measuring unit Change of measuring unit is carried out by pressing the measuring unit icon visible next to the value of measurement result on balance’s display. Pressing the measuring unit icon opens a list with available units. On selecting one of them, the software automatically calculates the indicated mass value to the active measuring unit. Available measuring units: denotation Verified balance [g] yes milligram [mg] yes * kilogram [kg] yes * carat [ct] yes * pound [lb] no ounce [oz] no ounce Troy [ozt] no pennyweight [dwt] no Taele Hong Kong [tlh] no Taele Singapore [tls] no Taele Taiwan [tlt] no [mom] no Grain [gr] no Newton [N] no Unit gram Momme - 36 - Tical [ti] no * - Accessibility of measuring units is conditioned by type of balance and its verification status. In non-verified balances all measuring units including those outside the International System of Units are available. 10.2. Means of correct weighing procedure In order to ensure long lasting use of a balance, correct and reliable measurement of weighed loads, follow below procedures: Start the balance with no load on the weighing pan (permissible value of load on the weighing pan on balance start is ±10% of its maximal capacity). Load the weighing pan steadily avoiding shocks: YES NO Place weighed loads centrally on the weighing pan: YES NO Avoid side loading, in particular side shocks: NO NO - 37 - 10.3. Balance leveling Balance Y2 series features AutoLEVEL System, which continuously monitors balance’s level status during its operation. The level status is signaled in the upper right corner of balance’s display. The system continuously controls level, and on detecting level change it indicates appropriate information on the display and/or signals an alarm. Then the software opens a window for adjusting the level. Balance leveling procedure • • • • Press level status pictogram< > located in the upper right corner of the display. The display indicates a control panel of leveling function. Balance operator previews level status, and balance’s top elevation. Level the balance by turning the adjustable feet in a way indicated by blinking pictograms on the display < > – the level point should move towards the center of the level circle. As the level point is in the center point, its colour changes from red to green – which is a confirmation for correct level status. CAUTION: The balance is equipped with Automatic Level Control mechanism. Description to be found in point 33.7 of this manual. 10.4. Zeroing In order to zero mass indication press key. The mass indication on the display should equal zero, and precise zero stability markers should appear. and Zeroing process is tantamount to determining new zero point recognized by the balance as precise zero. Zeroing is possible only in stable status of display indication. Caution: Zeroing the display indication is possible only within the ±2% range of instrument’s maximal capacity. If zeroed value is above the ±2% of the maximal capacity, then the software indicates an error message Err2. - 38 - 10.5. Tarring In order to determine net weight of a weighed object, place object’s container (packaging) on balance’s weighing pan, and on stabilization of measurement result press key. The display should indicate mass equal to zero and symbols: Netand . On taking off the weighed load and its packaging from instrument’s weighing pan, the display indicates sum of total tarred mass with minus sign. The software also enables assigning tare value to a product from a database. Then, on product selection from a database, the software automatically uploads data on tare value for the specific product. Caution: Tarring negative values is impossible. On tarring negative values the balance responds with an error message. In such case zero balance’s indication and repeat tarring procedure. Manual tare determination Procedure: • • • • While in optional mode press quick access key , Which opens numeric keyboard on balance’s display, Using numeric keys insert desired tare mass and press key, The balance returns to weighing mode, and the display indicates inserted tare value with minus “–“ sign. Deleting tare The tare value indicated on balance’s display can be deleted by pressing ZERO key on balance’s front panel, or using programmable function key <Deactivate tare> PROCEDURE 1 – on taking the tarred load off balance's weighing pan • Press ZERO key • The NET marker is deleted, and new zero point of the balance is determined PROCEDURE 2 – when the tarred load in on balance’s weighing pan • Press ZERO key • The NET marker is deleted, and new zero point of the balance is determined • If tare value exceeds 2% of balance’s maximal capacity, the display indicates error message –Err- (forbidden operation) PROCEDURE 3 - when the tarred load in on balance’s weighing pan or on taking the tarred load off balance's weighing pan • Press programmable key <Deactivate tare> • The NET marker is deleted, • The display indicates tare value • Press <Restore tare> key to restore the last tare value - 39 - 10.6. Weighing on dual range balances (ref. balance PS 200/2000.3Y series) Transition from weighing with accuracy of the I weighing range to weighing with accuracy of theII weighing range takes place automatically on exceeding Max1 200g (without operator’s interference). On entering the accuracy of the II weighing range, the display indicates < II> pictogram on its left side, the last digit is simultaneously blanked, and last but one digit is differentiated. From now on the balance continues weighing in the II weighing range. I weighing range II weighing range In order to return to weighing with the accuracy of the follow below procedure: • • I weighing range take the load off balance’s weighing pan; as the indication returns to zero and symbols: →0←and press →0←key. are lit up, The balance returns to weighing with readability d1=0.001g and the marker of II weighing range <II> is blanked. 10.7. Use of air buoyancy compensation factor The application enables correcting mass measurement errors during: 1. Weighing loads that density considerably differs from the density of standard used to adjusting the balance. Regularly, the balance is adjusted with a steel mass standard with density ~8.0g/cm3 or a brass mass standard with density ~8.7g/cm3. If loads made of other substances are weighed, then ratio indicated on below chart should apply. Below chart presents the value of mass correction in relation to the density of weighed load, assuming that air density is constant and equals 1.2 kg/m3. - 40 - Density of weighed load Correction value [mg] Sample mass [g] Error value in relation to density of weighed sample 2. Testing the changes of sample mass within a few hours’ time, if: sample mass is relatively constant (minor changes). In such case it is assumed, that considerable effect on the measurement result rests on air density changes, which is affected by changes of pressure, temperature and humidity. In order to carry out a reliable measurement, apart from being familiar with relations applying to ambient conditions, an operator should know the measuring methods, features of tested sample, air density in the laboratory room and density of weighed sample. FUNCTIONING The application provides two ways to use the air buoyancy compensation procedure. 1. Inserting the specified value of air density and specified value of weighed sample density to balance’s memory. On inserting these values the application automatically calculates the correction factor for weighed mass and indicates corrected value of weighed mass on balance’s display. - 41 - In order to avoid errors, the corrected mass value is accompanied by <!> symbol visible on balance’s display and a printout. 2. The application semi-automatically determines the value of air density. The specified density of the weighed sample is inserted to balance’s memory by an operator. Determination of air density is carried out using a set of two mass standards. One of them is made of stainless steel, and the other of aluminum. Based on mass indications of the two standards, the software automatically calculated the air density and saves the value in balance’s memory on operator’s confirmation. Then the density of weighed sample has to be inserted to balance’s memory. On inserting these values the application automatically calculates the correction factor for weighed mass and indicates corrected value of weighed mass on balance’s display. As in case 1, the corrected mass value is accompanied by <!> symbol visible on balance’s display and a printout. Air buoyancy conmpensation mode is enabled / disabled from the level of user menu. The application is operating in weighing mode only. STARTUP AND OPERATION OF AIR BUOYANCY COMPENSATION PROCEDURE • While in main window press grey coloured workspace • Select option <Settings> • Select parameter < Air buoyancy compensation> Accessible settings - Air buoyancy compensation – YES/NO - Sample density (insert the density value of weighed sample). If an operator uses products from databases, then on product selection its density value is automatically uploaded. - Air density – for selecting the means of inserting the air density value used for calculating buoyancy correction factor. Settings: VALUE – selecting this option opens a window for inserting determined value of air density (e.g.: determined using other methods). The inserted value is used to calculating buoyancy compensation factor. The value is assigned automatically on carrying out the air density determination (on its completion by pressing < > key). - 42 - ONLINE – selecting this option downloads current air density value from a connected THB sensor, if such is connected to the balance, or from internal sensor installed in the balance. If a balance features both types of sensors (THB module and internal sensor), then data from the THB module supersedes the other, and parameters Setup/Ambient Conditions/Ambient Conditions Module require setting to SAVE or SAVE & ALERTS mode. If a balance features only one type of the sensors for temperature, humidity and pressure recording, then correct ONLINE operation requires setting of balance parameters: − Internal sensors only - Setup/Ambient Conditions/Ambient Conditions Module set to NONE, − External THB module only - Setup/Ambient Conditions/Ambient Conditions Module set to SAVE or SAVE & ALERTS mode. Additionally, for correct balance cooperation with the THB module set port’s transmission parameters to compatible with those of the THB module. the THB module transmission parameters are detailed on its data plate. On returning to the weighing mode, the display indicates an additional symbol <!>, as indicated on below drawing.From now on the value of indicated mass is corrected including the air buoyancy compensation factor and sample density. The measurement result can only be compensated by a correct value if an operator inserts to balance’s memory the actual value on the air density and correct density of weighed sample. Caution: If the <AIR BUOYANCY COMPENSATION> mode is set to <ONLINE> value, then balance display does not indicate pictogram <!> which means that parameter Setup/Ambient Conditions/Ambient Conditions Module is set to SAVE or SAVE & ALERTS mode, and there is no physical connection between a balance and a THB module, or the parameters for communicating the module with the balance are set incorrectly. In such case plug a THB module to balance’s ports COM 1 or COM 2 and set appropriate cooperation parameters, such as specified on module’s data plate. - 43 - 10.8. Additional parameters on weighing process Changes in settings of functions related to weighing process can in some extend program balance reactions. Procedure: 1. Press grey coloured workspace 2. Balance display indicates menu: Settings, Keys, Information, Printouts, Profile 3. Press one of available submenu options and select item for modification, Menu <Settings> - additional options related to weighing mode Menu <Keys> - defining quick access keys Menu <Information> - supplementary data on weighing process displayed in the grey coloured workspace Menu <Printouts> - selection of printout type Menu <Profile> - selection of profile, active during balance operation Menu <SETTINGS> - contains supplementary data on weighing process, such as: − − Tare mode • SINGLE, mass value stored in balance memory on single pressing of TARE key, the following pressing of TARE key determines new value of tare. Selection of product or packaging with assigned tare value causes automatic deleting of previously assigned tare value; • SUM OF ACTIVE, totalizing applied tare values for a product or a packaging (resulting from selecting a product or a packaging from corresponding database) with a possibility of increasing determined tare value by manual tare introduced manually using balance’s numeric keyboard. On following determining of tare value for a product or a packaging, the tare value introduced manually is deactivated. • SUM OF ALL, totalizing all introduced tare values. • AUTOTARE Means of operation: Each first stable measurement result is tarred. The NET pictogram flashes on the display. The operator can determine net mass of weighed load. On taking off the load from balance’s weighing pan, and as the indication returns to autozero zone, the software automatically deactivates Tare value. Automatic footer printout Accessible options: MODE - No – manual footer printout, - 44 - Sum of measurements – the condition for printing a footer is exceeding mass value set in parameter <Threshold> Number of measurements – the condition for printing a footer is carrying out a pre-defined number of measurements (a batch) set in parameter <Threshold> THRESHOLD – setting the value of threshold determining footer printout. For option <Sum of measurements> the value is determined in measuring unit [g], and for option <Number of measurements> the value is not measurable, and determined by number of carried out measurements. − − Printout mode / printout release • Function key PRINT / printout release, (manual operation) Never – printout deactivated First stable – the first stable measurement is printed Each stable – all stable measurements are set for printing Each – printout of all measurements (stable and unstable), in case of a verified balance only stale measurement results are printable (as in setting <Each stable>) • AUTOMATIC MODE Never – printout deactivated First stable – the first stable measurement result obtained after placing a load on balance’s weighing pan is recorded, record of the following measurement result takes place only on unloading the weighing pan, returning of the mass indication below set threshold’s value, and placing another load on balance’s weighing pan Last stable – accepted is the last stable measurement recorded before taking the load off the weighing pan. The record takes place on taking the load off the balance’s weighing pan, and returning of the mass indication below set threshold’s value. • THRESHOLD mass value obligatory for operation of automatic printout. Set in grams. Printout Contains type of printout that is related to a working mode. Printout takes place on pressing PRINT key on balance’s overlay. Accessible options: • STANDARD PRINTOUT Possible declaration of printout content: HEADER, WEIGHING DATA and FOOTER. printout components marked as <YES> in the menu are printed on pressing printout activating function key. • NON-STANDARD PRINTOUT - 45 - Database of printouts enables selecting one of available nonstandard printouts visible in menu <PRINTOUTS>, or designing a unique printout which is automatically added to the databases. Caution: Means of designing printouts is described in point 15.5 of this user manual. − Air buoyancy compensation Contains parameters allowing the user to switch on the correction and enter data relating to density of the sample and to density of the air. CAUTION: function operates only for weighing mode. For instruction and information on air buoyancy compensation operation see point 10.7. 10.9. Minimum sample The weighing mode settings comprise a function of <Minimum sample>. The function is enabled on specifying in the database <Database/Minimum sample > parameters on methods for determining the minimum sample and the values of minimal sample weight specific for a method. In standard version, this database item is not filled in with data. Activities related to determining minimum sample and adding data to the database: <Databases/Minimum samples> are accessible only for an authorized “RADWAG” personnel. Should balance operator use the minimum sample mode, and data on minimal sample weight are not entered to balance menu, then please contact the local representative of “RADWAG” company. An authorized RADWAG representative determines the minimum sample dependent on packaging mass. The process is carried out with mass standards, in balance place of use and in accordance with the requirements of the accepted quality system. The obtained values are entered to balance software: <Databases/Minimum samples>. A minimum sample determining method may have a few tare values defined, along with assigned values of minimum samples, expiry dates of the carried out measurements and entered data. The settings are not to be edited by balance user. Using <Minimum sample> mode guarantees that the results of completed weighing processes are within set tolerance limits, and they comply with the requirements of the quality system accepted by an organization. CAUTION: the mode operates in the weighing mode only. - 46 - Available options: • METHOD It is a means for designating an accepted quality standard. Pressing a field displays a window with a list of minimal sample weight values stored in balance’s memory, following a criterion on determining the minimum sample. Adding a new method is available only from the menu level <Databases /Minimum samples> • MODE Lock – on selecting this option and during the weighing process the display indicates corresponding pictograms that inform a user whether the weighed mass is below or above the minimum sample limit. Additionally the software disables accepting the measurement result if it is below the minimum sample limit Warn – on selecting this option and during the weighing process the display indicates corresponding pictograms that inform a user whether the weighed mass is below or above the minimum sample limit. The user can accept a measurement that is below the minimum sample limit, but on a printout such measurement is preceded by an asterisk (*). CAUTION: Means of setting a method of minimum sample determining is described in point 27.9. of this user manual: <Databases /Minimum sample>. RADWAG authorized personnel is only authorized to add new values of minimum samples. Weighing with application of <MINIMUM SAMPLE> mode If during a weighing process a user wants to be informed whether a measurement exceeds the minimum sample limit for a specific weighing threshold, then the <Minimum sample> mode has to be enabled in the additional setting of the weighing mode. Procedure: 1. Press grey coloured workspace 2. The display indicates menu: Settings, Keys, Information, Printouts and Profiles 3. Select menu <Settings> - additional options on weighing process 4. Press < Minimum sample> field 5. Below window is opened - 47 - 6. Press <Method> field 7. Which opens a window containing a list of minimum sample methods stored in balance database. 8. Select one of available entries. 9. The software returns to the previous menu window 10. Press <Mode> field 11. Which opens a window with parameter settings. Select one of below options: Lock – on selecting this option and during the weighing process the display indicates corresponding pictograms that inform a user whether the weighed mass is below or above the minimum sample limit. Additionally the software disables accepting the measurement result if it is below the minimum sample limit Warn – on selecting this option and during the weighing process the display indicates corresponding pictograms that inform a user whether the weighed mass is below or above the minimum sample limit. The user can accept a measurement that is below the minimum sample limit, but on a printout such measurement is preceded by an asterisk (*). 12. On setting the parameters exit the menu. 13. The mass field on the display is supplemented by an additional informative pictogram. The pictogram changes during weighing process and indicates current status of mass in relation to the pre-determined value of minimum sample. sample - Mass below the set value of minimum - Mass above the set value of minimum sample for a given tare range - 48 - Meaning of the pictograms of minimum sample mode: Mass below the set value of minimum sample. Mass above or equal to the value of minimum sample. Mass below the set value of minimum sample. A pictogram with a clock informs on approaching expiring of the validity period of the minimum sample (it is displayed two weeks before the determined expiry date). Mass above the set value of minimum sample. A pictogram with a clock informs on approaching expiring of the validity period of the minimum sample (it is displayed two weeks before the determined expiry date). The validity term of the minimum sample has expired. Changes are needed in the minimum sample settings. Only authorized RADWAG personnel can change the minimum sample settings. Caution: If more than one reference tare value is programmed (with corresponding minimum sample mass) then the indicated value automatically moves to a range corresponding to the weight of the tarred container. At the same time the required minimum mass is changed. - 49 - 11. ADJUSTMENT Balances 3Y series feature automatic internal adjustment system which ensures correct measurement accuracy. Menu <ADJUSTMENT> contains functions controlling operation of balance adjustment process, including options: 11.1. Internal adjustment Internal adjustment process utilizes an internal weight built in balance’s housing. <Internal adjustment> function key activates automatic adjustment process. On its completion, balance’s display indicates a message box on process completion and its status. CAUTION: Balance adjustment requires stable measurement conditions (free from air breeze and vibrations), adjustment process has to be carried out with empty weighing pan. 11.2. External adjustment External adjustment is carried out using an external adjustment weight, with appropriate accuracy and mass relating to balance’s maximal capacity and readability. The process takes place semi-automatically, and the following process phases are indicated on balance’s display. CAUTION: External adjustment is available only in balances which are not subject to conformity assessment (verification). Process course: • Enter submenu < Adjustment > and select option: “ adjustment”, • Balance’s display indicates the following message box: • If there is a load on balance’s weighing pan, unload it, External Press key. The balance determines start mass, which is indicated by a message box: “Start mass determination” on balance’s display • On determining the start mass, the balance display’s a message box: • - 50 - • Acting according to the command, place an ordered weight/standard on balance’s weighing pan and press key, • On completing the adjustment procedure the balance indicates a message box: • On confirming the message box with weighing mode. key, the balance returns to 11.3. User adjustment User adjustment is carried out with an optional standard, which mass ranges between 0,15 Max and Max. Adjustment procedure is compatible with the external adjustment process, but before its start the software opens a message box for entering mass of a standard used for user adjustment. CAUTION: User adjustment is available only in balances which are not subject to conformity assessment (verification). In order to start user adjustment, enter submenu < Adjustment >, and select option: “ User adjustment”. Then follow the commands indicated on balance’s display. 11.4. Adjustment test < Adjustment test > function enables comparing the result of internal automatic adjustment with the value of internal weight saved in balance’s factory parameters. The comparison is used for determining balance’s sensitivity drift over time. 11.5. Automatic adjustment This menu option is used for selecting a factor which determines start of automatic adjustment process. Accessible options: None – automatic adjustment disabled - 51 - Time – adjustment takes place in time intervals declared in menu <Automatic adjustment time > (11.6) Temperature – adjustment is triggered by temperature change only Both – adjustment activation is triggered both by temperature changes and time interval changes CAUTION: Changing the settings of automatic adjustment is enabled only in balances which are not subject to conformity assessment (i.e. non-verified balances). 11.6. Automatic adjustment time < Automatic adjustment time > determines time interval in which automatic internal adjustment of a balance is activated. The time interval is declared in hours and ranges between 1 and 12 hours. Setting time interval of automatic internal adjustment: Select option < Automatic adjustment time > Using displayed menu select appropriate time interval (given in hours) which is a time gap elapsing from the last carried out internal automatic adjustment until activating the following automatic internal adjustment. CAUTION: Changing the settings of automatic adjustment is enabled only in balances which are not subject to conformity assessment (i.e. non-verified balances). 11.7. Adjustment report printout Parameter < Report printout > determines whether or not a report on automatic internal adjustment should be automatically printed on its completion. Setting automatic report printout on adjustment completion. Go to parameter: < Report printout > and select option <YES>. 11.8. GLP project GLP is one of means for maintaining documentation from work in accordance with adopted quality system. Data selected for printing are printed on each release of a report on balance adjustment. Balance operator can use in a GLP report below listed information and signs: adjustment (adjustment mode) working mode (name of a working mode) date, time, user, balance type, balance ID, level status, nominal mass, current mass difference temperature, - 52 - blank line, dashes, signature, non-standard printout. 11.9. Adjustment history Contains data on all carried out adjustment processes. The record is carried out automatically. Each entry on adjustment comprises basic data on completed process. Balance menu enables displaying the list of completed adjustment processes, and each report is printable. Printing a report on adjustment process. Enter submenu < Adjustment >, and: <Adjustment history>, then select for printing adjustment entry from a list. On displaying details of a record, press print soft key < > on display’s upper bar. Hint: If memory for records on completed adjustments is full, then the oldest record is automatically erased. If internal procedures of an organization require maintaining complete documentation from all carried out adjustment processes, then the list with records on adjustment should be periodically printed and filed. Searching for adjustment record Balance enables searching for a specific record from completed adjustment processes: – Press search icon and insert date of adjustment process. Exporting data on completed adjustment process Connect a data storage device to balance’s USB port. Press<Data export> key located in the upper right corner of balance’s display. The process is fully automatic, and on its completion, a file with extension *.tdb is saved on a data storage device connected to the USB port. The file is editable using Excel spreadsheet or a text editor. - 53 - 12. USERS Menu “Users” contains list of balance operators, who are authorized to operate the instrument. The following data can be defined for each balance user: Name Code Password Access level Language Profile Card no. Adding new user can only be carried out by balance’s Administrator. Procedure of adding a new user: In menu Users press <Add> soft key, − Which opens a message box on the display:<Create new record>, accept by pressing corresponding key − Define all necessary fields for a new created balance user Caution: Search for a user in database of users by code or name. Edit data on a user: − Press field with name of a user − The display indicates data on a specific user − Select and change necessary data Deleting a user can only be carried out by balance’s Administrator. To delete a user: − Press and hold user name − A menu is opened referring to a user record − Select option <Delete> - 54 - 13. ACCESS LEVEL Access level in a balance determines scope of activities that a user can carry out. This menu can only be modified by balance’s Administrator. Anonymous user Balance Administrator can grant access level to a balance user who is not logged in (i.e. Anonymous user). Procedure: Enter group of parameters < Access level>, select option < Anonymous user>, and set appropriate access level for the anonymous user. Available access levels for an anonymous user: Guest, User, Advanced User, Administrator. Caution: Setting <Guest>access level causes that logged user has no permission to change any settings on a balance. Date and time Balance default settings enable a user logged as the Administrator changing date and time settings. However, the software also enables changing required access level to modify option < Date and time>. Procedure: Enter group of parameters < Access level>, select option < Date and time>, and set desired access level required to modify the settings. Available access levels for changing date and time settings are: Guest, User, Advanced User, Administrator. Caution: Setting <Guest> provides free access to date and time settings (no need to log in). Printouts Balance default settings enable a user logged as the Administrator editing default printout templates. However, the software also enables changing required access level to modify option < Printouts>. Procedure: Enter group of parameters < Access level>, select option < Printouts>, and select one of available options: Guest, User, Advanced User, Administrator. Caution: Setting <Guest>access level provides free access to printouts settings (no need to log in). - 55 - Databases Balance Administrator is also authorized to set access level required to modifying each of the databases. Procedure: Enter group of parameters < Access level>, select option < Databases>, and set desired access level: Guest, User, Advanced User, Administrator for each of the databases. Caution: Setting <Guest>access level causes that access to editing each of the databases is free. - 56 - 14. PROFILES A Profile is a data pack determining: o o o o o functioning of working modes, e.g. parts counting, percent setup, etc., what data is displayed during working mode operation, which function keys are active, which measuring units are accessible which criteria are mandatory for balance’s speed of operation and measurement stability, Balance software enables creating numerous profiles, which in practice provides: o each balance user to create their own and individual operating environment o balance operation can be easily programmed by activating function keys and information on process which are (improving ergonomics of operation) 14.1. Creating a profile A default profile in a balance is named <Home>. Balance Administrator can create new profiles by: − Copying an already existing profile and its modification, − Creating a new profile. Copying an existing profile Procedure: • Enter balance’s main menu by pressing Setup key, • Enter submenu < Profiles>, • Press and hold an entry with profile name that should be copied, • A menu is opened referring to available options: o Edit o Delete o Copy o Cancel • Select option <Copy> • A new profile is created named <Copy name>, and all setting are identic with the copied profile, • After copying change necessary data in a profile: (name, etc.) Creating a new profile Procedure: • Enter balance’s main menu by pressing Setup key, • Enter submenu < Profiles>, Press key, which opens a message box: <Create new record?>, • Accept the message box by pressing key. The software automatically adds a new record and enters its editing mode. • Caution: Adding a profile is only enabled after logging in as an Administrator. - 57 - Deleting a profile Procedure: • Enter balance’s main menu by pressing Setup key, • Enter submenu < Profiles>, • Press and hold an entry with profile name that should be deleted, • A menu is opened with a list. Select option <Delete> from the list, • A message box is displayed which requires confirming profile’s deleting: <Confirm to delete>, • Accept the message box by pressing key, the profile is deleted. Caution: Deleting a profile is only enabled after logging in as an Administrator. 14.2. Profile structure Each profile contains the following entries: Settings Working modes Readout Units This menu enables setting an individual profile’s name (a sequence of alphanumeric characters), and declaring a default working mode (the selected mode is activated as default on profile selecting). Contains the following submenu: Additional setting of a working mode Function keys Displayed information Printouts Contains the following submenu: Filter Value release Autozero Autozero: Dosing Last digit Menu enables declaring the start unit, the supplementary unit, 2 custom units and entering the value of gravitational acceleration force in balance’s operation place. - 58 - 14.2.1. Settings Name On entering this option, the display opens a message box with keyboard. Insert name of a profile and accept it by pressing key. The name is assigned to the profile. Default working mode On entering this option the user can select a specific working mode, which is set as default in a profile. In case option <None> is selected, then on selecting the profile, the balance activates last used working mode. 14.2.2. Working modes On entering this option, the display opens a window containing all accessible working modes. The user can introduce their settings to each of the working modes which are activated on selecting a specific profile. In each of the working modes, the user can change the following parameters: Settings contain specific parameters relating to a working mode and universal settings, such as: result control, tare mode, automatic footer printout, printout mode, printout. Functions of quick access keys declaring quick access keys, which are visible in the bottom display bar Information declaring information which is visible in the grey coloured workspace Printout declaring type of printout of defining a non-standard printout 14.2.3. Readout The function enables the user to adjust balance operation to ambient conditions (filter settings) or individual user needs. Menu <Readout> contains the following elements: FILTER Each measurement signal before being displayed is electronically processed for the purpose of obtaining corrected parameters specific for stable measurement result, i.e. ready to read. - 59 - Balance user can influence to some extend the range of signal processing by selecting an appropriate FILTER value. Available options: o very fast o fast o average / normal o slow o very slow While setting the filtering level the user should consider the actual operating conditions of a balance. In case of very good operating conditions set the filter to average/normal or fast, in case of rough conditions set the filter to slow or very slow. Caution: in case of precision balances 3Y series the recommended range of filter is between very fast ÷ average/normal; in case of analytical balances and microbalances 3Y series the recommended range of filter is between average/normal ÷ very slow. Value release This parameter determines displaying the stability marker for a measurement result. There are 3 available settings of value release parameter o fast o fast + reliable /recommended/ o reliable Caution: The speed of stability marker occurrence depends on applied filter value and applied value release Autozero function The function is to automatically monitor and correct zero indication of a balance. If the function is enabled, the following measurement results are compared to each other in constant time intervals. If the results differ less than declared AUTOZERO range, e.g. 1 division, the balance is automatically zeroed, and the markers of stable indication and precise zero are displayed. Active AUTOZERO means, that each measurement starts from the precise zero point. There are, however, cases where the function may disturb the weighing process. For instance during very slow load placing or pouring onto the balance’s weighing pan. In such case, the correcting system of zero indication may also correct the actual indication of a load placed on the weighing pan. Accessible settings: NO - autozero function disabled YES - autozero function enabled - 60 - Autozero function: Dosing The function sets autozero operation mode to default one set for dosing mode. Accessible values: NO - autozero operation is automatically disabled on entering dosing mode YES - autozero operation is automatically enabled on entering dosing mode Last digit The function determines visibility of the last decimal place indicated on measurement result. The functions provides three settings: - ALWAYS: al the digits visible NEVER: last digit invisible WHEN STABLE: last digit visible only for a stable measurement Ambient conditions This parameter refers to ambient conditions of the balance. By default the parameter is set to value Stable but it is advisable to set the parameter to value Unstable for unstable ambient conditions. Stable setting results in faster operation, i.e. weighing takes much less time than in case of setting to value unstable. − − 14.2.4. Unstable Stable Measuring units Balance user can declare in a profile: start unit, supplementary unit and two custom measuring units. A custom measuring unit features: o A multiplier o A name (3 characters) If a custom unit is designed, then its name is added to the list of accessible measuring units. This menu additionally enables inserting the value of gravitational acceleration force for balance’s place of use. It is obligatory should a balance be used to determine mass in [N]. - 61 - 15. WORKING MODES – general information A balance 3Y series in its standard version features the following working modes: Weighing Means of operation: weight of a load is determined through an indirect measurement. A balance measures gravitational force which attracts the load. An obtained result is processed to a digital format and displayed in a form of measurement result. Parts counting Means of operation: based on a determined mass of a single part it is possible to count another parts, assuming that mass of a single part is determined with sufficient accuracy, and that the following parts are equal in mass. Checkweighing Means of operation: control of sample mass with applied thresholds. A user should specify the value of low threshold <LO> and high threshold <HI>. Dosing Means of operation: a user should specify sample’s target mass to be obtained by pouring. Percent setup Means of operation: control of percent ratio of a sample in relation to a standard (reference). Obtained data provides percent ratio on how test sample differs from the accepted standard (reference). Density Means of operation: based on Archimedes principle, a balance determines density of solids and liquids. The mode requires an optional density determination kit. Animal weighing Means of operation: mass measurement takes place with application of filters dampening animal moves on a weighing pan, thus enabling obtaining a correct measurement result. Formulation Means of operation: by adding a sequence of ingredients, a user can prepare an optional mixture or formulation. Before mixing balance software requires designing a formulation by specifying its ingredients and their mass. Statistics Means of operation: carried out measurements are used to calculate statistical data, such as Min, Max, deviation, etc. Pipette calibration Means of operation: calibration of pipettes according to procedures listed in ISO 8655 or according to user - 62 - requirements. Differential weighing Means of operation: analysis of mass sample change over time. Statistical Quality Control Working mode is intended to carrying out different types of product packing processes and aimed at monitoring and / or controlling the packing process. It enables detecting excess or lack of product quantity in a packaging. Control of Prepacked Goods Working mode intended for CPG (Control of Prepacked Goods) processes in accordance with the regulation on prepacked goods. (mode not available in balance’s standard version) Mass control Working mode intended to carrying out quick statistical control of samples in accordance with the requirements on a quality system and/or internal standards. (mode not available in balance’s standard version) The settings of separate working modes include special functions specific to a mode. They enable adapting mode’s operation to user’s individual needs. The special settings are activated on selecting a corresponding profile. A detailed description of special functions is provided while presenting each of working modes. 15.1. Working mode selection Changing working mode: o Press name of active working mode, displayed in the left corner of the upper bar. o List of available working modes is displayed, o Select name of a desired working mode, and press it. - 63 - 15.2. Parameters related to working modes Each working mode has programmable parameters determining its functioning. Procedure of determining these parameters: 1. Press grey coloured workspace area 2. Below menu is displayed: o <Settings> - additional options related to a mode o <Keys> - defining quick access keys o <Information> - selecting information displayed in the workspace o <Printouts> - selecting type and content of a printout o <Profile> - selecting a profile, which is active during balance’s operation 3. Press corresponding menu item and select area for modification, Description of basic parameters accessible in <Settings> tab is provided in point 10.8 of this user manual “Additional parameters on weighing process”. Other parameters specific to each of working modes are presented in working modes description. 15.3. Quick access keys Balance user can define up to 7 quick access keys, which are displayed in the bottom bar. On assigning a function to a specific key, a corresponding soft key appears, and it is located in the bottom navigation bar of the main window. It is a so called quick access key, dedicated for most often used functions and processes. - 64 - 15.3.1. Proximity sensors The balance comprises two proximity sensors enabling wave control of the balance therefore the user does not have to either press any key on the overlay or touch the screen. The program recognizes 4 types of motions performed near the sensor: 1. Placing hand near the left sensor <Left proximity sensor> 2. Placing hand near the right sensor <Right proximity sensor> 3. Motion to the left <Proximity sensor: left motion> 4. Motion to the right <Proximity sensor: right motion> To each of the motions, one of the available options may be assigned: [None; Profile; Adjustment; Zeroing; Tarring; Tare setting; Tare switch off; Reset tare; Packaging; Print; Header printing; Footer printing; Unit; Universal Variable 1; Universal Variable 2; Universal Variable 3; Universal Variable 4; Universal Variable 5; Confirm; Abort; User; Left door; Right door; Open/Close door; Parameters; Product, Warehouse; Client]. The selected option is recognized by the program and performed when activated by a particular motion. In order to ensure correct operation the user must remember to set the right sensors sensitivity (for more information refer to point 33.8 of this manual titled Sensors sensitivity). 15.3.2. Automatically opened door This menu section comprises settings on automatic opening and closing door of a balance featuring such mechanism, i.e. balances MYA 3Y and XA 3Y.A series. The settings may refer to the quick access keys as well as the infrared proximity sensors located on the overlay of balance’s terminal. Settings for a balance MYA 3Y series cover: o Left door / the option enables changing the position of the door on the left side of the weighing chamber o Right door / the option enables changing the position of the door on the left side of the weighing chamber o Open / Close door / the option enables changing the position of the door, e.g. if the weighing chamber is opened, then activating the option causes closing it. If the weighing chamber is closed, then activating the option causes opening the door located on the right side of the weighing chamber, Settings for a balance XA 3Y.A series cover: o Open / the option enables opening the door of the weighing chamber o Close / the option enables closing the door of the weighing chamber o Open / Close door / the option enables changing the position of the door, e.g. if the weighing chamber is opened, then activating the option causes closing it. If the weighing chamber is closed, then activating the option causes opening the door of the weighing chamber. - 65 - 15.4. Information Information on weighing process is displayed in the grey coloured workspace. It contains maximally 6 pieces of information. If larger amount of data is selected, then only the first 6 are displayed. Each parameter features two options: - YES, information enabled (displayed in the workspace) - NO, information disabled 15.5. Printouts Menu printouts comprises two separate sections. The first one is standard printouts, the other one is non-standard printouts. Standard printouts comprises three internal sections featuring different variables. For each variable set option YES to include it in a standard printout. If option NO is selected, then the variable is disabled, i.e. it is not printed. PROCEDURE: 1. Press field with name of a template to be edited(Header – Weighing – Footer) and select variables to be printed 2. If a printout is a non-standard one, create it. o HEADER − Dashes − Working mode − Date − Time − Balance type − Balance ID − User − Level status − Client − Warehouse − Product − Packaging − Universal variable 1 … 5 − Empty line − GLP report − Non-standard printout - 66 - o WEIGHING − N (number of measurements) − Date − Time − Level status − Client − Warehouse − Product − Packaging − Universal variable 1 … 5 − Net − Tare − Gross − Current measurement result − Supplementary weighing unit − Mass − Non-standard printout o FOOTER − Working mode − Date − Time − Balance type − Balance ID − User − Level status − Client − Warehouse − Product − Packaging − Universal variable 1 … 5 − Dashes − Empty line − GLP report − Signature − Non-standard printout BASIC PRINCIPLES OF USING PRINTOUTS 1. Press PRINT key on balance’s overlay to print variables that are contained in section WEIGHING of the standard printout, and if they are attributed = YES (see above list of variables in printouts). 2. Variables attributed as YES present in the HEADER and FOOTER are printed ONLY on pressing Print Header and Print Footer soft keys. The soft keys have to be added to the bottom bar of the display, as quick access keys. Adding quick access keys on the bottom bar of the display is described in point 15.3 of this user manual. - 67 - Print data from header Print data from footer Caution: Measuring units for printing mass indication: − Net – main measuring unit (adjustment unit) − Tare – main measuring unit (adjustment unit) − Gross – main measuring unit (adjustment unit) − Current result – currently displayed measuring unit − Supplementary unit – supplementary measuring unit − Mass – main measuring unit (adjustment unit) Non-standard printout Non-standard printout a printout may contain: TEXTS and VARIABLES(which are acquired from the software on printout). Each non-standard printout is a separate project, featuring specific name, by which it is identified, and saved in the database of printouts. PROCEDURE: 1. Press option <Non-standard printout> 2. Press <Add> key 3. A window is opened with data such as Name/Code/Project 4. Set name and code of a printout 5. Press <Project> key 6. A keyboard is opened on the display for editing the printout 7. Use keyboard to design printout template, the printout may contain texts and variables. Caution: User can add a printout by importing configured texts from data storage devices connected to balance’s USB port. Printout’s name is ONLY a NAME, and it is not part of its content. Means of designing a non-standard printout template is described in point 24.11 <Printouts> of this user manual 15.6. Profiles Profiles are described in point 14, Profiles, of this user manual. - 68 - 16. PARTS COUNTING Working mode< Parts counting> enables determining quantity of small parts (objects) with equal part mass. Counting is based on determined mass of a single part, which is: o determined from a reference quantity of parts o acquired from database of products o inserted manually as a numeric value Working mode activating procedure • while in the main window, press soft key located in the upper bar of the display, which opens a submenu <Working modes> with selection of available working modes, • select < Parts counting> mode, the software automatically returns to the main window and displays The o o o o o pictogram in the upper bar. grey coloured workspace contains the following data: Gross Standard mass Low threshold High threshold Target value On selecting the parts counting mode, the display contains the following quick access keys in the bottom bar: 1. 2. 3. 4. Setup – access to balance’s menu Print header – print of data declared in the header Print footer – print of data declared in the footer Database of products – selection of products from corresponding database 5. Give mass of 1 part – editing field for inserting mass of a single part 6. Set mass of 1 part – setting mass of a single part from optional number of parts, e.g.: from 10 pcs, 20 pcs, 75 pcs, etc. - 69 - 16.1. Additional settings of part counting mode The additional settings enable adjusting the working mode to user’s needs and requirements. To access the setting follow below procedure: Procedure: 1. Press grey coloured workspace, 2. The display indicates menu of: Settings, Keys, Information, Printout and Profile 3. Press <Settings> key 4. The display indicates functions related to weighing and parts counting modes. Parts counting mode features the following optional functions: − ACAI, Automatic Accuracy Correction: o YES, mass of a single part is updated during counting process o NO, mass of a single part is not updated Means of operation of ACAI function: 1. Number of parts (on adding) on balance’s weighing pan has to be greater than has been previously. 2. Number of parts (on adding) on balance’s weighing pan must be less than twice the amount of which was visible on the display before adding parts. 3. Current quantity of parts must be within the ± 0,3 tolerance of the total value. 4. Measurement result has to be stabilized. − Minimal reference mass: 1unit, 2units, 5units, 10units, it is the minimal mass value of a single part. Unless the condition is met, counting process cannot start. − Result control: o YES, print and save only those measurements which are included within the Lo and Hi thresholds. o NO, all measurements are printed and saved. Other functions of menu <Settings>: − Tare mode − Automatic footer printout - 70 - − Printout mode / Value release − Printouts Means of using the above functions are given in point 10.8. “Additional parameters on weighing process”. 16.2. Parts counting – quick access keys Each of working modes features a set of default quick access keys, which are automatically displayed on mode activation. The set of keys can be modified by selecting other quick access keys to the bottom bar of the display. Such process requires appropriate operator’s access level. 16.3. Setting standard (reference) mass by inserting determined part mass Procedure: • Press < Give mass of 1 part> key, which opens an editing window <Reference mass> with an on-screen keyboard, • Insert value of a single part and accept it by pressing key, the balance returns to working mode < Parts counting> with automatic accuracy correction function enabled. Caution: In case the single part mass is determined as lower than 0,1 of balance’s reading unit, the balance display’s a message: <Value too low>. 16.4. Setting standard (reference) mass by weighing Procedure: • Place a container on balance’s weighing pan and tare its mass, Press < Set mass of 1 part>, which opens an editing window <Reference quantity> with an on-screen keyboard, • Insert desired value (number of parts) and accept by pressing key, which displays a command: <Load: xx parts> (where xx – denotes set value of parts), • • Load requested number of parts on the weighing pan. On stabilization of measurement result ( pictogram visible on the display) accept the mass by pressing key, • The software automatically recalculates mass of a single part, moves to < parts counting> mode and displays number of parts loaded on the weighing pan with unit (pcs). Caution: Remember: • Total mass of all parts loaded on the weighing pan must not exceed the maximal capacity (weighing range) of the balance; - 71 - • Total mass of all parts loaded on the weighing pan must not be lower than value declared in parameter “Minimal reference mass”. Unless this condition is met, the balance displays a message: <Too low sample mass>; • Mass of a single part must not be lower than 0,1 of balance’s reading unit. unless this condition is met, the balance displays a message: <Too low part mass >. 16.5. Acquiring part mass from database A product record in the database of products features set of information which identifies it. One of them is mass, which is used during part counting process. Procedure: When in working mode < Parts counting> press < Products database> key, and then select desired product from displayed list. Insert standard (reference) mass to balance’s memory Procedure for adding standard (reference) mass of a single part to the database of products: a) b) c) d) Press < Setup > key followed by pressing < Database > key In the Database of Products press < Products > Press name of a product and edit data in field no. [5] Mass Return to <Parts counting> mode. If there are no data in the database: a) Press < Setup > key followed by pressing < Database > key b) c) d) e) In the Database of Products press < Add > key Accept the process of adding a new record in the database Fill in field referring to a product, including field no. [5] Mass Return to <Parts counting> mode. 16.6. Updating part mass in the database Determined mass of a single part can be assigned to a product in the database of products. This option is applied while using ACAI (Automatic Accuracy Correction) function in order to determine part mass with high accuracy. Procedure: a) Determine mass of a single part b) Press < Database> key c) Press and hold finger on name of a product, which mass is updated, d) Contextual menu is displayed, - 72 - e) Select option <Assign standard>, reference mass is saved in a product record under entry <Mass>. 16.7. Parts counting procedure The first step in parts counting mode is obtaining data on mass of a single part. Select one of available options: − Give mass value of a single part (see point 16.3) and place parts on balance’s weighing pan, balance displays totalized parts. − Set mass of a single part from a given quantity of parts (see point 16.4.), the balance additionally shows pictogram of the ACAI function < > (if enabled). Place parts on balance’s weighing pan, the balance displays totalized parts. − Acquire mass of a single part from database of products (see point 16.5.) by selecting a desired product record. Place parts on balance’s weighing pan, the balance displays totalized parts. Caution: All additional elements (i.e. packaging) have to be tarred before starting the parts counting process. 16.8. Checkweighing function in parts counting mode Parts counting process can be aided by checkweighing function, i.e. control whether indication is within set thresholds. Checkweighing requires setting values of two thresholds, described as: − LOW threshold [Min= … parts] − HIGH threshold [Max= … parts] and enabling bargraph (set its attribute to YES), which displays below relation: CURRRENT NO. OF PARTS / CHECKWEIGHING THRESHOLDS. Defining the values of Low and High thresholds is carried out in the Database of Products while editing Product entry, or using a quick access key < Defining thresholds>. - 73 - Procedure Press grey coloured workspace and press option <Information> Set Bargraph option to YES, return to parts counting mode Press grey coloured workspace and press option <Keys> Assign <Checkweighing thresholds> option to one of the quick access keys displayed in the bottom bar • Return to parts counting mode • • • • Press < Checkweighing thresholds> key and insert values for LOW and HIGH thresholds, return to parts counting mode • Under the measurement result there is bargraph displayed. Colour of the bargraph corresponds to the status of parts counting process. o Yellow bargraph’s colour: current number of parts below set value of Low threshold o Green bargraph’s colour: current number of parts within set value of thresholds o Red bargraph’s colour: current number of parts above set value of High threshold • 16.9. Dosing function in parts counting mode Parts counting process can be aided by dosing function, i.e. control whether indication does not exceed set target value. Dosing requires setting a value, which is the target, for instance 100 parts, and percent tolerance from the target value. The target value is displayed as a bracket on a bargraph. Defining the value of target mass is carried out using a quick access key < Target Value>. Procedure Press grey coloured workspace and press option <Information> Set Bargraph option to YES, return to parts counting mode Press grey coloured workspace and press option <Keys> Assign <Target Value> option to one of the quick access keys displayed in the bottom bar • Return to parts counting mode • • • • - 74 - Press < Target Value > key and insert number of parts recognized as the target value, • If tolerance applies, set its value (range between 0 – 100%) • Under the measurement result there is bargraph displayed, containing: o Current number of parts on the weighing pan (marked with colours – see point 16.7.) o The value of Target Mass (black marker) • Caution: The checkweighing and dosing functions can operate simultaneously in the parts counting mode. In such case the dosing tolerance is controlled by Lo and Hi thresholds of the checkweighing function. - 75 - 17. CHECKWEIGHING Working mode< Checkweighing > enables controlling sample mass using two threshold (Low and High). Usually it is accepted, that mass indication is correct if it is included within the thresholds’ values. Working mode activating procedure • While in the main window, press soft key located in the upper bar of the display, which opens a submenu <Working modes> with selection of available working modes, • Select < Checkweighing> mode, the software automatically returns to the main window and displays pictogram in the upper bar. The o o o o grey coloured workspace contains the following data: Supplementary unit Low threshold High threshold Difference – denoting the “distance” of current measurement result from the center of Lo-Hi section On selecting the checkweighing mode the display contains the following quick access keys in the bottom bar: 1. 2. 3. 4. Setup – access to balance’s menu Print header – print of data declared in the header Print footer – print of data declared in the footer Database of products – selection of products from corresponding database 5. Set tare – field for setting numeric value of tare 6. Checkweighing thresholds – for declaring the values of Low and High threshold - 76 - 17.1. Use of checkweighing thresholds Use of checkweighing thresholds can be carried out by: − Selection of Product < already set > for which Low and High thresholds have been − Inserting the numeric value of thresholds < >, in this case the thresholds are not referred to any product from database PROCEDURE 1 – Selection of product from Database of Products Press < Database of Products> quick access key Using list of products select one to be weighed Automatically, in the grey workspace the values of thresholds are displayed • Under the measurement result there is bargraph displayed. Colour of the bargraph corresponds to the current status of mass: o Yellow bargraph’s colour: mass value below Low threshold o Green bargraph’s colour: mass value within set value of thresholds o Red bargraph’s colour: mass above set value of High threshold • • • PROCEDURE 2 – manual inserting checkweighing thresholds Press < Checkweighing thresholds> quick access key Press Low Threshold key and determine its value • Accept set value by pressing < > key • Press High Threshold key and determine its value • Accept set value by pressing < > key • • Caution: The value of High threshold has to be bigger than the value of Low threshold. 17.2. Additional settings of checkweighing mode The additional settings enable adjusting the working mode to user’s needs and requirements. To access the setting follow below procedure: Procedure: 1. Press grey coloured workspace, 2. The display indicates menu of: Settings, Keys, Information, Printout and Profile, 3. Press <Settings> key, 4. The display indicates functions related to checkweighing: − Result control − Tare mode − Automatic footer printout − Printout mode / Value release − Printout Means of using the above functions are given in point 10.8. “Additional parameters on weighing process”. - 77 - 18. DOSING Working mode< Dosing> enables carrying out the sampling process, until obtaining a pre-defined target mass. Working mode activating procedure • while in the main window, press soft key located in the upper bar of the display, which opens a submenu <Working modes> with selection of available working modes, • select < Dosing > mode, the software automatically returns to the main window and displays pictogram in the upper bar. The o o o o o grey coloured workspace contains the following data: Tare Gross Target value Tolerance – percent [%] value related to the target value Product On selecting the dosing mode, the display contains the following quick access keys in the bottom bar: 1. 2. 3. 4. Setup – access to balance’s menu Print header – print of data declared in the header Print footer – print of data declared in the footer Database of products – selection of products from corresponding database 5. Set tare – field for setting numeric value of tare 6. Target value – for declaring the Target value of dosing process - 78 - 18.1. Use of database of products in dosing process When weighing, it is possible to use the value of target mass assigned to a product in the database of products or temporarily determine custom target values of mass. In the database of products, target mass of a product is its mass field. PROCEDURE 1 – Selection of product from Database of Products Press < Database of Products> quick access key Using list of products select one to be weighed Automatically, in the grey workspace the target value and the tolerance value are displayed • The display indicates the negative value of the target value • • • • Under the measurement result there is bargraph displayed. Colour of the bargraph corresponds to the current status of mass : o Yellow bargraph’s colour: mass value below the Target Value – Tolerance o Green bargraph’s colour: mass value within the tolerance field: Target Value +/- Tolerance o Red bargraph’s colour: mass above the Target Value + Tolerance PROCEDURE 2 – manual inserting the value of target mass • • • Press < Target value > quick access key In an opened window give the target value and tolerance Return to weighing - 79 - Caution: If the Target Value is acquired from the Database of Products, then fields Target Value and Tolerance contain data referring to selected product. The data can be edited and modified. 18.2. Additional settings of dosing mode The additional settings enable adjusting the working mode to use’s needs and requirements. To access the setting follow below procedure: Procedure: 1. Press grey coloured workspace, 2. The display indicates menu of: Settings, Keys, Information, Printout and Profile, 3. Press <Settings> key, 4. The display indicates functions related to dosing process: Result control, Tare mode, Automatic footer printout, Printout mode / Value release, Printouts Means of using the above functions are given in point 10.8. “Additional parameters on weighing process”. - 80 - 19. PERCENT SETUP Working mode< Percent setup> enables comparing weighed load to a reference mass (standard). The process is expressed in percent [%]. Additionally, the percent setup process can be aided by DOSING and CHECKWEIGHING processes. The supplementary modes and a bargraph are not enabled automatically. Working mode activating procedure • while in the main window, press soft key located in the upper bar of the display, which opens a submenu <Working modes> with selection of available working modes, • select < Percent setup> mode, the software automatically returns to the main window and displays pictogram in the upper bar. The o o o o o grey coloured workspace contains the following data: Supplementary unit Gross Reference mass (standard) Low threshold – percent [%] value of the Reference Mass (Standard) High threshold – percent [%] value of the Reference Mass (Standard) On selecting the percent setup mode the display contains the following quick access keys in the bottom bar: 1. 2. 3. 4. Setup – access to balance’s menu Print header – print of data declared in the header Print footer – print of data declared in the footer Database of products – selection of products from corresponding database 5. Percent setup: set reference mass (standard) 6. Percent setup: set as 100 % - 81 - 19.1. Comparison of sample and (reference) mass standard Comparison of samples with a mass standard can be carried out through: − Giving mass of a standard, using < Give reference mass> soft key; − Accepting current mass loaded on the weighing pan as a reference mass, using < Set as 100%> soft key; − Selecting a product from database of products, where parameter mass of a product entry is defined, using < key. Database of Products> soft PROCEDURE 1 – manual declaration of reference mass Press < Give reference mass > soft key In an opened window type in value of reference mass and accept it by pressing < > key • All weighed products are compared with the reference mass, and the display indicates difference between weighed objects in [%]. • • PROCEDURE 2 – accepting currently loaded mass as reference (standard) • Place a sample on balance’s weighing pan On stabilization of measurement result press < Set as 100%> soft key • The display indicates 100.000%, mass is accepted as reference, and automatically saved in (reference) mass standard field. • Unload the sample from balance’s weighing pan • All samples weighed afterwards are compared with the reference mass, and the display indicates the difference, expressed in [%], for each weighed sample in relation to the reference mass. • PROCEDURE 3 – selecting a product from Database of Products Press < Database of Products> soft key, select a product entry to be weighed from a list of displayed products • On selecting, the grey coloured workspace automatically updates its content with data on Reference Mass • Mass of the weighed product is automatically inserted in field: reference • • • mass, which is activated by pressing < > soft key The display indicates 0.00 % (if the weighing pan is unloaded) All samples weighed afterwards are compared with the reference mass, and the display indicates the difference, expressed in [%], for each weighed sample in relation to the reference mass. - 82 - 19.2. Checkweighing, dosing functions in percent setup mode Percent setup mode can be aided by checkweighing and dosing functions. Access to the supplementary functions is given by determining corresponding soft keys in the bottom bar of the display. Values of the supplementary functions have to be determined as percentage. Procedure: 1. Press grey coloured workspace, 2. The display indicates menu of: Settings, Keys, Information, Printout and Profile, 3. Press <Settings> key, 4. The display indicates a list of soft keys, functions and proximity sensors, 5. Press one of available options and assign a corresponding function. CHECKWEIGHING Uses two checkweighing thresholds defined in [%] for controlling sample mass. PROCEDURE: 1. 2. 3. 4. 5. Press Checkweighing Thresholds < > soft key, Press Low Threshold key and insert its value in [%], Accept by pressing < > key, Press High Threshold key and insert its value in [%], Accept by pressing < > key. Caution: The value of High Threshold has to be set higher than the value of Low Threshold. DOSING Uses the Target Value expressed in [%], which has to be reached during weighing (pouring) a sample. The target value also features a [+/-] tolerance, determining the area within which the measurement is recognized as correct. PROCEDURE: 1. Press < Target Value > key, 2. Insert the target value expressed in [%], - 83 - 3. 4. 5. 6. If tolerance applies, set its value, Accept by pressing < > key, Press High Threshold key and insert its value in [%], Accept by pressing < > key 19.3. Interpreting the function by use of a bargraph The dosing and checkweighing functions are aided by graphic indication, in a form of a bargraph. Below see an example of simultaneous operation of the two functions. a) checkweighing thresholds< High Threshold = 110% > are set as Low Threshold = 90%, b) Target value = 105% ; tolerance = 5% < c) Reference mass = 19.986 g < > > 19.4. Additional settings of Percent Setup mode The additional settings enable adjusting the working mode to user’s needs and requirements. Functions related to checkweighing: result control, tare mode, automatic footer printout, printout mode / value release, printouts. Means of using the above functions are given in point 10.8. “Additional parameters on weighing process”. - 84 - 20. DENSITY Working mode< Density > features three separate modules. The first one is used to determine density of solids, the second is for the density of liquids, and the third one determines density of air. The third module is available in balances AS 3Y, XA 3Y and MYA 3Y series. Carrying out the density procedures requires installing an optional density kit (additional equipment) appropriate to a model of used balance. Working mode activating procedure • while in the main window, press soft key located in the upper bar of the display, which opens a submenu <Working modes> with selection of available working modes, • select < Density> mode, the software automatically returns to the main window and displays pictogram in the upper bar. The o o o o o o grey coloured workspace contains the following data: Procedure Solids Weighing 1 Weighing 2 Standard liquid Water Temperature 22 oC Density of standard liquid 0.9978 g/cm3 On selecting the density mode the display contains the following quick access keys in the bottom bar: 1. 2. 3. 4. 5. 6. Setup – access to balance’s menu Print header – print of data declared in the header Print footer – print of data declared in the footer Database of products – selection of products from corresponding database Density of solid Density of liquid - 85 - 20.1. Set for density estimation of liquids and solid objects For balances XA i AS series The set comprises: 1 8 3 Beaker basis Weighing pan with stand Plunger 10 4 Beaker 11 5 Thermometer handle 12 6 Thermometer 13 7 Plunger flexible connector 14 2 9 Hook Top weighing pan of density determining kit for solids Flexible connector Bottom weighing pan of density determining kit for solids Additional weight Additional stand for set of pans or a plunger Additional set of pans for determining density of solids, which density is lower than density of water For balances PS series - 86 - The set comprises: 1 2 3 4 Weighing pan with stand Bottom weighing pan of density determining kit for solids Flexible connector Top weighing pan of density determining kit for solids 5 Beaker 6 Hook 7 Thermometer 8 Thermometer handle 9 Plunger 10 Beaker basis Additional stand for set of pans or a plunger Additional set of pans for determining density of solids, 12 which density is lower than density of water 11 CAUTION: − Particular elements shall be stored in a respective box. − Weighing pans and plunger shall not be put down onto the weighing bench, it may result in damage of particular parts. If either weighing pan or plunger is not to be used, it should be placed back on a hook. 20.2. Assembly XA Balances AS Balances PS Balances CAUTION: If upon assembly the –NULL- message is shown than the set shall be loaded with weights (12), the device shall be zeroed or tared. Thus prepared device may be used for density estimation. - 87 - 20.3. Determining density of solid object Before starting the procedure, it is necessary to determine parameters of the process, such as: − Type of liquid o Distilled water o Ethanol o Other liquid with determined density − Liquid temperature (required if used liquid is distilled water or ethanol) − Liquid density It is set automatically if liquid type Water or Ethanol is used and on inserting liquid temperature. If used liquid is <Other> then it has to be inserted manually. The density of solids is calculated according to a formula: ρ= A A− B ρ A B ρo ρ o density of a sample sample’s mass measured in the air sample mass measured in liquid - liquid density PROCEDURE 1. Assembly the density determination kit 2. Should the density value be saved in a product record of the database of products, set parameter <Assign density to product> in <Settings> and activate product using quick access key <Product>, 3. Press < Density of solids > soft key 4. A window with menu is opened, set appropriate values for fields: Standard liquid, Temperature, Density of standard liquid, 5. Press < START > key 6. The balance is ready to start density determining process of solids. 7. Load a sample on the TOP pan of the density kit, and on stabilization of measurement result press < > key, 8. Load the sample on the BOTTOM pan of the density kit which is immersed in liquid, and on stabilization of measurement result press < 9. The display indicates result of density determining process, 10.Press < > key, > key to finish the procedure. Caution: Pressing < settings. > key starts another density determining process with the same - 88 - 20.4. Determining density of liquids It is determining mass of a plunger if weighed in the air and in tested liquid. The density of tested liquid is calculated according to a formula: ρ= ρ A B V d - A− B +d V density of liquid plunger mass measured in the air plunger mass measured in tested liquid plunger’s volume air density ( max 0,001 g/cm3 ) Before starting the procedure, assembly the density determination kit, and insert to balance’s memory volume of the plunger. − Press < Density of liquid > key − The display opens a menu, press < Plunger’s volume> key and insert the numeric value of volume specified on plunger’s hanger, − The balance is ready to start density determining process of liquid. PROCEDURE 1. Assembly the density determination kit 2. Should the density value be saved in a product record of the database of products, set parameter <Assign density to product> in <Settings> and activate product using quick access key <Product>, 3. Press < START > key, 4. Follow displayed commands, 5. Carry out measurement in the air, and on stabilization of measurement result press < > key, 6. Carry out measurement in tested liquid, and on stabilization of measurement result press < > key, 7. The display indicates result of determined liquid density, 8. Press < > key to finish the procedure. Caution: Pressing < settings > key starts another density determining process with the same - 89 - 20.5. Density of air Density of air < > is a piece of information required to calculate correction of measurement result related to air BUOYANCY compensation. Another data required in this process is the density of weighed sample. The function of air density determining is enabled only in balances with reading unit lower than d=1mg. Determining density of air requires using a dedicated set of mass standards (additional equipment), specific for a balance model. PROCEDURE: 1. 2. Press < Air density > quick access key, The display indicates options related to this mode 3. Press field with mass of steel standard and insert its value as provided in its calibration certificate, 4. Press field with mass of aluminium standard and insert its value as provided in its calibration certificate, 5. Press field with density of steel mass standard and insert the density value, 6. Repeat process for the aluminium mass standard, 7. Press START field – is ready to start density determining process of the air. 8. Load steel mass standard on balance’s weighing pan and on stabilization of measurement result accept it by pressing < - 90 - > key, 9. Load aluminium mass standard on balance’s weighing pan and on stabilization of measurement result accept it by pressing < > key, 10. The balance automatically calculates the density of air, and indicates its value on the display, 11. Press < > key to finish the procedure. The value of determined air density is automatically assigned to field <Air density> in menu <Settings/ Air buoyancy compensation> in working mode: weighing. 20.6. Additional settings of density mode The additional settings enable adjusting the working mode to user’s needs and requirements. To access the setting follow below procedure: Procedure: 1. Press grey coloured workspace, 2. The display indicates menu of: Settings, Keys, Information, Printout and Profile, 3. Press <Settings> key, 4. The display indicates functions related to density determining process, such as: o Request sample number Available settings: NO – data on sample number is not required; applicable in case of a single measurement YES – before each measurement a window requesting inserting sample number is automatically displayed; applicable in case of a series of measurements o Measuring unit: the balance enables choosing between the following units: [g/cm3], [kg/m3], [g/l]. Selected unit is activated for all density determining options and also in final printout. o Assign density to a product: YES/NO – if option <YES> is selected, the software automatically assigns the value of determined density of solid or liquid to field <Density> in a - 91 - product record of the database of products. To use this function, before starting the density determining process, using database of product select a product for which the density procedure is carried out (if density has already been determined for this product, it is replaced with new value), o Tare mode, o Printout mode / Value release, o Printout Means of using the above functions are given in point 10.8. “Additional parameters on weighing process”. 20.7. Printouts Option Printouts enables setting the contents of printouts in a standard printout and also determining non-standard printouts. Standard printout comprises four internal blocks, each featuring different variables. Each variable can be attributed with parameter YES – i.e. present on a printout, or NO – i.e. not printed. Settings for header printout, weighing printout, and footer printout are specified in point. 15.5; below description refers to setting a printout template from density mode. A user can design content of a report for each of carried out procedures. On pressing <Density printout template> option a window is opened enabling setting the content of each report. Content of each of reports: o SOLID − Working mode − Procedure − Sample no. − User − Balance type − Balance ID - 92 - − − − − − − − − − − − − − − − − Date Time Standard liquid Temperature Density of standard liquid Weighing 1 Weighing 2 Density Volume Product Warehouse Client Empty line Dashes Signature Non-standard printout o LIQUID − Working mode − Procedure − Sample no. − User − Balance type − Balance ID − Date − Time − Plunger volume − Temperature − Weighing 1 − Weighing 2 − Density − Product − Warehouse − Client − Empty line − Dashes − Signature − Non-standard printout o AIR − Working mode − Procedure − Sample no. − User − Balance type − Balance ID − Date − Time − Mass of steel standard − Mass of aluminium standard - 93 - − − − − − − − − − − − − Density of steel standard Density of aluminium standard Weighing 1 Weighing 2 Density Product Warehouse Client Empty line Dashes Signature Non-standard printout 20.8. Report on completed density determination processes On completing any type of density determining processes, i.e. solid, liquid or air, a report is generated. The report is saved in the database < Density reports>. The files are named by their date and time (hour) of density determining process. An example of report on density determination of solid. --------------- Density ------------------------------- Solid ---------------User Admin Balance ID Date 400015 2011.10.07 Time 10:08:09 Standard liquid Water Temperature 22 °C Density of standard liquid 0.9978 g/cm3 Weighing 1 10.526 g Weighing 2 2.586 g Density 1.322776 g/cm3 ------------------------------------------------Signature - 94 - Use of data contained in the header and footer. Should data from header and/or footer be used, follow below procedure: o Press < Print header> soft key before starting density determination procedure, o Carry out density determination procedure A report is printed automatically on completing the second measurement (Weighing 2), When density determination result is displayed, it is possible to print it for numerous times by multiple pressing of < PRINT > key, o Press < Print footer > soft key after completing the density determination procedure. Caution: Remember to select data to be printer in the header, footer and report. For details see section “PRINTOUTS”. 21. ANIMAL WEIGHING Working mode< Animal weighing> enables reliable determining mass of objects in motion. In principle, this type of objects generate unstable measurement, thus it requires using a different filtering method of measurement signal. Working mode activating procedure • while in the main window, press soft key located in the upper bar of the display, which opens a submenu <Working modes> with selection of available working modes, • select < Animal weighing> mode, the software automatically returns to the main window and displays pictogram in the upper bar, The grey coloured workspace contains the following data: o Averaging time o Threshold 5 10 - 95 - On selecting the animal weighing mode, the display contains the following quick access keys in the bottom bar: 1. 2. 3. 4. Setup – access to balance’s menu Print header – print of data declared in the header Print footer – print of data declared in the footer Database of products – selection of products from corresponding database 5. Set tare 6. Animal weighing 21.1. Setting of animal weighing mode Depending on required mass analysis of weighed object, the balance enables setting internal criteria of the function. PROCEDURE: 1. press < Animal weighing > key, 2. the display indicates option referring to this working mode, such as: Averaging time Amount of time during which measurement records of weighed sample are analysed. Obtained data is used to determine measurement result. Automatic operation Determines start criterion for measurements: whether they are initiated manually /on pressing a key/ or automatically. A measurement starts automatically if indication on balance’s display exceed the value of set threshold. The following measurement can start on unloading the weighed object from balance’s pan (the indication has to return below the value set in threshold), loading a new object on balance’s pan and exceeding the threshold’s value by the indication. - 96 - Threshold It is a value expressed in mass measuring units. in order to start measurement, the indication has to exceed value set in the threshold. 3. set mode’s operating parameters and return to weighing, 4. load weighed object on balance’s weighing pan and press < > key, 5. on completing the measurement, the display indicates and “locks” the measurement result, 6. the following measurement is carried out on pressing < - in case of manual operation mode, press < > key: > key, - in case of automatic operation mode, unload weighed object from the weighing pan and load the following object to be weighed. 21.2. Additional settings of animal weighing mode The additional settings enable adjusting the working mode to user’s needs and requirements. To access the setting follow below procedure: Procedure: 1. Press grey coloured workspace, 2. Press menu <Settings>, 3. The display indicates functions related to checkweighing, such as: − Result control − Tare mode − Automatic footer printout − Printout mode / Value release − Printout Means of using the above functions are given in point 10.8. “Additional parameters on weighing process”. - 97 - 22. FORMULATION Working mode< Formulation> enables preparing mixtures out of several ingredients. The process is conducted automatically. Balance user, while preparing mixtures, can: use database of formulas, where formula records are stored. In such case, balance’s software assists in weighing ingredients of a mixture by displaying corresponding commands or information in the grey coloured workspace; prepare a mixture without using database of formulas. Then, a user controls weighing of an ingredient, weighing sequence and quantity. Should database of formulas be used, first a formulation has to be created in the database, and then it is recalled (activated) for use. Creating a formulation is carried out only from the level of Database of Formulas, and it is described later in this section. Working mode activating procedure • while in the main window, press soft key located in the upper bar of the display, which opens a submenu <Working modes> with selection of available working modes, • select < Formulation> mode, the software automatically returns to the main window and displays pictogram in the upper bar. The grey coloured workspace contains the following data: o o o o o o Formulation Ingredient Ingredient no. Ingredient mass Target value (mass) Sum Caution: In the grey coloured workspace a bargraph can be enabled (displayed). It is a graphic interpretation of correctly weighed ingredient’s mass with +/- tolerance, according to set tolerance thresholds. Means of verifying ingredient’s mass TOLERANCE Means of verifying ingredient’s mass THRESHOLDS - 98 - On selecting the formulation mode, the display contains the following quick access keys in the bottom bar: 1. 2. 3. 4. Setup – access to balance’s menu Print header Print footer Formulation – selection of a formulation from corresponding database of formulas 5. Formulation multiplier (Formulation start if option <Multiplier editing> is set to <NO>, i.e. disabled) 6. Target mass 7. Formulation without a database 22.1. Additional settings of formulation mode The additional settings enable adjusting the working mode to user’s needs and requirements. To access the setting follow below procedure: Procedure: 1. Press grey coloured workspace, 2. The display indicates menu of: Settings, Keys, Information, Printout and Profile, 3. Press <Settings> key, 4. The display indicates functions related to formula making process. Formula making process is related to the following functions: − Automatic ingredients’ naming: o YES o NO − Apply tare from database of tare values: o YES, each of used ingredients has a tare value assigned in accordance with a product saved in the database of products; o NO, tare is not applied − Means of of ingredient verification: The option enables selecting a relation used for determining correct mass of ingredients during formula making process. TOLERANCE/ THRESHOLDS - 99 - TOLERANCE: balance software accepts mass of an ingredient if it is within set percent tolerance of total ingredient’s mass (±%) - (data acquired from database of products). THRESHOLDS: the software accepts mass of an ingredient as correct if it is within set thresholds (data acquired from database of products). Selected relation is in effect for all ingredients in the formula making process. If during formula making process one of the ingredients mass shall be excedeed (ingredient mass is not within the set percent tolerance, but it exceeds its upper set point in relation to its target mass) upon confirmation of ingredient mass the software shall display a message <VALUE OUT OF RANGE, RECALCULATE THE FORMULATION?>. Upon confirmation the software shall automatically recalculate mass of other ingredients so that mixture proportions were correct. Option is available when ingredients’ data of ingredients database comply with a selected option <MEANS OF INGREDIENT VERIFICATION>, i.e. an ingredient is specified with thresholds and <THRESHOLDS> value is selected for < MEANS OF INGREDIENT VERIFICATION > option. For lack of unity between data automatical recaclulation is not available, i.e. thresholds are entered for the ingredient whereas <MEANS OF INGREDIENT VERIFICATION> is set to value <TOLERANCE>. − Multiplier’s editing, enables making multiple mixtures according to a selected formulation in a single weighing process: o YES, on selecting a formulation for processing, the software requests for specifying multiplier’s value used for multiplying mass of each ingredient while weighing. Inserted value is in effect for all ingredients in the formula making process. o NO, inserting multiplier value is disabled, default value is set to <1> − Printout, means of using the function is given in point 10.8. “Additional parameters on weighing process”. 22.2. Formulation – quick access keys Each of working modes features a set of default quick access keys which are automatically displayed on mode activation. The set of keys can be modified by selecting other quick access keys to the bottom bar of the display. Such process requires appropriate operator’s access level. 22.3. Adding formulas to the Database of Formulas Database of formulas consists of formulas names, and ingredients with names and mass forming a formulation. Each product used for formula making process is saved in the database of products. When preparing a formulation, the first step requires naming the formulation, and then adding ingredient’s to already named formulation. The software operates intuitively, and commands a user to follow displayed information. - 100 - As each of ingredients must have its name and mass specified, the operator must know the exact composition of the total mixture. Adding a formulation to the database of formulas is carried out from the database level. Procedure: • Enter submenu < • Press < Databases>, press < Formulation> field Add > soft key, should a formulation be added On selecting adding of a new formulation, the software automatically adds a new entry in the database, and enters its editing mode. Insert all parameters of a new formulation. List of parameters defined for a formulation: 1. Name: press “Name” field, a window opens for inserting name of a formulation, 2. Code: for inserting formulation code 3. Ingredients: press “Ingredients’ field, a window opens with a list of ingredients used in a formulation (in case of a new formulation, the list of ingredients is empty), add new ingredients to a formulation: • • Press < Add > soft key Select one of available options: <New ingredient> - adding a product, which is absent in the database of products. On selecting this option, first insert a name of a new product, then specify its mass to be weighed during formula making process. The software automatically adds the products to the database of products. Caution: after adding the product, balance user can fill in other data on a product from the database level. <New ingredient from database> - on selecting this option, a window with the Database of Products is opened. Using displayed list select a product to be weighed in the mixture, mass to be weighed is the mass of the product saved in its record in the database. The value of mass of each added product is editable. Changing mass of an ingredient in a formula does not immediately change product’s mass saved in the database. 4. Number of ingredients – non-editable option, it is updated by the software on adding the following ingredient to a formulation. 5. Sum – target mass of a formulation, i.e. sum of all ingredients in a formulation. It is not editable, and it is updated by the software on adding the following ingredient to a formulation. - 101 - 22.4. Using formulas in weighing In activating FORMULATION mode, depending on settings, user can move to formula making process either on selecting a formulation from corresponding database or weigh a mixture “manually”. Preparing mixtures is carried out by: − Preparing a formulation that is not saved in the Database of Formulas – i.e. “manually”, − Preparing a formulation that is saved in the Database of Formulas, − Preparing multiple repetitions of a formulation that is saved in the Database of Formulas – multiplier function, − Preparing a formulation that is saved in the Database of Formulas, with determining target mass of complete formulation. Caution: Using the above options requires enabling corresponding quick access keys in the bottom bar and setting corresponding options in the formulation mode. On selecting a formulation, weigh each of its ingredients. On stabilization of each measurement result press < > key. Mass of each ingredient after pressing < > is zeroed, i.e. it is accepted for the total mass of the formulation. Pressing < > key cancels the formula making process. If pressed, enables selecting another formulation to making process. PROCEDURE 1 – Preparing a formulation that is not saved in the Database of Formulas – i.e. “manually”. Follow hints and commands displayed by the balance’s software • • • • • • Press < Formulation without a name> key in the quick access key bottom bar, Give name to the new formulation, The software automatically skips to selecting ingredients of a formulation, Select an ingredient (new or from database of products), The software returns to the main window, Weigh set quantity of an ingredient, Accept process by pressing < > key, The software moves to selecting the following ingredient, Proceed as previously to weigh all required ingredients of a formulation, After weighing the last ingredient, select one of below options: <Save and close> - carried out formula making process is saved in the database of formulation reports and automatically completed, <Close> - carried out formula making process is completed without saving a final report in the database of formulation reports, • On selecting one of above options, the software finishes formula making process and returns to displaying the main window of Formulation mode. • • • • - 102 - To proceed press < > key Caution: Formula making process can be aborted at any moment by pressing <Abort> key. PROCEDURE 2 – Preparing a formulation that is saved in the Database of Formulas. It is the basic option of formula making process. Depending on function settings, it is possible to easily prepare multiple realization of a formulation. Follow hints and commands displayed by the balance’s software. • • Press < Formulation> key, Using list of available formulas, select one for making process, • Press < Formulation with multiplier> key, If in Formulation mode settings, option <Multiplier editing> is disabled (set to <NO>) the software automatically skips to formula making process. If the option <Multiplier editing> is enabled (set to <YES>) the software displays a window with a keyboard for inserting the value of multiplier. Mass of all ingredients of a formulation shall be multiplied by the specified value (mass of each ingredient is a product of mass saved in a formulation and value of the multiplier). On accepting the inserted multiplier’s value, the software proceeds to formula making process. The grey coloured workspace on the display indicates the following parameters: name of selected formulation, name of the first ingredient, ingredient number, mass to be weighed and target mass, • After accepting mass of an ingredient, the software automatically adds the mass to the sum of weighed ingredients of the formulation, and moves to weighing the following ingredient, • After weighing all of the ingredients in the formulation, the software sets a command on completing the formula making process, • • Press < > key to confirm completing the process. The software automatically prints a report on completed process and saves it in the database of formulation reports (report template is editable in option <Printouts>). PROCEDURE 3 – Preparing a formulation that is saved in the Database of Formulas, with determining target mass of complete formulation. This procedure is dedicated for users who need to prepare a mixture with pre-determined mass, that is different from the mass resulting from summing of used ingredients. In such case, there is no need to carry out complex calculations of ingredients’ mass. The software adjusts mass of each ingredient in relation to pre-defined target mass of the complete formulation. Follow hints and commands displayed by the balance’s software - 103 - • • Press < Formulation> key, Using list of available formulas, select one for making process, Press < Formulation with target mass> key, The software displays a window with keyboard for inserting the target mass of a mixture, • On accepting the inserted value, the software proceeds to formula making process. The grey coloured workspace on the display indicates the following parameters: name of selected formulation, name of the first ingredient, ingredient number, mass to be weighed and target mass, mass of each ingredient is automatically recalculated (proportionally) to the value of defined target mass of the complete formulation, • After accepting mass of an ingredient, the software automatically adds the mass to the sum of weighed ingredients of the formulation, and moves to weighing the following ingredient, • After weighing all of the ingredients in the formulation, the software sets a command on completing the formula making process, • • • Press < > key to confirm completing the process. The software automatically prints a report on completed process and saves it in the database of formulation reports (report template is editable in option <Printouts>). Each report on completed formula making processes can be printed from Database level – reports from formulas. 22.5. Printouts Option Printouts enables setting the content of printouts in a standard printout and also determining non-standard printouts. Standard printout comprises four internal blocks, each featuring different variables. Each variable can be attributed with parameter YES – i.e. present on a printout, or NO – i.e. not printed. Settings for header printout, weighing printout, and footer printout are specified in point. 15.5; below description refers to setting a printout template for report on formulation. - 104 - A user can design content of a report. CAUTION: Data contained in a report and referring to each measurement is set in option <Weighing printout template>. On each report printout, areas dedicated for measurements shall be filled with data with attribute <YES> in the <Weighing printout template>. Content of each of reports: − − − − − − − − − − − − − − − − − − − Working mode User Client Warehouse Formulation Formulation code Start date End date Number of ingredients Number of measurements Measurements Target value Sum Formulation difference Status Empty line Dashes Signature Non-standard printout 22.6. Report on completed formula making processes On completing any type of formula making process, a report is generated. The report is saved in the database < Reports from Formulas>. The files are named by their date and time (hour) of formula making process. - 105 - An example of report on formula making process: -------------- Report on Formulation ---------------User Formulation name John Smith Mixture 1 Start date End date 2011.12.16 13:21:40 2011.12.16 13:22:28 Number of ingredients No. of carried out measurements --------------19.994 g --------------49.993 g --------------9.999 g --------------1.001 g --------------19.995 g Measurement 1 --------------Measurement 2 --------------Measurement 3 --------------Measurement 4 --------------Measurement 5 --------------- Total mass Target mas Difference Status 5 5 100.982 101.000 -0.018 OK ------------------------------------------------Signature ............................................................. - 106 - 23. STATISTICS Working mode< Statistics> enables acquiring data form a series of measurements and carrying out statistical calculations. The range of statistical data is conditioned by mode’s internal settings. Working mode activating procedure • while in the main window, press soft key located in the upper bar of the display, which opens a submenu <Working modes> with selection of available working modes, • select < Statistics> mode, the software automatically returns to the main window and displays pictogram in the upper bar, The grey coloured workspace contains the following data: o N (no. of samples) o SUM (total no. of samples) o X (mean value from a series) o MIN (minimal value in a series) o MAX (maximal values in a series) o SDV (standard deviation) On selecting the statistics mode, the display contains the following quick access keys in the bottom bar: 1. 2. 3. 4. 5. 6. 7. Setup – access to balance’s menu Print header – print of data declared in the header Print footer – print of data declared in the footer Database of products – selection of products from corresponding database Set tare Statistics Add to statistics 23.1. Setting of keys and workspace for Statistics mode When carrying out a series of measurements, bear in mind below data on operation of keys: - 107 - Pressing < PRINT> key causes releasing a printout and adding a measurement to statistics, Pressing < Add to statistics> key causes ONLY adding a measurement to statistics without releasing a printout. As in any other working mode, balance user can define custom set of quick access keys and data displayed in the grey coloured workspace. Procedure: 1. Press grey coloured workspace, 2. The display indicates menu of: Settings, Keys, Information, Printout and Profile, 3. Press <Settings> or <Information> key, 4. Assign keys to displayed quick access keys, and select information that is displayed in the grey coloured workspace, 23.2. Additional settings of Statistics mode The additional settings enable adjusting the working mode to user’s needs and requirements. To access the setting follow below procedure: Procedure: 1. Press grey coloured workspace, 2. Press <Settings> key, 3. The display indicates functions related to checkweighing, such as: − Result control − Tare mode − Automatic footer printout − Printout mode / Value release − Printout Means of using the above functions are given in point 10.8. “Additional parameters on weighing process”. 23.3. Parameters related to a series of measurements Each series of measurements can be accompanied by the following options: previewing results, printing report, deleting last measurement, deleting all results in a statistics. - 108 - Procedure: 1. Press < Statistics> key 2. Displayed options: Result, Print, Delete last, Delete. 3. Select one of available option: − Result, to preview statistics report, − Print, to print report on statistics, An example of report on statistics -------------- Statistics -------------N 9 SUM 455.600 g X 50.6222 g MIN 49.939 g MAX 51.380 g D 1.441 g SDV 0.39605 g RDV 0.78 % ---------------------------------------− Delete last, if the last measurement has to be cancelled, − Delete, if all statistical data should be removed. − Measurements chart – on selecting this option, the software generates and displays a chart with distribution of measurements in the coordinates mass/measurement for completed measurement series. - 109 - Below there is an instance of the chart: − Probability distribution chart – on selecting this option the software generates and displays chart of probability distribution for completed measurement series. Below there is an instance of the chart. The bar chart demonstrates quantities of the same measurement in a series. The bottom bar contains the following soft keys (options): Return to displaying the complete chart Zooming out the screen to the previous view Return to displaying the previous window Printing the chart on a connected printer PCL type Saving the chart as a file in format *.bmp on an external data storage device connected to terminal’s USB port. - 110 - 24. PIPETTE CALIBRATION Balance allows pipette calibration by means of a special balance software or by means of cooperation with computer software “Pipettes” intended for pipettes calibration (workstation for pipettes calibration). Before pipettes calibration a special set must be mounted inside the draft shield. The set is an atypical balance equipment. See the picture below for set assembly instruction. Balance with a set for pipettes calibration: Calibration set assembly procedure: • dismantle the weighing pan and the draft shield, • place centering ring (8) inside the chamber, • put glass ring (7) onto the centering ring, • place weighing pan (6) inside the glass ring, • put top ring (5) onto the glass ring, • put evaporation ring (4) onto the top ring (5) • insert calibration vessel (3) into the evaporation ring, • put the glass cover (2) onto the top ring, • put glass supplementary cover (1) onto the glass cover. Balance with a mounted pipette calibration set. Evaporation ring minimizes measurement errors being a result of liquid evaporation occurring while weighing process. - 111 - Before pipettes calibration distilled water must be poured into evaporation ring, the amount of water should not exceed 2/3 of the ring height. The set may be operated after about an hour – this period of time is required for moisture stabilisation. One must remember to control the level of distilled water – surface of the vessel should remain covered with it. Excess of water may be removed by means of automatic pump or external pipette. In order to minimize both, changes of moisture content inside the weighing chamber and negative effect of air blows during opening the chamber door, the liquid should be dosed by means of pipette through an opening located in the top cover of the weighing chamber. It is allowed to use a balance without a draft shield for pipettes calibration. For this reason both, the draft shield and frame must be dismounted (only XA.3Y.A series balances). For dismount instruction of draft shield see chapter 2.6., for dismount instruction of the frame see instruction below. In order to remove frame one must undo 4 screws fixing it to the housing (as it has been shown in the picture). In thus prepared balance the pipette calibration set may be mounted in accordance with above instruction. - 112 - Balance with dismounted draft shield and mounted calibration set. Thus prepared balance is ready for performance of pipettes calibration process. Working mode < Pipette calibration> is dedicated to determining measurement errors of volume in piston pipettes, in accordance with standard ISO 8655 or according to user requirements. In case of calibration carried out in accordance with standard ISO 8655, the errors are automatically selected to tested volume, as specified in the standard (see table of errors for standard ISO 8655). Working mode enables: • Calibrating pipettes with fixed or adjustable volume, single or multichannel; • Preparing a database of pipettes including: pipette name, code, tested volume and others; • Calculating results on basis of: Average volume of a pipette (channel) Systematic error es (accuracy error) Random error CV (repeatability error) • Carrying out automated measuring procedures with consideration of pipette’s type; • Storing calibration results in a database (in a form of reports from calibration process); • Printing reports from pipette calibration process • Exporting reports from tests During volume testing procedure, the software determines accuracy and repeatability errors for tested volume. In case of pipettes with adjustable volume, the software enables declaring up to 5 volume from total pipette’s range, that are checked during calibration process. In order to ensure the highest accuracy of pipettes calibration process, maintain the following ambient conditions at a workstation: Ambient temperature of a pipette, tips and liquid should be kept between 20°C - 25°C with change rate during testing within ± 0.5°C - 113 - Relative humidity 50 - 75% and Use distilled water for pipettes calibration processes A pipette, tips and distilled water should be stabilized for temperature in the weighing room. The reference norm advises that minimum acclimatization time for above mentioned is 2 hours. While calibrating process, balance user refers to the database of pipettes including data on pipettes, its parameters, tested volume, and values of errors determined for specific volumes. Before carrying out calibration process, load database with data on pipettes and calibration criteria. Adding pipettes can only be carried out from the database level. Adding procedure is described further in this user manual. Working mode activating procedure • while in the main window, press soft key located in the upper bar of the display, which opens a submenu <Working modes> with selection of available working modes, • select < Pipettes calibration> mode, the software automatically returns to the main window and displays pictogram in the upper bar, On selecting the pipettes calibration mode, the display contains the following quick access keys in the bottom bar: 1. 2. 3. 4. Setup – access to balance’s menu Print header Print footer Select pipette The grey coloured workspace contains the following data: o Pipette o Tested volume o Average volume - 114 - o Systematic error o Random error o Status 24.1. Additional settings of pipettes calibration mode The additional settings enable adjusting the working mode to user’s needs and requirements. To access the setting follow below procedure: Procedure: 1. Press grey coloured workspace, 2. The display indicates menu of: Settings, Keys, Information, Printout and Profile, 3. Press <Settings> key, 4. The display indicates functions related to calibration of pipettes. Pipettes calibration is related to the following functions: − Number of measurements; this option enables determining number of measurements for tested volume of a pipette (valid for each tested volume in case of a pipette with adjustable volume), − Request serial number: YES/NO. For option <YES> before starting calibration procedure, the software displays a window and on-screen keyboard for inserting serial number of a pipette, − Comply with ISO 8655: YES/NO. For option <YES>, for tested volumes, during pipettes calibration process the software automatically accepts error values as specified in standard ISO 8655 (if other error values have been accepted for a pipette, then on selecting option <Comply with ISO 8655> the error values are neglected, and replaced by those from ISO standard), − Acquire data on ambient conditions from THB module: YES/NO. For option <YES> the software automatically, and in specified moment, acquires and saves ambient conditions’ parameters from a connected THB module. If option <NO> is selected, before starting and after completing the pipettes calibration process operator should manually insert ambient conditions parameters (i.e. temperature, humidity and pressure in the weighing room) from external ambient conditions sensors. − Result control, Tare mode, Automatic footer printout, Printout mode, Printout, means of using these functions is given in point 10.8. “Additional parameters on weighing process”. 24.2. Pipettes calibration – quick access keys Each of working modes features a set of default quick access keys which are automatically displayed on mode activation. The set of keys can be modified by selecting other quick access keys to the bottom bar of the display. Such process requires appropriate operator’s access level. - 115 - 24.3. Adding a pipette to the Database of Pipettes Database of pipettes contains list of pipettes’ names and other data including tested volume and errors values for a specific volume. When adding a pipette to the database, first specify its name, and then add other data on a pipette. The software operates intuitively, and commands a user to follow displayed information. Adding a pipette to the Database can be carried out in menu of the database. Procedure: • Enter submenu < • Press < Databases>, press < Pipettes> field Add > soft key, should a new pipette be added The software automatically adds a new entry to the database, and enters its editing mode. Insert all parameters of a new formulation. List of parameters defined for a pipette: 1. Name: press “Name” field, a window opens for inserting name of a pipette; 2. Code: for inserting pipette’s code; 3. Model: for inserting model name of a pipette; 4. Tip: for inserting name of used tip; 5. Type of volume: ADJUSTABLE / FIXED; 6. Nominal volume: for specifying nominal volume of a pipette; 7. Minimum volume: for specifying the minimum volume of a pipette (in case of a pipette with fixed volume, insert <0>); 8. Number of channels: for specifying number of pipette’s channels, in case of a single channel pipette insert <1>; 9. Type: NONE/A/D1/D2. Pipette type is compatible with applicable standard. Selecting pipette’s type is mandatory if calibration process complies with the requirements of standard ISO 8655, as values of errors differ in each type of a pipette. Therefore, if the software is to accept adequate error values it is necessary to determine type of a pipette; 10. Tested volumes: if pressed, a window is opened with a list of calibrated volumes (in case of a new pipette, the list is empty), add volume to be tested, and define error value for each tested volume: • • • • • Press < Add > soft key A window with on-screen numeric keyboard is displayed, Insert value of tested volume in [µl] and accept by pressing < > key, A new record is automatically added to the list with recommended error values, In order to change error values press a field with added volume of a pipette, - 116 - each field is editable and enables inserting user values, Caution: While in calibration process, the order of tested volumes corresponds to the order in which they are entered. • On setting correct values return to the main window. 24.4. Printouts Option Printouts enables setting the content of a standard printout as well as the non-standard printout. Standard printout comprises four internal sections featuring different variables. For each variable set option YES to include it in a standard printout. If option NO is selected, then the variable is disabled, i.e. it is not printed. Settings for header printout, weighing printout, and footer printout are specified in point. 15.5; below description refers to setting a printout template for report on pipette calibration. Content of each of reports: − − − − − − − − − − − − Working mode User Client Pipette Serial no. No. of channels Channel no. Number of measurements Operation with ISO 8655 Start date End date Water temperature - 117 - − − − − − − − − − − − Temperature Humidity Pressure Z coefficient Measurements and statistics Statistics Status Empty line Dashes Signature Non-standard printout 24.5. Activating procedure Carrying out pipettes calibration process requires installing an adapter for pipettes calibration. The adapter does not come standard with the balance. The adapter for pipettes calibration is a simple supplementary device dedicated for calibration and checking of piston pipettes. It is designed for application on balances MYA 21.3Y and XA 52.3Y. The adapter has been designed to minimize evaporation occurring in liquid handling procedures. It consists of a minimized weighing chamber installed inside the weighing chamber of a balance. The adapter features an evaporation ring and a dedicated weighing pan for central locating of the measuring vessel. Application of the adapter for pipettes calibration prevents from liquid evaporation during calibration process. Small dimensions of the adapter, combined with the evaporation ring enable maintaining high humidity rate inside the weighing chamber and the measuring vessel, thus stopping liquid evaporation process. Carried out research proved that the adapter for pipettes calibration eliminates or considerably reduces liquid evaporation process, which is essential for correct gravimetric calibration of piston pipettes. Selecting an appropriate adapter and balance mostly depends on type of calibrated pipettes. Before starting pipettes calibration process, assembly the adapter inside balance’s weighing chamber, and insert data on pipettes to be calibrated, including complete pipette characteristics and values of errors (see: Database of Pipettes). The following step is setting process’s main option: • Number of measurements • Request batch number (YES/NO) • Operation with ISO 8655 (YES/NO) • Acquire ambient conditions from THB module (YES/NO) Caution: Description of options and settings are given in point 24.1 of this user manual. - 118 - After setting the above options, go to pipettes calibration process. Follow below pipettes calibration procedure: 1. Press < Select pipette> key; 2. Select a pipette for testing from displayed list; 3. On selecting, the software returns to the main window, and name of selected pipette is visible in the grey coloured workspace; 4. Press < Start> key in the bottom bar of the display; 5. If option <Request batch number> is enabled (set to <YES>) a window is opened for inserting the batch number, and accepting the value; 6. A window is opened for inserting values of ambient conditions parameters read from the external sensors (temperature, humidity, pressure and water temperature), on inserting press < Accept> key; If option <Acquire ambient conditions from THB module> is enabled (set to <YES>, the software automatically acquires data from the THB module on temperature, humidity and atmospheric pressure. The value of water temperature has to be inserted manually, and confirmed by pressing < Accept> key; 7. The software returns to the main window, and the grey coloured workspace displays the following data: tested volume and process status <In progress>. The task bar displays commands and hits for a user on the following step - <Weighing sample C1/V1/N1>. Description of texts: C1 – channel number; V1 – number of volume for a channel; N1 – number of measurement for tested volume; 8. Follow displayed commands until completing the calibration process. The grey coloured workspace displays other data on calibration process, i.e. average volume, values of errors, specific for carried out process; 9. On accepting the last measurement, a window is displayed with ambient conditions parameters. Proceed as on process start and insert all ambient conditions parameters, and press < Accept> key; 10. The software automatically generates a report, that is printed and stored in the database of reports from pipettes calibration (ambient conditions and water temperature values given in a report are averages from the initial and final values of a process); 11. Complete the process by pressing < > key visible in the bottom bar. In case of multichannel pipettes, the balance displays a message on continuing the process for the following channels. On confirming the message, the balance carries out calibration / testing process for the following channel. The settings remain unchanged; 12. The software enables starting the following procedure for the same pipette or selecting another pipette from the database. 24.6. Report on completed calibration processes On completing each calibration process, a report is generated. The report is saved in a database < Reports from pipettes calibration processes>. The files are named by their date and time (hour) of calibration process. - 119 - An example of a report on pipette calibration process: ----------- Pipette calibration ----------User Smith Client Jones Pipette p901\1k Serial no. 7777 No. of channels 1 Channel no. 1 No. of measurements 10 Operation with ISO 8655 Yes Start date 2012.03.15 07:50:44 End date 2012.03.15 07:54:34 Water temperature 22.15 °C Temperature 21 °C Humidity 48 % Pressure 1005 hPa Z coefficient 1.00328 ------- Tested volume: 1000 µl ------1 0.998 g 1000.82389 µl 2 0.998 g 1000.82389 µl 3 0.998 g 1000.82389 µl 4 0.998 g 1000.82389 µl 5 0.998 g 1000.82389 µl 6 0.998 g 1000.82389 µl 7 0.998 g 1000.82389 µl 8 0.998 g 1000.82389 µl 9 0.998 g 1000.82389 µl 10 0.998 g 1000.82389 µl Average volume 1000.82389 µl Average [%] 100.08 % Systematic error 0.82389 µl Systematic error [%] 0.08239 % Permissible error ± 16 µl Random error 0 µl Random error [%] 0% Permissible error ± 6 µl Status Positive ---------------------------------------Signature ........................................ - 120 - 25. DIFFERENTIAL WEIGHING Working mode < Differential weighing> enables analysing changes of mass in a single sample or multiple samples. The process is carried out by determining sample’s initial mass, and then the sample is subject to different processes, which outcome is separation or adding of some of sample’s ingredients. Finally, the sample is repeatedly weighed (differential weighing). After the final weighing, the balance determines the difference between the two mass values (initial and final). Balance 3Y series, in differential weighing mode enables: Determining a series, where each series may contain several samples Assign a name for each weighed sample, print or export data on a series to a connected data storage device; For each sample: determine tare value, initial mass and carry out up to five measurements for the final mass. If balance users need to use differential weighing mode, then initially, they need to introduce data on a weighed series to balance’s database, then define samples in a saved series, and then recall a saved series for weighing. The series are created from the level of databases. The series creating procedure is described further in this user manual. Working mode activating procedure • while in the main window, press soft key located in the upper bar of the display, which opens a submenu <Working modes> with selection of available working modes, • select < Differential weighing > mode, the software automatically returns to the main window and displays pictogram in the upper bar, The grey coloured workspace contains the following data: o o o o o Method Series Sample Sample no. Tare On selecting the differential weighing mode the display contains the following quick access keys in the bottom bar: - 121 - 1. 2. 3. 4. 5. 6. 7. Setup – access to balance’s menu Series Sample Weighing A Weighing B Weighing T+A Delete value 25.1. Additional settings of differential weighing mode The additional settings enable adjusting the working mode to user’s needs and requirements. Access to these settings is described below: Procedure: 1. Press grey coloured workspace 2. The display indicates menu of: Settings, Keys, Information, Printout and Profile, 3. Press <Settings> key, 4. The display indicates functions related to differential settings Differential weighing is related to the following settings: − Threshold: mass value, as the value of maximal sample mass, e.g. filter − Ambient conditions: (software option, in which the user sets the requirement for giving ambient temperature and humidity values before the weighing process: <Weighing A, Weighing T+A, Tarring T>) o NO, giving data on ambient conditions disabled ; o ONLINE, data on ambient conditions acquired from the ambient conditions module, that is cooperating with the balance; o VALUE, temperature and humidity value have to be inserted by the user, who reads the ambient conditions values from another device controlling the ambient conditions. − Maximal number of weighing records: (declaring number of repetitions for the final weighing process <B> – Max 5 repetitions, the setting is valid for all measuring series) − For the other settings, follow the operation guidelines given in point 10.8. “Additional parameters on weighing process”. 25.2. Differential weighing – quick access keys Each of working modes features a set of default quick access keys which are automatically displayed on mode activation. The set of keys can be modified by selecting other quick access keys to the bottom bar of the display. Such process requires appropriate operator’s access level. - 122 - Below list provides the functions of only those soft keys, that are absent in working mode “Weighing” Weighing A Start sampling of initial mass <A> of the sample. The process is carried out as an separate activity. Weighing (T+A) Start weighing a container for the sample (tarring) with automatic, carried out instantly after tarring, sample’s weighing process (nonseparable activities). On process initiation, the software orders setting name of a sample. Tare (T) Weighing a container for a sample, carried out as a separate process. On process initiation, the software orders setting name of a sample. Weighing B Start sampling of the final mass <B> of the sample. Causes activating differential weighing mode. Series Quick access key enabling selecting a sample for which the differential weighing process should be carried out. Sample Quick access key for selecting a sample for currently carried out process in a selected series. Copy tare The quick access key enabling copying tare value determined for a given sample, to all samples in a current series, and samples which do not having tare value assigned. Delete value Pressing the quick access key causes deleting last saved mass value (tare, weighing A or weighing B). Add sample Pressing the quick access key causes entering a window with onscreen keyboard, for inserting name of an added sample. The mandatory condition is first selecting a series in which a sample should be added, and not starting the weighing process. - 123 - 25.3. Introducing a series to the Database of Series Database of series comprises series and samples which are components of a series. While creating a series, first set its name, and then add samples to the created series. The software operates intuitively, and commands a user to follow displayed information. Specify a name for each sample. Adding a series to the database can be carried out from the level of differential weighing mode or from the level of Database. Procedure: • Enter submenu < • Press < Databases>, press < Series> field Add > soft key, should a series be added The software automatically adds a new entry to the database and enters its editing mode. Insert all parameters of a new series. List of parameters defined for a series: 1. Name: press “Name” field, a window opens for inserting name of a series 2. Code: for inserting series code 3. Client: enables selecting a client for whom the measurements in a series are carried out 4. Samples: pressing this field opens a window with list of samples (in case of a new series the list is empty), add new samples: a. Press < Add > field, the software automatically adds a new entry to the list. Name of a sample is given automatically (it is editable). 5. Number of samples on edited process, it is updated in real time by the software on adding a new sample to a series. Each added sample on the list has its current differential weighing status displayed (weighing phase carried out for a sample). Newly added samples do not have a status assigned – the field is empty. The status is updated in real time after completing each phase of sample’s weighing process. 25.4. An example of process for differential weighing mode On activating DIFFERENTIAL WEIGHING mode: • Select information to be displayed in the grey coloured workspace • Select appropriate quick access keys • Add a series to balance’s memory (a name identifies a series) • Add samples to a series (a name identifies a sample) • On adding samples return to the main window of the active working mode - 124 - SELECTING a series: Press quick access key <SERIES>. A window is displayed with database of series. On entering the database, press field with name of a series. It is automatically selected for completing. Name of the selected series is displayed in the grey coloured workspace (only if such information is enabled for displaying in the grey coloured workspace). On selecting a series, press one of below listed keys to carry out the process: Weighing A Weighing initial mass of a sample Tare (T) Weighing container for a sample - tarring Weighing (T+A) Weighing container for a sample (tarring) and weighing a sample (subsequent processes). Weighing B Weighing final mass of a sample. The process is accessible only if a given series contains samples with completed weighing records <A>. unless such weighing records are in series, the process is unavailable. - 125 - Weighing A On selecting an option, the balance moves to the first sample on the list, for which weighing <A> is still to be carried out. If there are no such samples in a series, the balance displays a message that such process is inaccessible. If such process is possible, then new data on initiated process is displayed in the grey coloured workspace. During process course the bottom bar and the workspace display data on the following steps that a user should follow. Place a sample on balance’s weighing pan and press < > key. On pressing the above key, a window is displayed for inserting ambient temperature and humidity value – if option <Ambient conditions> is set to <VALUE>, or the data on ambient conditions is automatically acquired from the ambient conditions module and displayed for confirmation – if option <Ambient conditions> is set to <ONLINE>. Caution: If option <Ambient conditions> in the working mode is disabled – set to <No>, the software skips this part of the process. On accepting the ambient conditions by pressing < > key, the software returns to the mode’s main window and displays a command on unloading the sample from the weighing pan (displayed in the message bar). The user should unload the sample from balance’s weighing pan and accept the activity by pressing < > key. The software automatically moves to the following sample in a series. - 126 - Follow above procedure and weigh the following samples. The process can be aborted by pressing < > key. Weighing T On selecting the option, the balance moves to the first sample in the list, for which weighing <T> is not completed. If there are no such samples in a series, the balance displays a message that such process is inaccessible. If such process is possible, then new data on initiated process is displayed in the grey coloured workspace. During process course the bottom bar and the workspace display data on the following steps that a user should follow. Load a container for a sample on balance’s weighing pan and press < key. > On accepting by pressing < > key, the software displays a command to unload the container from the weighing pan (displayed in the message bar). The user should unload the weighed container and accept the activity by pressing < > key. The software automatically moves to the following sample for which Weighing <T> has to be carried out. Follow above procedure and weigh the following containers The process can be aborted by pressing < > key. Weighing T+ A On selecting the option, the balance moves to the first sample in the list, for which weighing <T> is not completed. If there are no such samples in a series, the balance displays a message that such process is inaccessible. If such process is possible, then new data on initiated process is displayed in the grey coloured workspace. During process course the bottom bar and the workspace display data on the following steps that a user should follow. Load a container for a sample on balance’s weighing pan and press < key. > The mass value of a container is assigned to a sample as its tare value, balance indication is zeroed, and a command is displayed to load a sample in a container. Put sample into the weighed container and accept process by pressing < > key. On pressing the above key, a window is displayed for inserting ambient temperature and humidity value – if option <Ambient conditions> is set to <VALUE>, or the data on ambient conditions is automatically acquired from the ambient conditions module and displayed for confirmation – if option <Ambient conditions> is set to <ONLINE>. - 127 - Caution: If option <Ambient conditions> in the working mode is disabled – set to <No>, the software skips this part of the process. On accepting the ambient conditions by pressing < > key, the software returns to the mode’s main window and displays a command on unloading the sample from the weighing pan (displayed in the message bar). The user should unload weighed sample and the container from balance’s weighing pan and accept the process by pressing < > key. The software automatically moves to the following sample in a series. Follow above procedure and weigh the following samples. The process can be aborted by pressing < > key. In case of a single series, and while weighing the following samples, the measurements can be carried out according to the following outline: weighing A, weighing T or weighing T+A. Each of samples saved in a series shall have a description on its data, i.e. a status, which informs a user on current process phase completed for a given sample. On entering the database of series and previewing one of series, a window is opened with samples saves in the series. Status denotation: • weighing A, measurement completed for procedure <Weighing A> or <Weighing T+A> • weighing T, measurements completed for procedure <Weighing A> In order to preview detailed information on a sample, press field with its name. - 128 - The opened window contains the following data: In case the following procedure is completed for a sample: • weighing A only, then tare value is <0>, • weighing T only, then value of weighing A is <0> • weighing T+A, then for tare and weighing A the mass values are assigned. Data on a weighed sample can be printed on a connected printer on pressing a pictogram with a printer on display’s upper bar. In order to preview data on weighing A, press <Weighing A> field: In case in a given series there are samples for which weighing of initial mass (Weighing A) is already completed, it is possible to carry out final weighing (weighing B) for these samples. Weighing B Select option: On selecting the option, the balance moves to the first sample on the list, for which weighing <B> is not completed. If there are no such samples in a series, the balance displays a message that such process is inaccessible. If such process is possible, then new data on initiated process is displayed in the grey coloured workspace. Caution: Description <Weighing B> is accompanied by digits 1/3: <1> means, that it is the 1 measuring cycle type B, and <3> means, that the <NUMBER OF REPETITIONS> for this process is set to <3> (3 cycles). Remember, that the software requests to carry out the <FIRST> cycle out - 129 - of <3> from all samples in a series, for which this measurement is available (a condition is competing Weighing A for the sample). During process course the bottom bar and the workspace display data on the following steps that a user should follow. In case tare is assigned to a sample, then its value is indicated on the displayed with minus sign. Place a sample on balance’s weighing pan (if tare is applied, then place a sample into the container) and press < > key. On pressing the above key, a window is displayed for inserting ambient temperature and humidity value – if option <Ambient conditions> is set to <VALUE>, or the data on ambient conditions is automatically acquired from the ambient conditions module and displayed for confirmation – if option <Ambient conditions> is set to <ONLINE>. Caution: If option <Ambient conditions> in the working mode is disabled – set to <No>, the software skips this part of the process. On accepting the ambient conditions by pressing < > key, the software returns to the mode’s main window and displays a command on unloading the sample from the weighing pan (displayed in the message bar). The user should unload the sample from balance’s weighing pan and accept the activity by pressing < > key. The software automatically moves to the following sample in a series. Follow above procedure and weigh the following samples. The process can be aborted by pressing < > key. On completing measurements of final mass for the samples in a series, the user can check the results in the database of series. To check the results, enter the database of series and select a series, then a sample and a specific sample for which <Weighing B> has been carried out. On previewing a specific weighing, a window is opened with data and values on the weighing process. Numbers displayed next to weighing data <B> denote measuring cycles. Data on a specific series can be printed or exported to a file. - 130 - 25.5. Copy tare The option enables copying once selected tare value in a series to all samples which do not have tare value assigned, and for which differential weighing process (status other than Weighing B) is not completed. Means of operation: Press key Which displays list of samples for which tare value is assigned. Press tare value that should apply to other samples in a series (which do not have tare applied). The software automatically applies selected tare value to data of these samples. 25.6. Using option “SAMPLE SELECTION” The option enables selecting a sample that is prepared for weighing, with no need to weigh samples is a sequence as suggested by the software. The option is available only after initiating a given process. Means of operation: While in differential weighing mode, on selecting a series, press procedure selecting key, e.g. <Weighing A>. Then press the following key: which opens a list of samples for which the selected procedure can be carried out. Select a sample to be weighed from displayed list. This option is particularly useful if a series contains a large number of samples, and the user should weigh a sample that is at the end of a series. - 131 - 25.7. Deleting a value The option, in case of an error, enables deleting last weighing record added to the database. It applies to all processes in the working mode. The software enables deleting only the last carried out measurement. On accidental saving a weighing record (sample or tare), i.e. wrong sample or container, press the following key: The weighing record is automatically deleted, and the software returns to the previous step of the procedure. The process can be carried out only once. Any trial to use the option for second time results in displaying a message on incorrect operation, and deleting a record is aborted. 25.8. Printouts Option Printouts enables setting the contents of printouts in a standard printout and also determining non-standard printouts. Standard printout comprises five internal blocks, featuring different variables. Each variable can be attributed with parameter YES – i.e. present on a printout, or NO – i.e. not printed. Settings for header printout, weighing printout, and footer printout are specified in point. 15.5; below description refers to setting a printout template for a series and sample in differential weighing mode. A user can design content of a report. Content of a printout of a series: − − − − − − − Dashes Client Samples Empty line Dashes Signature Non-standard printout - 132 - Content of a printout of samples: Dashes Sample Sample no. Status Tare Temperature Humidity Pressure Non-standard printout Weighing A • Weighing A • Date • Time • Level status • Warehouse • Product • Packaging • Universal variable 1…5 • Net • Tare • Non-standard printout − Weighing B • Weighing B • Date • Time • Level status • Warehouse • Product • Packaging • Universal variable 1…5 • Net • Tare • Interval • Difference • Difference % • Residue % • Non-standard printout − − − − − − − − − − - 133 - 26. STATISTICAL QUALITY CONTROL – SQC Working mode < Statistical Quality Control > is intended to carrying out different types of product packing processes and aimed at monitoring and / or controlling the packing process. It enables detecting excess or lack of product quantity in a packaging. If the samples are weighed, and the results are stored in the database ,then the software enables carrying out a trend, and displaying them in a form of a chart. The software provides the possibility of controlling a batch comprising up to 1000 samples. Each completed control process is saved in the SQC database, and its results are ready for previewing in an optional moment. Each series has a determined set of parameters that are stored in the database: maximum, minimum, standard deviation and average value for each batch, etc. SQC control process can be carried out manually (by pressing <PRINT> button for each measurement) or automatically (the measurements are saved automatically after stability of indication for each measured sample). The balances feature an implemented module for statistical control processes. It is supported by a database containing list of products with error values <–T1> and <+T1> declared for each product. The control process is initiated automatically and completed on controlling a required quantity of samples, which is determined by the user in the SQC mode settings. After completing the control process the balance enables generating a final report containing all required data on the control. The report is printed on a connected printer. Data on a control is also automatically saved in the Database of SQC Reports. Control cycle runs in accordance with the following schema: • Selecting a user, • Selecting a product, • Control start, • Acquiring weighing records, • Automatic finish of control process after weighing required quantity of samples (a batch), • Printing a report on control process. - 134 - 26.1. Working mode activating procedure Procedure: • While in the main window, press soft key located in the upper bar of the display, which opens a submenu <Working modes> with selection of available working modes, • select < SQC>, mode, the software automatically returns to the main window and displays • pictogram in the upper bar, simultaneously, the message bar displays a command <Start control > and a soft-key on control start is visible in the bottom tool bar: Start control Control start procedure: • Starting a control process requires logging a user with corresponding access level. Caution: 1. Starting a control requires that an access level of the logged user is at least a <user>. If a logged user or an anonymous user have access level set to <guest> then on control start the software opens a message box informing on: <Unauthorized access>. 2. • Logging procedure is described in point 9 of this user manual, and procedure determining access level for each user is provided in point 13 of this user manual. Set general settings of working mode parameters to balance memory < SQC>, description in point 26.2, Select an appropriate product (by pressing a corresponding soft key < > in the bottom bar or using balance’s keyboard) with correctly entered data on a control: Caution: Data on a product, listed in the below table, have to be filled in before starting a control: Mass Nominal mass of a product Tare Packaging mass in the adjustment unit Min Value of –T1 error (specified in % of nominal mass) - 135 - Max Value of +T1 error (specified in % of nominal mass) Unit Measuring unit of a product: [g] Caution: Editing product records in the database is described in point 27.2 of this user manual. • After returning to the main window of the < SQC> mode press (control start) soft key located in the bottom bar of the display, • Which automatically opens an editing window <Batch Number> with an onscreen keyboard (only if in the mode settings of the option <Request batch number is set to <YES>), • Enter the batch number of controlled batch and accept it by pressing key. Caution: A user can abort the control process in an optional moment by pressing a (control stop) soft key located in the bottom bar of the display. On control progress other soft keys and function keys, the and keys are blocked. - 136 - 26.2. Additional settings of the SQC mode The additional settings enable adjusting the working mode to user’s needs and requirements. Access to these settings is described below. Procedure: 1. Press grey coloured workspace 2. The display indicates menu of: Settings, Keys, Information, Printout , Batch and Profile, 3. Press <Settings> key, 4. The display opens a window with set of available options The SQC mode is related to the following settings: − Request batch number Setting parameter value to <YES> causes that the software requests entering a batch number of a product before starting each control process. Procedure: Select a parameter: “ Batch number” which opens an editing window with available settings, Select required batch quantity, after which the software returns to displaying the previous window. − Declaring batch quantity Quantity (size) of a batch is a number of samples intended to be measured. Procedure: Select a parameter: “ Batch quantity” which opens an editing window <Batch quantity> with a numeric keyboard, Enter required batch quantity and accept by pressing key. − For the other settings follow the principle given in point 10.8 of this user manual “Additional parameters on weighing process”. 26.3. Carrying out a control process Before starting a control process select a product to be controlled from the database of products using a quick access key < selection the control is ready to be initiated. Product>. After product In order to start a control press key located in the bottom bar of the display. The software automatically opens an editing window with an on-screen keyboard for entering batch number of a product to be controlled. After entering and accepting the batch number, the software goes to another step of the process. As the control process is in progress, the software carries out a real time analysis of the results, inserts them in the corresponding fields of the display and simultaneously informs a user in the results of carried out control. - 137 - Messages displayed during a control process: Batch quantity 1 / 10 - A command on process course and the quantity of all measurements in a tested batch Product - Name of the controlled product Average - Average mass of the controlled product Standard deviation - Standard deviation from a controlled batch After completing the control process, the software generates a report, a the completed control is automatically saved in the corresponding database. Caution: A template and an example of a report on a control process is provided in point 26.7 of this user manual. 26.4. Report on product control An example of a report: ----------------- SQC -----------------User Product 000 Start date 2012.10.19 12:27:09 End date 2012.10.19 12:37:20 Batch number ppp Batch quantity 10 Nominal mass 50 g Limit T25g 10 % Limit T12.5 g 5% Limit T1+ 1g 2% Limit T2+ 2g 4% --------- Measurement 1 -------------Net 49.998 g --------- Measurement 2 -------------Net 49.998 g --------- Measurement 3 -------------Net 50.021 g ---------Measurement 4 --------------- 138 - Net 50.038 g ---------Measurement Net 50.053 g ---------Measurement Net 50.030 g ---------Measurement Net 50.012 g ---------Measurement Net 50.029 g ---------Measurement Net 50.007 g ---------Measurement Net 50.008 g 5 --------------6 --------------7 --------------8 --------------9 --------------10 ------------- Number of T2- errors 0 0% Number of T1- errors 0 0% Number of T1+ errors 0 0% Number of T2+ errors 0 0% Average 50.0194 g Standard deviation 0.01714 g ---------------------------------------Signature ........................................ Report template: The balance user in the submenu < Printouts / Printout template of a SQC report > can edit a template of a report on product control. The variables attributed to <YES> are printed in a report. - 139 - 27. PREPACKAGED GOODS CONTROL (mode not available in balance’s standard version) < PGC> mode operates packed goods control (single stand control or multistand control) supported by a database containing products and users. A control initiated from a balance is automatically switched of after a pre-set number of packages (samples) has been controlled. Balances may connect to E2R SYSTEM software and form a multi-stand system (network). Each balance is an independent weighing stand and information on control progress is transmitted continuously to a software. The software makes collection of real-time data from each connected balance possible. Control may be activated either by means of a balance or the software. Collected data allow the user to assess quality of produced prepacked goods and its conformity with: • regulations concerning prepacked goods control of a given country; • a company quality control system (internal control). Control cycle scheme: Select a user, Select a product, Start control, Acquire weighing records, Automatically switch off control after a determined number of packages (sample) has been weighed, • Print a report on completed control. • • • • • Caution: Description of balance connection with < chapter 31.1. E2R System> is to be found in 27.1. Working mode activating procedure Procedure: • While in the main window, press soft key located in the upper bar of the display, which opens a submenu <Working modes> with selection of available working modes, • select< PGC>mode, the software automatically returns to the main window and displays • pictogram in the upper bar, Simultaneously, the bottom information bar displays a text <Start control>and the bottom bar includes a soft key: - 140 - Start control 27.2. Control settings CAUTION: Before entering control settings the user must log in following the login procedure. Press window: button located in a < PGC> mode window to open control settings Where: Selction of a product from a database Batch number Control start - 141 - 27.3. Local settings of PGC mode Local settings of < PGC> mode are available upon clicking grey-coloured information field located in a main window of PGC mode. Average tare estimation Printout mode / Enter mode (approvals) Printout Switch on/off option of avarage tare estimation before control activation. Detailed description in chapter < ADDITIONAL PARAMETERS ON WEIGHING PROCESS> 27.4. Editing product for control Go to submenu „ Database” to edit a product. / Caution: For cooperation with < E2R System> software database editing is blocked on a balance. Products edition and export is carried out by means of the software. Procedure: • Enter submenu „ • Enter database < / Database”, Products> select a given record. - 142 - List of data defined for control: Pictogram Data Description Name Name Code Product code EAN code Product EAN code Mass Product nominal mass Tare PGC mode Batch Tare value of a product (pre-set automatically while selecting a product out of the database) Control type: Non-destructive average tare, Non-destructive empty – full, Destructive full – empty, Destructive empty – full Series of measurements for control: Non-destructive empty – full, Destructive full – empty, Destructive empty – full Unit Unit of a product: [g] or [ml] Batch quantity Time interval for avarage tare estimation Declaration of number of items of controlled batch Numer of packagings Internal control Density Time interval given in [h] determining how often average tare must be estimated for a given product Declaration of number of packagings that are to be used for process of average tare estimation (for Nondestructive average tare type of control) Submenu for defying criteria for internal control (see the next chart) Product density (value range 0,1g/cm3 5g/cm3) Apart from above listed options there are other ones which may be used for different working modes (e.g. CHECKWEIGHING, THRESHOLDS, etc.) - 143 - • List of data for internal criteria Internal control Internal control criteria on <YES> / off <NO> Sample quantity Sample quantity value for a product Error value of marginal negative T (-T) given in unit of product nominal mass Qn. Measurements lower than value of Qn-T are regarded as valid. Error value of marginal positive T (+T) given in unit of product nominal mass Qn. Measurements higher than value of Qn+T are regarded as valid. Error value [- T] Error value [+ T] Quantity of smaple [Qn-2T] dis. Number of negative errors (–2T) of a tested Quantity of smaple [Qn-2T] dis. Number of positive errors (+2T) of a tested sample which disqualifies control sample which disqualifies control Quantity of smaple [Qn-T] dis. Quantity of smaple [Qn+T] dis. Number of negative errors (–T) of a tested sample which disqualifies control Number of positive errors (+T) of a tested sample which disqualifies control Mode for estimation of average limit value Average limit value (constant or automatic) Average limit value - Value of average limit (negative) of a tested sample (concerns value of average limit as “constant”) Average limit value + Value of average limit (positive) of a tested sample (concerns value of average limit as “constant”) Multiplier of standard deviation for value of Factor value [-Wk] average limit (negative) calculated automatically Multiplier of standard deviation for value of Factor value [+Wk] average limit (positive) calculated automatically - 144 - 27.5. Control start procedure To start control: • a user with corresponding access level should be logged in. Caution: Logging procedure and access levels are described in chapter 8 – LOGGING. • Select appropriate product with correctly entered data, when the data is entered in regard to control • Enter weighing mode parameters into balance memory, Batch number – for identification of controlled products batch. Batch quantity – software will control specified number of samples. Average tare estimation – option for average tare estimation, number of packagings needed for its estimation, more than 10. • Remove load from a weighing pan, - 145 - • Press START located in a bottom part of a parameters settings window. Program shall proceed to the main window of product control, used for entering data. Caution: If before control: • Load has not been removed from the weighing pan or if other requirements for zeroing have not been fulfilled (e.g. unstable indication), than message <-Err 2> shall be displayed. Upon noticing <-Err 2> message the user shall unload the balance and wait until all zeroing requirements are met, • The user has not logged in or is logged but has not got the right access to perform control, than <No authority/Access denied> message shall be displayed, The user has not selected product out of database than <Product not chosen> message shall be displayed. 27.6. Abort control procedure • The user may abort procedure being in progress at any chosen moment, to do it button (abort control) must be pressed. The button is located in bottom part of the window. Upon pressing the button displayed (abort control) the following message is To abort control the user must press button , the program gets back to a setting window of PGC mode. Control report with status <Aborted> is saved to < Controls> database. To proceed with the control the user must press button . 27.7. Aborted control restoring procedure, power loss case Program keeps records of control results continuously, this prevents loss of data (for control being in progress) in case of disconnection from mains. For power - 146 - loss case the program allows to complete an aborted control upon reconnection to mains. CAUTION: The weighing pan cannot be loaded before being connected to mains again. Balance activation should be carried out when the weighing pan is empty. During balance activation the program searches for any in course control procedure. If there is one, message “Restore interrupted control?” is displayed on the end of balance activation. Press button to leave control procedure and proceed to weighing. Press button to complete aborted control procedure. Upon pressing button control procedure continues from the moment of its abortion. 27.8. Non-destructive average tare control mode Before control the user may perform estimation of average tare by weighing packagings. It is possible upon activation <Average tare determining> function. To activate this function the user must go to setting window of PGC mode and press grey coloured field of the main display of <SETTINGS> parameters. During tare control the following window is displayed: - 147 - Where: Product - Product name Condition value 0,25T , given in [g] Average mass of a packaging, given in [g] Standard deviation - Negative errors T1 characteristics per sample - Negative errors 2T1 characteristics per sample - Net mass of a controlled packaging - Tare of a packaging Load empty - Control status of a packaging - Command for process in progress with specified number of all packagings to be weighed Work pane in a form of graph. Graph applies to control of mass, while estimating average tare value preview of packaging mass distribution is not possible. - Information about control - Abortion of a control process Caution: If a product is to be controlled by “Non-destructive average tare” mode, than accordingly to regulation its packaging mass standard deviation “S”, based on at least 10 measurements cannot be greater than 0.25 of maximal tolerable negative error T, for nominal packaging mass. After the last measurement packaging mass has been performed the program displays summary, and a report on performed process is automatically saved to database: - 148 - Press buton to proceed to control without saving to product data the newly estimated average packaging mass. Press buton to proceed to control with saving to product data the newly estimated average packaging mass. Measurements results are analysed continuously during control, they are displayed in respective fields: Where: Bargraph product - Information on product net mass in a form of graph: green bargraph – mass within tolerance range: [-T], and [+T] of net mass. Yellow bargraph – mass within tolerance range: [-T], and [-2T] of net mass. red bargraph – mass below net mass [NETTO – 2T]. - Controlled product name - 149 - - Nominal value of a controlled product Average mass of a controlled product Value of disqualifying average Negative errors T characteristics per sample: -9g – value of negative error T, T Max – tolerable number of negative errors T, n - actual number of negative errors T - Negative errors 2T characteristics per sample: -18g - value of negative error 2T, 2T Max - tolerable number of negative errors 2T, n - actual number of negative errors 2T - Net mass of a controlled product - Packaging tare - Control status: positive, negative - Command for process in progress with specified number of all packagings to be weighed Load full - Work pane options: numerical data / graph - Information about control or performed control measurements indications - Abortion of a control process • Control status Control status is presented by the following pictograms: - positive, - negative (control of sample 2 permitted) - negative For status respective field of a work pane turns to yellow: - yellow warns that occurrence of another T error will end with negative result of control. For status respective field of a work pane turns to red: - average mass of controlled product is lower than disqualifying average value - 150 - • Work pane Upon pressing button measurements results: Press • the work pane takes form of a graph with button again to switch the graph off. Information about control Upon pressing button settings is displayed: respective window with information on control Window for control in progress: - 151 - Press button control: to see a window with measurements performed for actual Upon control completion summary of the process is generated, control is automatically saved to database: - 152 - Press button to print report on a printer connected to the balance. Press to get back to setting window of < PGC> mode without printing the report. Caution: For cooperation with < E2R System> summary process message shall not contain a query for report printout. All data are automatically sent to a computer program, report may be printed by means of a computer. If during the control course the number of negative T errors detected by the software requires controlling another sample from the batch (as specified by the regulation on CPG), then on completing the measuring process of sample 1 the software displays a command to control another sample from the batch: Press button for confirmation, the text and tolerable number of errors will actualize. Upon completion of second sample control the program will generate summary of the control. Report on performed control may be printed on a printer connected to a balance. Caution: A template and an example of a report on product control is provided further down this user manual. 27.9. Non-destructive empty – full control mode For „Non-destructive empty – full” control the user pre-sets „batch” to be measured. The “batch” is pre-set in a product data. The program accordingly to the pre-set “batch” displays a message asking the user to weight empty packagings first, next full in the same order: - 153 - Where: Product Code - Controlled product name Controlled product code Controlled product nominal value Controlled product average mass Disqualifying average value - Negative errors T characteristics per sample - Negative errors 2T characteristics per sample - Net mass of controlled product - Packaging tare - Control status Load empty 1/3 - Command for process in progress - Work pane options: numerical data / graph - Abortion of a control process Upon control completion, the software generates a summary (report) from the process, and the completed control is automatically saved in the balance’s database. Caution: A template and an example of a report on product control is provided further down this user manual. - 154 - 27.10. Destructive empty-full and full-empty control mode In the “destructive” control mode independently on the size of product lot over 100 pieces, the sample set by the software for testing is always 20 pieces. The other control assessing criteria are set in accordance with the regulation. After using the list to select a product with set parameters for destructive control with determined measuring “match” (manufacturing unit) and starting a destructive control, the software displays commands aiding the control process (as in case of the controls described above). Depending on enabled control mode, the sequence of products to be weighed is either: “empty-full” or “full-empty”. Caution: Remember to maintain the weighing sequence of products together with the packages and empty packages. It is necessary to let the software correctly calculate mass of a load placed in its corresponding packaging. On control completion, the software generates a process summary and the completed control is automatically saved in the balance’s database. Caution: A template and an example of a report on product control is provided further down this user manual. 27.11. Control according to internal criteria Select appropriate product with correctly entered data, when the data is entered in regard to control performed according to internal criteria (see chapters above). Press button to start control after weighing mode parameters have been entered into balance memory (accordingly to the instruction). The button is located in a bottom part of a window. In course of the control the software continuously analyses measurements results and displays them in a respective fields: - 155 - Where: Product Code - Controlled product name Controlled product code Controlled product nominal value Controlled product average mass Disqualifying negative average value Disqualifying positive average value Negative errors T characteristics per sample (according to point 30.6 of this manual) - Negative errors 2T characteristics per sample (according to point 30.6 of this manual) Load empty 1/10 - Positive errors T characteristics per sample: 4,5g – value of positive error T, T Max – tolerable number of positive errors T, n – actual number of positive errors T - Positive errors 2T characteristics per sample: 9g - value of positive error 2T, 2T Max - tolerable number of positive errors 2T, n - actual number of positive errors 2T - Command for process in progress - Work pane options: numerical data / graph - Abortion of a control process On control completion, the software generates a process summary and the completed control is automatically saved in the balance’s database. Caution: A template and an example of a report on product control is provided further down this user manual. - 156 - 27.12. A report on determining average tare value An example of a report: Report on average tare: U/22/08/12/14/21/T ---------------------------------------Balance type PS 3Y Max capacity 1000 g Reading unit 0.001 g Balance ID 9908684 Date 2012.08.22 14:21:10 Product 1 Tare 10.0002 g 0.25 T1 0.225 g No. of measurements 10 Standard deviation 0.000632 g Result Positive Measurements 1. 9.999 g 2. 10.000 g 3. 10.000 g 4. 10.000 g 5. 10.000 g . . . 10. 10.001 g ---------------------------------------Signature ........................................ Report template: The balance user in the submenu < Printouts/ Printout template of a report on average tare > can edit a template of a report on product control. The variables attributed to <YES> are printed in a report. - 157 - 27.13. A report on product control An example of a report: ----- PCG Report: U/22/08/12/14/22 -------------------------------------------Balance type PS 3Y Max capacity 1000 g Reading unit 0.001 g Balance ID 9908684 Start date 2012.08.22 14:20:11 End date 2012.08.22 14:22:35 User Product 1 Batch no. 555 Nominal mas 10 g Tare 10.0002 g Value of T1 error 0.9 g Value of 2T1 error 1.8 g Value of +T1 error g Value of +2T1 error g Batch quantity 100 No. of measurements 30 No. of T1 errors 0 No. of 2T1 errors 0 Min 49.999 g Max 50.001 g Average 50.00057 g Total 1500.017 g Average limit 9.99969 g Average limit [+] g Standard deviation 0.000626 g PGC mode Non-destructive average tare Result Positive Measurements 1. 49.999 g 2. 49.999 g . . 28. 50.001 g 29. 50.001 g 30. 50.001 g ---------------------------------------Signature ........................................ Report template: The balance user in the submenu < Printouts/ Printout template of a CPG report > can edit a template of a report on product control. The variables attributed to <YES> are printed in a report. - 158 - 28. MASS CONTROL (not available in standard balance version) Working mode < Mass control> enables controlling mass of a product that is automatically batched (dosed) onto the balance’s weighing pan by an automatic feeder PA-02/H that is connected to the balance. The working mode automatically controls a complete batch of tested product after determining its quantity. 28.1. Working mode activating procedure Procedure: • select < Mass control> the software automatically returns to the main window and displays pictogram in the upper bar, • Automatically a single on-screen button appears in the bottom bar of the display: Start mass control process 28.2. Mass control global settings Entering the mode settings is carried out by pressing the grey coloured workspace and selecting an group of parameters named "Settings" < which contains the following: Request batch number Batch quantity Low limit High limit Print report Printout >, The function orders requesting a batch number before starting mass control process. Determines quantity of a batch, i.e. number of product units to be controlled. A value exceeding which causes accepting a measurement record by a balance. A value exceeding which causes omitting a measurement in the summary, e.g. if two parts (pills) are simultaneously dispensed on balance’s weighing pan. A parameter enabling for switching on/off automatic printout of a report on completing mass control process. A parameter enabling selecting whether on completing the control process the balance should trigger a standard or a non-standard printout. 28.3. Mass control process Before starting the mass control process carry out the following steps: - 159 - • Set batch quantity of a carried out mass control process – touch grey coloured workspace on balance’s display to open a window and select group < Settings>. Next select option < Batch quantity> for entering quantity of controlled units in a current automatic mass control process. Accept entered value by pressing key. • Set < Low limit> below the value of the smallest (lightest) controlled part. Set the limit value so that it protects against saving in a final report mass of a value below the lightest item of the controlled batch, e.g. a half of a pill. • Set < High limit>value. Set the limit value so that it protects against saving in a final report mass of a value exceeding the heaviest item of a controlled batch, e.g. if two pills are simultaneously dispensed onto a weighing pan. In such case, the software skips the measurements and continues mass controlling process. Set < Dosing power> parameter defined in [%] and ranging from 0% to 100 %, nominal mass (Mass), limits for errors: negative - <T1-> (Min) and positive - <T1+> (Max). The error values are determined in % of nominal mass value. The dosing power, mass and error values are determined for each controlled product separately. The errors <T2-> and <T2+> are not to be determined by a user. The software sets their values as doubled value of errors <T1-> and <T1+>. Setting procedure of control parameters: • when in the main window press SETUP key, and select < Databases >, and < Products>options. then, select a product entry from the database for which the above values need to be set. Set required parameters and return to the main menu. • Select a product to be controlled from the database < • On selecting all applicable settings press key to start automatic mass control process. The mass control process is started automatically, the balance is automatically tarred, and the feeder starts dispensing the first element onto balance’s weighing pan. On dispensing the first element onto balance’s weighing pan, the feeder is stopped and the dispensed item is weighed. The first stable measurement result is saved. On saving a measurement result the mass indication on balance’s display is zeroed and the automatic feeder is restarted to dispense the following product onto balance’s weighing pan. As the following product is dispensed onto the weighing pan the weighing process starts. The procedure is repeated the same way as in case of the first dosed element. The cycle is repeated until checking (weighing) all of declared pieces in the <Batch quantity> parameter. During control process, balance’s display shows on an ongoing basis basic parameters on the carried out control, i.e.: − Set standard quantity − Product − Average • • • • • - 160 - >. − Standard deviation − Number of T1- errors − Number of T1_ errors On completing the measuring process for a specific batch, the balance generates a report that is printed on a printer connected to the balance, and simultaneously saved on the corresponding database. • CAUTION: Each control process can be aborted at an optional moment by pressing key on balance’s display. On pressing the process is stopped and the control is cancelled (no report is generated for an aborted control). 28.4. Printouts Option Printouts enables setting the contents of printouts in a standard printout and also determining non-standard printouts. Standard printout comprises four internal blocks, each featuring different variables. Each variable can be attributed with parameter YES – i.e. present on a printout, or NO – i.e. not printed. Settings for header printout, weighing printout, and footer printout are specified in point. 15.5; below description refers to setting a printout template from a mass control report. A user can design content of a report. CAUTION: The content of data in each measurements present in the report is set in option <Weighing printout template >. Each time a report is printed, the space dedicated for printouts is filled in with data which is marked with an attribute <YES> in the < Weighing printout template >. Content of each report: − − − − − − − Working mode Date Time Balance type Balance ID Report no. User - 161 - − − − − − − − − − − − − − − − − − − − − − − − − Product Start date End date Batch no. Standard quantity Nominal mass Threshold T2Threshold T1Threshold T1+ Threshold T2+ Measurements Quantity of errors T2Quantity of errors T1Quantity of errors T1+ Quantity of errors T2+ Average Average [%] Standard deviation Standard deviation Standard deviation [%] Empty line Dashes Signature Non-standard printout 28.5. Report on completed mass control processes On completing any type of mass control process a report is generated. The report is saved in the database < Mass controls >. The files are named by their date and time (hour) of process completion. - 162 - 29. DATABASES Software of balances 3Y series features the following databases < PRODUCTS WEIGHING RECORDS CLIENTS FORMULATION REPORTS FROM FORMULAS REPORTS FROM DENSITY CONTROLS AVERAGE TARE PIPETTES PIPETTE CALIBRATION REPORTS SERIES SQC REPORTS MINIMUM SAMPLES MASS CONTROLS AMBIENT CONDITIONS PACKAGES WAREHOUSES PRINTOUTS UNIVERSAL VARIABLES DELETE DATA OLDER THAN EXPORT DATABASE OF WEIGHING RECORDS TO FILE - 163 - >: 29.1. Processes carried out on databases Databases can be operated only by an authorized personnel. In order to edit databases proceed as follows: - Press and hold for a moment a button with a respective database icon - Wait to see a database menu - Select one of available options (options depend on a database type) Options description: − OPEN – option allows to enter a chosen database (result is similar to the one obtained by a single click) − IMPORT – option allows to import data from a data storage device. Plug the data storage device to a chosen USB port, upon its detection a window with a list of saved files will open. Select file with data to be imported. The copying starts automatically. Upon completion of the process a message <Completed> is displayed. Confirm completion. − EXPORT - option allows to export data from a selected database to a data storage device. Plug the data storage device to a chosen USB port, upon its detection the software will automatically start a copying process. On completion of the copying process a window with both, a file name to which data has been saved and message <Completed> is displayed. Confirm completion. − INFORMATION – option allows to display data about database content (see the picture below). Upon clicking button the program returns to the previous window. − CANCEL - the program returns to the main window. - 164 - The following processes can be carried out in almost any of databases: 1. Adding entry to a database < > 2. Searching for a record in a database by name < 3. Searching for a record in a database by code < > > 4. Searching for a record in a database by date< > 5. Exporting database content to a data storage device through USB port < > 6. Printing data on a specific record from a database < > The above processes are carried out by pressing dedicated soft keys located in the upper right corner of the display. Follow hints and commands displayed by the balance’s software. 29.2. Products Database of products contains names of all products that are weighed, counted or controlled. Procedure • Enter submenu < Databases>, and press < Products> field • • Press < Add > key to add a new product to the database Select one of available options: List of parameters defined for a product: 1. Name 2. Description 3. Product code 4. EAN code 5. Mass [unit mass of a product] 6. Dosing power [enabled only in <Mass control> mode, and determined in [%] from 0% to 100 %. It is operation power of the automatic feeder PA-02/H. The value of dosing power has to be determined by tests dependent on size, shape and mass of dispensed parts (pills)] 7. Min [Minimal mass for weighing the product using result control thresholds – LO. Value of error <T1-> in working mode <Mass control> determined as percent of the nominal mass] 8. Max [Maximal mass for weighing the product using result control thresholds – HI. Value of error <T1+> in working mode <Mass control> determined as percent of the nominal mass] 9. Tolerance [% value calculated in relation to mass (5), denoting measuring area in which the measurement is recognized as correct. - 165 - 10. Tare 11. 12. 13. 14. 15. 16. 17. 18. 19. 20. 21. 22. 23. 24. [product’s tare value, set automatically on selecting a product from the database] Price [Unit price of a product] PGC mode [control mode (Non-destructive average tare, Nondestructive empty – full, Destructive full – empty, Destructive empty – full)] Batch [measuring batch for control: Non-destructive empty – full, Destructive full – empty, Destructive empty – full ] Unit [product measuring unit] Batch quantity [Option available only for <PGC> mode, specifies controlled product batch quantity] Average tare estimation time interval [Option available only for <PGC> mode, specifies minimal time interval needed for estimation of a packaging average tare; given in [h]; if software detects that pre-set time interval has passed it displays a message <Estimate average tare>. It is the user who decides whether to estimate the tare again or not. The message has an informative function only. Numer of packagings [Option available only for <PGC> mode, specifies number of packagings needed for estimation of average tare Internal control [Option available only for <PGC> mode, allows for specification of internal control criteria accordant with company standards for a given product] Density [product’s density, used for compensating air buoyancy, as sample density] - [g/cm3] Shelf-life time in days Date [Set product’s date (constant)] VAT [VAT value related to a product] Ingredients [Editing field for inserting names of ingredients used for preparing a product, e.g. if a product is a mixture, or if a product requires additional description of its features or application] Printout [printing a template assigned to a product] CAUTION: Remember to assign products to corresponding functions, as some of data values is attributed according to their modes, e.g. thresholds in <Checkweighing> mode are set in [g], while thresholds in <Parts counting> mode are set in [pcs]. The values are selected automatically depending on which mode is enabled while entering a database. - 166 - 29.3. Weighing records Each measurement result sent from a balance to a printer or a computer is saved in the database of weighing records (see an exception – point 10.8. – Result control). Balance user can preview data from each weighing record. Procedure: • Enter submenu < • Enter database of < (record). Databases> Weighing records> and press desired entry List of parameters for a weighing record saved in the database: 1. Measurement date 2. Measurement result 3. Tare value 4. Determination of measurement status (stable / unstable) 5. Product name 6. User 7. Client, Client name 8. Working mode name 9. Warehouse, name of source warehouse 10. Packaging, name of tare applied during weighing product’s weighing process 11. Result control, information on threshold in which the weighed product was placed: MIN – below LOW threshold (possible only if <Result control> is set to NO>) OK – between the LOW and HIGH thresholds, MAX – above HIGH threshold (possible only if <Result control> is set to NO>), 12. Weighing platform no., field denoting number of a weighing platform (balance/scale) on which a measurement was carried out, 13. Levelling, demonstrates if level status was maintained during measurement, 14. Ambient conditions alerts, demonstrates if temperature and humidity were stable during measurement. - 167 - 29.4. Clients Database of Clients contains name of Clients for whom the measurements are carried out. Procedure • Enter submenu < Databases>, and press < Clients> field • • Press < Add > key If a client already exists in the database of clients, press field with its name List of parameters defined for a client: 1. Client name 2. Client code [internal code identifying a client] 3. VAT no. [tax identification no.] 4. Address 5. Postal code 6. City 7. Discount 8. Printout [type of printout, label declared to a client] 29.5. Formulation Database of Formulas contains list of designed formulas / mixtures, which can be prepared by weighing each of formulation’s ingredients. Procedure • Enter submenu < Databases>, and press < Formulas> field • • Press < Add > key should a new formulation be designed If a formulation already exists in the database, press field with its name. List of parameters defined for a formulation: 1. Name 2. Code 3. Ingredients 4. Number of ingredients 5. Sum 29.6. Reports on formulation Contain data on completed formulas. Each report can be previewed, searched by name, date, code or exported and printed. Procedure Enter submenu < Databases>, and press < Reports from formulation> key • Press field of a desired report record, unless it is visible on the top of the list, wind the list forward using navigating keys • Report’s name consists of date and time of its creation, e.g.: • - 168 - 2011.10.12 15:12:15 Caution: It is possible to use an option for searching a report on formulation. List of parameters in a report on formulation: 1. Start date 2. End date 3. Formulation 4. Sum 5. Target value 6. User 7. Client 8. Warehouse 9. Number of measurements 10. Status 29.7. Reports on density Reports from density contain data on carried out density determination processes of solids, liquids and air. Each report can be previewed, searched by name, date, code or exported and printed. Procedure Enter submenu < Databases>, and press < Reports from density> key • Press field of a desired report record, unless it is visible on the top of the list, wind the list forward using navigating keys • Report’s name consists of date and time of its creation, e.g.: 2011.12.12 11:12:15 • Caution: It is possible to use an option for searching a report on density. List of parameters in a report on density: 1. Sample number, field with a value if in Density mode option: Request sample number is set = YES 2. Start date 3. End date 4. Density [calculated density of a sample of solid, liquid or air] 5. Volume [calculated volume of tested sample, density measurement of solid object] 6. Procedure [depending on selected procedure, data contained in a report may change] 7. User [name of a user carrying out the procedure] 8. Product [name of tested sample] - 169 - 9. Standard liquid 10. 11. 12. 13. 14. 15. 16. 17. 18. [name of liquid used for determining density measurement of solid object] Standard liquid density [density determination of solid object] Temperature [temperature of liquid used for carrying out a measurement, density determination of solid object] Plunger volume [density determination of liquid] Mass of steel standard [density determination of air] Mass of aluminium standard [density determination of air] Density of steel standard [density determination of air] Density of aluminium standard [density determination of air] Weighing 1 [mass measurement of tested sample or a plunger in the air, or mass of measured steel standard] Weighing 2 [mass measurement of tested sample or a plunger in liquid, or mass of measured aluminium standard] 29.8. Controls (not available in standard balance version) Each product control carried out on a balance is sent to a connected printer and saved in the < Controls>database. Each control saved in the database features its specific number set at the moment of its completion. Control number format: X / y y / M M / d d / H H / m m, where: X- control type which takes the following values: U – control regulated by the act, Z – control completed by a user, W - control regulated by an internal criteria yy – year of control end, MM – month of control end, dd – day of control end, HH – hour of control end, mm – minute of control end. Balance user can preview data on each control. Procedure • • Enter submenu < Databases> in accordance with point 27 of this user manual, Enter < Controls>database and select a desired control record. List of parameters defined for a control: 1. Batch number [batch no. of a controlled product] - 170 - 2. 3. 4. 5. 6. 7. Result Start date End date Product User Average 8. Average limit 9. Standard deviation 10. Quantity 11. No. of measurements 12. Method [status (result) of a control] [date of control start] [date of control end] [name of a controlled product] [name of a user carrying out the control] [average value from carried out measurements] [average disqualifying value] [average standard deviation] [the value batch quantity (batch size) for which the software accepts the size of tested sample in accordance with the regulation] [no. of completed measurements] [control method (internal criteria, regulated by the act)] 29.9. Average tares (function not available in standard balance version) Before starting a <Non-destructive average tare> control it is possible to determine the average tare value by weighing the packages. Each of above processes is automatically saved in the < Average tare>database. Each control saved in the database on determining average tare value features its specific number set at the moment of its completion. Control number format: X / y y / M M / d d / H H / m m, T where: X- control type which takes the following values: U – control regulated by the act, Z – control completed by a user, W - control regulated by an internal criteria yy – year of control end, MM – month of control end, dd – day of control end, HH – hour of control end, mm – minute of control end, T – control with determining the average tare value. Balance user can preview data on each process of average tare determination. Procedure • • Enter submenu < Databases> in accordance with point 27 of this user manual, Enter < Average tare>database and select a desired record. List of parameters defined for a control: - 171 - 1. Product 2. 3. 4. 5. 6. Status Date Tare S 0,25 T1 7. No. of measurements 8. User 9. Method [name of a product which packaging is checked for average tare determining process] [status (result) of a process] [date of carried out process] [determined value of packaging tare] [average standard deviation] [the value of a criterion for process result] [Number of completed measurements of tare value] [name of a user carrying out the process] [control method (internal criteria, regulated by the act)] 29.10. Pipettes Database of Pipettes contains records and specification on pipettes to be calibrated. Procedure • Enter submenu < Databases>, and press < • • Press < Add > soft key should a new pipette be added, If a pipette already exists in the database of pipettes, press field with its name to enter its specification which is optionally configurable. List of parameters defined on a pipette: 1. Name 2. Code 3. Model 4. Tip 5. Type of volume 6. Nominal volume 7. Minimal volume 8. Number of channels 9. Type 10. Tested volumes - 172 - Pipettes> field 29.11. Reports on pipette calibration processes Reports contain data on completed pipette calibration processes. In case of multichannel pipettes, the reports are generated for each channel separately. Each report can be previewed, searched by date, exported or printed. Procedure Enter submenu < Databases>, and press < Reports from pipette calibration processes > • Press field of a desired report record, unless it is visible on the top of the list, wind the list forward using navigating keys • Report’s name consists of date and time of its creation, e.g.: 2012.03.12 11:12:15 • Caution: It is possible to use an option for searching a report. List of parameters in a report on pipette calibration process: 1. Pipette [name from the database of pipettes] 2. Serial no. [serial no. inserted during calibration process] 3. Channel no. 4. Start date 5. End date 6. User [name of a user carrying out calibration] 7. Client [client name] 8. Number of measurements [no. of measurements for each tested volume] 9. Operation with ISO 8655 [information if errors comply with the standard] 10. Status [information whether the errors are below permissible value accepted for the tested volume] 11. Temperature [average temperature value during calibration process] 12. Humidity [average humidity value during calibration process] 13. Pressure [average pressure value during calibration process] 14. Water temperature [average water temperature during calibration process] 15. Z coefficient [value if the Z coefficient for given temperature] 29.12. Series Database of series contains data saved for a series and measurements of samples. Procedure • Enter submenu < • Press < Databases>, and press < Series> field Add > key to add a new series to the database - 173 - • If a series already exists in the database, press field with its name to edit data that is optionally editable List of 1. 2. 3. 4. 5. parameters defined for a series: Name Code Client Samples Number of samples 29.13. A report on SQC Each completed product control is sent to a connected printer and saved in the <SQC Reports >database. Each record (control) saved in the database features its individual number assigned at the moment of control end. Control number format: y y / M M / d d / H H / m m / s s, where: yy – year of control end, MM – month of control end, dd – day of control end, HH – hour of control end, mm – minute of control end, ss – second of control end. The user can preview data contained in each of control records. Procedure: Enter submenu < Databases > in accordance with point 27. of this user manual, • Enter database < SQC Reports > and press a needed record from a completed control. • List of parameters defined for a control: 1. Batch number [Batch number of a controlled product] 2. Start date [Date of control start] 3. End date [Date of control end] 4. User [Name of operator carrying out a control] 5. Product [Name of controlled product] 6. Batch quantity [Number of controlled samples] 7. Average [Average value from completed measurements] 8. Standard deviation [Average standard deviation] 9. Min [Minimum value of completed measurements] 10. Max [Maximum value of completed measurements] 11. Number of T2- errors [Quantity of –T2 errors] 12. Number of T1- errors [Quantity of –T1 errors] - 174 - 13. Number of T1+ errors [Quantity of +T1 errors] 14. Number of T2+ errors [Quantity of +T2 errors] 15. A chart from control processes 16. A chart from control processes with limits 29.14. Minimal sample weight The database of minimal sample weight contains data on declared methods and minimal sample weight for a balance. Caution: Only authorized RADWAG personnel can enter new minimum sample records or make changes in minimum sample records stored in the database. Procedure • Enter submenu < Databases> and press < Minimum samples> Press < Add > button should a new minimum sample be added, If a record on minimum sample is already stored in the database, then press field with its name to enter its details that are optionally editable, List of parameters determined for a minimum sample: 1. Name – name of a method used for determining minimal sample weight on a balance 2. Code – method code • • - 175 - 3. Description – method description 4. Next control – a field for entering expiry date of the minimum sample. 2 weeks before the expiry date the pictogram on minimum sample status displayed in the mass measuring window section is supplemented by a clock. It informs on the approaching expiry of the minimum sample. Contact RADWAG representative to carry out necessary changes in minimum sample settings. 5. Limits – option that enables entering data on the mass value of a minimum sample and range of packaging mass (tare) with applicable criteria: Tare – maximum value of tare for which the minimum sample is valid. the software enables entering three characteristic quantities: 0.000g, optional mass from balance measuring range and Max balance measuring range (see a below example). Minimum mass – the value of minimum mass that is determined for a balance in its place of use and using appropriate methods. Example no. 1 a balance AS 220.3Y, d=0.0001 g: This balance has the following values of minimum sample determined for the following values of packaging mass. No. Tare value Minimum sample 1 0.0000 g 2 10.0000 g 1.0000 g 3 50.0000 g 2.5000 g 4 200.0000 g 4.0000 g 0.1000 g Means of operation The minimum sample refers to all net weighments that are weighed without a packaging (the <TARE> button is not applied) The minimum sample refers to all net weighments that are weighed in a packaging that mass ranges from 0.0001 g to 10.0000 g inclusive (the <TARE> button applied) The minimum sample refers to all net weighments that are weighed in a packaging that mass ranges from 10.0001 g to 50.0000 g inclusive (the <TARE> button applied) The minimum sample refers to all net weighments that are weighed in a packaging that mass ranges from 50.0001 g to 200.0000 g inclusive (the <TARE> button applied) - 176 - Example no. 2 a balance AS 220.3Y: No. Tare value 1 220.0000 g No. Tare value 1 0.0000 g Minimum sample Means of operation Minimum sample Means of operation 0.5000 g The minimum sample refers to all net weighments that are weighed in a packaging with optional mass from full measuring range of a balance (the <TARE> button applied), as well as on weighing samples without the packaging (the <TARE> button is not applied). Example no. 3 a balance AS 220.3Y: 0.2500 g The minimum sample refers to all net weighments that are weighed without a packaging (the <TARE> button is not applied). The software identifies this setting as the minimum sample is valid only for weighing samples without a packaging. If tarring option is applied then the software disables the pictogram informing on minimum sample in use, and renders the weighment as carried out with tare applied, that does not have a minimum sample criterion determined. The user can preview entered data, but data editing is disabled. 29.15. Mass controls (mode not available in standard version of the balance) Each product control carried out on a balance is sent to a connected printer and saved in the < Mass controls >database. Each control saved in the database features its specific number set at the moment of its completion. Mass control number format: y y / M M / d d / H H / m m, where: yy – year of control end, MM – month of control end, dd – day of control end, HH – hour of control end, mm – minute of control end. Balance user can preview data on each control. - 177 - Procedure: Enter submenu < Databases> in accordance with point 27 of this user manual, • Enter < Mass Controls > database and select a desired control record. • List of parameters defined for a mass control: A report on mass control features the following data: Batch number Number of a batch under control Start date Date of control start End date Date of control end User A user carrying out the control Product A controlled product Average Average [%] Standard deviation Standard deviation [%] Average mass determined from carried out control process Average mass determined from carried out control process expressed in percent Standard deviation from carried out control process Standard deviation from carried out control process expressed in percent Quantity of errors T2Quantity of errors T1Quantity of errors T1+ Quantity of errors T2+ Batch quantity Quantity of a controlled batch determined in a report Each report can be printed on selecting its entry and displaying its details. The upper bar contains a pictogram < Print> which pressing causes printing the report on a printer connected to balance’s terminal. Additionally, the complete database can be exported to an external file by pressing a button < Export to file> located in the upper bar. - 178 - 29.16. Ambient conditions Database of ambient conditions contains parameters related to measurement of ambient conditions at a workstation. Depending on balance’s configuration, a report may contain data on temperature, humidity and value of atmospheric pressure. In case a THB ambient conditions module is connected to a balance, records from the module are also saved. Procedure Enter submenu < Databases>, and press < Ambient conditions > field • Press field of a desired report record, unless it is visible on the top of the list, wind the list forward using navigating keys • Report’s name consists of date and time • Caution: It is possible to use an option for searching a report. 29.17. Packages Database of packages contains list of packages for which a name, code and mass value are specified. During weighing process, if a name of packaging is selected from the database, the tare value is automatically applied. The display indicates mass value with minus sign. Procedure • Enter submenu < Databases>, and press < Packages> field • • Press < Add > key should a new packaging be added If a packaging record already exists in the database, press field with its name, and insert data on the packaging. Caution: It is possible to use an option for searching a record by name or code. 29.18. Warehouses Depending on work organizing, the Database of Warehouses contains list of places used for picking up a sample for weighing or list of places to which a weighed sample was delivered. Each Warehouse should have its name, code and description specified. While weighing process, and on selecting name of a Warehouse, it is automatically assigned to the measurement result. Procedure • Enter submenu < Databases>, and press < • • Press < Add > key should a new warehouse be added If a warehouse record already exists in the database, press field with its name, and insert identifying data. - 179 - Warehouses> field Caution: It is possible to use an option for searching a record by name or code. 29.19. Printouts Database of Printouts contains all saved NON-STANDARD printouts. Each nonstandard printout features a name, code and a so called template. Procedure • Enter submenu < Databases>, and press < Printouts> field • • Press < Add > key should a new printout be added If a non-standard printout template already exists in the database, press field with its name, and insert identifying data. Caution: It is possible to use an option for searching a record (printout) by name or code. Designing new printout template. Procedure • Enter submenu < Databases>, and press < Printouts> field • Press < • • • In the <Record editing> field press <Template> key A window is opened for creating an optional printout While designing a printout use on-screen keyboard displayed on the touch panel. It features the same options as a regular computer keyboard. Add > key to create a new printout or edit an existing template 1 – enlarging the editing field (7), recommended while using an external computer keyboard connected to balance’s USB port - 180 - 2 3 4 5 6 7 • – – – – – – cancelling key accepting key download a printout template from a file list of variables for use while designing a printout delete all printout content printout editing field Save designed printout Caution: To erase characters in a printout press Back key. To move cursor press navigating arrows. Example of Printout no. 1 – use of large editing field Balance no. 400015 Balance parameters: Max = 220 g d= 0.001 g Product name: Date: 2011.10.24 Time: 11:48:06 -----------------------Working mode: Weighing -----------------------Net weight: 94.147 Carried by: Admin Template Printout template Example of Printout no. 2 – printout template from a file All printout templates can be designed in a form of external files, that are imported to a balance. A file with printout template has to have an extension: *.txt or *.lb and contain all constant and variable data. On importing, the content of a printout template can be modified. Procedure: − Design a *.txt or *.lb file in an optional editor − Copy the file to a data storage device − Connect the data storage device to balance’s USB port − press [4] < download a printout template from a file > key − balance’s display shows data stored on the data storage device connected to the USB port − search for a file with printout template and press its name − the printout template is automatically copied to an editing field - 181 - 29.20. Universal variables Universal Variables are a set of alphanumerical data which are combined with printouts, products or other information related to weighing. Each variable should have its name, code and value specified. Procedure • Enter submenu < field Databases>, and press < Universal variables > • • Press < Add > key should a new universal variable be added If a universal variable already exists in the database, press field with its name, and insert required modifications to the following fields: code, name, value. Caution: It is possible to use an option for searching a record by name or code. 29.21. Operating database Function allows to operate database data. It comprises three options: Export to file, Delete database and Delete weigments and reports. 29.21.1. Export database of weighing records to file All carried out measurements are saved and stored in a database. The balance enables exporting such data to a file using a data storage device connected to balance’s USB port. Procedure: • Plug a data storage device to balance’s USB port, • Press < Export database of weighing records to file>, the software opens a window where export options have to be set. - 182 - <Data selection> allow the user to specify which data related to measurement are to be exported. Set option and click <Export weighings>, software will automatically export weighing database, • Upon completion a respective message, information on number of exported data and the file name (with file extension *.txt) will be displayed, next the software returns to the previous window. • • The user may return to a weighing procedure or proceed to other settings. Caution: If a balance software cannot identify the data storage device than upon entering option <Export weighings database> a message <Operation failed> is displayed. - 183 - A created file name consists of database name and balance serial number, e.g. <Weighing date_2602776.txt>. • Unplug the data storage device from the USB port. • Created file template: The file is created in a form of chart, columns of which are separated with <Tab>. This allows a direct export of the file to spread sheet document <Excel>. The chart contains all data concerning a given measurement: date and time, mass and mass unit, tare and tare unit, series number, operator’s name, client’s name, packaging’s name, source warehouse name, target warehouse name, control result. 29.21.2. Delete database Function allows to delete data of a chosen database. Upon activation a window is displayed with databases. Select a database data of which is to be deleted. Upon confirmation the software deletes data and displays a summary message: Upon confirmation the software returns to a previous window. The user may continue a weighing procedure or proceed to other operations. - 184 - 29.21.3. Delete weighments and reports Function allows to delete a given database weighments and reports. Upon activation of this function the software displays a window with a numeric keyboard. Use the keyboard to enter a date specifying which data is to be removed (data older than those specified by a date). Date is given in a following form: year-month-day. Upon confirmation of entered date all weighments and reports older than those specified by the date will be removed. Number of removed weighments and reports will be displayed on a respective message. - 185 - 30. COMMUNICATION Menu Communication is located in a menu group Parameters. It is accessed by pressing Setup key or < Setup > quick access key. The balance enables communicating with peripheral devices through the following ports: • COM 1 (RS232), • COM 2 (RS232), • Ethernet, • Tcp. The ports are configured in group of parameters < Enter submenu < Communication> by pressing Communication” filed. Communication>. key, and press “ 30.1. RS 232 port settings Procedure: − Select communication port < − Set appropriate values COM1> or < COM2>, The RS 232 ports enable the following setting of transmission parameters: • Baud rate - 4800, 9600, 19200, 38400, 57600, 115200 bit/s • Data bits - 5, 6, 7, 8 • Stop bits - None, 1, 1.5, 2 • Parity - None, Odd, Even, Marker, Interval 30.2. ETHERNET port settings Procedure: − Select communication port < • • • • DHCP IP Address Subnet mask Default gate - Ethernet> and set appropriate values: Yes – No 192.168.0.2 255.255.255.0 192.168.0.1 Caution: Above settings are for information purpose only. Transmission parameters should be selected in accordance with the settings of client’s local network. To carry out changes in the settings, press key which displays a message: <to make changes effective, restart the balance>, Return to weighing mode and restart the device. 30.3. TCP protocol settings TCP, i.e.Transmission Control Protocol enables communicating two computers. The TCP operates in client-server mode. The server pends for establishing a - 186 - connection on a specified port, and the client establishes connection with a server. Procedure of setting a port for “TCP” protocol: − Enter group of parameters < Communication>, − Select: „ Tcp / Port” which opens a window <Port> with on-screen keyboard, − Insert required port number and accept by pressing key. 31. PERIPHERAL DEVICES Menu PERIPHERAL DEVICES is located in menu group Parameters. It is accessed by pressing Setup key or < Setup > quick access key. Inside the menu, there is a list of connectable peripheral devices, which can cooperate with a balance. 31.1. Computer Active connection between a balance and a computer is signalled by visible pictogram displayed in the upper bar of the main window. Submenu < Computer> enables configuring connection settings. Procedure: − press key and “ Peripheral devices / Computer” key − set balance’s parameters related to cooperation with a computer − computer port o available options: none, COM 1, COM 2, Tcp − address o give address of a balance which is connected to a computer − continuous transmission o available options: NO, YES (printout format depends on set printout template in a balance – see next parameter). − weighing printout template o it is possible to design an individual printout to a computer using a dedicated window with printout template. Principles on creating printouts are described in point 24.11 of this user manual. − E2R System o E2R System is a modular system performing complex operations of supervision and control over all weighing processes carried out on a balance. On enabling the option, the processes carried out on some of the databases are carried out only from the computer level (mode not available in balance’s standard version). Caution: Enabling parameter < E2R System> can only be carried out by balance manufacturer or authorized personnel. - 187 - 31.2. Printer Balance submenu <Printer> enables: − Setting communication port with a printer, − Defining printer’s code page, (default 1250) − Defining controlling codes for PCL printer or EPSON label printer CAUTION: codes must be entered in a hexadecimal form − Defining printout standards In order to ensure right cooperation of a balance with a printer (correct printout of letters with diacritical signs specified for a given language), suitable speed of transmission must be chosen for the balance, i.e. it must be respective to transmission speed of a printer (see the printer settings). Additionally a given printout code page must be accordant with the printer code page. Code page accordance may be obtained as follows: • by setting the right code page in the printer (see the printer manual) – respective to printout code page set in a balance; or • by sending control code from a balance to the printer, which automatically sets the right code page (respective to code page set in a balance) in advance before execution of the data printout – it is possible only for printers supplied with such option. Example balance settings for a correct cooperation (Polish diacritical signs printout) with EPSON printer connected to port RS232: 1. Dot matrix printer EPSON TM-U220B Communication parameters of port to which the printer is connected • baud rate – 9600 bit/s • data bits –8 • stop bits –1 • parity – none Printer’s parameters • port – COM1 or COM2 (the one to which the printer is connected) • code page – 852 2. Thermal printer EPSON TM-T20 Communication parameters of port to which the printer is connected • baud rate – 38400 bit/s • data bits –8 • stop bits –1 • parity – none Printer’s parameters • port – COM1 or COM2 (the one to which the printer is connected) • code page – 1250 • control codes – 1B742D or Printer’s parameters • port – COM1 or COM2 (the one to which the printer is connected) • code page – 852 • control codes – 1B7412 - 188 - If on the printout in the place of the last digit there are any unexpected signs (for verified balances), than <CONTROL CODES> parameter should incorporate, apart from code page, code of the UK signs chart: 1B5203. In such a case the < CONTROL CODES> parameter setting should be as follows: control codes - 1B74121B5203 A printout standard is a description of how to print information from databases. If it is insufficient, the printout standard can be modified. In order to check format of printout standard, print data related to e.g. parameters related to a product – function activated on moving to the Database of Products / Products / Product editing – press printer pictogram. Default values for each of printout standards: Product printout template {50} {51} User printout template {75} {76} Client printout template {85} {86} Warehouse printout template {130} {131} Packaging printout template {80} {81} {82} Ambient conditions printout template ----------- AMBIENT CONDITIONS -------------Date and time {275} Temperature of sensor 1: {value} oC Temperature of sensor 2: {value} oC Temperature THBS: {value} oC Humidity THBS: {value} % ---------------------------------Formulation printout template ----------- Formulation -------------Formulation name: {165} Number of ingredients: Target mass: Formulation ingredients: {169} ---------------------------------- 189 - {167} {168} g 31.3. Barcode scanner The balance enables cooperating with barcode scanners, which are used to quick searching for a product in the database of products. Connection to a barcode scanner is configured in submenu < Barcode Scanner>. Available options: • Setting communication port with a barcode scanner, • Offset setting, • Setting barcode length. Caution: Submenu < Communication> requires setting baud rate to compatible with the one used barcode scanner (default 9600b/s). Detailed description of communicating the balance with a barcode scanner is provided in APPENDIX F of this user manual. The balance enables communicating with a barcode scanner using the following ports: • RS 232 (COM1), • RS 232 (COM2), Offset Setting the first data carrying character of a barcode, which is the first recognized character while searching for a product. Code length Setting number of characters recognized during searching for a product. 31.4. Transponder card reader Selecting (logging) a user on each switching on the balance can be carried out by means of: • • Inserting user’s password using on-screen keyboard, With a transponder card scanner, by approximating a registered card to the scanner. - 190 - Caution: For correct balance’s cooperation with a transponder card reader set appropriate baud rate value in submenu < Communication> (default 9600b/s). Transponder card scanner port. The balance enables communicating with a transponder card scanner using the following ports: • RS 232 (COM1), • RS 232 (COM2). Assigning number of a card to a user: In order to log in an operator using a transponder card scanner, first assign a number of an already registered card to a selected user in the database of operators. Procedure: • Connect a transponder card scanner to a balance’s port (RS 232 COM1 or RS 232 COM2), select communication port in balance settings for the transponder card scanner • In submenu < Communication> set baud rate for compatible with the one of the transponder card scanner (default 9600b/s). • Enter the database of operators and edit desired operator’s record, go to < Card number> option, On entering editing mode in < Card number> option, an editing window <Card number> is opened with an on-screen keyboard, • Approximate the card to the transponder card scanner. The balance automatically displays number of detected card in the <Card number> field, • Accept recognized number by pressing key and returning to the main window of weighing mode. • 31.5. Additional display The balance enables communicating with an additional display using the following ports: • • • RS 232 (COM1), RS 232 (COM2), Tcp. Type of data displayed on an additional display is declared in variable <Project (template)>. Procedure – designing a variable − Enter group of parameters < Peripheral devices> − Press “ Additional display / Project” field, which opens an editing window <Project> with an on-screen keyboard, - 191 - − Use the on-screen keyboard to insert desired value of a standard, or − Select desired value of a standard using a list displayed on pressing < > key − Accept by pressing key. Caution: Balance 3Y series cooperates with an additional display WD5/3Y manufactured by RADWAG. Ensuring correct cooperation between the balance and the additional display, requires that the parameter < Standard> has a variable number set to value {140}, and the baud rate value set to 38400 bits/s for a port having the additional display plugged. 31.6. Ambient conditions module A balance 3Y series enables connecting an ambient conditions module THB series using ports COM 1 or COM 2. Ensuring correct cooperation between the balance and the ambient conditions module requires entering module connection address and the baud rate of port to which the THB module is plugged. (address and baud rate settings are specified on module data plate). 31.7. Tablet feeder (automatic feeder) (mode not available in balance’s standard version) Balance 3Y series enables communicating it with an automatic feeder PA-02/H series using ports: • • • RS 232 (COM1), RS 232 (COM2), Com internal. Ensuring a correct cooperation with the feeder requires setting an appropriate address of the device (the address is specified on the data plate of the automatic feeder, including baud rate parameters). - 192 - 32. INPUTS / OUTPUTS Application of inputs: The set of inputs is used to control balance’s operation. Each of 4 inputs is connectable to the following functions or keys: o Checkweighing thresholds o Right door o Target value o Parameters o Profile o Statistics o Adjustment/Calibration o Add to statistics o Zero o Product o Tare o Warehouse o Set tare o Client o Disable tare o Packaging o Parts counting: give part mass o Parts counting: set mass of a single part o Percent setup: give reference mass o Print o Percent setup: set 100% o Header printout o Density of solid o Footer printout o Density of liquid o Universal variable 1 ÷ 5 o Air density o Accept o Control mass comparator’s robot o Abort o Task o User o Reference standard o Restore tare o Left door On changing the logic status of the input system, e.g. from [0] to [1] a function that is assigned to the system is carried out. For instance: o Carrying out automatic adjustment process to check balance’s accuracy, o Displaying the value of set checkweighing thresholds, or o Restoring tare value to weigh net mass of measured load. Procedure - Press key and press: “ Inputs / Outputs” key. - Enter submenu < Inputs / Outputs>, select and press < Inputs> key - Enter editing mode of a selected input, which opens list of available functions, - Select a function from displayed list and return to weighing. - 193 - Application of outputs: The set of outputs is used to SIGNAL the status of measurement result. Change of logic status of the output system, e.g. from [0] to [1] takes place on meeting a requirement assigned to the output. Each of 4 outputs is connectable to the following data: Available options None Balance status, which switches the logic of output ------- Stable Each stable measurement switches the logic of the system MIN stable Stable measurement below [MIN] threshold switches the logic of the system, MIN unstable Unstable measurement below [MIN] threshold switches the logic of the system, OK stable Stable measurement within [MIN] [MAX] thresholds switches the logic of the system, OK unstable Unstable measurement within [MIN] [MAX] thresholds switches the logic of the system, MAX stable Stable measurement below [MAX] threshold switches the logic of the system, MAX unstable Unstable measurement below [MAX] threshold switches the logic of the system Confirmation of cycle completion End of procedure Procedure - Press key and press: “ Inputs / Outputs” key. - Enter submenu < Inputs / Outputs>, select and press < Outputs> key - Enter editing mode of a selected output, which opens list of available functions, - Select a function from displayed list and return to weighing with saving carried out changes. - 194 - 33. OTHER PARAMETERS This menu contains global parameters on balance operation, such as: language, date-time, beep sound, display calibration, level control. Enter submenu<Others>, by pressing key and < Other> key. 33.1. Interface language Procedure Enter submenu < Others>, press < Language> option and select language version of balance’s communication interface. Available language version: − Polish, − English, − German, − French, − Spanish, − Korean, − Turkish, − − − − − − Chinese Italian Czech Romanian, Hungarian Russian. 33.2. Date and time setting Balance user can set date and time, which are located in the upper bar of the display. Entering editing mode of date and time settings is carried out in two ways: • By pressing “date and time” field located in the upper bar of balance’s display (in main menu mode), • By pressing key, and selecting menu: “ Other / Date and Time”. Entering date and time setting mode opens an on-screen keyboard. Set date and time in the following sequence: year, month, day, hour, minute and accept set values by pressing key. Caution: Access to < Date and Time> option in balance’s menu is conditioned by setting of access level for this parameter. 33.3. “Beep” sound Procedure: Enter submenu < Others>, press < Beep> and set one of available options. No - Beep sound switched off (disabled) for keys and proximity sensors Keys - Beep sound active as reaction to pressing keys Sensors - Beep sound active as reaction to operation of proximity sensors All - Beep sound reacting to both keys and proximity sensors. - 195 - 33.4. Sleep mode The user has the sleep mode at his disposal, thus he can turn off the display. In order to enter the sleep mode: • press key, next press: „ Others / Sleep mode”. On entering the option one of the following settings must be selected: [None; 1; 2; 3; 5; 10; 15]. Digit values stand for a number of minutes. Upon selection of a desired value the program returns to the previous menu level. Caution: The screen turns to sleep mode only when the balance is not operated (the indication on the screen remains the same). Upon turning to the sleep mode the balance returns to weighing mode automatically if only any weight modification is detected or screen touch or key on an overlay pressed. 33.5. Display brightness Display brightness influences balance operation time, when the balance is powered by means of a battery. If the user wants to lengthen the operation cycles as much as possible he should reduce the brightness of the display. In order to enter the display brightness: • press key, next press: „ Others / Display brightness”. On entering the option enter a desired value [0% - 100%]. Upon entering a particular value the brightness changes respectively and the program returns to the previous menu level. 33.6. Touch panel calibration Display calibration is required if during operation a user spots incorrect reaction of the touch panel. Procedure: • Enter submenu< Others> Select parameter < Touch panel calibration> which opens an editing window, • Use finger or a thin (but not sharp edged) and soft stylus to press and hold a display area occupied by a cross. After pressing the fifth cross in sequence, accept the changes by pressing key. • Caution: The process can be aborted by pressing Esc key on an external keyboard connected to the balance’s terminal. - 196 - 33.7. Level control Balance 3Y series features an Automatic Level Control system. In case of nonverified instruments, the operation of Automatic Level Control system is user defined. In case of verified instruments, the settings are hidden and they operate in accordance with factory settings, i.e. <Active and locked>, weighing process is possible only if balance is properly leveled. Procedure: • Enter submenu < Others>, • • Select parameter < Level control> which opens an editing window, Select one of available options: None – level indicator is not displayed, the balance does not control level status, Active – level indicator is displayed, the balance alerts level change by changing colour of level indicator (green → level status OK., red → level status lost) Active with lock – level indicator is displayed , the balance alerts level change by changing colour of level indicator (green → level status OK., red → level status lost). If level indicator is red, the display also shows an alert – no Level - , and blocks weighing function until level status is restored. Caution: Means of levelling a balance is described in point 10.3 of this user manual. - 197 - 33.8. Sensor sensitivity The parameter is adjustable between 0 – 9, and it determines the distance from which the IR proximity sensors should react. As standard, the sensitivity is set within the range of 5 to 7. Procedure: • • • Enter submenu< Others> Select parameter<Sensor sensitivity>which opens an editing window, Select one of available options. The selection causes immediate returning to the menu window. 33.9. Autotest AUTOTEST function is designed to aid a user in both assessing balance’s operation and diagnosing the reasons for occurrence of errors in weighing which exceed the maximum permissible values for a given balance model. By means of a simple, repeatable and fully documented way the function enables optimizing balance’s settings to maintain the best possible repeatability and weighing time at a workstation. The main purpose of function operation is the possibility of monitoring the above mentioned parameters at optional moment and saving records from carried out tests. The functions is divided into two modules: AUTOTEST FILTER AUTOTEST GLP Before carrying out any of the tests , the balance controls its level status, temperature and humidity. AUTOTEST FILTER It is process of 10 times loading and unloading of the internal weight for all possible settings of balance’s filter and value release values. The test controls 2 parameters: • Repeatability; • Stabilization time of measurement result. The whole testing process takes approximately 1 hour. On completing the test for all possible settings, balance displays a message box with obtained results. The user is given information on optimum balance settings in present - 198 - ambient conditions at a workstation. The function provides a user with data on the best possible balance settings for obtaining the highest measurement repeatability and the shortest measurement time with acceptable value of repeatability. Test results are not stored in balance’s memory. Exiting function causes erasing the test results. Additionally the function enables: • Printing test results on printers available in the system and selecting the most optimum parameters from the balance’s option level. Measurement results: *Filter type *Setting of “Value release” parameter *Repeatability of indications expressed as standard deviation *Average time of measurement stabilization An example of report: -------- Autotest Filter: Report -------Balance type PS 3Y Balance ID 400010 User Admin Software rev. L0.0.21 S Date 2012.01.16 Time 10:17:27 ---------------------------------------Reading unit 0.001/0.01 g Internal weight mass 1402.094 g ---------------------------------------Filter Very fast Value release Fast Repeatability 0.0042 g Stabilization time 4.505 s Filter Value release Repeatability Stabilization time Filter Value release Repeatability Stabilization time Filter Value release Repeatability Stabilization time . . Very fast Fast & Reliable 0.0097 g 4.524 s Very fast Reliable 0.0092 g 4.895 s Fast Fast 0.0099 g 4.979 s - 199 - . Filter Value release Repeatability Stabilization time Very slow Reliable 0.0207 g 5.015 s Signature ........................................ PROCEDURE: On function activation, the software initiates the process automatically. The display indicates progress of the process course. On completing the process, the software displays a summary and marked values of currently set filter values. The report can be printed. Caution: Exiting the reporting window causes erasing the test results. User can abort the process at optional moment by pressing <X> key in the testing window. AUTOTEST GLP The test controls repeatability of placing the internal weight and determining error of indication with reference to balance’s Max capacity. Testing Procedure: • Two times loading of the internal weight, followed by 10 times loading of the internal weight • Balance internal adjustment • Calculating and storing the value of standard deviation • In balances with automatically opened doors, door opening and closing test is carried out. Additionally the function enables: • Displaying and printing a report on available printers and saving the report in balance’s memory. The report contains basic data on balance’s parameters, ambient conditions and test results. Test results: *Deviation for Max. *Value of repeatability of indication expressed as standard deviation *Result of door test (positive / negative) – if a balance features automatic door opening system. - 200 - Example of a report: ..................................................... --------- Autotest GLP: Report -----Balance type PS 3Y Balance ID 400010 User Admin Software rev. L0.0.21 S Date 2012.01.16 Time 09:17:16 ---------------------------------------Number of measurements 10 Reading unit 0.001/0.01 g Internal weight mass 1402.094 g Filter Average Value release Fast & Reliable ---------------------------------------Deviation for Max. -0.118 g Repeatability 0.0088 g Signature ........................................ PROCEDURE: On pressing a field with test name, the balance displays a message box. On this level, the user can carry out the following: Start the following AUTOTESTU GLP process Preview results of completed autotests, and export all saved test results as file with extension *.csv Delete all saved test results User can abort the process at optional moment by pressing <X> key in the testing window. Results of carried out autotests are displayed as a table (each line features date and time of autotest procedure and its result). To preview detailed data of an autotest, press a specified line of the table with test results. In order to print a result of a single autotest, enter its details (see above) and generate a printout by pressing <print> key in the upper bar of the balance’s display. Autotest results can be exported by pressing <export> field on the level of all saved reports in a table. Data is sent to a data storage device connected to balance’s USB port as a file with extension *.csv. - 201 - 33.10. Start logo Caution: Option enabled only for authorized balance operators. The parameter enables changing a logo that appears on the balance display on a start-up procedure. 33.11. Export of system events Caution: Option enabled only for authorized balance operators. The parameter enables generating a special type of a file that is automatically saved on option enabling on a data storage device plugged to balance’s USB port. The file is used by RADWAG service for diagnosing any potential problems occurring during balance operation. Procedure: • Plug a data storage device to balance’s USB port • • • • Enter submenu < Other> Select parameter <Export system events> The software generates a file and automatically saves it on the data storage device The generated file has to be sent to Radwag service personnel. - 202 - 34. UPDATE The function contains two modules which enable updating: o Area of a user: SOFTWARE o Metrological parameters: WEIGHING MODULE. Updating process takes place automatically by loading data from a data storage device connected to balance’s USB port. Procedure o Prepare a data storage device with update file. Required file extension: *.lab o Connect the data storage device to balance’s USB port o Select menu <Software> o The display previews content saved on the data storage device, search for the update file and press its name. o Updating process takes place automatically. The process of updating the weighing module takes places analogously to above procedure, but the required extension of the update file is: *.me01. Caution: Weighing module updating procedure is accessible to authorized service points only. If the update file is incorrect, the balance displays a message on process error – balance parameters remain unchanged. 35. SYSTEM INFORMATION This menu contains data on balance specification and installed applications. Most of parameters in this menu are for the information purpose only. Parameter <Ambient conditions>, enables previewing present ambient conditions in a balance: temperature, humidity, pressure (if a balance features corresponding ambient conditions sensors). On selecting parameter <Print settings> the balance sends all settings to a printer. - 203 - 36. COMMUNICATION PROTOCOL General information A. A character based communication protocol balance-terminal is designed for establishing communication between a RADWAG balance and a peripheral devices via RS 232 interface. B. It consists of commands sent from a peripheral device to the balance and responses from the balance.. C. Responses are sent from the balance on each receipt of a command as a reaction for a specific command. D. Commands forming the communication protocol enable obtaining data on balance's status and influencing its operation, e.g.: request measurement results from the balance, zero indication, etc. 36.1. A set of commands Command Command description Z Zero balance T Tare balance OT Give tare value UT Set tare S Send stable measurement result in basic measuring unit SI SU Immediately send measurement result in basic measuring unit Immediately send measurement results from both measuring platforms basic weighing units Send stable measurement result in current measuring unit SUI Immediately send measurement result in current measuring unit C1 Switch on continuous transmission in basic measuring unit C0 Switch off continuous transmission in basic measuring unit CU1 Switch on continuous transmission in current measuring unit CU0 Switch off continuous transmission in current measuring unit DH Set low checkweighing threshold LO UH Set high checkweighing threshold HI ODH Give value of low checkweighing threshold LO OUH Give value of high checkweighing threshold HI SM Set mass value of a single item TV Set target mass value RM Set reference mass value NB Give balance factory number PROFILE Select balance profile LOGIN User log in LOGOUT User log out SIA - 204 - PC Send all implemented commands Caution: 1. Each command must end with CR LF characters; 36.2. Responses format for commands sent from computer level On receipt of a command, the terminal sends a response in one of the following formats: XX_A CR LF XX_D CR LF XX_I CR LF command understood and in progress command carried out (appears only after command XX_A) command understood but not accessible at this moment the XX _ ^ CR LF command understood but max range is exceeded XX _ v CR LF command understood but min range is exceeded XX _ OK CR LF Command carried out (completed) ES_CR LF Command not recognized XX _ E CR LF an error occurred on command carrying out (time limit exceeded while waiting for stable measurement result (time limit is balance’s characteristic parameter) XX - stands for a name of sent command _ - substitutes spaces COMMANDS DESCRIPTION Zero the balance Format: Z CR LF Accessible responses: Z_A CR LF - command understood and in progress Z_D CR LF - command carried out Z_A CR LF - command understood and in progress Z_^ CR LF - command understood but zeroing range exceeded Z_A CR LF - command understood and in progress Z_E CR LF - time limit exceeded while waiting for stable measurement result Z_I CR LF - command understood but not accessible at this moment Tare the balance Format: T CR LF - 205 - Accessible responses: T_A CR LF - command understood and in progress T_D CR LF - command carried out T_A CR LF - command understood and in progress T_v CR LF - command understood but tarring range exceeded T_A CR LF - command understood and in progress T_E CR LF - time limit exceeded while waiting for stable measurement result T_I CR LF - command understood but not accessible at this moment Give tare value Format: OT CR LF Accessible responses: OT_TARA CR LF – command carried out Response format: 1 2 3 O T space 4-12 13 tare space 14 15 16 unit 17 18 19 space CR LF Tare - 9 characters with right justification Unit - 3 characters with left justification Caution: Tare value is always given in adjustment unit. Set tare Format: UT_TARE CR LF, where TARE – tare value Accessible responses: UT_OK CR LF - command carried out UT_I CR LF - command understood but not accessible at this moment ES CR LF - command not recognized (tare format incorrect) Caution: Use dot in tare format as decimal point. Send stable measurement result in basic measuring unit Format: S CR LF Accessible responses: S_A CR LF - command understood and in progress S_E CR LF - time limit exceeded while waiting for stable measurement result S_I CR LF - command understood but not accessible at this moment S_A CR LF - command understood and in progress MASS FRAME - response is mass value in basic measuring unit Frame format: 1 2-3 4 5 6 7-15 - 206 - 16 17 18 19 20 21 S space stability space character mass space marker unit CR LF Example: S CR LF – command sent from a computer S _ A CR LF - command understood and in progress S _ _ _ _ - _ _ _ _ _ _ 8 . 5 _ g _ _ CR LF - command carried out, response is mass value in basic measuring unit. Immediately send measurement result in basic measuring unit Format: SI CR LF Accessible responses: SI_I CR LF - command understood but not accessible at this moment MASS FRAME - response is immediate with mass value in basic weighing unit Frame format: 1 2 S I 3 4 5 6 7-15 16 17 18 19 20 21 stability space space character mass space unit CR LF marker Example: S I CR LF – command sent from a computer S I _ ? _ _ _ _ _ _ _ 1 8 . 5 _ k g _ CR LF - command carried out, immediate response of mass value in basic weighing unit Immediately send measurement results from all weighing platforms basic measuring units Format: SIA CR LF Accessible responses: SIA_I CR LF - command understood but not accessible at this moment MASS FRAME „P1” CR LF - immediate response of mass value in basic MASS FRAME „P2” CR LF measuring unit from all weighing platforms Frame format with mass from each weighing platform: 1 2 3 4 5 6 7-15 16 17 18 19 20 21 stability P n space space character mass space unit CR LF marker Where: n - weighing platform number mass - 9 characters with right justification unit - 3 characters with left justification - 207 - Example: In case there are two weighing platforms. S I A CR LF – command sent from a computer P 1 _ ? _ _ _ _ _ _ 1 1 8 . 5 _ g _ _ CR LF P 2 _ _ _ _ _ _ _ _ _ 3 6 . 2 _ k g _ CR LF - command carried out, immediate response is mass value from both weighing platforms in basic measuring unit specific for each of the weighing platforms. Send stable measurement result in current weighing unit Format: SU CR LF Accessible responses: SU_A CR LF - command understood and in progress SU_E CR LF - time limit exceeded while waiting for stable measurement result SU_I CR LF - command understood but not accessible at this moment - command understood and in progress SU_A CR LF - response is mass value in current measuring unit MASS FRAME Frame format: 1 2 3 4 5 6 7-15 16 17 18 19 20 21 stability S U space space character mass space unit CR LF marker Example: S U CR LF – command from a computer S U _ A CR LF – command understood and in progress S U _ _ _ - _ _ 1 7 2 . 1 3 5 _ N _ _ CR LF - command carried out, response is mass value in current measuring unit. Immediately send measurement result in current measuring unit Format: SUI CR LF Accessible responses: SUI_I CR LF - command understood but not accessible at this moment MASS FORMAT - mass value in current measuring unit is returned immediately Frame format 1 2 3 S U I 4 5 6 7-15 16 17 18 19 20 21 stability space sign mass space unit CR LF Example: S U I CR LF – command from a computer S U I ? _ - _ _ _ 5 8 . 2 3 7 _ k g _ CR LF - command carried out, immediate response of mass value in current measuring unit Where: _ - space - 208 - Switch on continuous transmission in basic measuring unit Format: C1 CR LF Accessible responses: C1_I CR LF - command understood but not accessible at this moment C1_A CR LF - command understood and in progress MASS FRAME - response is mass value in basic measuring unit Frame format 1 2 3 S I 4 5 6 7-15 16 17 18 19 20 21 stability space space character mass space unit CR LF marker Switch off continuous transmission in basic measuring unit Format: C0 CR LF Accessible responses: C0_I CR LF - command understood but not accessible at this moment C0_A CR LF - command understood and in progress Switch on continuous transmission in current measuring unit Format: CU1 CR LF Accessible responses: CU1_I CR LF - command understood but not accessible at this moment CU1_A CR LF - command understood and in progress MASS FRAME - response is mass value in current measuring unit Frame format: 1 2 3 4 5 6 7-15 16 17 18 19 20 21 stability S U I space character mass space unit CR LF marker Switch off continuous transmission in current weighing unit Format: CU0 CR LF Accessible responses: CU0_I CR LF - command understood but not accessible at this moment CU0_A CR LF - command understood and in progress Set low checkweighing threshold LO Format: DH_XXXXX CR LF, where XXXXX – mass format Accessible responses: DH_OK CR LF - command carried out ES CR LF - command not recognized (incorrect mass format) - 209 - Set high checkweighing threshold HI Format: UH_XXXXX CR LF, where XXXXX – mass format Accessible responses: UH_OK CR LF - command carried out ES CR LF - command not recognized (incorrect mass format) Give value of low checkweighing threshold LO Format: ODH CR LF Accessible response: DH_MASS CR LF – command carried out Frame format: 1 2 3 4-12 13 D H space mass space Mass Unit 14 15 16 unit 17 18 19 space CR LF 17 18 19 space CR LF - 9 characters with right justification - 3 characters with right justification Give value of high checkweighing threshold HI Format: OUH CR LF Accessible response: UH_MASA CR LF – command carried out Frame format : 1 2 3 4-12 13 U H space mass space Mass Unit 14 15 unit 16 - 9 characters with right justification - 3 characters with right justification Set mass value of a single element(only for PARTS COUNTING) Format: SM_XXXXX CR LF, where: _ - space, XXXXX – mass format Accessible responses: SM_OK CR LF - command carried out SM_I CR LF - command understood but not accessible at this moment (e.g.: other working mode, not PARTS COUNTING) ES CR LF - command not recognized (incorrect mass format) Set target mass value (e.g. for DOSING) Format: TV_XXXXX CR LF, where: _ - space, XXXXX – mass format Accessible responses: TV_OK CR LF - command carried out TV_I CR LF - command understood but not accessible at this - 210 - ES CR LF moment (e.g.: WEIGHING mode) - command not recognized (incorrect mass format) Set reference mass value (e.g. for PERCENT SETUP) Format: RM_XXXXX CR LF, where: _ - space, XXXXX – mass format Accessible responses: RM_OK CR LF - command carried out RM_I CR LF - command understood but not accessible at this moment (e.g.: other working mode, not PERCENT SETUP) ES CR LF - command not recognized (incorrect mass format) User log in Format: LOGIN Name, Password CR LF (Name and password have to be inserted as they are set in the balance – small and capital letters) Accessible responses: LOGIN OK CR LF - command understood, new user is logged in LOGIN ERRROR CR LF - command understood, an error in name or password occurred, log in failed ES CR LF - command not recognized (error in format) User log out Format: LOGOUT CR LF Accessible responses: LOGOUT OK CR LF - command understood, user is logged out ES CR LF - command not recognized (error in format) Set balance mode Format: PROFILE_Name CR LF where: _ - space (Name must be accordant with the name form entered in a balance – lowercase and uppercase letters) Accessible responses: PROFILE OK CR LF - command understood, new PROFILE activated LOGIN ERRROR CR LF - command understood, an error in PROFILE name, log in failed ES CR LF - command not recognized (error in format) The result release Format: SS CR LF Accessible responses: SS_OK CR LF - command understood, realization in progress The command simulates pressing PRINT button on an overlay, according to settings selected for result release. - 211 - Internal adjustment/calibration Format: IC CR LF Accessible responses: IC_A CR LF - command understood, realization in progress IC_D CR LF - calibration completed IC_A CR LF - command understood, realization in progress IC_E CR LF - time limit of result stabilization exceeded IC_I CR LF - command understood but not accessible at this moment Send all implemented commands Format: PC CR LF Accessible response: PC_A_”Z,T,S,SI,SIA,SU,SUI,C1,C0,CU1,CU0,DH,ODH,UH,OUH,OT,UT, LOGIN,LOGOUT,PC" – command carried out, terminal has sent all implemented commands. 36.3. Manual printout / Automatic printout Balance 3Y series enables generating manual or automatic printouts. • Manual printout: press (measurement result), key on stabilization of indication • Automatic printout is generated automatically, in accordance to the settings of automatic printout (see point 10.8 of this user manual). The content of a printout depends on setting in menu <Standard printout> <Weighing printout template>(see point 15.5 of this user manual). Format of mass printout: 1 2 3 stability space character marker Stability marker 4 -12 13 mass space 14 15 unit 16 17 18 CR LF Mass [space] if stable [?] if unstable [!] air buoyancy compensation mode is enabled [^] if error of exceeding range to + occurs [v] if error of exceeding range to – occurs [space] for positive values [-] for negative values 9 characters with decimal point and right justification Unit 3 characters with left justification Character Example: - 212 - _ _ _ _ _ _ 1 8 3 2 . 0 _ g _ _ CR LF – a printout generated from a balance on pressing key, according to settings of <Weighing printout template>: N (number of measurements) Date NO Universal variable 1 … 5 NO Net Time NO NO Tare NO NO Level status NO Gross NO Client NO Current result NO Warehouse NO Supplementary unit NO Product NO Mass YES Packaging NO Non-standard printout NO - 213 - 37. CONNECTING PERIPHERAL DEVICES Balances 3Y series can cooperate with the following peripheral devices: • Computer, • Receipt printer: KAFKA, EPSON, • PCL printer PCL, • Additional display, • Barcode scanner, • An optional peripheral device operating in communication protocol ASCII. 38. DIAGRAMS OF CONNECTING CABLES Caution: Cable „Balance – Ethernet” is a regular network cable with slot jest RJ45 on both ends. Cable: balance - computer (RS232) Cable: balance - printer KAFKA Cable: balance – printer CITIZEN, EPSON - 214 - Cable: IN / OUT 39. ERROR MESSAGES Err2 Err3 Err8 -NULL-FULL-LH-no level-Err 100In process HI Value beyond zero range, Value beyond tare range, Tarring / Zeroing operation time exceeded, Zero value from converter, Measurement range (Max. capacity) exceeded, Start mass error, not levelled balance weighing module restart in-course process resulting in unstable measurement (automatic feeder – pills feeding process or comparator – load change process) display range overflow, - 215 - 40. ADDITIONAL EQUIPMENT Type Name P0136 RS232 cable for KAFKA printer P0151 RS232 cable for EPSON printer KAFKA Thermal printer EPSON Dot matrix printer CITIZEN Label printer PCL printer WD- xx Additional display in plastic housing CK-01 Transponder card scanner LS2208 Barcode scanner AP2-1 Power loop output SAL Anti-vibration bench for laboratory balances PC keyboard Computer software: • „LABEL EDITOR”, • „PW-WIN”, • „RAD-KEY”. - 216 - 41. APPENDIX A – Variables for printouts 41.1. List of variables Caution: Each of defined variables must be contained in braces: {x}, where x – stands for variable number. List of variables is accessible in the system for defining the look of standard printout templates and data displayed in the grey coloured workspace: Symbol Variable description 1) Standard printout in adjustment unit 1) Standard printout in current measuring unit {0} {1} {2} Date {3} Time {4} Date and time {5} Working modes {6} Net mass in current measuring unit {7} Net mass is adjustment unit {8} Gross mass {9} Tare {10} Current measuring unit {11} Adjustment unit {12} Low threshold {13} High threshold {15} Statistics: Number {16} Statistics: Sum {17} Statistics: Mean {18} {19} Statistics: Minimum Statistics: Maximum {20} Statistics: SDV {21} Statistics: D {22} Statistics: RDV {26} Result control {27} Value {28} Level status - 217 - {30} Gross value {31} Weighing platform no. {32} Factory no. {33} Balance reading unit {34} Range {35} Parts counting: Mass of a standard {36} Percent setup: Reference mass {38} Universal variable: Name {39} Universal variable: Value {43} Net mass in supplementary unit {44} Supplementary unit {45} Target value {46} Tolerance {47} Difference {48} Balance type {50} Product: Name {51} Product: Code {52} Product: EAN code {53} Product: Mass {54} Product: Tare {55} Product: Price {56} Product: Minimum {57} Product: Maximum {58}2) Product: PGC mode {59} Product: Shelf-life time in days {60} Product: VAT {61} {62} Product: Date Product: Shelf-life time {63} Product: Density {64} Product: Ingredients {65} Product: Description {66} Product: Tolerance {75} User: Name - 218 - {76} User: Code {77} User: Access level {80} Packaging: Name {81} Packaging: Code {82} Packaging: Mass {85} Client: Name {86} Client: Code {87} Client: VAT no. {88} Client: Address {89} Client: Postal code {90} Client: City {91} Client: Discount {100}2) PGC Report: Batch number {101}2) PGC Report: Start date {102}2) PGC Report: End date {103}2) PGC Report: Result {104}2) PGC Report: Batch quantity {105}2) PGC Report: Number of measurements {106}2) PGC Report: Value of T1 error 2) PGC Report: Value of 2T1 error 2) PGC Report: Number of T1 errors 2) {109} PGC Report: Permissible number of T1 errors {110}2) PGC Report: Number of 2T1 errors {111}2) PGC Report: Sum {112}2) PGC Report: Min {113}2) PGC Report: Max {114}2) PGC Report: Average {115}2) PGC Report: Average limit {116}2) PGC Report: Standard deviation {117}2) PGC Report: Measurements {107} {108} 2) PGC Report: Unit 2) PGC Report: Report no. 2) Average Tare Report: Date {118} {119} {120} - 219 - {121}2) Average Tare Report: Result {122}2) Average Tare Report: Standard deviation {123}2) Average Tare Report: 0,25T1 {124}2) Average Tare Report: Number of measurements 2) {125} Average Tare Report: Measurements {126}2) Average Tare Report: Report no. {130} Warehouse: Name {131} Warehouse: Code {132} Warehouse: Description {141} Additional display: WD {142} Additional display: WWG {143} Hex {144} Hex UTF-8 {146} Gross mass in current measuring unit {147} Tare in current measuring unit {150} PCL printer: Page offset {151} Epson printer: Paper cut {165} Formulation: Name {166} Formulation: Code {167} Formulation: Number of ingredients {168} Formulation: Sum {169} Formulation: Ingredient {170} Formulation: Ingredient no. {175} Report on formulation: Start date {176} Report on formulation: End date {177} Report on formulation: Sum {178} Report on formulation: Target value {179} Report on formulation: Difference {180} Report on formulation: Number of measurements {181} Report on formulation: Status {182} Report on formulation: Measurements - 220 - {188} Ingredient: Target mass {189} Ingredient: Difference {190} 2) Comparator: Report no. {191} 2) Comparator: Start date {192} 2) Comparator: End date {193} 2) Comparator: Order no. {194} 2) Comparator: Tested standard no. {195} 2) Comparator: Difference {196} {197} 2) Comparator: List of Measurements Comparator: Mean difference {198} 2) Comparator: Standard deviation {199} 2) Comparator: Number of cycles {200} 2) Comparator: Method {201} 2) Comparator: Min temperature {202} 2) Comparator: Max temperature {203} 2) Comparator: Min Humidity {204} 2) Comparator: Max Humidity {205} 2) Comparator: Min Pressure {206} 2) Comparator: Max Pressure {207} 2) Comparator: Task {208} 2) Comparator: Selected Task {209} 2) Comparator: Measurements 2) {210} Adjustment history: Type of adjustment {211} Adjustment history: Nominal mass {212} Adjustment history: Current mass {213} Adjustment history: Difference {214} Adjustment history: Temperature {215} Adjustment history: Level status {216} Adjustment history: Weighing platform no. {219} Adjustment history: Date and time of recently performed adjustment {220} 2) Mass control: Start date {221} 2) Mass control: End date - 221 - {222} 2) Mass control: Lot no. {223} 2) Mass control: Average {224} 2) Mass control: Standard deviation {225} 2) Mass control: Standard quantity {226} 2) Mass control: Measurements {227} 2) Mass control: Report no. {228} 2) Mass control: Number of T2M error {229} 2) Mass control: Number of T1M error {230} 2) Mass control: Number of T1P error {231} 2) Mass control: Number of T2P error {232} 2) Mass control: T2- threshold {233} 2) Mass control: T1- threshold {234} 2) Mass control: T1+ threshold {235} 2) Mass control: T2+ threshold {236} 2) Mass control: T2- threshold value {237} 2) Mass control: T1- threshold value {238} 2) Mass control: T1+ threshold value {239} 2) Mass control: T2+ threshold value {240} 2) Mass control: Average in percent (DX) {241} 2) Mass control: Standard deviation in percent {250} Density: Start date {251} Density: End date {252} Density: Procedure {253} Density: Standard liquid {254} Density of standard liquid {255} Density: Temperature if standard liquid {256} Density: Plunger volume {257} Density: Density determined {258} Density: Unit {259} Density: Sample no. {260} Density: Weighing 1 {261} Density: Weighing 2 {263} Density: Volume {266} Density: Mass of steel standard {267} Density: Mass of aluminum standard - 222 - {268} Density: Density of steel standard {269} Density: Density of aluminum standard {275} Ambient conditions report: Date and time {276} Ambient conditions report: Temperature THB {277} Ambient conditions report: Humidity THB {278} Ambient conditions report: Temperature 1 {279} Ambient conditions report: Temperature 2 {280} Ambient conditions report: Pressure THB {281} Ambient conditions report: Air density {282} Ambient conditions report: Humidity {283} Ambient conditions report: Pressure {285} 2) Mass Comparator: (Reference) Standards: Name {286} 2) Mass Comparator: (Reference) Standards: Code {287} 2) Mass Comparator: (Reference) Standards: Class {288} 2) Mass Comparator: (Reference) Standards: Factory no. {289} 2) Mass Comparator: (Reference) Standards: Mass {290} 2) Mass Comparator: (Reference) Standards: Set no. {295} Animal weighing: Threshold {296} Animal weighing: Averaging time {300} 2) Tasks: Name {301} 2) Tasks: Code {302} 2) Tasks: Class {303} 2) Tasks: Mass {304} 2) Tasks: Order no. {305} 2) Tasks: Tested standard no. {310} Pipettes: Name {311} Pipettes: Code {312} Pipettes: Model {313} Pipettes Tips {314} Pipettes: Nominal volume {315} Pipettes: Minimal volume {316} Pipettes: Number of channels - 223 - {317} Pipettes: Type {318} Pipettes: Type of volume {319} Pipettes: Tested volumes {325} Pipette calibration report: Serial no. {326} Pipette calibration report: Start date {327} Pipette calibration report: End date {328} Pipette calibration report: Number of measurements {329} Pipette calibration report: Operation with ISO 8655 {330} Pipette calibration report: Status {331} Pipette calibration report: Temperature {332} Pipette calibration report: Humidity {333} Pipette calibration report: Pressure {334} Pipette calibration report: Water temperature {335} Pipette calibration report: Z coefficient {336} Pipette calibration report: Statistics {337} Pipette calibration report: Measurements and statistics {338} Pipette calibration report: Number of channel {340} Pipette calibration report: Average volume {341} Pipette calibration report: Systematic error {342} Pipette calibration report: Systematic eror {343} Pipette calibration report: Tested volume {344} Pipette calibration report: Systematic error [%] {345} Pipette calibration report: Random error [%} {350} Lot: Name {351} Lot: Code {352} Lot: Samples {353} Lot: Number of samples {355} Sample: Name {356} Sample: Status {357} Sample: Tare {358} Sample: Temperature {359} Sample: Humidity {360} Sample: Pressure - 224 - {361} Sample no. {365} Weighing B: Interval {366} Weighing B: Difference {367} Weighing B: Difference % {368} Weighing B: Residue % {369} Weighing B: Number {375} Differential weighing: Method {380}2) Drying program: Name {381}2) Drying program: Code {385}2) Drying mode 2) Drying mode parameters 2) Finish mode 2) {388} Finish mode parameters {389}2) Drying report: Unit {390}2) Drying report: Printout interval {395}2) Moisture analyzer: Set temperature {396}2) Moisture analyzer: Current temperature {397}2) Moisture analyzer: Drying time {398}2) Moisture analyzer: Status {399}2) Moisture analyzer: Drying time and result {386} {387} 2) Moisture analyzer: Humidity content 2) Moisture analyzer: Dry content 2) Moisture analyzer: Humid/Dry ratio 2) Moisture analyzer: Heating source test – Power [%] {400} {401} {402} {403} {405} SQC: Batch no. {406} SQC: Start date {407} SQC: End date {408} SQC: Batch quantity {410} SQC : Mean - 225 - {411} SQC : Standard deviation {412} SQC : MIN {413} {414} SQC : MAX SQC : Difference {415} SQC : Measurements {416} SQC : Mean [%] {417} SQC : Standard deviation [%] {418} SQC : Number of T2- errors {419} SQC : Number of T1- errors {420} SQC : Number of T1+ errors {421} {422} SQC : Number of T2+ errors {423} SQC : T1- limit {424} SQC : T1+ limit {425} SQC : T2+ limit {426} SQC : Value of T2- error {427} SQC : Value of T1- error {428} SQC : Value of T1+ error {429} SQC : Value of T2+ error {440} Minimum sample: Name {441} {442} Minimum sample: Reference tare {443} Minimum sample: Status SQC : T2- limit Minimum sample Caution: Format of variables {0} and {1} is finished with characters CR LF, 1) (i.e. switching to a next line is carried out automatically), 2) Variables are not operated by software version: “Standard”. 41.2. Variables formatting Balance user can randomly format numerical variables, text variables and date which are dedicated for printing, and which are displayed in the grey coloured workspace of the display. Formatting types: • Variables with left justification, • Variables with right justification, - 226 - • • • • • Determining number of characters for printing / displaying, Determining number of decimal places for numerical variables, Converting the format of date and hour, Converting numerical variables into a code type EAN13, Converting numerical variables and date into a code type EAN128. Special formatting signs: Sign Description , Sign separating variables for formatting - Minus sign or left justification : Sign proceeding formatting or time separator (i.e. hours, minutes and seconds) . First detected dot in a digit is recognized as separator of integer and decimal parts. Each following dot is ignored. F Sign formatting digits to a chain of sign in format “ddd.ddd…” (where: d stands for a single digit, minus is for digits with negative value only) or determining number of decimal places V Formatting mass and quantities derivatives of mass in EAN13 code Formatting mass and quantities derivatives of mass in EAN128 code Date separator between days, months and years T / \ Sign “escape” deleting a formatting function from the following sign, so that it is recognized as text - 227 - Example {7,10} – Net mass in adjustment unit with constant length of 10 characters, with right justification {7,-10} – Net mass in adjustment unit with constant length of 10 characters, with left justification {7:0.000} – Net mass in adjustment unit always with three decimal places; {3:hh:mm:ss} – Current time in format: hour : minute : second {55:0.00} – Product’s unit price always with two decimal places; {17:0.0000} – Average from measurements, always with four decimal places; {7:F2} – Net mass in adjustment unit always with two decimal places; {7,9:F2} – Net mass in adjustment unit always with two decimal places and fixed length of 9 characters with right justification; {7:V6.3} – Net mass in a form of EAN13 code (6-character code) with three decimal places {7:T6.3} – Net mass in a form of EAN128 code with three decimal places; {2:yy/MM/dd} – Current date in format: year - month - day, where yy stand for two less meaningful characters of a year; {2:yy\/MM\/dd} – Current date in format: year / month / day; {2:yy\:MM\:dd} – Current date in format: year : month : day. Should “\” be used in literal meaning, insert: \\; Application list of formatted variables: CODE DESCRIPTION {7:V6.3} Net mass in EAN 13 code (6-character code) {7:V7.3} Net mass in EAN 13 code (7-character code) {27:V6.3} Net value in EAN 13 code (6-character code) {27:V7.3} Net value in EAN 13 code (7-character code) {7:T6.3} Net mass in EAN 128 code {8:T6.3} Gross mass in EAN 128 code {55:T6.2} Product price in EAN 128 code {2:yyMMdd} Data in EAN 128 code {61:yyMMdd} Product data in EAN 128 code {62:yyMMdd} Product’s shelf-life time in EAN 128 code 42. APPENDIX D – Settings of CITIZEN printer Baud rate Parity control Bits Stop bits Handshake IEEE 1284 9600b/sec none 8bit 1 bit No ON (enabled) Data from a printer regarding RS232: [Interface Menu] RS-232C Baud rate RS-232C Parity RS-232C Length RS-232C Stop bit RS-232C X-ON IEEE 1284 9600bps None 8 bit 1 bit No On Means of activating an information (test) printout and carrying out changes in printer’s settings is specified in a user manual of CITIZEN printers. - 228 - 43. APPENDINX E - Settings of ZEBRA printers Baud rate Parity control Bits Stop bits – – – – 9600b/sec none 8bit 1 bit Data on a printout from a printer regarding RS 232: Serial port : 96, N, 8, 1 Means of activating an information (test) printout and carrying out changes in printer’s settings is specified in a user manual of ZEBRA printers. 44. APPENDIX F – Communication with barcode scanners 1. For communication with barcode scanners RADWAG balances 3Y series use RS232 interfaces and simplex transmission (one direction) without handshaking. Only two wires are required for assuring such a transmission. Therefore, used scanners should be equipped in such interface with disabled both hardware and software handshaking. 2. Both balances and scanners have the possibility of setting of transmission parameters. Both devices are required to have the same parameters set : baud rate, number of data bits, parity control, stop bits. e.g. 9600,8,N,1 – baud rate 9600 bit/s , data 8-bits, no parity control, 1 stop bit. 3. Barcode scanners can send additional information apart from the expected barcode e.g. type of barcode. It is advisable to disable such information because RADWAG devices and software do not use it. 4. Some RADWAG systems can omit unnecessary information by using parameters that mark the beginning and the length of the code required to analyse. 5. Should a barcode be recognized by a balance, it needs to have some particular features. A code requires programming a characteristics prefix and suffix. In a standard accepted by RADWAG, a prefix is a sign (byte) 01 hexadecimal and a suffix is a sign (byte) 0D hexadecimal. 6. Most barcode scanners allow to enable/disable different barcode types. 7. Programming of scanners is usually performed by reading special barcodes or by using an external software tool. - 229 - Barcode with required prefix and suffix in hexadecimal format 01 30 30 32 31 30 31 32 36 0D Barcode without Code required –fixes type in ASCII format 00210126 EAN-8 0123456789 KOD 2 Z 5 CODE 39 TEST CODE 39 01 31 31 30 31 32 33 34 35 36 37 38 39 31 0D 1101234567891 EAN-13 01 43 6F 64 65 20 31 32 38 20 54 65 73 74 0D CODE 128 Test CODE 128 01 30 31 32 33 34 35 36 37 38 39 0D 01 43 4F 44 45 20 33 39 20 54 45 53 54 0D 45. APPENDIX G – Menu structure User adjustment Description Value Internal adjustment Function External adjustment Function User adjustment Function Adjustment test Function Automatic adjustment time 1 - 12 Report printout No / Yes GLP Project . . Name Setting » Adjustment No / Yes » Working mode No / Yes » Date No / Yes » Time No / Yes » User No / Yes » Balance type No / Yes » Balance ID No / Yes » Level status No / Yes » Nominal mass No / Yes » Difference No / Yes » Temperature No / Yes » Current mass No / Yes » Empty line No / Yes » Dashes No / Yes » Signature No / Yes - 230 - » Non-standard printout Adjustment history No / Yes Displays a report on completed external adjustments Databases − Products − Weighing records − Clients − Formulation − Reports from formulas − Reports from density − Controls − Average tares − Pipettes − Pipette calibration reports − Series − Ambient conditions − Packages − Warehouses − Printouts − Universal variables − Delete data older than − Export database of weighing records to file Communication Description Value COM 1 » Baud rate 9600 » Data bits 8 » Stop bits 1 » Parity No COM 2 » Baud rate 9600 » Data bits 8 » Stop bits 1 » Parity No Ethernet » DHCP No » IP address 192.168.0.2 » Subnet mask 255.255.255.0 - 231 - » Default gate 192.168.0.1 Tcp Port 4001 Peripheral devices Description Value Computer » Port COM 1 » Address 1 » Continuous transmission No / Yes » Printout template Settings » E2R System Settings » Port COM 2 » Code page 1250 » Printouts Settings » Port None / COM 1/ COM 2 » Offset 0 » Code length 0 Printer Barcode scanner Transponder card scanner Port None / COM 1/ COM 2 Port None / COM 1-2 / Tcp Project Settings Port None / COM 1-2 / Com internal Address 3 Additional display Ambient conditions module Inputs / Outputs Description Value Inputs » Input 1 Selection - 232 - » Input 2 Selection » Input 3 Selection » Input 4 Selection » Output 1 Selection » Output 2 Selection » Output 3 Selection » Output 4 Selection Outputs Access level Description Value Anonymous user » Guest Selection » User Selection » Advanced user Selection » Administrator Selection » Guest Selection » User Selection » Advanced user Selection » Administrator Selection » Guest Selection » User Selection » Advanced user Selection » Administrator Selection Date and time Printouts Databases Products Clients Selection: Formulation - Guest Packages - User Warehouses - Advanced user Printouts - Administrator Delete data older than - 233 - Others Description Value Language Selection Date and time Settings Beep Selection Touch panel calibration Function Level control Selection Autotest Selection User manual no.: IMMU-02-03-04-14-ENG - 234 -