1
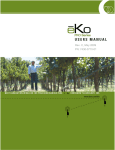
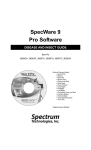
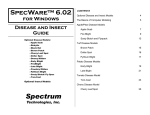
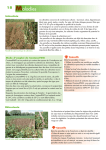
Apple Scab Fruit Lesions
Evolution of Fungicide Resistance: A Study of Fitness and Selection
or
"Evolution Happens"
Phil A. Arneson
Department of Plant Pathology
Cornell University, Ithaca, NY
PREPARATION
This exercise is a simulation requiring an IBM-PC or compatible computer running
Microsoft Windows. Install RESISTAN by following the installation instructions in the
Resistan user's manual, "User_Manual.doc". Prepare a copy of the RESISTAN user's
manual by opening the "User_Manual.pdf" document. You may want to make a printed
copy of the manual, or you can reduce the manual to an icon to keep it as a handy on-line
reference as you run RESISTAN. There is a self-guided tutorial in the manual to help you
familiarize yourself with the program before embarking on this exercise. You will also
find it useful to get acquainted with a word processor, such as Windows Notepad or
WordPad, before you start. These instructions assume that you have a working
knowledge of Microsoft Windows.
INTRODUCTION
Biologists who deal with managing populations of "pest" species know (or ought to know
and often forget) that any attempt to kill individuals in a population or limit their
reproduction can result in the evolution of a refractory population. Whatever means we
1
use to control a population can impose a selection pressure, as long as there are variants
present that have a heritable resistance to whatever control measure is being used. For
example, by swatting the slow ones, we can select a population of faster flies (provided
that we are able to kill a significant proportion of the whole population). In pest
management, by far the most common selection pressure imposed is through the use of
pesticides. There are two key reasons for this: the first is that pesticide resistance is
often a matter of a single gene change (alteration of a binding site, shift in a metabolic
pathway, synthesis of a detoxifying enzyme, etc.) and therefore very common, and the
second is that pesticides are often over-used, resulting in a strong selection pressure.
The evolution of pesticide resistance, therefore, is a good model for studying fitness and
selection in a changing environment. In this exercise, we will use a computer simulation of
the selection of fungicide resistance in response to the application of fungicides. The
model, RESISTAN, mechanistically simulates the infection, growth, and sporulation of a
plant pathogenic fungus and the effects that fungicides have on each of these steps in the
fungus life cycle. The structure of the model is generalized, but it can be made to
represent a specific fungus and specific fungicides by an appropriate selection of
parameters. For this exercise, we will use a set of parameters that realistically represent
the control of apple scab (caused by the fungus, Venturia inaequalis) with a multi-site
fungicide, captan, and a single-site fungicide, benomyl.
Germinating ascospores of Venturia inaequalis
The conditions of the simulation. RESISTAN simulates selection in a clonal
population (an asexually reproducing, haploid organism) and therefore ignores genetic
recombination. No resistance to captan has yet been observed in V. inaequalis, despite its
use for almost 40 years, while resistance to benomyl was reported in some orchards after
only 3 years of use. The parameters in this data set correspond to rates of fungicide
2
weathering and rates of infection that would occur on a very susceptible cultivar in an
unusually rainy season, and the initial inoculum (5000 ascospores/acre) corresponds to a
very high level of infection the previous season. Under these conditions captan does not
adequately control apple scab, and the quantity of ascospores to begin each successive
season creeps upward slowly. Benomyl, on the other hand, will very effectively
suppress the development of the fungus and dramatically reduce the amount of initial
inoculum the following season (as long as the V. inaequalis population is still sensitive to
benomyl). The initial percent resistance to benomyl, 0.0001% (1 ascospore in a million),
corresponds approximately to what is believed to be the mutation rate for benomyl
resistance in this fungus.
PERUSING THE DATA
The standard runs. To save you time, several runs of the simulator have been done for
you. The attached data (Appendix A) show the percent resistance, active lesions, percent
loss, and profit at the end of each season for several consecutive years. (If you want to
see the details of disease development and selection of resistance within each season, feel
free to run these simulations yourself.) Note first the development of the disease in the
absence of fungicides, and then look at the results with each of the fungicides used alone
at the labelled doses. Question 1: Under these conditions, why does each of these
fungicides eventually fail to control apple scab? In order to detect a problem of
resistance, the grower could simply wait for failure of control, or she/he could routinely
monitor fungicide resistance at the end of each season by plating spore samples on
benomyl-amended media. Question 2: When would the grower become aware of a
resistance problem in each case (with and without monitoring resistance)?
Apple Scab Leaf Lesions
3
RUNNING "RESISTAN"
1.
Double click on the "Resistan" icon to start the Resistan program.
2.
Click on OK at the bottom of the title screen.
3.
Click on File, move down to Open..., and click again. Locate the cursor on the
file venturia.rss, and double click to load the Venturia parameter set. (If necessary
to locate the file, move the "thumb" downward on the scroll bar.)
4.
Click on Fungicides, move down to Select, and click again. You can apply
two fungicides at a time by selecting the desired fungicide in each of the two select
windows. Click on one of the fungicide windows until Benomyl appears, then
click OK.
5.
Click on Fungicides again, move down to Schedules..., and click to bring up
the spray schedule window. Click on the fungicide name until Benomyl appears
in the window. Check to see that the spray dates and the dose match those in the
table in the handout, and make any corrections necessary. To change a value,
locate the cursor on the value to be changed (when properly positioned, the cursor
changes from an arrow to a vertical bar), hold down the left button, and move the
cursor to the right until the entire value is highlighted, then type in the new value
at the keyboard. Move the cursor to the next value and repeat the process. Dates
or doses can be changed individually, one at a time, or they can be changed all at
once by clicking on the Dates or Doses button. Once the spray schedule is
ready, click on OK.
Initial inoculum. For the data set in the handout, the level of initial inoculum at the time
that we first applied benomyl corresponded to a very high level of infection the previous
season. Question 3: Do we risk a higher rate of selection of resistance if we use benomyl
as a "rescue" treatment (that is, to bring an epidemic under control after the inoculum has
been allowed to rise to a high level) than if we use it only to maintain control of a low
level of infection? (Explain!)
1.
Click on Fungus, Inoculum..., change 5000 to 500, and click OK.
2.
Click on File, Run and then press 〈End〉 to let the season go to completion.
While the simulation is running, the cursor changes to an icon of an hourglass.
Click on View to help you interpret the graph that appears on the screen. Run
another season by clicking on File, Continue. There is no need to save the
output for this season's simulation. Repeat the simulation for at least four
consecutive seasons.
3.
At the end of the final season, click on File, move down to Log to Disk..., and
click again. Type in a unique 8-character name followed by a period and the 3character extension "TXT" (e.g., initinoc.txt). Close the log file by clicking on File,
Close Log File.
4
Reduced dose of benomyl. The data in the table in the handout are based on the
recommended dose of benomyl in each spray. Question 4: What would be the effect of
reducing the dose of benomyl to half the standard dose on the rate of selection of
resistance and the effectiveness of the disease control?
1.
Reinitialize the model as before, using File, Open... to open the venturia.rss file.
2.
Select benomyl in the Fungicides, Select... dialogue box, and then click on
Fungicides, Schedules... to change the benomyl spray schedule. Click on the
Doses button at the right of the "SPRAY SCHEDULE" dialogue box, and set the
dose for all applications at 0.25 and click OK. (Do not worry if .25 appears in all
the dose boxes; if the date is 0, no spray will be applied.)
3.
Click on File, Run again to run the simulation for several consecutive seasons
until the disease control appears to fail.
4.
As before, log the results to a file under a different name and close the file.
Reduced host susceptibility. The standard runs in the handout were done with a highly
susceptible cultivar. Question 5: Does a less susceptible cultivar offer any advantages
in the selection of resistance and the effectiveness of disease control with benomyl?
1.
Reinitialize the model with the Venturia parameters as before, then click on
Plant, Susceptibility....
2.
Locate the cursor over the black square at the left of the horizontal line at 100%.
Press the mouse button down, and while holding it down, drag the square
downward until the Y-coordinate reads "80%", then release the button. In a
similar manner relocate the right end of the line to 80%. Double click on the - in
the top left corner of the Susceptibility Profile dialogue box to return to the main
menu.
3.
Select benomyl as the fungicide to be applied, using the default spray schedule.
4.
Run the model for as many seasons as necessary to see the loss of disease control
again.
Reduced fitness of fungicide-resistant biotype. All of the evidence so far suggests that
in the absence of the fungicide, Venturia populations resistant to benomyl are as fit
ecologically as the wildtype populations. However, with some of the other new
fungicides, the resistant biotypes seem to be significantly less fit than the wildtype in the
absence of the fungicide. Question 6: What is the effect of a slightly reduced fitness of
the resistant biotype compared with the wildtype on the rate of selection of resistance
and on the rate of reversion to the sensitive wildtype? To observe this phenomenon
better, we first had better do a run with no reduction in fitness to resistance to establish a
baseline for comparison and follow the selection of resistance during the course of one
season. (In this case the values at the end of the season do not tell the whole story.
5
1.
Reinitialize the model again with the Venturia parameter set, then select both
captan and benomyl for application.
2.
Bring up the captan spray schedule and eliminate the first four sprays by entering
a "0" in their spray dates. Eliminate all but the first 2 benomyl sprays in the same
manner.
3.
To give us a visible level of resistance at the start, click on Fungus,
Resistance... and enter 10% on the benomyl line.
4.
Save this spray schedule and startup values to facilitate setting up the second run.
Click on File, Save As..., and give the file a name that clearly identifies it (e.g.,
fitness.rss).
5.
Run the simulation for one season only and observe the pattern of resistance.
6.
Save these data in a log file for later reference with the commands, File, Log to
Disk..., giving it a name that clearly identifies it. (Be sure to close the log file.)
Now that we have a baseline, let us do the same thing, but with a small fitness cost to the
resistant biotype.
1.
Reinitialize again with File, Open... and using either the RSS file that you just
saved or the Venturia data set.
2.
If you saved the RSS file before the previous run, you can skip to step 4.
Otherwise, set up the same spray schedule as before with two sprays of benomyl
followed by captan.
3.
Start again with 10% resistance to benomyl.
4.
This time click on Fungicides, Characteristics... and bring up the benomyl
parameter set. Enter the value of 0.9 in each of the boxes corresponding to "Spore
Survival", "Lesion Development", and "Sporulation". (Note: A value of 1.0
means that the fitness of the resistant biotype is equal to that of the wildtype.)
5.
Run the model for 1 season as before, save the output in a log file with an
appropriate name, and then close the log file.
Fungicide combinations. Combinations of a single-site fungicide with a multi-site
fungicide, either as formulated combinations, "tank-mixes", or in alternating sprays, have
long been recommended as a means of combating fungicide resistance. Some of these
recommendations have stated that resistance could be prevented by this means, arguing
that the multi-site fungicide in the spray program would kill any mutants resistant to the
single-site fungicide. Run RESISTAN for at least 10 consecutive seasons with a
combination of benomyl and captan, using the default spray schedules for both
fungicides. This is equivalent to applying a tank mix of benomyl and captan every other
week and captan alone in the alternate weeks.
6
For the moment, ignore the cost of this spray program (which is unreasonably high).
Question 7:
(a) If you were assessing the efficacy of this fungicide combination only on the basis
of the numbers of lesions visible, how long would it take you to notice a problem?
(b) What would be the percent resistance at the time?
(c) How long would it be before you would be able to find enough lesions to detect
resistance by resistance monitoring?
(d) What would be the percent resistance at that time?
(e) What is the effect of combining captan with benomyl in this way on the rate of
selection of benomyl resistance?
(f) Are combinations of benomyl with a multi-site fungicide such as captan an
effective way of combating resistance? Explain.
Fungicide resistance management. With a fungicide that has no fitness cost associated
with its resistance, true management of resistance is not possible -- it is possible to slow
down the rate of selection of the resistant biotype, but the frequency of resistance in the
population will inexorably creep upward until it finally reaches 100%. With even a small
fitness reduction in the resistant biotype, however, it is possible to manage the frequency
of resistance in the population while still maintaining disease control. Question 8: Using
what you have learned in this exercise, what kind of a spray program would you put
together to maintain effective disease control for at least 10 seasons, using only the four
fungicides available in the VENTURIA.RSS dataset? (Start with an initial inoculum of
5000 spores/acre and a resistance of 0.0001%.) Include the details (doses and dates of
application) of your spray schedules each year and your year-end summaries of
resistance and numbers of lesions.
PRINTING LOG FILES
All of the files that have been created by the Resistan Log to Disk... function are
standard ASCII text files. Therefore, they can be printed with the DOS print
filename.txt command or edited with any text editor (e.g., Notepad or WordPad). Since
the files are rather large, you may wish to edit them to select only the lines that are of
particular interest. In most of the runs, you will want to save only the lines in the "LongTerm Summary" at the end of the file.
7
APPENDIX A
1. UNSPRAYED EPIDEMIC
Initial Inoculum: 5000 spores/acre
Initial Percent Resistance to the Benomyl: 0.0001
End
Year
1
2
% Resistance
to Benomyl
0.0
0.0
Active
Lesions
363872
14704542
%
Loss
24.85
95.45
Profit
622.95
-788.87
2. BENOMYL, STANDARD DOSE
Initial Inoculum: 5000 spores/acre
Initial Percent Resistance to the Benomyl: 0.0001
SPRAY SCHEDULE
Benomyl
Date
Dose (lb/acre)
----------------------------1
0.5
15
0.5
29
0.5
43
0.5
57
0.5
71
0.5
85
0.5
99
0.5
End
Year
% Resistance
to Benomyl
1
2
3
4
0.4708
95.7228
99.9991
100.0000
Active
Lesions
67
62
11091
1931922
8
%
Loss
0.01
0.01
1.07
60.11
Profit
1035.85
1035.88
014.65
-166.18
3. CAPTAN, STANDARD DOSE
Initial Inoculum: 5000 spores/acre
Initial Percent Resistance to the Captan: 0.0
SPRAY SCHEDULE
Captan
Date
Dose (lb/acre)
----------------------------1
6.0
8
6.0
15
6.0
22
6.0
29
6.0
36
6.0
43
6.0
50
6.0
57
6.0
64
6.0
71
6.0
78
6.0
85
6.0
92
6.0
99
6.0
106
6.0
End
Year
1
2
3
4
5
6
7
% Resistance
to Benomyl
Active
Lesions
%
Loss
Profit
0.0000
0.0000
0.0000
0.0000
0.0000
0.0000
0.0000
4283
10977
28117
71899
183091
461347
1132380
0.43
1.08
2.71
6.61
15.01
29.97
49.69
823.50
810.39
777.74
699.90
531.74
232.53
-161.73
9