1
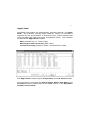
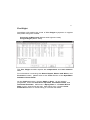
SpecWare 9
Pro Software
DISEASE AND INSECT GUIDE
Item #’s
3656GA, 3656AP, 3656TU, 3656PO, 3656TO, 3656CH
Optional Disease Models:
• Apple Scab
• Botrytis
• Black Rot
• Brown Patch
• Cherry Leaf Spot
• Dollar Spot
• Downy Mildew
• Early Blight
• FireBlight
• Late Blight
• Phomopsis Cane Leaf Spot
• Powdery Mildew
• Pythium Blight
• Sooty Blotch/Flyspeck
• Tom-Cast
Optional Insect Models
2
CONTENTS
Optional Disease and Insect Models
4
The Basics of Computer Modeling
5
Apple/Pear Disease Models
Apple Scab
7
Fire Blight
9
Sooty Blotch and Flyspeck
13
Turf Disease Models
Brown Patch
15
Dollar Spot
16
Pythium Blight
17
Potato Disease Models
Early Blight
19
Late Blight
21
Tomato Disease Model
Tom-Cast
23
Cherry Disease Model
Cherry Leaf Spot
25
3
Grape Disease Models
Black Rot
27
Downy Mildew
29
Powdery Mildew
31
Phomopsis Cane and Leaf Spot
33
Botrytis
34
Disease Model References
35
Insect Models
37
Insect Model References
41
Software License Agreement
44
4
Optional Disease and Insect Models
SpecWare software includes models to predict infection events for the
following diseases and for insects. These models are provided FREE
for a 30 day evaluation. If the user desires continued use of any of the
disease or insect models after the evaluation period, or if any model
was purchased initially with SpecWare, the user must contact
Spectrum Technologies for a registration number.
Before calling Spectrum, click on the Help button on the main toolbar.
Then click on “About SpecWare” A dialog box will appear with both
the Serial Number and Registration Number. Call, fax, or e-mail
Spectrum with this information to receive your authorization code. The
optional disease and insect models are as follows:
Model
Catalog #
Apple Scab
3656 AS
Black Rot
3656 BR
Botrytis
3656 BT
Brown Patch
3656 BP
Cherry Leaf Spot
3656 CS
Dollar Spot
3656 DS
Downy Mildew
3656 DM
Early Blight
3656 EB
Fire Blight
3656 FB
Late Blight
3656 LB
Powdery Mildew
3656 PD
Pythium Blight
3656 PT
Sooty Blotch
3656 SB
Tom-Cast
3656 TC
Insects
3656 IN
For detailed descriptions of how to open files and choose the locations
and time periods to be modeled, refer to the SpecWare Software
Users Guide.
5
The Basics of Computer Modeling
There are practical considerations that must be taken into account
when using computer models to predict biological processes such as
disease or insect activity. The model must be appropriate for the
particular insect or disease. The data for environmental parameters
must be acquired to accurately predict the life stages of the organism.
The type of crop and its stage of development has an effect on the
development of the pest organism. The region in which the model was
developed is also important. A useful computer model takes each of
these points into account.
Using common names to distinguish one disease or insect from
another can lead to errors. For instance, almost every crop plant
known to man has a disease called powdery mildew. SpecWare has a
model for powdery mildew on grapes caused by the organism with the
Latin name Uncinula necator. However, the disease organism that
causes powdery mildew on apples is Podosphaera leucotricha and on
blueberries, it is Microsphaera penicillata. Disease and insect models
that are universally applicable to several different crops are the
exception, not the rule. Therefore, disease and insect models are
usually developed for a particular crop and a specific pest organism.
Every computer model must include the assumption that the primary
environmental conditions that affect the development of the disease or
the insect can be measured.
SpecWare uses a variety of
environmental sensors to model the progression of plant diseases.
SpecWare uses only degree days to model insect phenology. The
author of the disease or insect model must do a sensitivity analysis to
assure that the model is being driven by the most important
environmental data. For instance, the development of apple scab is
believed to be affected by some wavelengths of red light. However,
the inclusion of red light data has minimal added effect on the accurate
modeling of apple scab. The development of apple scab is primarily
driven by temperature and leaf wetness.
6
Many conditions directly related to the host plant affect insect and
disease development. These conditions may include the availability of
insect-preferred fruit on which to feed or lay eggs or the type of plant
structure that the insects use as cover from their enemies. Diseases
may be affected by plant nutritional status or the presence of nondisease fungal species that compete with the disease-causing
organism for space or resources. Pears and apples can both be
infected with fire blight and SpecWare allows the user to specify
apples or pears in the fire blight model. This feature is present
because the rate of infection is different for apples versus pears. In
fact, the rate of infection is slightly different even among different
varieties of apples. To carry this example further, soft rapidly growing
tissue is more susceptible to fire blight than is older, harder tissue. In
this case, the grower’s experience concerning how much nitrogen to
apply and the effects of that fertilizer application for a particular cultivar
should be considered as part of the IPM program to control fire blight.
Developing disease and insect models must necessarily be
accomplished at some particular geographic location.
This is
important because for each region of the country different climatic
conditions exist, different organisms that compete for space are
present, and slightly different genetic variations occur in the pest
species. For that reason, some models such as apple scab and fire
blight specify that they are from New York or Washington or Maryland.
Also, for reasons of regional differences, the insect models show the
location in which they were developed. For example, an insect or
disease model developed for grapes in California probably is useful for
grapes in New York. The local university extension service should be
contacted to verify that the model is appropriate for a particular region.
7
Apple Scab
SpecWare will predict the approximate “Infection Degree” for Apple
Scab. The infection severity (Light, Medium, Heavy, or Infected) is
triggered by the accumulation of sufficient hours of leaf wetness that
occur between the base and upper temperature limits. The software
includes three Apple Scab models:
Mills (modified by A.L. Jones 1980)
Washington State University (Mills 1944)
Cornell University (Gadoury, Seem, and Stensvand 1994)
The Apple Scab models require temperature and leaf wetness data.
For information concerning the Select Report, Where and When, and
Forecast screens, please refer to the Tools section of the SpecWare
Software Users Guide.
8
Apple Scab (continued)
In the Options screen, enter the low and high limits of the temperature
range in the Base and Upper Limit boxes. The generally accepted
temperature range is between 33° and 79° F. Enter the Wetness
Threshold above which you desire the software to consider the
foliage “wet.” Consult your State Agricultural Extension Service for
assistance in determining the appropriate temperature and leaf
wetness values for your area. These parameters can be saved by
clicking on the Save Parameters button.
On the View Report screen, the infection severity for Apple Scab
appears. The Mills and Washington State models denote either no
infection potential or a Light, Medium, or Heavy infection potential.
The Cornell model only designates Infected when an infection is
predicted.
The Mills model, as modified by Jones, requires fewer hours of leaf
wetness at average temperatures 47°F or below to signal a risk for
infection than does the Washington State model. Both of these
models denote a Light, Medium, or Heavy infection risk depending on
the number of hours of leaf wetness at a given average temperature.
The Cornell model requires the fewest number of leaf wetness hours
at all given temperatures and simply indicates Infected or not. The
Cornell model signals Infected with fewer leaf wetness hours than the
other two models require to even signal a Light infection.
9
Fire Blight
SpecWare will predict the onset of Fire Blight symptoms in apples
and pears using two models.
University of Maryland (Steiner and Lightner 1996)
Cougar Blight (Smith 1993)
The Fire Blight models require air temperature and leaf wetness
data.
For information concerning the Select Report, Where and When, and
Forecast screens, please refer to the Tools section of the SpecWare
Software Users Guide.
On the Options screen, choose Apple or Pear. As the season
progresses, enter the 50% Green Tip Date, First Bloom Date, and
Last Petal Fall Date. Whenever a Spray Date or a Trauma Event
Date occurs, enter those as well. After each entry, click the Save
Parameters button to avoid having to re-enter the dates.
10
Fire Blight (continued)
On the View Report screen, the results of the University of Maryland
model and the Washington State University model Cougar Blight
appear.
University of Maryland
Model developed by P.W. Steiner and G.W. Lightner
SpecWare will predict specific infection events and the appearance of
blossom, canker, and shoot blight symptoms. The model uses three
cumulative heat unit measures to indirectly monitor development of the
host, the pathogen, insect vectors, and Fire Blight symptoms.
Steps
G
B
H
W
T
Green Tip; from green tip date until Canker blight symptoms
Blossom; from first blossom date until Blossom blight symptoms
198 Degree Hours > 65ºF requirement met
Wetness (dew or rain) requirement met
Average Temperature > 60ºF
G is initiated by entering a 50% green-tip date on the options screen.
B, H, W, and T are active only during the bloom period as entered on
the options screen.
EIP
EIP, Epiphytic Infection Potential, is an index for infection risk. EIP is
the percentage of 198 DH>65ºF that have accumulated in the last 80
DD>40ºF (apple) or 120 DD>40ºF (pear). An EIP of 100 is the threshold for infection.
Symptoms
Cumulative DD>55ºF are used to predict symptom development once
infection has occurred. The number in the symptom column represents
11
Fire Blight (continued)
the percentage of the threshold met by the conditions. A symptom
value of 100 indicates that symptoms are present. That is, 100% of
the temperature or degree day requirements have been met for the
blossom, canker, or shoot blight symptoms to be readily apparent.
The following describes the symptom and the threshold.
Ck - Canker Blight
Canker blight is predicted with the accumulation of at least 196
DD>55ºF after green tip.
Bl - Blossom Blight
The model assumes an abundance of inoculum. Four conditions need
to be met for a blossom infection to occur.
1. Flowers, with stigmas and petals intact, need to be present.
2. Accumulation of at least 198 DH>65ºF within the last 80 DD>40ºF
(apple) or 120 DD>40ºF (pear).
3. Occurrence of dew or rain of 0.10 inch or more during the current
or previous day.
4. Daily average temperature greater than or equal to 60ºF.
When all minimum conditions are met in sequence, infection occurs
and the first blossom blight symptoms can be seen after an additional
accumulation of 103 DD>55ºF. The cumulative DH>65ºF are reduced
by one-third, one-half or reset to zero if the temperature does not
surpass a threshold of 64F during one, two or three days, respectively.
However, once 400 DH>65ºF have accumulated (EIP=200), no
negative adjustments are made.
Sh - Shoot Blight
The program forecasts only very early shoot blight symptoms. These
early symptoms usually develop with the accumulation of 103
DD>55ºF following the first appearance of either blossom or canker
blight symptoms in the immediate area.
The average daily
temperature must be 60ºF or greater.
12
Fire Blight (continued)
Cougar Blight
Model developed by T.J. Smith
Under the Cougar heading, there is a lettered Pathogen Potential
(a to e) that is used to estimate the presence of Fire Blight inoculum.
For each level of inoculum present, a numbered Infection Risk (0 to
4) predicts the severity of an infection.
Pathogen Potential
a: No Fire Blight in area in past two seasons
b: Fire Blight in local area in past two seasons
c: Fire Blight in local area last year
d: Fire Blight in orchard last year
e: Active cankers present nearby
Infection Risk
0: Very Low
1: Low
2: Low-Moderate
3: Moderate
4: High
13
Sooty Blotch and Flyspeck
Sooty blotch is a disease complex (i.e. it is composed of more than 1
pathogen) of two fungi, Peltaster fruticola and Leptodontium elatius.
Flyspeck is caused by another fungus, Zygiophiala jamiacacenis.
SpecWare predicts the period of risk for infection based on leaf wetness after apple flower petal fall. Both fungi are dispersed by rainfall
and their spores germinate in water (Jones and Sutton 2001).
Both models require air temperature and leaf wetness data.
For information concerning the Select Report and Where and When
screens, please refer to the tools section of the SpecWare Software
Users Guide.
On the Options screen, specify the leaf Wetness Threshold. A typical setting is 3 so noise is not included in the readings. The sensor
range is from 0-15. This is a relative scale so no value is attached to
the reading.
14
Sooty Blotch and Flyspeck (continued)
While currently there is no way to adjust the model directly from the
The model starts after 259 hours of leaf wetness have been accumudata in the reports a person can choose to ignore or respond to certain
lated. Only leaf wetness periods of at least 3 hours are counted (less
warnings based on the hours of leaf wetness around the possible inthan 3 hours are not included). After the 259 hours have accumulated,
fection period (the degree or reading that is used as the minimum leaf
the model starts. Any 3-hour leaf wetness period after the start sigwetness can be altered in the Options folder. A typical setting is 3
nals a possible infection period.
so the noise is not included in readings. The scale is 0-15 for the leaf
wetness
and
it is
relativemay
scale
so no avalue
is attached
Different sensor
areas of
the
country
require
different
numberdirectly
of leaf
to the reading.).
wetness
hours to start the model. Presently, we use only the most
conservative model (i.e. the one that will give the earliest warning). InThe model is opened by clicking on disease models under the tools
dividual users of the models can choose to ignore those infection preoption in the tool bar. Next click on the Sooty Blotch and then reports
dictions and run the model from the data by themselves.
to see possible infection periods. Also, weather forecasts can be
added
reports
by inputing
weather
predictions
into thewetness
forecast
On
thetoView
report,
the user
can see
the measured
hours,
folder.
the accumulated wetness hours and any messages noting the start of
an infection period.
15
Brown Patch
SpecWare will indicate specific infection events for the onset of
Rhyzoctonia Brown Patch in turf. (Schumann, Clarke, Rowley, and
Burpee 1994)
The Brown Patch model requires air temperature, soil temperature,
relative humidity, and rainfall data.
For information concerning the Select Report, Where and When, and
Forecast screens, please refer to the Tools section of the SpecWare
Software Users Guide. There are no Options to be entered for
Brown Patch.
On the View Report screen for Brown Patch, an Infection Warning
appears. The infection warning column will indicate how many of six
thresholds have been met for the onset of Brown Patch. If most of
the thresholds for infection have been met, information concerning the
remaining unmet thresholds will be given. The Infection Warning
Thresholds are listed at the end of the disease report screen.
16
Dollar Spot
SpecWare will indicate specific infection events for the onset of
Sclerotinia Dollar Spot in turf. The software includes two Dollar
Spot models:
Hall Model (Hall 1984)
Mills/Rothwell Model (Mills and Rothwell 1982)
The Dollar Spot model requires air temperature, relative humidity,
and rainfall data.
For information concerning the Select Report, Where and When, and
Forecast screens, please refer to the Tools section of the SpecWare
Software Users Guide. There are no Options to be entered for
Dollar Spot.
On the View Report screen, the Hall Model Infection Warning
Thresholds and the Mills/Rothwell Model Infection Warning
Thresholds are listed. If these thresholds are met, the software will
display Infection; otherwise the warning section remains blank.
17
Pythium Blight
SpecWare will indicate specific infection events for the onset of
Pythium Blight in turf. (Nutter, Cole, and Schein 1983)
The Pythium Blight model requires air temperature and relative
humidity data.
For information concerning the Select Report and Where and When
screens, please refer to the Tools section of the SpecWare Software
Users Guide. The ability to Forecast weather data is not available for
Pythium Blight.
Both the low and the high temperatures must attain a certain level. On
the Options screen, specify the Low Temperature Over and High
Temperature Over limits. Also specify the Minimum Hours > 90%
RH. The generally accepted temperatures are 68°F and 86°F. The
generally accepted hours of relative humidity greater than 90%
needed to trigger Pythium Blight range from 9 to 18. Consult with
your State Agricultural Extension Service for further information
regarding appropriate values for your area.
18
Pythium Blight (continued)
On the View Report screen, the Pythium Blight disease model will
give an Infection Risk index of 0-3. There are three thresholds that
need to be met for the onset of Pythium Blight. If none or one are
met, the Infection Warning will be blank. If 2 or 3 of the thresholds are
met, the software will tell you how many are met, and which still need
to be met for the continued progression of the disease.
19
Early Blight - Potato
SpecWare will predict sporulation and thereby the secondary spread
of the Early Blight pathogen on potato leaves. (Stevenson, Binning,
Connell, Wyman, and Curwen 1996)
The Early Blight - Potato model requires air temperature, relative
humidity, and rainfall data.
For information concerning the Select Report, Where and When, and
Forecast screens, please refer to the Tools section of the SpecWare
Software Users Guide. There are no Options to be entered for
Early Blight.
On the View Report screen, the P-Days and RV’s (Rating Values) are
shown. The P-Day is a measure of the temperature conditions
contributing to potato growth. Potatoes grow between 45°F and 86°F
with the optimum temperature being 70°F. The calculation of P-Days
20
Early Blight - Potato (continued)
assumes that the plants spend three hours at the maximum
temperature for the day, five hours at the minimum temperature for the
day and the remaining 16 hours between the daily maximum and
minimum temperature. No P-Days are accumulated below 45°F or
above 86°F. Spray applications are not recommended for Early
Blight control until 300 P-Days have accumulated. The Warning column indicates when this threshold has been reached.
The spray interval for Early Blight is indicated by the RV (Rating
Value). The RV is a result of the accumulation of P-Days, hours of
relative humidity, and rainfall. The 5-day RV is used to establish the
appropriate spray interval for the crop. Contact your State Agricultural
Extension Service for more information about using the RV for timing
Early Blight sprays.
21
Late Blight - Potato
SpecWare predicts the spread of the Late Blight pathogen on potato
leaves using BLITECAST (Krause, Massie, and Hyre 1975).
The Late Blight - Potato model requires air temperature, relative
humidity, and rainfall data.
For information concerning the Select Report, Where and When, and
Forecast screens, please refer to the Tools section of the SpecWare
Software Users Guide. It is recommended that the earliest Process
Date on the Where and When screen be the date that distinct green
rows are seen in the field.
On the Options screen, enter the Blight First Forecast Date (as
predicted or observed) to limit the calculation for the progression of the
disease only to later dates. The ability to enter the Blight First
Forecast Date allows SpecWare to avoid having to spend time
recalculating the initial infection date every time the model is used.
Enter the Last Spray Date as a record of spray activity. Click on
Save Parameters to avoid having to re-enter the dates.
22
Late Blight - Potato (continued)
On the View Report screen, Rain-favorable Days, Severity Value
and spray Warning are reported. Cool, wet weather with periods of
relative humidity greater than 90% provide ideal growing conditions for
Late Blight. Hyre and Wallin have each developed methods for
predicting the initial occurrence of Late Blight. Once Late Blight is
triggered, a single method, common to both Hyre and Wallin, is
employed to predict the progression of the disease. Accumulation of
Rain-favorable Days and Severity Values begins at plant
emergence. Severity Values are based on the average temperature
and the number of hours the crop experiences 90% or greater relative
humidity during that period. The warning, Blight Triggered, initially
occurs with the accumulation of 10 consecutive Rain-Favorable days
or with the accumulation of a Severity Value of 18. Spray warnings
are the result of further accumulations of Rain-Favorable days and
Severity Values.
23
Tom-Cast
SpecWare uses Tom-Cast, a TOMato disease foreCASTing program
designed to predict Early Blight, Septoria Leaf Spot, and Anthracnose.
(Pitblado ~1985; Bolkan and Reinert 1994) Tom-Cast calculates a
disease severity value (DSV) to predict the development of these
diseases.
The Tom-Cast model requires air temperature and leaf wetness
data.
For information concerning the Select Report and Where and When
screens, please refer to the Tools section of the SpecWare Software
Users Guide. The ability to Forecast weather data is not available for
Tom-Cast.
On the Options screen, Specify the Temperature Base, Upper Limit
and leaf Wetness Threshold.
24
Tom-Cast (continued)
On the View Report screen, an increasing number of leaf wetness
hours and a higher temperature cause the DSV (disease severity
value) to increase at a faster rate. A Cumulative DSV of 15 to 20 is
usually viewed as the threshold for initiating a spray program. Contact
your State Agricultural Extension Service for further information
regarding disease management in your area.
25
Cherry Leaf Spot
The pathogen responsible for Cherry Leaf Spot is Blumeriella jaapi.
It is a fungus that overwinters in diseased leaves. Primary inoculum
spores are released into the air. The secondary inoculum (that which
follows the first infection) is splash dispersed. The ability of the inoculum to infect depends on temperature and leaf wetness (Jones and
Sutton 2001).
Cherry Leaf Spot requires temperature and leaf wetness to assess
the degree of infection.
For information concerning the Select Report, Where and When and
Forecast screens, please refer to the tools section of the SpecWare
Software Users Guide.
On the Options screen, specify the leaf Wetness Threshold. A typical setting is 6. The sensor range is from 0-15. This is a relative scale
so no value is attached to the reading.
26
Cherry Leaf Spot (continued)
An unusual aspect of the model is the “risk factor”. The models were
originally designed to determine the risk of infection at a constant temperature for a certain period of leaf wetness. However, in the field,
temperature is rarely constant. Unfortunately, there is no data on this
subject and shifts in temperature create a situation where an infection
interval is not flagged because the average temperature was too low
while the actual temperature during a portion of the wetness period
was sufficient for an infection. A tool for assessing the temperature
shifts during a wetness period is the “risk” rating. Basically, if the
model is run on a 15 minute interval, the risk of infection at that point is
calculated. For example if at a certain temperature, 8 hours of wetness are required and it is wet at that temperature for 1 hour, the risk
is 1/8. If the sum of the risks is 1 or greater, there has been, in all likelihood, an infection period and the period is flagged as such.
There are three levels of infection risk; light, moderate and high. The
user can decide what risk level is acceptable for economic control.
The View option gives a report of the temperature, leaf wetness, infection flag/ warning, and the risk factor.
27
Black Rot
Black Rot is a disease caused by the fungus Guignardia bidwelli. It
overwinters in in old mummified berries. In spring, the primary inoculum is released which starts the initial round of infection. Those initial
spores are dispersed by rain and wind. After the initial infection period, secondary infections are spread by rain splash.
This model predicts infection periods of Black Rot based upon the
Spotts model (Spotts 1977)
The Black Rot model requires air temperature and leaf wetness
data.
For information concerning the Select Report, Where and When and
Forecast screens, please refer to the tools section of the SpecWare
Software Users Guide.
On the Options screen, specify the Wetness Threshold or the point
on the scale the operator wishes to consider the leaf to be wet (the
scale is 0-15). A typical threshold is 6.
28
Black Rot (continued)
This model uses temperature and leaf wetness period to estimate
the onset of an infection period. The temperature is compared with
the period of leaf wetness needed to produce an observable infection.
If the wetness period exceeds the required period for that temperature,
the period is given an infection flag/ warning.
An unusual aspect of the model is the “risk factor.” The models were
originally designed to determine the risk of infection at a constant temperature for a certain period of leaf wetness. However, in the field,
temperature is rarely constant. Unfortunately, there is no data on this
subject and shifts in temperature create a situation where an infection
interval is not flagged because the average temperature was too low
while the actual temperature during a portion of the wetness period
was sufficient for an infection. A tool for assessing the temperature
shifts during a wetness period is the “risk” rating. Basically, if the
model is run on a 15 minute interval, the risk of infection at that point is
calculated. For example, if at a certain temperature, 8 hours of wetness are required and it is wet at that temperature for 1 hour, the risk
is 1/8. If the sum of the risks is 1 or greater, there has been, in all likelihood, an infection period and the period is flagged as such. This approach is more conservative than constant temperature since it may
include borderline events.
The View option gives a report of the temperature, leaf wetness, infection flag/ warning, and the risk factor.
29
Downy Mildew
Downy Mildew is caused by the pathogen Plasmapora viticola. The
pathogen overwinters in dead leaves and sometimes in dead berries
and shoots. The initial inoculum or liberated spores are splash dispersed.
After the initial round of infection, a secondary cycle of
spores is started which are splash or wind dispersed. Once a secondary spore lands on a leaf (or twig or grape cluster), it can germinate
in a short period of time if a thin film of water is present. Depending on
humidity and temperature, the infection takes 5 to 18 days to develop
new inoculum. An understanding of the wetness periods when infection might occur will help in the proper timing of fungicide applications.
This model notes when primary infection could occur and when secondary infection is possible. The model is based on Cornell University,
UC-Davis, and University of Illinois spray recommendations.
The Downy Mildew model requires leaf wetness, RH, and temperature data to calculate the appearance of spores after the initial infection. For information concerning the Select Report, Where and When
and Forecast screens, please refer to the tools section of the
SpecWare Software Users Guide.
30
Downy Mildew (continued)
On the Options screen, specify the leaf Wetness Threshold. A typical setting is 6. The sensor range is from 0-15. This is a relative scale
so no value is attached to the reading.
The model estimates three levels of infection likelihood. The grower
can determine which level is appropriate for his/ her operation. In general, the IPM program usually begins when the minimum risk level is
achieved.
The risk is measured on a scale of 1 to 3. Level 1, or Possible Infection, means that an infection can occur but conditions (or at least 1
condition) are not optimal. Thus, the infection could be lighter or the
risk is the lowest possible while still having a chance of infection.
Level 2 represents Medium Risk of Infection. Level 3, or High Risk
of Infection, means that conditions are optimal for infection. Individual growers can assess which level of risk meets their vineyard’s management needs.
The model begins at any point above 43ºF. The primary infection
starts at that point. From then on, the model estimates the risk of infection from secondary inoculum resulting from the primary infection.
31
Powdery Mildew - Grape
SpecWare predicts two infectious stages, an ascospore stage and a
conidial stage. (Thomas, Gubler, and Leavitt 1994; Weber, Gubler,
and Derr 1996) Ascospores are released in the spring from the
structure in which the disease overwintered. Conidial spores are the
result of an ascospore infection. Ascospores cause primary infections
and conidial spores cause secondary infections.
Your State
Agricultural Extension Service can advise you about which stage is
important in your area
The Powdery Mildew models require air temperature and leaf
wetness data.
For information concerning the Select Report and Where and When
screens, please refer to the Tools section of the SpecWare Software
Users Guide. The ability to Forecast weather data is not available for
Powdery Mildew.
On the Options screen, specify the Temperature Base, Upper Limit
and leaf Wetness Threshold.
32
Powdery Mildew - Grape (continued)
On the View Report screen, Ascospore Infection risk is determined
using the daily average temperature and the hours of leaf wetness. A
modified Mills Table (2/3 the original Mills leaf wetness value) is used
to determine the development of a ‘Heavy’ Ascospore Infection, the
point at which treatment should begin.
Three consecutive days with temperatures between 70°F and 85°F are
required to initiate the Conidial Index.
Thereafter, the index
increases by 20 with each day having six hours between 70°F and
85°F. The index decreases by 10 on days with less than six hours in
the range of 70°F to 85°F and on days with a maximum temperature
greater than 95°F. The index will always be between zero and 100.
Conidial Index:
0 - 30 = Light infection risk
40 - 50 = Medium infection risk
60 - 100 = Heavy infection risk
33
Phomopsis Cane Leaf Spot - Grape
SpecWare has one model for Phomopsis Cane Leaf Spot. (Nita et al.
2006) It shows the risk of this disease as tested on two different
varieties, Catawba and Seyval. Based on weather parameters,
SpecWare will calculate the risk as expected number of lesions per
leaf.
1 – 30 = light infection risk
31 – 90 = medium infection risk
90 + = heavy infection risk
The Phomopsis Cane Leaf Spot model requires air temperature,
leaf wetness, and rain data.
For information concerning the Select Report and Where and When
screens, please refer to the Tools section of the SpecWare Software
Users Guide.
34
Botrytis-Grape
The disease Botrytis is caused by the pathogen Botrytis cinerea. The
pathogen is spread in the air and infects primarily post veraison berries and flowers. The disease develops best in cool humid weather.
It appears as gray, cottony structures on the infected plant parts.
The Botrytis model requires air temperature and leaf wetness data.
For information concerning the Select Report, Where and When and
Forecast screens, please refer to the tools section of the SpecWare
Software Users Guide. There are no Options to be entered for Botrytis.
The model is based on work done at the University of California at
Davis. The model is adjusted for temperature and does not calculate
values for temperatures greater than 40C. UC-Davis recommends
taking action at an index of 0.5 or above.
There are three levels of infection risk; light, moderate and high. The
user can decide what risk level is acceptable for economic control.
The View option gives a report of the temperature, leaf wetness, infection flag/ warning, and the risk factor.
35
Disease Model References
Bolkan, M. A. and W. R. Reinert. (1994). Developing and Implementing IPM
Strategies to Assist Farmers: An Industry Approach. Plant Disease, 78:545-550.
Broome, J. C., et al. (1995). Development of an Infection Model for Botrytis Bunch
Rot of Grapes Based on Wetness Duration and Temperature. Phytopathology
85: 97-102.
Gadoury, D. M., R. C. Seem, and A. Stensvand. (1994). N.Y. Fruit Quarterly, 2[4]:58.
Gruber et al. (1999). UC IPM: UC Management Guidelines for Downey Mildew on
Grape. http://www.ipm.ucdavis.edu/PMG/r302101111.html (2002-Dec-16).
Hall, R. (1984). Relationship Between Weather Factors and Dollar Spot of Creeping
Bentgrass. Canadian Journal or Plant Science, 64:167-174.
Jones, A. L., et al. (1980). A Microcomputer-based Instrument to Predict Primary
Apple Scab Infection Periods. Plant Disease. 64:69-72.
Jones, A.L, and Sutton. T.B. (2001). Diseases of Tree Fruits of the East. Michigan
State University Extension, 19-20; 57-60.
Krause, R. A., L. B. Massie, and R. A. Hyre. (1975). Blitecast, a Computerized
Forecast of Potato Late Blight. Plant Disease Reporter, 59:95-98.
Mills, S. G. and J. D. Rothwell. (1982). Predicting Diseases - the Hygrothermograph.
Greenmaster, 18(4):14.
Mills, W. D. (1944). Efficient Use of Sulfur Dusts and Sprays During Rain to Control
Apple Scab. N.Y. Agriculture Experiment Station Ithaca Extension Bulletin 630.
Nita, M et al. (2006). Evaluation of a Disease Warning System for Phomopsis Cane
and Leaf Spot of Grape. Plant Disease, 90:1239-1246.
Nutter, F. W., H. Cole, and R. D. Schein. (1983). Disease Forecasting System for
Warm Weather Pythium Blight of Turfgrass. Plant Disease, 67:1126.
Pitblado, R.E. (1985). A Weather-timed Fungicides Spray Program for Field
Tomatoes in Ontario. TOM-CAST, The Model. Ridgetown College of Agricultural
Technology. Ridgetown, ON.
Ries, S. M., (1996). RPD 705 Downy Mildew of Grape. http://www.aces.uiuc.edu/
ipm/fruits/rpds/705/705.html (2002-Dec-16).
Schumann, G. L., et al. (1994). Use of Environmental Parameters and
Immunoassays to Predict Rhizoctonia Blight and Schedule Fungicide
Applications on Creeping Bentgrass. Crop Protection, 13:211-218.
Schwarz, M. R. and R.C. Pearson. (1984). Grape IPM Disease Identification Sheet
No. 5. http://www.nysipm.cornell.edu/factsheets/grapes/diseases/
downy_mildew.pdf (2002-Dec-16).
Smith, T. J. (1993). A Predictive Model for Forecasting Fire Blight of Pear and Apple
in Washington State. Acta Horiculturae, 338:153-157.
Spotts, R. A., (1977). Effect of Leaf Wetness Duration and Temperature on the
Infectivity of Guignardia Bidwelli on Grape Leaves. Phytopathology 67:13781381.
36
Steiner, P. W. and G. W. Lightner. (1996). MaryblytTM 4.3. A Predictive Program for
Forecasting Fire Blight Disease in Apples and Pears. University of Maryland.
College Park, MD.
Stevenson, W. R., et al. (1996). Integrated Pest Management - Professional
Software For Agricultural Systems. Version 1.31.06. University of
Wisconsin Integrated Pest Management Program. 116
Thomas, C. S., W. D. Gubler, and G. Leavitt. (1994). Field Testing of a Powdery
Mildew Disease Forecast Model on Grapes in California. Phytopathology,
84:1070 (abstract)
Weber, E., D. Gubler, and A. Derr. (1996). Powdery Mildew Controlled with Fewer
Fungicide Applications. Practical Winery & Vineyard, January/February.
37
Insect Models
SpecWare uses degree days to predict specific events in the life
cycles of pest insects. Pages 40 through 42 of this manual contain a
list of the publications that describe each Insect Model in significant
detail. For information concerning the Where and When and
Forecast screens, please refer to the Tools section of the SpecWare
Software Users Guide.
To build a list of crop-specific insects to monitor through the growing
season, highlight [New Group] on the Select Insects screen in the
left-hand window. As the Available Insects are chosen in the middle
window, the citation for that insect model is shown in the text box
below the list of insects. Also in the text box is information concerning
where the model was developed and on what host plant it was
developed. Click the Add button to include the model in the Group.
The maximum number of insect models that can be chosen for each
group is twenty. Clicking on a Selected Insect in the right-hand
window will again display the citation for that model. Highlight and
click the Remove button to delete an insect from the Group. After
adding or deleting insects in a Group, click on Save Group.
38
Insect Models (continued)
NOTE: To remove a previously saved Group from the Select Insects
screen, use the Remove button to remove all of the insect models
from the Group and then exit Insect Models. Upon re-launching
Insect Models, the Group will no longer be present.
Choosing an Insect Group on the Select Insects screen and then
going to the Model Detail screen allows the user to enter separate
Event and Spray Dates for each insect at each logger location. A
drop-down menu at the top of the screen lists each of the insects in
the chosen Group. The left-hand and lower text boxes display the
degree day targets for each Event and supporting information for each
insect model in the Group. Highlight the Event or Biofix in the lefthand box and enter the Event Date in the right-hand box. Click Set
Event Date to record the date. Highlighting Biofix/Start and entering
a date will cause all subsequent Events to be calculated using that
date as a starting point. To mark Spray Dates in the reports, enter the
date in the right-hand box and click Set Spray Date.
39
Insect Models (continued)
IMPORTANT: It is possible to have multiple generations of a
particular insect per year.
As the season progresses, not all
generations will develop at the same rate. This is due to differences in
food quality and in parameters such as relative humidity. Therefore,
no attempt was made to extrapolate data from a model published for a
single generation to include second and third generations. However,
based on the user’s personal observations of insect activity as the
season progresses, events in subsequent generations can be
approximated by updating the Biofix Date on the Model Details
screen.
The Report by Insect screen lists the insects in the chosen Group
and their associated Events. For each individual insect model, the
first two columns display the Predicted degree day accumulations and
the range of those degree day predictions for each event. The third
and fourth columns show the Computed degree day accumulations
that have been associated with a particular event and the Date of
occurrence. For Events that have yet to occur, the Percent amount of
the target degree days that have been met is shown. The fifth column
displays the Event.
40
Insect Models (continued)
The Report by Date screen displays the modeled insects and their
associated events in the sequence in which those events occurred.
The Date and the daily High and Low temperatures are shown to the
left of the columns of accumulated degree day data. If Spray Dates
have been entered on the Model Details screen, they are also
displayed on the Report by Date screen.
For both the Report by Insect and the Report by Date screens, the
heading in the upper text box displays the logger Location and
Process Dates. Pertinent information for each model is shown at the
bottom of the lower text box.
NOTE: If the upper limit for the temperature range for degree day
calculations is displayed as zero (0), the published model did not
specify an upper temperature limit and none was assumed.
41
Insect Model References
Aliniazee, M. T. (1976). Thermal Unit Requirements for Determining Adult Emergence of
The Western Cherry Fruit Fly (Diptera: Tephritidae) In the Willamette Valley of
Oregon. Environ. Ent., 5: 397-402.
Aliniazee, M. T. (1979). A Computerized Phenology Model for Predicting Biological
Events of Rhagoletis indifferens (Diptera: Tephritidae). Can. Ent., 111: 1101-1109
Bethell, R. S. (1978). Pear Pest Management. U.C. Div. Agr. Sci. Publ. #4086. pp. 2241.
Bettiga, L. J., H. Kido, And N. F. Mccalley. 1992. Orange Tortrix. IN: Grape Pest
Management. 2nd. Edition. U.C. Div. Agr. Sci. Publ. #4105
Bimboni, H. G. (1970). The Relation of Variation in Temperature to the Rate of
Development of Immature Stages of California Red Scale, Aonidiella aurantii
(Maskell), on Citrus. Masters Thesis, Department Of Entomology, University Of
California, Riverside.
Brunner, J. F. And R. E. Rice. (1984). Peach Twig Borer, Anarsia Lineatella Zeller
(Lepidoptera: Gelechiidae), Development in Washington and California. Environ.
Entomol.,13: 607-610
Charmillot, P-J. R. Vallier and S. Tagini-Rosset. (1979). Plum Fruit Moth (Grapholitha
Funebrana Tr.): Study of The Life Cycle in Relation to the Sums of Temperature
and Considerations on the Activity of the Adult Moths. Bulletin de la Societe
Entomologique Suisse 52: 19-33
Chmiel, S. M. and M. Curtis Wilson. (1979). Estimation of the Lower and Upper
Developmental Threshold Temperatures and Duration of the Nymphal Stages of the
Meadow Spittlebug, Philaenus Spumarius. Environ. Entomol., 8: 682-685
Croft, B. A., M. F. Michels, and R. E. Rice. (1980). Validation of a PETE Timing Model
for the Oriental Fruit Moth in Michigan and Central California (Lepidoptera:
Olethreutidae). Great Lakes Entomol., 13: 211-217
Engle, C. E. and M. M. Barnes. (1983). Developmental Threshold Temperature and
Heat Unit Accumulation Required for Egg Hatch of Navel Orangeworm
(Lepidoptera: Pyralidae). Environ. Entomol., 12: 1215-1217
Grout, T. G., W. J. Dutoit, J. H. Hofmeyr, and G. I. Richards. (1989). California Red
Scale (Homoptera: Diaspididae) Phenology on Citrus in South Africa. J. Econ.
Entomol., 82: 793-798
Hartstack, A. W., Jr., J. P. Hollingsworth, R. L. Ridgeway, and J. D. Lopez. (1976).
MOTHZV-2: A Computer Simulation of Heliothis Zea and Virescens Population
Dynamics. User Manual. 1976. U.S.D.A. ARS-S-127
Horton, D. R., B. S. Higbee, T. R. Unruh, and P. H. Westigard. (1992). Spatial
Characteristics and Effects of Fall Density an Weather on Overwintering Loss of
Pear Psylla (Homoptera: Psyllidae). Environ. Entomol., 21: 1319-1332
Integrated Pest Management for Apples and Pears. University of California Statewide
Integrated Pest Management Project. Div. Agr. Sci. Publ. #3340
Integrated Pest Management for Walnuts. University of California Statewide Integrated
Pest Management Project. Div. Agr. Sci. Publ. #3270. pp. 36-41
42
Johnson, D. T. and R. L. Mayes. (1983). Studies of Larval Development and Adult Flight
of the Peachtree Borer, Synanthedon Exitiosa (Say) in Arkansas. J. Georgia
Entomol. Soc., 19: 216-223
Jones, V. P., D. G. Alston, J. F. Brunner, D. W. Davis, and M. D. Shelton. (1991).
Phenology of the Western Cherry Fruit Fly (Diptera: Tephritidae) in Utah and
Washington. Ann. Entomol. Soc. Am., 84: 488-492
Jones, V. P., D. W. Davis, S. L. Smith, and D. B. Allred. (1989). Phenology of Apple
Maggot, Rhagoletis Pomonella (Diptera: Tephritidae) Associated with Cherry and
Hawthorn in Utah. J. Econ. Entomol., 82: 788-782
Jones, V. P., S. L. Smith, and D. W. Davis. (1990). Comparing Apple Maggot Adult
Phenology in Eastern and Western North America. IN: Dowell, R. V., L. T. Wilson,
And V. P. Jones (Eds), Apple Maggot in the West, History, Biology and Control.
University of California Division of Agriculture and Natural Resources. Publication
#3341
Jorgensen, C. D., R. E. Rice, S. C. Hoyt, and P. H. Westigard. (1981). Phenology of the
San Jose Scale (Homoptera: Diaspididae). Can. Ent., 113: 149-159
Judd, G. J. R., M. G. T. Gardner, and D. R. Thomson. (1993). Temperature-Dependent
Development and Prediction of Hatch of Overwintered Eggs of the Fruit tree
Leafroller, Archips Argyrospilus (Walker) (Lepidoptera: Tortricidae). Can. Entomol.,
125: 945-956
Kain D. and A. Agnello. (2000). Insects, Update on Pest Management and Crop
Development. Scaffolds Fruit Journal, Sept. 18, 2000. Vol. 9 No. 27.
Laing, J. E. and J. M. Heraty. (1984). The Use of Degree-Days to Predict Emergence of
the Apple Maggot, Rhagoletis Pomonella (Diptera: Tephritidae), in Ontario. Can.
Ent., 116: 1123-1129
Lin, S. Y. H. and J. T. Trumble. (1985). Influence of Temperature and Tomato Maturity
on Development and Survival of Keiferia Lycopersicella (Lepidoptera: Gelechiidae).
Environ. Entomol., 14: 855-858
Osborne, L. S. (1982). Temperature-Dependent Development of Greenhouse Whitefly
and Its Parasite, Encarsia Formosa. Environ. Entomol., 11: 483-485
Peach Twig Borer. IN: Integrated Pest Management For Almonds. University of
California Statewide IPM Project. Div. Agr. Sci. Publ. #3308
Pickel, C., N. C. Welch, and D. B. Walsh. (1990). Timing Lygus Sprays Using DegreeDays in Central Coast Strawberries. Santa Cruz County Agricultural Extension
Publication
Pickel, C.P., R. S. Bethell, and W. W. Coates. (1986). Codling Moth Management Using
Degree-Days. University Of California Statewide IPM Project. Publication #4.
Pinhassi, N., D. Nestel, and D. Rosen. (1996). Oviposition and Emergence Of Olive
Scale (Homoptera: Diaspididae) Crawlers: Regional Degree-Day Forecasting
Model. Environ. Entomol., 25:1-6
Pitcairn, M. J., F. G. Zalom, and R. E. Rice. (1992). Degree-Day Forecasting of
Generation Time of Cydia Pomonella (Lepidoptera: Tortricidae) Populations in
California. Environ. Entomol., 21: 441-446.
Reissig, W. H., J. Barnard, R. W. Weires, E. H. Glass and R. W. Dean. (1979).
Prediction of Apple Maggot Fly Emergence from Thermal Unit Accumulation.
43
Environ. Entomol., 8: 51-54
Rice, R. E., C. V. Weakley, and R. A. Jones. (1984). Using Degree-Days to Determine
Optimum Spray Timing for the Oriental Fruit Moth (Lepidoptera: Tortricidae). J.
Econ. Entomol., 77: 698-700
Rice, R. E., F. G. Zalom, and C. Jorgensen. (1982). Monitoring San Jose Scale
Development with Degree-days. California Agri. Sci. Leaflet #21312
Rice, R. E., F. G. Zalom, and J. F. Brunner. (1982). Monitoring Peach Twig Borer
Development with Degree-days. U.C. Div. Agri. Pub. #21302
Rice, R. E., F. G. Zalom, and J. F. Brunner. (1982). Using Degree-days in a Peach Twig
Borer Monitoring Program. Almond Facts, March/April 1982: 60-62
Rock, G. C., R. E. Stinner, J. E. Bacheler, L. A. Hull, and H. W. Hogmire. (1993).
Predicting Geographical and Within-Season Variation in Male Flights of Four Fruit
Pests. Environ. Entomol., 22: 716-725
Roltsch, W. J., M. A. Mayse. (1993). Simulation Phenology Model for the Western
Grapeleaf Skeletonizer (Lepidoptera: Zygaenidae): Development and Adult
Population Validation. Environ. Entomol., 22: 577-586
Sanderson, J. P., M. M. Barnes, and W. S. Seaman. (1989). Synthesis and Validation of
a Degree-Day Model for Navel Orangeworm (Lepidoptera: Pyralidae) Development
in California Almond Orchards. Environ. Entomol., 18: 612-617
Seaman, W. S. and M. M. Barnes. (1984). Thermal Summation for the Development of
the Navel Orangeworm in Almond (Lepidoptera: Pyralidae). Environ. Entomol., 13:
81-85
Sevacherian, V., V. M. Stern, and A. J. Mueller. (1977). Heat Accumulation for Timing
Lygus Control Measures in a Safflower-Cotton Complex. J. Econ. Entomol., 70:
399-402
Tassan, R. L., K. S. Hagen, A. Cheng, T. K. Palmer, G. Feliciano and T. L. Bough.
(1982). Mediterranean Fruit Fly Life Cycle Estimations For The California
Eradication Program. CEC/IOBC Symposium Athens November 1982. 564-570
Tolley, M. P. and W. H. Robinson. (1986). Seasonal Abundance and Degree-Day
Prediction of Sod Webworm (Lepidoptera: Pyralidae) Adult Emergence in Virginia.
J. Econ. Entomol., 79: 400-404
UC IPM Pest Management Guidelines: Peach and Nectarine. UC DANR Publication
3339
Weakley, C. V., F. G. Zalom, and R. E. Rice. (1984). Monitoring Oriental Fruit Moth
Development with Degree-Days. U. C. Div. Agr. Sci. Publ. #7157
Williams, D. W. (1984). Ecology of the Blackberry-Leafhopper-Parasite System and its
Relevance to California Grape Agroecosystems. Hilgardia, 52: 1-32
Yu, D. S. and R. F. Luck. (1988). Temperature-Dependent Size and Development of
California Red Scale (Homoptera: Diaspididae) and its Effect on Host Availability for
the Ectoparasitoid, Aphytis Melinus Debach (Hymenoptera: Aphelinidae). Environ.
Entomol., 17: 154-161
Zajac, M. A., F. R. Hall, and M. Curtis Wilson. (1989). Heat Unit Model for the
Development of Meadow Spittlebug (Homoptera: Ceropidae) on Strawberry.
Environ. Entomol., 18: 347-350
Zalom, F. G., W. W. Barnett, R. E. Rice, and C. V. Weakley. (1992). Factors Associated
With Flight Patterns of the Peach Twig Borer (Lepidoptera: Gelechiidae) Observed
44
Software License Agreement
Spectrum Technologies retains certain rights regarding the use of this
software. Please refer to the Software License Agreement in the
SpecWareTM 9 Pro for Windows, Software User’s Guide.
3600 Thayer Court
Aurora IL 60504
(800) 248-8873 or (815) 436-4440
Fax (815) 436-4460
Rev. 07/2013