1
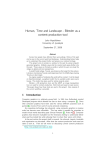
United States
Department of
Agriculture
Forest Service
Forest
Products
Laboratory
General
Technical
Report
FPL–GTR–160
In cooperation
with the
United States
Department of
Transportation
Federal
Highway
Administration
Condition Assessment
of Timber Bridges
2. Evaluation of Several Stress-Wave
Tools
Brian K. Brashaw
Robert J. Vatalaro
James P. Wacker
Robert J. Ross
Abstract
Contents
This study was conducted to evaluate the accuracy and
reliability of several stress-wave devices widely used for
locating deteriorated areas in timber bridge members.
Bridge components containing different levels of natural
decay were tested using various devices. The specimens
were then sawn (along their length) into slabs to expose
their interior condition. The interior faces of these slabs
were inspected visually and with a resistance micro-drill to
confirm if deterioration was present. On the basis of these
tests, we conclude that all four devices evaluated in this
study can successfully be used to evaluate decay. There
were, however, differences in the decay thresholds and userfriendliness among the devices.
Introduction ......................................................................... 1
Keywords: timber, bridge, inspection, stress wave,
ultrasonic, nondestructive
Objective ............................................................................. 1
Materials ............................................................................. 1
Methods............................................................................... 2
Stress-Wave Equipment Tested ...................................... 2
Data Collection with Stress-Wave Equipment ............... 3
Results and Discussion ....................................................... 4
Summary and Conclusions ................................................. 5
Literature Cited ................................................................... 6
Appendix—Additional Equipment Information ............... 10
Metriguard Model 239A Stress-Wave Timer .............. 10
Sylvatest Duo ............................................................... 10
Fakopp Microsecond Timer ......................................... 11
IML Electronic Hammer .............................................. 11
July 2005
Brashaw, Brian K.; Vatalaro, Robert J.; Wacker, James P.; Ross, Robert
J. 2005. Condition assessment of timber bridges: 2. Evaluation of several
stress-wave tools. Gen. Tech. Rep. FPL-GTR-160. Madison, WI: U.S.
Department of Agriculture, Forest Service, Forest Products Laboratory.
11 p.
A limited number of free copies of this publication are available to the
public from the Forest Products Laboratory, One Gifford Pinchot Drive,
Madison, WI 53726–2398. This publication is also available online at
www.fpl.fs.fed.us. Laboratory publications are sent to hundreds of libraries
in the United States and elsewhere.
The Forest Products Laboratory is maintained in cooperation with the University of Wisconsin. This article was written and prepared by U.S. Government employees on official time, and it is therefore in the public domain
and not subject to copyright.
The use of trade or firm names in this publication is for reader information
and does not imply endorsement by the United States Department of Agriculture (USDA) of any product or service.
The USDA prohibits discrimination in all its programs and activities on the
basis of race, color, national origin, sex, religion, age, disability, political
beliefs, sexual orientation, or marital or familial status. (Not all prohibited
bases apply to all programs.) Persons with disabilities who require alternative means for communication of program information (Braille, large print,
audiotape, etc.) should contact the USDA’s TARGET Center at (202) 720–
2600 (voice and TDD). To file a complaint of discrimination, write USDA,
Director, Office of Civil Rights, Room 326-W, Whitten Building, 1400
Independence Avenue, SW, Washington, DC 20250–9410, or call (202)
720–5964 (voice and TDD). USDA is an equal opportunity provider
and employer.
Condition Assessment of Timber Bridges
2. Evaluation of Several Stress-Wave Tools
Brian K. Brashaw, Program Director
Robert J. Vatalaro, Principal Research Shop Foreman
Natural Resources Research Institute
University of Minnesota Duluth, Duluth, Minnesota
James P. Wacker, Research General Engineer
Robert J. Ross, Project Leader
Forest Products Laboratory, Madison, Wisconsin
Introduction
Wood deterioration is one of the most common damage
mechanisms in timber bridge structures and often inflicts
damage internally. This may occur without visible signs
appearing on the surface until a member’s load-bearing
capacity has been largely destroyed. Determining an appropriate load rating for an existing timber bridge and establishing rational rehabilitation, repair, or replacement decisions
require an accurate assessment of the bridge’s existing condition. Knowledge of the condition of the bridge can lead to
savings in repair and replacement costs by minimizing labor
and materials and extending its life.
In timber bridge structures, the degradation of a loadbearing (in-service) member may be caused by any one of
several organisms that derive their nourishment or shelter
from the wood substrate in which they live. For example,
several types of fungi attack wood. The hyphae of these
fungi secrete enzymes that depolymerize the chemical components of wood, thereby lowering the density, strength, and
hardness of a member. This results in a significant reduction
in load-carrying capacity, which in turn may result in the
member’s failure.
Recently, we prepared a comprehensive manual on the
inspection of wood structural elements, Wood and Timber
Condition Assessment Manual (Ross and others 2004). It
was prepared at the request of the American Forest and
Paper Association to assist field engineers and other inspection professionals. Published by the Forest Products Society,
this manual includes chapters on visual inspection techniques, ultrasound- or stress-wave-based inspection tools,
probing-type techniques, and post-fire inspection and assessment, plus a sample inspection report and summaries from
several inspections. Detailed descriptions of the various
available tools, guidelines on their use, and interpretation of
data obtained from them are included.
As a consequence of our experience with various types of
inspection methods and equipment (Ross and others 1999),
the Federal Highway Administration asked us to conduct
a rigorous evaluation of the performance of several commercially available tools used to assess the condition of
in-service wood. The results of that effort are summarized in
a comprehensive report available through the University of
Minnesota Duluth (Brashaw and others 2004). We prepared
the following condensed report as a field guide for engineers
from the information generated in the Brashaw and others
(2004) study. This field guide focuses on our evaluation of
several widely used stress-wave-based pieces of equipment.
Objective
The objective of this study was to evaluate the accuracy
and reliability of several stress-wave devices for finding
internal deterioration in timber bridge components. This was
accomplished by testing several timber bridge components
obtained from various in-service structures. Each device
was also rated for ease of use as a bridge inspector’s tool.
Materials
The primary materials used for this project were bridge
timbers containing different levels of natural decay. These
timbers were obtained from several sources and had
been removed from service for various reasons. Timber
bridge girders, pilings, decking material, and railing components were obtained from the USDA Forest Service,
Chequamegon–Nicolet National Forest. The materials had
been remaining after construction of new bridges or had
been removed from service for replacement. In addition,
timber bridge girders, decking, and railing components were
obtained from the Oliver Bridge, a combination motorvehicle and railroad-timber-and-steel bridge located between
Duluth, Minnesota, and Superior, Wisconsin. This bridge
was being rebuilt by the owner, the Duluth and Missabe
National Railroad. Additional materials were obtained from
Michigan Technological University, Duluth Timber Recycling Company (Duluth, Minnesota) and Minnesota Power
(Duluth, Minnesota).
General Technical Report FPL–GTR–160
Figure 2—Metriguard 239A Stress-Wave Timer.
Figure 1—Stages of this study.
A total of 46 timber specimens were evaluated with the
various stress-wave devices. Thirty-six of the timber
specimens were sawn timbers and 10 were round timber
piles. The sawn timbers varied in size from 3 by 12 in.
(76 by 305 mm) to 20 by 20 in. (508 by 508 mm) and were
up to 99 in. (251 cm) long. The round timber piles were
9 to 18.75 in. (229 to 476 mm) in diameter and up to 143 in.
(363 cm) long. Thirty-eight (~83%) of the timber specimens
were Douglas-fir species. Other timber specimens included
western redcedar (4), southern yellow pine (2), and northern
white pine (3). Nearly two-thirds of the Douglas-fir specimens were creosote treated.
Methods
This study was accomplished in several different stages
(Fig. 1). Several types of data were collected on the timber
specimens in their original (unsawn) condition. First, the
timber specimens were tested to determine moisture content
and wood species. Second, the bridge timbers were visually inspected to locate deteriorated areas. Then stress-wave
measurements were collected at several locations on each
specimen. Last, micro-drilling resistance measurements
were collected from each of the timber bridge specimens.
Micro-drilling resistance results from this study are published in a companion report (Brashaw and others 2005).
After the timber specimens were sawn along their length
into slabs that exposed their interior condition, additional
data were collected. The sawn components obtained from
2
Figure 3—Sylvatest Duo.
the specimens were inspected visually to assess the extent
and locations of the decay or other degradation. We also
documented the sawn components with photographs.
Data from each timber bridge specimen were analyzed to
determine the effectiveness of various stress-wave equipment for locating degraded or decayed material. Graphs of
the data were prepared and used to develop indices of decay.
These two data sets were then compared to determine the
effectiveness of the various stress-wave equipment in detecting deterioration. Each specimen’s resistance chart was captured electronically by the equipment and was accompanied
by a photograph of the specimen after being cut apart. These
photographs revealed the representative quality of the specimen regarding its level of decay.
Stress-Wave Equipment Tested
Several types of commercially available stress-wave
equipment were used to assess decay in the timber bridge
Condition Assessment of Timber Bridges: 2. Evaluation of Several Stress-Wave Tools
Data Collection with Stress-Wave Equipment
The timber specimens were of various cross sections and
lengths; nonetheless, similar data collection procedures
were used for all timber specimens. Figure 6 illustrates the
standard data collection grid where measurements were
obtained. Depending on the size of a specimen, we measured stress-wave transmission times along its length with
up to three lines (A, B, and C) on the side surfaces, with A,
the upper line; B, the middle line; and C, the lower line.
Figure 4—Fakopp Microsecond Timer.
Some of the specimens had only one or two measurement
lines. The measurement points in the longitudinal direction
started at 3 in. (76 mm) from the end with varying intervals from 3 in. (76 mm) for the first, to 6 in. (152 mm) for
the second, and then remained constant at 12 in. (305 mm)
along the remainder of the timber specimen. Each specimen’s data were graphed along the length of each
measurement line.
Each member was inspected with the following stress-wave
timing equipment:
• Metriguard 239A (Metriguard, Inc.; Pullman,
Washington, USA)
• Sylvatest Duo (Concept Bois Structure; Les
Ecorces, France)
• Fakopp Microsecond Timer (Fakopp Enterprise; Agfalva,
Hungary)
• IML Electronic Hammer (IML Inc., Kennesaw, Georgia,
USA)
Figure 5—IML Electronic Hammer.
specimens (Figs. 2–5). In general, each piece of equipment
induced a mechanical stress wave into a timber specimen by
a hammer or other means, which was detected with accelerometers at two points along the propagation path. The timer
started when the wave front arrived at the first accelerometer. The timer stopped when the wave front arrived at the
second accelerometer and displayed the propagation time
between accelerometers in microseconds. Additional information on equipment manufacturer, method of operation,
key considerations, specifications, and testing procedures is
provided in the Appendix.
Each piece of equipment was used in accordance with the
instructions provided in the user’s manual. All operators
became familiar with the manufacturer’s instructions and
recommendations. During testing, each piece of equipment
was evaluated to determine the accuracy and reliability of
the unit in determining the extent of decay and ease of use.
Metriguard 239A
Because we used a direct-contact measurement technique
with the Metriguard 239A, results can be variable if the
surface of the wood member is damaged. It is possible to
mount the start and stop accelerometers to lag bolts for
increased consistency, although that was not done during
this study.
Sylvatest Duo
We used two techniques with the Sylvatest Duo during the
inspection of timber bridge components: for the first set
Figure 6—Typical stress-wave testing locations used for each timber bridge specimen.
3
General Technical Report FPL–GTR–160
IML Electronic Hammer
Several timbers were scanned using the IML Electronic
Hammer, which was effective in identifying decay in the
timber specimens evaluated during the project. We discontinued using this equipment after three timbers, however,
because of the time-consuming process required to obtain
measurements. Further information on the IML Electronic
Hammer is in the Appendix.
Figure 7—Portable band saw cutting timbers lengthwise along measurement lines.
of measurements, we placed the probes in direct contact
with the member, and for the second set, we drilled a small
contact hole and placed the probes into the hole. Both
techniques were effective in locating severe decay in wood
members, but the direct-contact technique resulted in more
variability in measurements, especially for those members
with no or low levels of decay. We recommend that only
experienced operators use the probes through direct contact
when the shell condition of the member is good. If the shell
is damaged, we recommend placing the probes in predrilledcontact holes. The Sylvatest Duo also determines the peak
energy received during testing. This information should only
be used if the data are collected using the predrilled-contact
holes method.
Fakopp Microsecond Timer
This unit has its transducers mounted directly to metal
spikes, which provide intimate contact points when hand
pressed into the timber test specimens.
Following stress-wave testing, each timber was cut into
slices using a portable band saw (Fig. 7). Each timber specimen was cut along the measurement lines A, B,
and C along the length of the piece. Each section was then
laid out so that the interior faces of each measurement line
were revealed and could be documented through digital
pictures. Figure 8 demonstrates how the sawn samples were
typically laid out for visual assessment and documentation.
The top board corresponds with data collected along measurement line A. The bottom board corresponds with data
collected along measurement line B.
Results and Discussion
Each specimen’s stress-wave transmission time data are
compared with photographs of the specimen after being cut
apart. Results for all 46 specimens tested with the various
stress-wave timing equipment are reported in Brashaw and
others (2004). Results from three representative specimens,
each having different stages of deterioration, are described
as follows.
Figure 9 illustrates results obtained from a specimen with
areas of severe, moderate, and no (sound wood) deterioration. All stress-wave transmission times were within the
severe deterioration zone for a majority of the points along
line C. Stress-wave transmission times along line B were
mostly in the moderate decay zone by Sylvatest, whereas
Metriguard and Fakopp detected severe deterioration at
many test locations. Transmission times along line A
Figure 8—Typical layout of sawn timber specimens for photograph documentation.
4
Condition Assessment of Timber Bridges: 2. Evaluation of Several Stress-Wave Tools
Table 1—Comparison ratings for stress-wave equipmenta evaluated
Metriguard 239A
Sylvatest Duob
Fakopp
Accuracy
Good
Good
Good
Reliability
Good
Good
Good
Variability
Ease of use
Medium
Better
Low
Good
Low
Best
Size
Display
Large
Easy to see
Small
Difficult to see
Small
Easy to see
Key consideration
Accelerometers must be orientated
properly
Probes are placed in pre-drilled
contact holes
Spike-mounted transducers
provide good contact
aIML
Electronic Hammer not included; see additional comments in Appendix.
upon placing probes in small contact holes, direct-contact method not recommended.
bBased
Table 2—Stress-wave transmission times perpendicular to the grain for various levels of degradation using
the Metriguard 239A
Stress-wave transmission time (μs/ft)a
Species
Douglas-fir
Western
redcedar
Southern
yellow pine
White pine
Sound
wood
Moderate
decay
Severe
decay
Splits
130–400
200–500
400–600
600–800
600+
800+
400–700
600–1100
250–400
NR
NR
NR
280–400
NR
700+
NR
aNR,
no results to report. Because of limited numbers of southern yellow and white pine samples, not all decay levels were
present to report.
revealed mostly sound wood or slightly moderate decay
except for the stress-wave trasmission time at 96 in.
(244 cm), which was within the severe decay zone by all
stress-wave devices. Figure 10 illustrates results obtained
from a specimen that showed mostly sound wood with a
pocket of moderate–severe deterioration at approximately
60 in. (241 mm) from the specimen end after being cut
open. Nearly all measured stress-wave transmission times
were within the sound to slightly moderate decay zones.
However, the stress-wave transmission time measured at 60
in. (241 mm) was in the severe to slightly moderate decay
zone for the Sylvatest device, whereas it was in the severe
decay zone for the Metriguard and Fakopp devices. Figure
11 illustrates results obtained from a specimen that showed
sound wood, with no deterioration after being cut open. All
stress-wave transmission times for Lines A, B, and C were
within the sound wood zone using all stress-wave devices.
However, stress-wave transmission times measured with
the Metriguard device along Line A were slightly higher and
were in the proximity of the moderate decay threshold level.
Results on comparative performance characteristics such
as accuracy, reliability, and ease of use in detecting
internal decay in the bridge timber specimens are summarized in Table 1. Our operators learned how to use
each piece of equipment tested in less than one day. The
operator’s manual and manufacturer’s website provide good
information on use of the equipment and interpretation of
the testing results. Regardless of the unit used, the user must
be careful to differentiate the presence of decay from internal splits, cracks, or ring shake in the timbers. We recommend that an increment corer or resistance drill be used to
confirm the exact levels and locations of decay.
Summary results from all timber bridge specimens tested are
also provided for each stress-wave unit by wood species and
deterioration level. The stress-wave (perpendicular to grain)
transmission times recorded with the Metriguard 239A are
listed in Table 2. The stress-wave (perpendicular to grain)
transmission times along with peak energy values recorded
with the Sylvatest Duo are listed in Table 3. The stress-wave
(perpendicular to grain) transmission times recorded with
the Fakopp Microsecond Timer are listed in Table 4.
Summary and Conclusions
The purpose of this study was to evaluate the effectiveness
of several pieces of commercial testing equipment for locating damaged or decayed timber bridge members. Further,
we evaluated the equipment for ease of use and effectiveness in analyzing and interpreting the test data. This was
completed for both individual timber members in a laboratory setting and on several field bridges. The following
conclusions were evident from the testing, analysis, and data
interpretation of the project:
• Stress-wave timing technologies can be used successfully
to detect the presence and level of internal decay for timber bridge components.
• Stress-wave timing measurements perpendicular to the
grain provide an excellent tool to assess the extent of
internal decay in timber bridge components. All the
equipment evaluated in this study can be used
5
General Technical Report FPL–GTR–160
Table 3—Stress-wave transmission times perpendicular to the grain and peak energy received for various levels of
degradation using the Sylvatest Duo
Stress-wave transmission timea (μs/ft)
Sound
wood
Moderate
decay
Severe
decay
Splits
Sound
wood
Moderate
decay
Severe
decay
Splits
Douglas-fir
Western
redcedar
Southern
yellow pine
160–600
300–400
400–600
400–700
700+
700+
300–600
300–700
—
—
—
—
—
—
—
—
400–600
NR
NR
NR
—
—
—
—
White pine
200–400
NR
700+
NR
—
—
—
—
Douglas-fir
Western
redcedar
130–250
210–320
300–450
450–650
600+
600–900
300–500
300–600
50–200
50–200
10–50
10–50
0–10
0–10
0–15
0–15
Southern
yellow pine
200–350
NR
NR
NR
50–200
NR
NR
NR
White pine
180–360
NR
650+
NR
50–200
NR
0–10
NR
Condition
Species
Undrilled
Drilled
Peak energy (mV) receivedb,c
aNR,
n
report.
bPeak energy values are reported on an actual width basis, not on a per foot basis. Large cross-section members may have low energy
received values.
cThis technique is not recommended in the undrilled condition.
Table 4—Stress-wave transmission times perpendicular to the grain for various levels of degradation using
the Fakopp Microsecond Timer
Stress-wave transmission time (μs/ft)a
Species
Douglas-fir
Western
redcedar
Southern
yellow pine
White pine
Sound
wood
Moderate
decay
Severe
decay
Splits
130–260
160–300
300–400
300–400
500+
500+
300–700
300–500
220–250
NR
NR
NR
230–325
NR
500+
NR
aNR,
no results to report. Because of limited numbers of southern yellow and white pine samples, not all decay levels were
present to report.
successfully to evaluate decay. There were, however, differences in the level of variability and the decay thresholds
for this equipment. Primary differences among the equipment were the level of contact between the accelerometers
and the wood component and the start and stop timer
thresholds used by the manufacturer. Specifically, when
used in an undrilled condition, the Sylvatest Duo showed
more variability, resulting in less certainty for the inspector. This was also true for the Metriguard 239A because
it uses a direct impact system. The Sylvatest Duo in the
drilled condition and the Fakopp Microsecond Timer
showed the least variability, and were the most effective at
clearly differentiating decay from sound wood.
• All stress-wave timing equipment evaluated during the
project was portable and relatively easy to use. Refer to
Table 1 for comparison ratings.
6
Any nondestructive testing tool or device must be used as
part of a comprehensive condition assessment that incorporates an in-depth visual inspection, knowledge of prior use
of the structure, and a working knowledge of fundamental
engineering properties of structural wood products. When
used with visual and probing techniques, this technique provides a very accurate description of the internal condition of
bridge timbers.
Literature Cited
Brashaw, B.K.; Vatalaro, R.J.; Erickson, J.R.; Forsman,
J.W.; Ross, R.J. 2004. Final Report: A Study of Technologies to Locate Decayed Timber Bridge Members. Project
No. 187-6456, NRRI/TR-2004-06. Duluth, MN: UMDuluth, NRRI. http://www.nrri.umn.edu/default/
Brashaw, Brian K.; Vatalaro, Robert J.; Wacker, James P.;
Ross, Robert J. 2005. Condition Assessment of Timber
Bridges: 1. Evaluation of a Micro-Drilling Resistance Tool.
Gen. Tech. Rep. FPL–GTR–159. Madison,WI: U.S.
Department of Agriculture, Forest Service, Forest Products
Laboratory. 8 p.
Ross, R.J.; Brashaw, B.K.; Wang, X.; White, R.H.; Pellerin,
R.F. 2004. Wood and Timber Condition Assessment Manual.
Madison, WI: Forest Products Society. 74 p.
Ross, R.J.; Pellerin, R.F.; Volny, N.; Salsig, W.; Falk, R.H.
1999. Inspection of Timber Bridges Using Stress-Wave
Timing Nondestructive Evaluation Tools—A Guide for Use
and Interpretation. Gen. Tech. Rep. FPL–GTR–114. Madison, WI: U.S. Department of Agriculture, Forest Service,
Forest Products Laboratory. 15p.
Condition Assessment of Timber Bridges: 2. Evaluation of Several Stress-Wave Tools
Line A
Line B
Line C
Figure 9—Comparison of stress-wave transmission plots and interior photographs of Douglas-fir
specimen 2-13-03-3 reveals areas of moderate and severe deterioration and sound wood.
7
General Technical Report FPL–GTR–160
Line A
Line B
Line C
Figure 10—Comparison of stress-wave transmission plots and interior photographs of Douglas-fir
specimen 2-11-03-5 reveals mostly sound wood with a pocket of moderate–severe deterioration at
approximately 60 in. (241 mm) from specimen end.
8
Condition Assessment of Timber Bridges: 2. Evaluation of Several Stress-Wave Tools
Line A
Line B
Line C
Figure 11—Comparison of stress-wave transmission plots and interior photographs of Douglas-fir specimen 12-10-02-1, reveals sound
wood throughout with no deterioration.
9
General Technical Report FPL–GTR–160
Appendix—Additional Equipment
Information
Metriguard Model 239A Stress-Wave Timer
Manufacturer
Metriguard, Inc.
Method of Operation
A mechanical stress wave is induced in a member by a
hammer or other means and is detected with accelerometers
at two points along the propagation path. The timer starts
when the wave front arrives at the first accelerometer. The
timer stops when the wave front arrives at the second
accelerometer and displays the propagation time between
accelerometers in microseconds.
Consideration
It is imperative that the accelerometers are oriented properly
when using this equipment.
Specifications
Power requirements: 9-V battery
Resolution: ±1 µs
Dimensions: 7 by 9 by 9 in. (18 by 23 by 23 cm)
Weight: 12 lb (5.4 kg) (including hammer and
accelerometers)
Test Procedure Summary
1. Connect lead from impact-end accelerometer to start
terminal.
2. Connect lead from receive-end accelerometer to stop
terminal.
3. Turn switch on.
4. Switch gain to a level close to but above the ambient
noise level. For each channel, rotate the gain selector
switch until the display trigger indicator dot for that channel does not come on from ambient noise. Gain settings
used in this testing were 1 for start and 20 for stop.
5. Place the start and stop accelerometers in positions that
are a straight line across the specimen. Impact the sample
and record the time of propagation for the stress
wave between the two accelerometers. The impact was
repeated three times to obtain an average reading for that
location.
6. Repeat process at intervals along the specimen.
10
Sylvatest Duo
Manufacturer
Concept Bois Structure
Method of Operation
The Sylvatest unit uses an ultrasonic pulse generator to
impart a stress wave into a member. Two transducers are
placed a fixed distance apart on a member. A transmitting
transducer imparts a wave into the member, and a receiving transmitter is triggered upon sensing of the wave. The
time it takes the wave to pass between the two transducers
is then coupled with various additional information, such as
wood species, path length, and geometry (round or square
section), to compute modulus of elasticity. A second set of
pulses is evaluated to determine the maximum energy of the
received wave.
Consideration
Use of pre-drilled contact holes is recommended for
improved accuracy and reliability.
Specifications
Power requirements: 9-V battery
Resolution: ±1 µs, ±1 millivolt (mV)
Dimension: 1.5 by 4 by 8 in. (38 by 102 by 203 mm)
Weight: 1.2 lb (0.5 kg) (instrument only), 3 lb (1.4 kg)
(instrument with carrying bag and accessories)
Test Procedure Summary
1. Connect probes to the main unit. This unit can be coupled
to the surfaces of the material being tested through direct
pressure or by drilling a 0.19-in.- (5-mm-) diameter
hole to a depth of 0.39 in. (1 cm) deep on each side of
the wood you want to measure. The operator may use
a conic-shape drill or awl for accuracy. Regardless of
whether a hole is drilled, a good contact point is necessary for accurate measurements. We recommend that a
drilled hole is used when the peak energy readings are of
interest.
2. Push the on key. Press any key to enter menu mode.
3. Select a mode by pressing + or – keys. Change values or
execute action by pressing ok.
4. During two series of faint clicks or pings, the transmission time and peak energy value will be displayed.
5. Continue sampling along entire timber and record data.
Condition Assessment of Timber Bridges: 2. Evaluation of Several Stress-Wave Tools
Fakopp Microsecond Timer
IML Electronic Hammer
Manufacturer
Fakopp Enterprise
Manufacturer
Instrument Mechanic Labor (IML), Inc.
Method of Operation
A mechanical stress wave is induced in a member by a hammer or other means into an accelerometer-instrumented
sharp probe that is inserted into the member. A similar probe
is inserted on the opposite side of the member. The timer
starts when the wave front arrives at the first accelerometer.
The timer stops when the wave front arrives at the second
accelerometer and displays the propagation time between
accelerometers in microseconds.
Method of Operation
A mechanical stress wave is induced in a member by striking an instrumented hammer into a lag bolt that is inserted
into the member. A similar lag bolt is inserted on the opposite side of the member. The timer starts when the lag bolt
is impacted. The timer stops when the wave front arrives at
the second accelerometer and displays the propagation time
between accelerometers in microseconds.
Specifications
Power requirements: Four AA batteries
Resolution: ±1 µs
Dimension: 1.8 by 3.2 by 5.9 in. (45 by 82 by 150 mm)
Weight: 0.8 lb (347 g)
Data output: RS-232 port
Test Procedure Summary
1. Connect the transducers to the timer box.
2. Switch on the timer at the side of the unit.
3. Press the reset button prior to repeating impact.
4. To use the auto reset feature, turn on the timer while holding the reset button down. This will result in continuously
updated readings after each impact.
5. The transducers are identical. Make sure that the one you
are going to “hit” is connected to the “start” connection.
6. Hit the start transducer with the hammer, making sure the
direction of the hit is parallel to the direction of the nail.
7. Never use a hammer heavier than 7 oz (200 g).
8. Continue measurements along specimen.
Specifications
Power requirements: 9-V battery
Resolution: ±1 µs
Dimension: 2 by 4 by 8 in. (5.1 by 10.2 by 20.3 cm)
Weight: 1.6 lb (0.7 kg)
Test Procedure Summary
1. Drill two starter holes in the side of the member being
tested.
2. Insert the lag bolts into the starter hole until they are about
½ in. (12.7 mm) deep.
3. Attach the transducers to each of the lag bolts.
4. Switch on the unit.
5. Take measurements.
General Comments
• The transducers are mounted on lag bolts, which results in
intimate contact with the member.
• The display window is easy to see.
• The unit is small and portable.
• The testing process is very slow. Lag bolts must be
inserted into the specimen, and then transducers must be
attached to the lag bolts. It took almost five times longer
to use this equipment than the other stress-wave timers
evaluated.
11