1
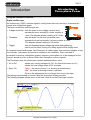
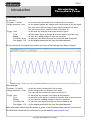
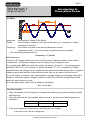
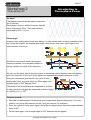
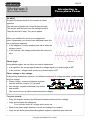
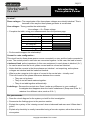
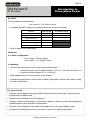
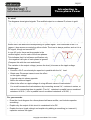
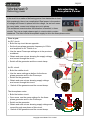
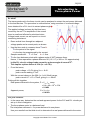
Page 2
Introduction to
Three-phase Power
Contents
Introduction
3
Worksheet 1
- Single-phase AC
8
Worksheet 2
- Three-phase AC
10
Worksheet 3
- Phase basics
12
Worksheet 4
- And now the phasor
14
Worksheet 5
- It’s a star
16
Worksheet 6
- On the delta
18
Worksheet 7
- Half-wave rectification
20
Worksheet 8
- Full-wave rectification
22
Worksheet 9
- Delivering power
24
Instructor Guide
Copyright 2014 Matrix TSL Limited
26
Page 3
Introduction to
Three-phase Power
Introduction
The hardware:
Digital
oscilloscope
Current
clamp
Three-phase
motor
Digital
multimeter
Three-phase
generator
The hardware:
Three-phase generator
•
converts single-phase AC mains into three phases. These can behave as three separate
sources of AC power, or can be linked as one source.
Three-phase motor
•
contains three independent sets of coils, each of which uses an AC supply to produce a
rotating magnetic field inside the motor. This creates torque which makes the motor’s rotor
rotate.
Digital oscilloscope
•
is used to study the AC signals involved in the three-phase systems;
•
can create image files that record these signals for later analysis, or as records of the
behaviour of the three-phase systems.
Current clamp
•
generates a voltage that reflects the size and direction of the AC current;
•
is connected to the digital oscilloscope, which displays voltage/time graphs, but cannot
display AC current directly.
Multimeter
•
measures voltage, current, resistance and a range of related quantities;
•
cannot ‘follow’ rapidly changing signals;
•
displays rms (root-mean-square) values of AC quantities usually.
Copyright 2014 Matrix TSL Limited
Page 4
Introduction
Introduction to
Three-phase Power
Using the hardware
Three-phase generator
• has controls that allow the user to adjust:
• signal amplitude, to 6V or 9V;
• signal frequency, to 0.1Hz (variable), 0.1Hz fixed, 1 Hz, 50Hz and 150Hz;
• has red, green and yellow sockets for the three phases, and blue for the neutral connection;
• can deliver currents up to 0.8A from each phase;
• has LEDs on each phase that indicate overloads or short-circuits.
Three-phase motor
• has three sets of coils, U, V and W, that use the three-phase signals
to produce rotating magnetic fields. Each creates four magnetic poles
(two ‘north’ and two ‘south’), and so it is known as a four-pole motor;
• has a squirrel-cage rotor in which currents are induced by the rotating
magnetic fields;
• can operate as a single-phase motor (see worksheet 4);
• has a stroboscopic disc to facilitate measurement of rotational speed.
Digital oscilloscope
• monitors signals, usually time-varying, and presents its results as a voltage / time graph.
• digital oscilloscopes use digital processing techniques to obtain the results.
(Any oscilloscope can be used for this course, though at times, it needs to monitor four
signals simultaneously. Further instructions on using the Picoscope are given later.)
Current clamp
• has a handle to open the jaws so they can be clamped around the wire carrying the current;
• can be used on AC and DC currents;
• produces an output voltage proportional to the current;
• has two ranges - 1mV/10mA and 1mV/100mA, allowing measurement up to 20A and 60A;
• has a switch to select the ranges (and on/off.)
Multimeter
• For voltage measurement:
plug probes into ‘V Ω Hz’ (or equivalent,) and ‘COM’;
• select the range, either AC or DC;
• connect the probes in parallel with the device under test.
• For current measurement:
• plug probes into ‘mA’ or ‘10A’ (or equivalent) and ‘COM’;
• select the range, either AC or DC;
• break the circuit just before or just after the device under test and connect the
probes to each end of the break;
• (No reading may mean that the internal fuse has ‘blown’.)
•
Copyright 2014 Matrix TSL Limited
Page 5
Introduction to
Three-phase Power
Introduction
Using the hardware continued...
Digital oscilloscope
An oscilloscope (‘CRO’) monitors signals, usually those that vary over time. It presents the
results as a voltage/time graph.
The basic controls on oscilloscopes are:
• Voltage sensitivity - sets the scale on the voltage (vertical) axis;
- spreads the trace vertically if a lower number is
used. The diagram shows a setting of 0.5 V/div.
• Timebase
- sets the scale on the time (horizontal) axis.
spreads the trace horizontally if a lower number is used.
The diagram shows a setting of 10 ms/div.
• Trigger
- sets the threshold signal voltage that starts data-gathering;
- can be set for either a rising or a falling signal at that voltage level.
A computer-based oscilloscope, like Picoscope, is a data-logger, that monitors voltages, at regular intervals, and passes the results to software in the computer. There, the data is
processed to produce voltage/time graphs, frequency information etc. to be displayed on the
monitor, stored as a file, or printed, like other information on the computer.
The Picoscope uses the oscilloscope controls described above, plus:
• AC or DC
- shows only varying voltages for ‘AC’ (so centres the trace on 0V;)
- shows the true voltage levels if DC is chosen.
• Stop / Go
- ‘Stop’ - the trace is ‘frozen’ (i.e. showing a stored event;)
- ‘Go’ - the trace is showing events in real-time;
- Click on the appropriate box to change from one to the other.
The settings are selected on-screen using the drop-down boxes provided.
The following diagram shows some of the main controls on the Picoscope 6 screen.
Copyright 2014 Matrix TSL Limited
Page 6
Introduction
Introduction to
Three-phase Power
Picoscope continued...
In this trace:
Timebase - 5 ms/div
Voltage sensitivity - auto
- so the time scale (horizontal axis) is marked off in 5 ms steps.
- so the software adjusts the voltage scale (vertical axis) to suit the signal.
The scale on the left-hand edge of the image increases in 2V steps.
The trace shown has a maximum value of around 8.7V.
Trigger - Auto
- so will show any changes in the signal as they happen.
- so looks at the signal on channel A to decide when to start the trace.
Ch A
Rising
- so waits for a rising voltage to reach the threshold;
Threshold - 0 mV - so starts the trace when the signal on channel A rises through 0V.
Pre-trigger - 0% - so the display starts with the very first data captured.
For the next trace, the signal is the same, but some of the settings have been changed.
New settings:
Timebase - 20 ms/div
- so the time scale is marked off in 20 ms steps.
Voltage sensitivity - 4V/div - so the voltage scale is marked off in 4V steps.
The trace still has a maximum value of around 8.7V.
Trigger - Auto
- so still shows any changes in the signal as they happen.
Ch A
- so still looks at the signal on channel A to decide when to start the trace.
Falling
- so now waits for a falling voltage to reach the threshold;
Threshold - 4V
- so starts the trace when the signal on channel A falls to 4V.
Pre-trigger - 0% - so the display starts with the very first data captured.
More information about using Picoscope is given in the Picoscope User manual, found on the
CD-ROM that comes with the instrument or on the website www.picotech.com.
Copyright 2014 Matrix TSL Limited
Page 7
Introduction
Delivering power
Introduction to
Three-phase Power
In elementary science and engineering courses, electrical power, P, is calculated using the
formula:
P=IxV
In DC circuits, there is no problem, but in AC circuits the current may not be in phase with
the voltage. In a capacitor and an inductor, for example, there is a phase angle of 900
between current and voltage. These devices dissipate no power, on average.
When charging, the capacitor stores energy in the electric field between its plates.
When it discharges, it returns that energy. Nett energy transfer - nil!
The inductor works in a similar way but with a magnetic field.
In resistors, on the other hand, voltage and current are in phase. When a current flows
through them, they warm up and dissipate energy. That energy is lost to the surroundings.
In AC circuits, then, we need to take this into account. This gives rise to three different
measures of electrical power:
Real power:
The only elements that actually dissipate power in a circuit are those having resistance, R.
This real (or true) power P, measured in watts (W), can be calculated using the formulae:
P = V2/R
P = I2R
Reactive power:
is the ‘imaginary’ power, Q, measured in units called volt-amp-reactive (VAR), delivered to
components with reactance, X, i.e. capacitors and inductors. It can be calculated using the
formulae:
Q = I2X
Q = V2 / X
Although apparently useless, as it delivers zero nett power to purely reactive loads, it still
flows through the circuit and so the cables etc. must be capable of handling it.
Apparent power:
Apparent power, S, measured in units called volt-amps (VA), is the total of real and reactive
power. In other words, it is the power that the AC supply seems to be delivering to the load,
of impedance Z. It can be calculated using the formulae:
S = I2Z
S = V2 / Z
or
S = Irms x Vrms
where Irms is the rms current delivered by the AC supply at a rms voltage of Vrms.
Power factor:
When a phasor diagram is produced for a circuit, (see worksheet 3), the
current flowing, I, may be out of phase with the voltage applied by the
source, V, by a phase angle φ. The term cos φ is known as the power factor.
The real power uses the component of the voltage that is in phase with the
current, leading to:
P = Vrms Irms cos φ
The reactive power involves the component of voltage that is 900 out of phase with the current and so:
Q = Vrms Irms sin φ
Power factor can be calculated from the relationship:
Power factor = true power / apparent power
Copyright 2014 Matrix TSL Limited
Page 8
Worksheet 1
Introduction to
Three-phase Power
Single-phase AC
‘Mains’ electricity is traditionally distributed as AC.
The reasons for this include:
• alternators that generate electricity at the power stations
are lighter, and cheaper than equivalent DC generators;
• transformers can be used to step the voltage up or down,
allowing efficient transmission of electrical power at high
voltage (and low current) over large distances.
Over to you:
This worksheet looks at aspects of single-phase AC, using the signal obtained from one
output of the three-phase generator, via sockets ‘Ph1’ and ‘N’.
•
Build the circuit shown opposite.
•
On the three-phase generator:
• set the frequency to 50Hz;
• set the amplitude to 6V;
• switch on.
Picoscope settings:
Timebase
5ms/div
Channel A
Auto
Channels B, C and D
Off
Trigger
Auto
Threshold
0V
Pre-trigger
0%
Obtain a trace showing the AC output and save it for your records.
Switch off the three-phase generator.
•
•
•
•
•
•
Now change the settings on the three-phase generator to:
• frequency
150Hz
• amplitude
9V.
Use Picoscope to obtain a new trace.
Save it for your records, with details of the new settings.
A challenge
Investigate the effect of changing the Picoscope settings.
Copyright 2014 Matrix TSL Limited
Page 9
Worksheet 1
Introduction to
Three-phase Power
Single-phase AC
So what?
Amplitude
Period
- the maximum voltage in the signal.
- the time taken to produce one cycle of the wave, (i.e. 1 peak plus 1 trough)
- measured in seconds.
Frequency - the number of cycles of the wave produced per second;
- measured in hertz. (1 Hz means one cycle produced every second.)
The relationship between them is:
Frequency = 1 / period
Delivering power:
At times, an AC supply delivers zero volts. At other times, it delivers higher or lower values.
A useless fact - the average voltage for an AC supply (any AC supply) is zero!
This certainly does NOT mean that AC supplies do nothing - far from it! - the average power
delivered is NOT zero. (For a resistor, R, power delivered = V2 / R, i.e. depends on voltage
squared! Hence, the voltage may be negative but the power delivered is still positive. A negative
voltage simply means that the current flows the other way, as you saw in the third circuit.)
For an AC supply, a measure more significant than average voltage is rms voltage. Although it
stands for ‘root-mean-square’ voltage, it is better to think of it as the DC voltage which would
deliver the same power to a load.
For a sine-wave signal, peak and rms voltage are linked by:
Vrms = 0.7 x Vpeak
For your records:
•
Copy the diagram of the AC signal, and explain the meaning of the terms amplitude, period
and frequency.
• Copy the table and use the measurements you took in the first part of theinvestigation to
complete it.
Amplitude in V
•
Period in s
Frequency in Hz
Copy and complete the statement by calculating the rms voltage:
In the first circuit, the rms voltage was …….
Copyright 2014 Matrix TSL Limited
Page 10
Worksheet 2
Introduction to
Three-phase Power
Three-phase AC
Electrical power is transmitted around the country using
a three-phase, rather than a single-phase system.
The advantages of three-phase include:
• less copper needed for the transmission cables;
• devices like motors are less affected by vibration
- power is delivered more smoothly;
• three-phase alternators are smaller and lighter than
equivalent single-phase versions;
• both three-phase and single-phase devices can be powered
from a three-phase supply, but the reverse is not true.
This worksheet looks at basic properties of three-phase power distribution.
Over to you:
The two investigations both look at why ‘three-phase’ is so called - the first at low frequency,
using lamps, the second at higher frequency with ‘Picoscope’.
•
Build the first circuit, using three 12V MES bulbs and holders.
• On the three-phase generator, set the frequency to 0.1Hz
(fixed), and the amplitude to 6V.
• Switch it on and observe the lamps. They are neither in step,
nor completely out of step, but reach maximum brightness at
different times.
The diagram that follows shows two ways to represent this circuit,
using different symbols for the three-phase generator.
•
•
•
Build the second circuit, connecting the three-phase generator to Picoscope, as shown.
Again, notice the ground clip connecting Picoscope ground to terminal ‘N’.
Picoscope settings:
Timebase
5ms/div
Channel A, B and C
Auto
Trigger
Auto
Threshold
0V
Pre-trigger
0%
Set the generator frequency to 50Hz, and amplitude to 6V and switch it on.
Obtain a trace showing the three outputs and save it for your records.
Copyright 2014 Matrix TSL Limited
Page 11
Worksheet 2
Introduction to
Three-phase Power
Three-phase AC
So what?
The diagram opposite shows typical output from
the Picoscope.
Each phase, shown in different colours, has the
same time period, 20ms. They peak at times
separated by 20/3 = 62/3ms.
Phase angle:
Imagine a bar rotating around one end. Above it, a light shines down, creating a shadow of the
bar. As the bar rotates, the shadow gets longer, then shorter, then zero, then longer in the
other direction, and so on.
As the bar continues to rotate, the shadow
sequence repeats. One complete rotation of
the bar creates one cycle of the sequence.
We can use the same idea to describe phase in alternating voltage signals. Here, the starting
point and end point of one cycle of the signal are separated by a phase difference of 3600.
Using the information given above, one cycle of each
phase lasts 20ms, so points which are 20ms apart have
a phase angle of 3600 between them.
The peaks of the three phases are separated by 6.66ms.
In other words, the phases are separated by phase angles
of (360/20) x 62/3 = 1200.
For your records:
•
Describe five advantages of three-phase over single-phase power transmission. (You may
need to carry out a little research on this, using the internet, for example.)
•
Draw two cycles of a sine wave signal. Add a second signal where the phase angle between
them is 1800.
•
Do the same again, with a phase angle of 2700 between the two signals.
Copyright 2014 Matrix TSL Limited
Page 12
Worksheet 3
Introduction to
Three-phase Power
More phase basics
It’s complicated!
The voltages and currents change in size, and direction over
time. There appear to be three separate sources, all peaking
at different times.
We need a word to describe all of this - phase.
Over to you:
These investigations focus on the relationship between current and voltage in three different
types of load - resistive, capacitive and inductive. The inductive load is created by joining the
coils of the three-phase motor in series.
•
Build the circuit shown opposite.
This time we are monitoring the AC voltage across
the 10Ω resistor and the current flowing through it.
•
Clamp the jaws of the current clamp around one
of the wires from the three-phase generator.
•
Use the same settings for the timebase, for channel
A and for the trigger. Switch channel B to ‘Auto’.
•
Switch on the current clamp, on the 20A range.
•
Check that the three-phase generator is set to the ‘6V’ output or the 10Ω resistor
may overheat!
Switch on the generator.
•
Obtain a trace comparing the AC voltage across the resistor with the current flowing
through it, and save it for your records.
•
Notice that the two AC signals (the voltage across the resistor and the current through it),
are in step (in phase,) with each other.
•
Switch off the three-phase generator and the current clamp.
A challenge:
Using the same approach, modify the circuit to obtain voltage and current traces for:
•
•
a 33µF capacitor;
an inductor, made by using one of the motor coils.
Copyright 2014 Matrix TSL Limited
Page 13
Worksheet 3
Introduction to
Three-phase Power
More phase basics
So what?
A typical Picoscope trace for the resistor is shown
opposite.
The red trace indicates the current flowing through
The resistor and the blue trace the voltage across it.
They rise and fall in step. They are in phase.
When you modified the circuit to investigate the
other components, you should have obtained traces like
the ones shown opposite.
• In the capacitor, current reaches peak value when the
voltage is zero!
• In the inductor, the voltage peaks when the current is
zero.
Phase angle:
Resistor
Capacitor
Inductor
Using phase angles, we can refine our earlier statements:
•
In a capacitor, the current signal leads the voltage signal by a phase angle of 900.
•
In the inductor, voltage leads current by a phase angle of 900.
Phase voltage vs line voltage:
In discussing three-phase systems, two different measures of voltage are used - phase voltage
and line voltage.
• Phase voltage - measured between a phase
terminal and the common (‘N’) terminal.
• Line voltage - measured between one phase
and another.
The circuit you set up earlier measured phase voltages.
For your records:
•
Copy the diagram showing the difference between phase and line voltage.
•
Copy and complete the statement:
For a resistive load, AC voltage and current are …….
•
What is the phase angle between current and voltage in a resistor?
•
Copy the two bullet points describing phase angles in capacitors and inductors.
Copyright 2014 Matrix TSL Limited
Page 14
Worksheet 4
Introduction to
Three-phase Power
And now the phasor
It is even more complicated than we made out!
We saw that the current flowing through the component
may not be in phase with the voltage across it. What’s
worse, the size and direction of both change over time!
The language of AC is now extended, bringing in the phasor, (not the ‘phaser’ - that belongs in ‘Star Trek’!)
The worksheet begins by using the three-phase motor, on
a three-phase supply and then on a single phase and then
turns to phasors and their interpretation.
Over to you:
Three-phase supply:
•
•
•
•
•
•
•
Build the first circuit, shown opposite.
Set the frequency to 0.1Hz and the amplitude to 6V.
Switch on the three-phase supply.
Carefully rest one finger on the motor flywheel, to judge
how smoothly the torque is applied.
What is the effect of turning the amplitude to 9V?
What is the effect of increasing the frequency to 50Hz?
What happens when you increase the frequency to 150Hz?
Challenges:
Investigate what happens when you change to phase connections to the motor, or leave one
disconnected? Can you reverse the direction of rotation?
Single-phase supply:
• Build the second circuit, shown opposite. It uses only one phase of the power supply to
drive two sets of coils, the ‘U’ and ‘V’ coils, (if set up as in the diagram). The capacitor
adds a phase shift between the supplies to the two coils.
• Using the same frequency and amplitude of 6V, switch on.
• When the motor is running, disconnect one of the capacitor
leads. It should continue running.
• Again, rest a finger on the motor flywheel, to judge how
smoothly the torque is applied.
• Does the motor need the second coil, or will it run
using just the supply to one coil?
(Test by disconnecting one of the capacitor leads.)
• Investigate the effects of changing the frequency
and amplitude of the supply, with and without the
capacitor connected.
Copyright 2014 Matrix TSL Limited
Page 15
Worksheet 3
And now the phasor
Introduction to
Three-phase Power
So what?
To understand AC circuits containing capacitors and inductors, you will need to understand
phasors. The first step is to look at vectors:
Vectors - vector quantities, like forces and velocities, are described fully only when both size
and direction are given. Combining them together is not straightforward!
For example, the diagram shows two tugs pulling a ship.
The force exerted by each tug is shown as an arrow.
• its length represents the size of the force;
• its direction is the direction of the force.
To find the total (resultant) force, complete the parallelogram
and construct the diagonal, as shown. Its length gives the size of the resultant force, its
direction, the direction of the resulting force.
Phasors - Current and voltage have size and direction, like vectors, but these change with
time! They can also be represented by arrows, but these rotate!
The length of the horizontal component gives the size of the voltage or
current at that instant. As the phasor rotates, this increases to a maximum,
decreases to zero, increases and so on, (like the rotating bar in worksheet 2.)
Direction - when the horizontal component is on the right-hand side of the
diagram, current flows to the right, say, and when the component is on the
left-hand side, it flows to the left.
Combining phasors - also uses the parallelogram rule, but the current is being ‘pulled’ by a
number of voltages!
For example, in the circuit described by the diagram opposite:
• the supply voltage, vS, is split between the resistor and capacitor;
•
the current through both is the same as they are in series;
0
• current is in phase with resistor voltage, vR, but leads capacitor voltage, vC, by 90 .
This leads to the phasor diagram opposite. (The lengths for vR and vC are
arbitrary.) Although all phasors are rotating, (at the supply frequency,) the
diagram shows the situation when current is maximum.
• Check the diagram to make sure that you can see the information about vR, vC and current.
The vector parallelogram rule gives vS as the resultant of vR and vC .
For your records:
•
Describe how a current phasor contains information about its size and direction.
• Copy the circuit diagram and phasor diagram given above. Explain the link between them.
• A pure inductor (no resistance) is added in series with the resistor and capacitor. Draw the
circuit diagram and phasor diagram for the new circuit. Choose equal sizes for vC and vL.
(When added together, they cancel each other out!)
Copyright 2014 Matrix TSL Limited
Page 16
Worksheet 5
Introduction to
Three-phase Power
It’s a star!
There are two ways to connect up three-phase supplies and
loads - the star, (or ‘Wye’, because of its resemblance to the
letter ‘Y’) and the delta configurations.
The diagram shows a star-connected three-phase supply
driving a star-configured load.
In the star configuration, there is a ‘neutral’ point, where all
phases, or loads are connected together.
Over to you:
•
Build the circuit shown opposite.
• On the three-phase generator, set the frequency
to 50Hz and the amplitude to 6V and switch on.
Voltages in a star configuration:
Phase voltages:
• Use a multimeter on the 20VAC range to measure
the ‘red’ phase voltage, VR, across the top resistor.
• Similarly, measure ‘yellow’ phase voltage, VY,
across the middle resistor and ‘green’ phase
voltage ,VB, across the bottom one.
•
Value in V
‘Red’ phase voltage, VR
Enter all values into the table.
Line voltages:
• With the same settings, measure the line voltage,
VRY, between the ‘red’ phase and the ‘yellow’
phase.
• Similarly, measure the line voltages VRG and VYG.
•
Voltage
‘Yellow’ phase voltage, VY
‘Green’ phase voltage, VG
line voltage VRY
line voltage VRG
line voltage VYG
Enter all values into the table.
Currents in a star configuration:
•
Remove connecting link A.
With a multimeter on 20mA AC, measure the
Current
phase current IR, and enter the result in the table.
‘Red’ phase current, IR
• Replace connecting link A.
‘Yellow’ phase current, IY
• In the same way, measure phase currents IY and IG.
‘Green’ phase current, IG
Enter their values in the table.
Neutral current, IN
• Remove connecting link D.
Measure the current in the neutral wire, IN and enter its value in the table.
Copyright 2014 Matrix TSL Limited
Value in mA
Page 17
Worksheet 5
Introduction to
Three-phase Power
It’s a star!
So what?
Phase voltages - The magnitudes of the three phase voltages are virtually identical. This is
because of the way the three-phase generator is constructed.
Line voltages - Theory predicts the relationship:
Line voltage = √3 x Phase voltage
• Complete the table, using your measurements from the previous page.
Voltage
Value in V
√3 x phase voltage
‘Red’ phase voltage, VR
‘Yellow’ phase voltage, VY
‘Blue’ phase voltage, VB
line voltage VRY
line voltage VYB
line voltage VBR
•
Do the results support this relationship?
Current in a star configuration This circuit has the three-phase power source connected in a star, and the loads connected in
a star. The neutral points in each star are connected together. In this case, the load is known
a balanced load, as the impedance (in this case resistance) in each phase is identical (1kΩ).
• As can be seen from the circuit, phase current and line current are identical.
• Notice that the currents in the three phases are identical - not surprising, as the phase
voltages are identical and the loads are identical.
• What may be a surprise is the value of current in the neutral wire - virtually zero!
This is the result of the phase differences between the currents.
• They are not in phase.
• They do not all reach maxima together.
• They do not add together arithmetically.
A challenge - Remove the neutral wire. Does it make any difference to your readings?
Investigate what happens when the load is unbalanced. (Swap one of the 1kΩ
resistors for a different value, such as 2.2kΩ.)
For your records:
•
Draw the circuit diagram for the system you built for this investigation.
•
Summarise the findings given in the previous section.
•
Explain the mystery of the ‘missing current’ when a balanced load was used. Where has it
gone?
•
Explain why electricity is usually transmitted using a four-wire system, rather than a threewire system.
Copyright 2014 Matrix TSL Limited
Page 18
Worksheet 6
Introduction to
Three-phase Power
On the delta
The other way to configure three-phase circuits is to use the
‘delta’ connection, (so-called because of the similarity of the
shape to the Greek letter ‘delta’ (∆).
The diagram shows a three-phase power source, connected
in delta configuration to a load, also in delta configuration.
This time, there is no neutral point, and only three wires link the
power source and load.
Over to you:
•
Build the circuit shown opposite. The delta connection
may not be immediately obvious. Compare it with the
circuit diagram that follows:
•
phases are connected together through 1kΩ loads;
• the three load resistors are connected in a loop.
•
On the generator, set the frequency to 50Hz and the amplitude to 6V and switch on.
Voltages in a delta configuration:
As can be seen from the diagram, phase voltage and line
voltage are now identical.
• Use a multimeter to measure the line voltages across
Line voltage
Value in V
V12
V13
the three 1kΩ loads.
• Record them in the table.
V23
Currents in a star configuration:
•
•
•
•
•
Remove connecting link A. With the multimeter on the 20mA AC range, measure the
phase current, IR, through the 1kΩ resistor connected between phases Ph1 and Ph2.
Enter the result in the table.
Value in mA
Current
Replace connecting link A.
phase current, IR
Next, measure phase currents IY and IG.
phase current, IY
Enter their values in the table.
phase current, IG
•
Remove the red wire connecting Ph1 to the load.
• Replace it with the multimeter and read line current IL1.
Enter its value in the table.
• Do the same for the other two line currents, IL2 and IL3.
Copyright 2014 Matrix TSL Limited
line current IL1
line current IL2
line current IL3
Page 19
Worksheet 6
Introduction to
Three-phase Power
On the delta
So what?
Theory predicts the relationship:
Line current = √3 x Phase current
•
Complete the table, using your measurements from the previous page.
Current
Value in mA
√3 x phase current
phase current, IR
phase current, IY
phase current, IG
line current IL1
line current IL2
line current IL3
•
Does it support this relationship?
Summary:
In a delta configuration:
Line voltage = Phase voltage
Line current = √3 x Phase current
A challenge •
Connect the three-phase motor using a delta configuration:
• connect the three coils in delta formation - U2 to V1, V2 to W1 and W2 to U1.
• connect the three phases to U1, V1 and W1.
•
What happens when you reverse two of the phases?
•
Compare the performance of the motor in delta configuration with that seen earlier using
the star configuration.
For your records:
•
Copy the circuit diagram showing a delta-configured three-phase supply, driving a deltaconfigured three-phase load.
•
Summarise the findings of this investigation.
•
Using an internet search engine, or text books, draw up a table of relative advantages and
disadvantages for star and delta configurations.
•
Draw the circuit diagram for the delta-configured motor on the three-phase supply.
•
Compare the performance of the motor when in star and in delta configuration.
Copyright 2014 Matrix TSL Limited
Page 20
Worksheet 7
Introduction to
Three-phase Power
Half-wave rectification
Some electrical devices require a DC supply and will
not run on AC.
Rectification is the process of turning an AC supply into
DC. It relies on the fact that diodes allow
appreciable current to flow in one direction only.
Comparing rectified three-phase to single-phase:
The advantage:
• the result is much smoother.
The disadvantage:
• it requires more diodes to accomplish it.
This worksheet introduces the process by looking at half-wave rectification.
Over to you:
•
Build the circuit shown opposite. (The circuit diagram is given underneath it.)
It uses the three-phase generator, in star configuration, to drive current through a 1kΩ
load. Each phase has a diode in series to ensure that current flows only one way through
the load.
Notice the Picoscope ground clip!
•
On the three-phase generator, set :
• the frequency to 50Hz;
• the amplitude to 9V.
•
Use the following Picoscope settings:
Timebase
5ms/div
Channel A, B, C and D
Auto
Trigger
Auto
Threshold
0V
Pre-trigger
0%
•
Switch on the three-phase generator.
•
Obtain a trace showing the three phases delivering power to
the load and the half-wave rectified output applied to it.
•
Save it for your records.
•
To make it clearer what is happening, turn off channels B and
C on Picoscope and obtain another trace, showing the outputs on
channels A and D, i.e. one input phase and the output.
•
Save it for your records with an explanation of what it shows.
Copyright 2014 Matrix TSL Limited
Page 21
Worksheet 7
Introduction to
Three-phase Power
Half-wave rectification
So what?
The diagrams show typical signals. The rectified output is on channel D, shown in gold.
Notice that it sits below the corresponding AC phase signal. This is because of the 0.7V
(approx.) drop across a conducting silicon diode. The trace is always positive, and so it is a
DC signal, though not smooth DC.
In one AC cycle, there are three peaks in the
rectified signal, one for each of the three phases.
This indicates that it is half-wave rectification only
- the negative half-cycle of each phase is ignored.
(Compare this with the next worksheet!)
The variation in the output voltage, (across the load,) is known as the ripple voltage.
Challenges • Connect a 33µF non-electrolytic capacitor in parallel with the 1kΩ load.
• Obtain new Picoscope traces to see the effect
on the ripple voltage.
A typical output is shown opposite.
Notice the reduced ripple!
•
What is the effect on ripple voltage of using different values of load resistor?
You could increase the load resistance by connecting several 1kΩ resistors in series, or
reduce it by connecting them in parallel. (Two 1kΩ resistors in parallel have a combined
resistance of 0.5kΩ, four in parallel have a combined resistance of 0.25kΩ.)
For your records:
•
Draw the circuit diagram for a three-phase half-wave rectifier, and include capacitor
smoothing.
•
Explain why the output of this circuit is considered to be DC.
•
Explain the term ‘ripple voltage’ and explain why adding a smoothing (or ‘reservoir’,)
capacitor reduces the ripple.
Copyright 2014 Matrix TSL Limited
Page 22
Worksheet 8
Introduction to
Three-phase Power
Full-wave rectification
A common use of rectification is in motor vehicles. These generate three-phase electricity
using alternators, which are smaller and lighter than equivalent DC generators.
The majority of the vehicle’s electrical system requires a DC
supply, and so, built into the alternator is a full-wave rectifier.
The previous worksheet looked at half-wave rectification,
leading to a DC output voltage, but with a ripple voltage.
This is often undesirable, as it can cause audible ‘hum’ in
audio equipment and spurious effects in digital systems.
Full-wave rectification reduces this ripple voltage, at the cost of additional components.
Over to you:
•
Build the circuit shown opposite. Notice the Picoscope ground clip!
Make sure that all diodes are connected the right
way round!
Without specialised probes, you can not obtain traces of all phases AND the full-wave output
simultaneously - that would short-circuit part of
the circuit. Instead, use only one probe to monitor
the output across the load, as shown.
Picoscope settings:
Timebase
Channel A
Channels B, C and D
Trigger
Threshold
Pre-trigger
5ms/div
Auto
Off
Auto
0V
0%
•
Set the three-phase generator frequency to 50Hz and amplitude to 9V.
•
Switch it on.
•
Obtain a trace showing the output across the 1kΩ load.
•
Save it for your records with an explanation of what it shows.
•
Connect a 33µF capacitor in parallel with the 1kΩ load and repeat the process.
(To see the relationship between the output and phases, move the Picoscope channel A
probe to examine each phase in turn.)
Copyright 2014 Matrix TSL Limited
Page 23
Worksheet 8
Introduction to
Three-phase Power
Full-wave rectification
So what?
The two traces opposite show typical
Picoscope results, without (top trace)
and with smoothing (bottom trace).
Compare them with those obtained for
half-wave rectification.
The amplitude of the ripple voltage is
much smaller and the frequency is higher
than with half-wave rectification.
A challenge As in the previous worksheet, investigate the effect of load resistor size on ripple voltage.
For your records:
•
Draw the circuit diagram for a three-phase full-wave rectifier, including capacitor smoothing.
•
In investigating this circuit:
• what indicated that the output was DC?
• what indicated that it was a full-wave rectified output, as opposed to half-wave?
•
Describe and explain the effect on ripple voltage of increasing the size of:
• the load resistor
• the smoothing capacitor.
Copyright 2014 Matrix TSL Limited
Page 24
Worksheet 9
Introduction to
Three-phase Power
Delivering power
In the end it is a matter of delivering power from transmitter to load.
Not surprisingly, there is a complication! Real power is the product
of voltage and current in phase with the voltage. As we have seen,
for many loads, current and voltage are not in phase.
This worksheet examines how this situation is handled, in three
circuits. Two use a single phase supply in circuits which contain
reactance. The third uses a three-phase supply to drive the three-phase motor.
Over to you:
An R-C circuit:
•
•
•
•
•
Build the top circuit shown opposite .
Set the three-phase generator frequency to 150Hz
and amplitude to 6V. Switch it on.
Use the same Picoscope settings as in the previous
worksheet.
Obtain and save a trace showing the supply voltage
and current through the circuit.
Switch off the generator and the current clamp.
An R-L circuit:
•
•
•
•
•
Build the middle circuit.
Use the same settings as before for the threephase generator and for the Picoscope.
Switch on the generator.
Obtain and save a trace showing supply voltage
and current through this circuit.
Switch off the generator and the current clamp.
The three-phase motor:
•
•
•
•
•
Build the bottom circuit.
Once more, use the same settings for the threephase generator and for the Picoscope.
Switch on the generator.
Obtain and save a trace showing supply voltage and
current through one phase of this circuit.
Switch off the generator and the current clamp.
Copyright 2014 Matrix TSL Limited
Page 25
Worksheet 9
Introduction to
Three-phase Power
Delivering power
So what?
The traces produced in the three circuits can be analysed to extract the real power delivered
to the load devices. The procedure is outlined below, using a section of a current/voltage
trace obtained for a R-L circuit to extract phase angle φ.
The applied voltage is shown by the blue trace,
current by the red. The amplitude of the current
trace is small and affected by electrical noise.
Voltage leads current, as we expect in a circuit
containing inductance.
•
Draw vertical lines through two adjacent
voltage peaks and a current peak, as shown.
•
Use the time scale to measure times T and L.
T is the period of the signal.
L is the time lag experienced by the current.
Sample results are:
T = 6.7ms
L = 1.3ms
•
T is the time between points with a phase angle of 3600 between them.
Hence, 1.3ms represents a phase difference of (1.3 / 6.7) x 3600 or 700 approximately
In this R-L circuit, voltage leads current by a phase angle of around 700.
This implies a phase factor of 0.34 (i.e. cos 700).
•
From the traces,
peak voltage = 12.0V giving Vrms = 8.4V.
peak current reading = 7mV.
With the current clamp on the 20A (i.e. 1mV/10mA) range,
peak current is 7 x 10 = 70mA, giving Irms = 49mA.
Putting all this together:
Real power delivered to the system, P = Vrms Irms cos φ
= 8.4 x 49 x 10-3 x 0.34
= 0.14W
Apparent power,
S = Vrms Irms
= 0.41VA
For your records:
•
In the same way, determine the real and apparent power for the R-C and R-L circuits you
set up in this investigation.
• The three-phase motor is a balanced load.
The total power delivered = 3 x power delivered to one phase.
Use your results from the third circuit to determine the real power delivered to the motor.
Copyright 2014 Matrix TSL Limited
Page 26
Instructor Guide
Introduction to
Three-phase Power
About this course
Introduction
The course is essentially a practical one. Locktronics equipment makes it simple to construct and test
electrical circuits. The end result mirrors the circuit diagram, thanks to the circuit symbols printed on the
component carriers.
Aim
The course introduces students to concepts used in three-phase electrical transmission and utilisation.
These form the basis for a deeper study of this topic.
Prior Knowledge
It is recommended that students have followed the ‘Electricity Matters 1’and ‘Electricity Matters 2’ or
have equivalent knowledge, covering basic electrical concepts - current, voltage, resistance and the
construction and testing of circuits, using a range of measuring instruments, including multimeters and
oscilloscopes.
Learning Objectives
On successful completion of this course the student will be able to:
•
•
•
•
•
•
•
•
•
•
•
•
•
•
•
•
•
•
•
•
•
•
•
•
•
•
•
•
•
•
•
•
•
explain the meaning of the terms ‘amplitude’, ‘period’ and ‘frequency’ in the context of AC electrical signals;
state and use the relationship between ‘period’ and ‘frequency’;
recognise and use the units for these quantities;
measure these quantities given a sinusoidal waveform of a signal;
distinguish between peak and r.m.s. values for a sinusoidal electrical signal, and use the formula that relates
them;
use a digital oscilloscope, such as Picoscope, to obtain voltage/time graphs of AC electrical signals;
draw a circuit diagram showing a three-phase power source;
describe five advantages of three-phase power supplies over single-phase supplies;
explain the term ‘phase angle’ and justify that the phase angle between the three phases in the supply is 1200;
draw two sinusoidal signals separated by a given phase angle;
use a current clamp to obtain a current/time graph of AC electrical signals;
state the phase relationships between current and voltage in resistors, inductors and capacitors;
distinguish between the terms ‘phase voltage’ and ‘line voltage’ in a three-phase system;
drive a three-phase motor from a single phase source, using a capacitor to create a phase shift;
extract magnitude and direction for a vector quantity from the vector;
combine together two vector quantities using the parallelogram construction to obtain the resultant;
distinguish between vector and phasor quantities;
draw a phasor diagram to show the relationship between currents and voltages in a series LCR circuit;
connect three resistors in star configuration;
distinguish between a balanced load and an unbalanced load in a three-phase system;
explain why the neutral (return) wire is unnecessary in a balanced load three-phase system;
explain why the neutral (return) wire is normally used in a three-phase transmission system;
connect three resistors in delta configuration;
state and use the relationship between phase voltage and line voltage in star and delta configurations;
state and use the relationship between phase current and line current in star and delta configurations;
compare the advantages and disadvantages of star and delta configurations;
explain what is meant by ‘rectification’ and why it is often a necessary part of a three-phase system;
distinguish between half-wave and full-wave rectification, and recognise them from voltage/time graphs;
draw circuit diagrams for half-wave and full-wave rectification of a three-phase power supply;
describe what is meant by ‘ripple voltage’ and explain the role of the smoothing capacitor in reducing it;
distinguish between real, reactive and apparent power and state the units in which each is measured;
use the formulae given to calculate real, reactive and apparent power;
use traces of applied voltage and current to calculate phase angle and real, reactive and apparent power.
Copyright 2014 Matrix TSL Limited
Page 27
Instructor Guide
Introduction to
Three-phase Power
What the student will need:
To complete the course, the student will need the following equipment:
LK5601
Lead, green 500mm, 4mm to 4mm stackable
2
HP 3920
Three phase mo to r
1
HP 4039
Tray Lid
1
HP 5540
Deep tray
1
HP 7750
Daughter tray fo am cuto ut
1
HP 8525
Crash fo am
1
HP 9390
Three phase po wer supply
1
HP 9564
62mm daughter tray
1
LK2346
M ES bulb, 12V, 0.1A
3
LK4025
Resistor, 10 o hm, 1W 5% (DIN)
2
LK5202
Resistor, 1k, 1/2W, 5% (DIN)
3
LK5243
Dio de, po wer, 1A , 50V
6
LK5250
Co nnecting Link
10
LK5291
Lampho lder, M ES
3
LK5603
Lead, red. 500mm, 4mm to 4mm stackable
2
LK5604
Lead, black, 500mm, 4mm to 4mm stackable
4
LK5607
Lead, yello w, 500mm, 4mm to 4mm stackable
2
LK5609
Lead, blue, 500mm, 4mm to 4mm stackable
2
LK5987
33uF no n-electrolytic capacito r
1
LK6218
Resistor, 2.2k, 1/4W, 5% (DIN)
1
LK8900
7 x 5 metric basebo ard with 4mm pillars
1
LK6529
B inding po st
4
Using this course:
The experiments in this course should be integrated with teaching to introduce the theory behind it, and
reinforced with written examples, assignments and calculations.
The worksheets should be printed / photocopied / laminated, preferably in colour, for the students’ use.
They should make their own notes, and carry out the tasks identified in the ’For your records’ sections.
They are unlikely to need their own permanent copy of the worksheets, but the instructor may choose to
distribute copies of the Introduction for students’ records.
Each worksheet has:
• an introduction to the topic under investigation;
• step-by-step instructions for the investigation that follows;
• a section headed ‘So What’, to collate and summarise results, offer extension work and
encourage development of ideas, through collaboration with partners and with the instructor.
• a section headed ‘For your records’, to be copied and completed in students’ exercise books.
This format encourages self-study, with students working at a rate that suits their ability. The instructor
should monitor that students’ understanding keeps pace with their progress through the worksheets.
One way to do so is to ‘sign off’ each worksheet, as a student completes it, and in doing so have a brief
chat with the student to assess grasp of the ideas involved in the exercises it contains.
Time:
It should take students between 5 and 7 hours to complete the worksheets. It is expected that a similar
length of time will be needed to support the learning that takes place as a result.
Copyright 2014 Matrix TSL Limited
Page 28
Instructor Guide
Introduction to
Three-phase Power
Scheme of Work
Worksheet
Introduction
Notes for the Instructor
Timing
This course uses a number of devices which may be new to the student. The
aim of the introduction is to present some information about them and how to
use them.
The third and fourth pages of the introduction focus on the Picoscope
instrument, using version 6 of the software, but parts will be relevant to other
types of oscilloscope and using other software.
Depending on their ability and previous experience, some demonstrations of
using the kit may be appropriate, in addition.
Finally there is a discussion about AC power in its three aspects, real power,
reactive power and true power. At some point, the instructor will need to reinforce these concepts through further teaching and examples.
The instructor may choose to photocopy this introduction for each student.
1
This worksheet acts as revision of work done earlier on single-phase AC, and
introduces students to the three-phase generator and Picoscope.
The latter may require an additional introduction by the instructor, depending
on the students’ experience of oscilloscopes and ADC-type instruments. This
could include the significance of the timebase, voltage sensitivity and the use
of triggering. The beauty of the Picoscope-type instrument is that it allows
students to create and keep files showing the signals they encountered. The
significance of ‘pre-trigger’ may need additional explanation. It allows the user to view a signal some time after triggering takes place.
The instructor should encourage students to experiment with the Picoscope
(or other oscilloscope) settings, as described in the ‘Challenge’ section, so
that they feel more comfortable and confident in using the device.
The ‘So what’ section examines the meaning of the terms’ amplitude’, ‘period’
and frequency, and gives the formula relating the last two. The instructor
should dwell on this and give examples of its use. This may be the time to
practice the use of multipliers, especially ‘milli’ and ‘kilo’.
It also looks at the question of electrical power delivered by the supply. This
section may prove difficult for some students. The instructor should test
whether students have grasped its significance, perhaps through informal
questioning. The relationship between r.m.s. and peak values given and
students should work through examples using it. It is true only for sinusoidal
signals. As the text says, it is best to think of r.m.s. as the equivalent DC
voltage supply which would deliver the same power.
The name ‘root-mean square’ comes from a mathematical treatment of the
signal.
2
• Power can be calculated using the formula ‘V /R’.
• In this, negative and positive voltages both contribute equally, as any ‘-’
signs disappear when squared. This is the ‘square’ term in r.m.s.
• The voltage varies with time in a repeated pattern, so the power delivered
is averaged over one cycle of the pattern (using calculus). This is the
‘mean’ term - another word for ‘average’.
• To get back to a voltage from the ‘voltage squared’ term, we take the
square root of the quantity. Hence the ‘root’ part of r.m.s.
In the final section, students take measurements from traces of the sinusoidal
signal to obtain amplitude, period and frequency. These can be obtained by
using the ‘measurement’ and ‘rulers’ section of Picoscope, or with direct
measurement. The instructor could have additional handouts with other traces on them to allow further practice.
Copyright 2014 Matrix TSL Limited
20 - 30
mins
Page 29
Instructor Guide
Introduction to
Three-phase Power
Scheme of Work
Worksheet
Notes for the Instructor
Timing
2
The introduction to the worksheet sets out some advantages of three-phase
power distribution over single-phase. In the ’For your records’ section,
students are asked to expand on this, using information gleaned from
sources such as the internet. The instructor may wish to reinforce this with
some formal teaching on the topic.
The first part of the practical work is very quick, but well worth doing as it
shows vividly what is happening in the three-phase supply. This is reinforced
by use of the Picoscope, looking at higher frequency signals.
Both versions of circuit symbol are found in literature. The first is useful in
showing that three-phase can be treated as three separate sources of AC
power. The second shows that three-phase power is often produced by three
sets of coils inside a generator.
Although the traces produced by the students are voltage/time graphs of the
signals, it is often useful to use ‘angle’ rather than ‘time’ on the horizontal axis. The ‘So what’ section attempts to illustrate why this can be done. The instructor should ensure that the analogy works for the students.
The important result is that the three phases of the supply are separated by
phase angles of 1200. The ‘So what section’ obtains this result from the time
difference between the phases. As before, the instructor should check that
students understand this argument. More examples, using other frequencies
and numbers of phases will help.
25 - 35
mins
3
In this worksheet, students use the current clamp for the first time. Although
it measures currents as low as 10mA, electrical noise can make the trace
indistinct and for that reason it is advisable to use as large a current as is
feasible. The 100Ω 1W resistor allows an appreciable current without overheating (though it may get hot to the touch!) the height of the trace can be
increased by coiling the wire from the generator to the resistor and trapping
three or four turns of this coil inside the current clamp. (Not advisable if you
are wanting to calculate the amplitude of the current!)
There are two types of current clamp. Both rely on the magnetic fields that
accompany any current flow. That magnetic field intensifies as the current
increases and reverses when the current reverses. In one type, the jaws
contain a coil of wire. A varying magnetic field induces a current in this coil
(rather like the behaviour of a transformer.) This type is suitable only for AC
measurement. The other type has a Hall effect sensor in the jaws. The
magnetic field bends the current flow in the sensor, producing a voltage
across the sensor that is a measure of the size (and indicates the direction)
of the current under test. It can be used with AC or DC current measurement.
The students are challenged to carry out the same investigation using a
capacitor and then an inductor. Interpretation of the results is important as it
reveals the phase relationships between voltage and current in these
devices. Typical results are given in the ‘So what’ section.
They can be explained as follows:
• When an uncharged capacitor (i.e. voltage across it = 0V) is connected to
a voltage source, there is an initial rush of charge onto the plates (i.e. the
current is a maximum.) As the capacitor charges, the voltage across it rises, deterring further charge transfer (i.e. current falls.) Eventually, the capacitor is fully charged (i.e. voltage is maximum) and then no more charge
transfer takes place (i.e. current = 0.) In other words, ‘current leads voltage’.
30 - 40
mins
Copyright 2014 Matrix TSL Limited
Page 30
Instructor Guide
Introduction to
Three-phase Power
Scheme of Work
Worksheet
3
continued...
Notes for the Instructor
Timing
• You can’t have a current without a magnetic field, nor a magnetic field with-
out a current so, rather like the chicken and the egg, which comes first?
When an inductor is connected to a voltage source, (and so voltage is at its
maximum,) even though there is very little (ohmic) resistance, no current
flows, as there is no magnetic field. Slowly, the current and magnetic field
build up. As they do so, an effect described by Lens’ law means that an
opposing voltage builds up in the inductor coil. Current is increasing while
voltage is decreasing. Eventually, current reaches a maximum, and at that
point, nett voltage is zero. Hence the phase angle!
Students could remember the word ‘CIVIL’ as a prompt for the phase rules:
“ In a Capacitor, current I leads voltage V,
but current I lags behind in an inductor L.”
The ‘So what’ section then distinguishes between phase and line voltages.
Students could be given the following definitions:
• Line voltage - measured between any two lines in a three-phase system.
• Phase voltage - measured across a single component in a three-phase system.
• Line current - the current in any line between a source and load in a three-phase
system.
• Phase current - the current in any component in a three-phase system.
4
This worksheet tackles the issue of phasors and how to combine them. This
topic needs a great deal of additional tuition by the instructor if the students
are required to master the techniques.
The investigation looks at driving the three-phase motor, initially using all
three phases from the supply, and then using a single phase, with the help of
a capacitor to excite a second coil with appropriate phase angle. Students are
asked to compare its performance under each condition by (subjectively)
sensing the torque produced. They also vary the supply frequency. At 150Hz,
the motor cannot keep up with the rotating magnetic field, and so stops.
In the ‘So what’ section, the concept of vectors is introduced along with the
parallelogram rule for combining them. Here, this rule is applied by drawing a
scale diagram, though mathematical methods can be applied instead. This
rule allows physicists to manipulate quantities which have both a magnitude
(size) and a direction, e.g. forces and velocities. However, in the case of AC
electricity, the size and direction are changing continuously. Vector arithmetic
is not enough! Instead, we use phasors. Like vector quantities, these use the
length of an arrow to represent the size of the quantity and the direction of the
arrow to indicate direction. However, the arrow rotates (anti-clockwise, by
convention). The size and direction of the quantity at any instant is given by
projecting the phasor onto the horizontal axis.
In the example given, a series combination of resistor and capacitor, the
same current flows through both, as they are in series. However, the voltage
across the resistor is in phase with that current, whereas the voltage across
the capacitor lags behind by a phase angle of 900. Kirchhoff’s 2nd law requires
that the sum (in this case, vector sum) of the voltages across capacitor and
resistor equals the supply voltage. This is shown in the diagram, which uses
arbitrary lengths for the phasors. It is drawn at the instant when current reaches its maximum value (not that this matters.) It allows us to measure (or calculate) the phase angle between current and supply voltage. As stated above,
students must work through a whole series of similar scenarios in order to feel
competent in manipulating phasors.
Copyright 2014 Matrix TSL Limited
30 - 40
mins
Page 31
Instructor Guide
Introduction to
Three-phase Power
Scheme of Work
Worksheet
Notes for the Instructor
Timing
5
The next two worksheets show the two configurations used for loads in threephase systems, star (or ’Wye’) and delta. The difference between them
results in different relationships between line and phase voltages and line
and phase currents.
This investigation looks at these relationships for the star configuration. It
requires that students be familiar with the use of multimeters to measure AC
current and voltage. The instructor may wish to introduce some preliminary
exercises to ensure that students can do this.
The ‘So what’ section analyses results and compares them to the theoretical
relationship. (This can be proved relatively easily using phasor diagrams and
trigonometry, but here we just use the result of all that.)
It includes a discussion of the term ‘balanced load’. Essentially, there is no
need for the return, neutral wire when the load is exactly balanced. The
reason for this is that the three phases are not in phase. When one phase is
positive, one of the others will be negative and will carry the current back to
the three-phase source. This may need some emphasis by the instructor.
The traces of the three-phase supply obtained in worksheet 2 may help with
this explanation.
The ‘For your records’ section includes a question as to why three-phase
transmission systems usually use four wires, bearing in mind this last result.
The answer lies in the reality that loads are not always balanced, in which
case excess current is carried in the fourth neutral wire.
25 - 40
mins
6
This worksheet is a mirror-image of the last, but looking at the delta
configuration.
As previously, no attempt is made to derive the relationship between line and
phase quantities. Students are simply asked whether their results support it.
Previously, students connected the three-phase motor in star configuration.
Now the challenge is to do so using a delta connection, and then to compare
its performance. They should find that reversing two phases causes the motor
to reverse rotation.
Part of the ‘For your records’ section includes a comparison of the relative
advantages of star and delta configurations.
Possible topics include:
• the benefit of lack of a neutral wire in the delta system;
• the ease of extracting a single-phase output from the star configuration;
• the extra torque and self-starting ability for a three-phase motor in delta
configuration;
• the availability of two voltage values (line and phase) in star systems;
the lack of an earthing point in delta systems … .
The instructor may choose to deliver this comparison or may set it as a
research task for the students.
Three-phase sources are usually connected in star configuration. If in delta,
an unbalanced load would cause excess current to flow around the windings
of the source, creating waste heat and possibly damaging the generator.
It is quite common to find mixed systems, where the source is connected as
a star and the load as a delta configuration.
25 - 40
mins
Copyright 2014 Matrix TSL Limited
Page 32
Instructor Guide
Introduction to
Three-phase Power
Scheme of Work
Worksheet
Notes for the Instructor
Timing
7
There are good reasons for generating electrical power as AC - alternators
are more efficient than equivalent DC generators, transformers can use AC
but not DC... . However, most electronic devices require DC power.
Fortunately, it is easy (and cheap) to convert AC to DC in a process called
rectification (but relatively expensive to convert DC to AC!)
Broadly speaking, there are two forms of rectification - half-wave and fullwave. This worksheet looks at half-wave rectification, the next at full-wave.
The key to both is the one-way behaviour of diodes - offering very low
resistance to current flow in one direction and very high resistance to flow in
the other. (An alternative is to use thyristors, also called SCRs, siliconcontrolled rectifiers, which also have this property.)
Students capture oscilloscope traces that show that the supply to the load
never crosses the zero volts line, and so is DC. The instructor may wish to
emphasise the difference between DC and smooth DC, as this is certainly
not smooth. A measure of smoothness is given by ripple voltage, discussed
in the ‘So what’ section. This can be reduced by connecting a capacitor in
parallel with the load. This acts as a reservoir of charge, driving current
through the load in those periods when the current from the supply falls.
25 - 40
mins
8
This worksheet addresses full-wave rectification and begins with a reminder
that vehicle alternators generate AC but then, internally, rectify it for use in the
vehicle’s DC electrical system.
The investigation follows the same path as the previous one, first obtaining
a full-wave rectified output and then looking at the effect of a smoothing
capacitor. Unlike the previous one, it is not possible to view all three phases
and the rectified output on the same trace because of the need to reference
the three phases against the neutral terminal, but reference the output
against the negative side of the load. Trying to do both at the same time
results in a short-circuit of part of the system. The only way to do this is to
use (expensive) ‘differential’ oscilloscope probes that are not automatically
referenced to ground.
The student is asked to investigate the effect of capacitor value, and of load
resistance on the size of the ripple voltage. As before, the instructor should
emphasise the importance of connecting electrolytic capacitors the right way
round. The results should show that increasing the capacitor value reduces
ripple (as it stores more charge and so can sustain the current for longer).
Increasing the value of load resistance reduces the ripple because it draws
a smaller current from the reservoir capacitor, allowing it to maintain the
voltage longer.
25 - 40
mins
Copyright 2014 Matrix TSL Limited
Page 33
Instructor Guide
Introduction to
Three-phase Power
Scheme of Work
Worksheet
9
Notes for the Instructor
The instructor may wish to direct the students back to the Introduction and its
treatment of AC power. This ties in with earlier work on phasor diagrams and
the meaning of rms quantities. All of this may prove difficult for some students
and the instructor may need to offer substantial support to ease them through
this.
In the investigation, students build three systems, two using a single-phase
power supply with a R-C and then a R-L network. Then they connect up the
three-phase motor, in delta configuration, to the three-phase output from the
generator.
The best way to do this is to connect the three coils of the motor to each other
in ‘head-to-tail’ fashion - U2 to V1, V2 to W1 and W2 to U1. Then the threephases from the generator are connected to the ‘nodes’ U1, V1 and W1. The
instructor may wish to check this wiring before students turn on the power
supply.
In all three cases, they obtain traces showing the relationship between
applied voltage and current. In the case of the motor, this is done for one
phase only (any phase). The motor is a balanced load and so the total power
delivered is three times the power delivered to one phase.
The ‘So what’ section shows how to obtain phase angle from the traces.
There is likely to be considerable electrical noise on the current trace,
because of its small amplitude. This makes determining the phase lag difficult,
but we can still get a reasonable estimate. The instructor may wish to hand
out traces which are free from noise to check that students are following the
correct procedure.
This is:
• Measure the distance between adjacent peaks on the voltage curve and
between one voltage peak and the nearby current peak. These distances
can then be converted into a phase angle. From there the power factor
can be calculated.
• Measure peak values for the voltage and current trace. The current clamp
is set to the 20A range, which gives an output of 1mV for every 10mA of
current, (see the Current Clamp Operator’s Manual) and hence the peak
value of current is calculated by multiplying the peakvalue of the current
trace by 10.
• Convert the peak values into rms values.
• Apply the formulae to give the estimates of real and apparent power.
The ‘For your records’ section asks students to follow this procedure with the
three traces they obtained in the investigation to obtain real and apparent
power for these systems.
Copyright 2014 Matrix TSL Limited
Timing
40-55
mins