1
USER INSTRUCTIONS
15
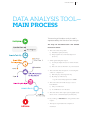
The file contains the following sheets:
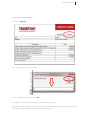
� Matrix
� Report 1—Graphs
� Update Form
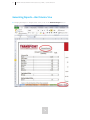
� Report 2—Scatter Plots
Each sheet contains the following:
Matrix
Report 1—Graphs
The matrix is where all the data pertaining to
This is the main part of the diagnostic tool; it
each city are located. This matrix is available for
allows users to generate bar, column, or line
viewing only and any modifications can be done
only by authorized users.
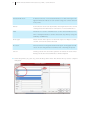
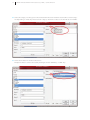
Update Form
This form is to be utilized by the user to enter
reports using the available indicators.
Report 2—Scatter Plots
This report is used to combine data items and
data on the test city. This form is also the means
generate scatter plots. It is a valuable option to
by which the user in charge of database mainte-
better portray the relationship between two data
nance updates information in the matrix.
items, when a bar or line report is not adequate.