1
USER INSTRUCTIONS
29
Generating Reports—Scatter Plots
This report is used to generate scatter plots if the user would like to compare the performance along
one data item with changes in the value of another. It is a valuable option to better portray the relationship between two data items, which a bar, column, or line report cannot do.
The data will be displayed as a collection of points, with the value of one data item determining the
position of each point on the horizontal axis and the value of the other data item determining the position on the vertical axis.
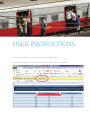
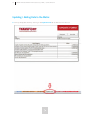
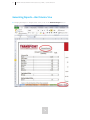
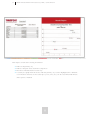
zz While having the Report 2—Scatter Plots sheet active, click on Generate Report.