1
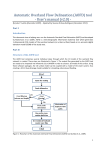
Bode 100 - Application Note Traditional and Non-Invasive Stability Measurements Using the Bode 100 and the Picotest J2111A Current Injector By Florian Hämmerle & Steve Sandler © 2015 by OMICRON Lab – V1.3 Visit www.omicron-lab.com for more information. Contact [email protected] for technical support. Smart Measurement Solutions® Bode 100 - Application Note Traditional and Non-Invasive Stability Measurements Page 2 of 24 Table of Contents 1 EXECUTIVE SUMMARY ....................................................................................................................................... 3 2 MEASUREMENT TASK ........................................................................................................................................ 4 3 MEASUREMENT SETUP & RESULTS ............................................................................................................... 5 3.1 STABILITY MEASUREMENT OF THE CONTROL LOOP ..................................................................................................... 5 3.1.1 Measurement Setup ............................................................................................................................................ 5 3.1.2 Device Setup ........................................................................................................................................................ 7 3.1.3 Calibration ............................................................................................................................................................ 8 3.1.4 Measurement ....................................................................................................................................................... 9 3.1.5 Measurement Result ......................................................................................................................................... 13 3.2 OUTPUT IMPEDANCE MEASUREMENT ......................................................................................................................... 15 3.2.1 Measurement Setup .......................................................................................................................................... 15 3.2.2 Device Setup ...................................................................................................................................................... 16 3.2.3 Phase Margin Calculation: ............................................................................................................................... 18 3.2.4 Measurement ..................................................................................................................................................... 19 3.3 EQUIVALENT SERIES RESISTANCE .............................................................................................................................. 21 3.4 STEP LOAD RESPONSE ............................................................................................................................................... 22 4 CONCLUSION ..................................................................................................................................................... 23 Note: Basic procedures such as setting-up, adjusting and calibrating the Bode 100 are described in the Bode 100 user manual. You can download the Bode 100 user manual at http://www.omicron-lab.com/bode-100/downloads.html#3 The J2111A does not require calibration. The J2111A comes with and uses the J2170 High PSRR power supply. Note: All measurements in this application note have been performed with the Bode Analyzer Suite V2.43 SR1. Use this version or a higher version to perform the measurements shown in this document. You can download the latest version at www.omicron-lab.com/bode-100/downloads You can download the latest Picotest Injector manual at http://www.picotest.com/products_injectors.html Smart SmartMeasurement MeasurementSolutions Solutions® Bode 100 - Application Note Traditional and Non-Invasive Stability Measurements Page 3 of 24 1 Executive Summary This application note shows how the phase margin of a linear voltage regulator (LM317) can be measured using the Bode 100 and additional accessories. The same techniques can be used to measure switching regulators as well. The measurements are performed on the Picotest Voltage Regulator Test Standard (VRTS) testing board1 using the OMICRON Lab B-WIT injection transformer and the Picotest J2111A Current Injector. The Current Injector, together with the Bode 100, allows direct measurement of the output impedance, group delay and Q of the system. Using this information the phase margin of the system can be calculated without breaking the feedback loop of the controller. This method is, therefore, "non-invasive.” In this application note the results of the non-invasive measurement are compared to the "classical" Bode plot loop gain measurements. Additionally, the influence of the output capacitor ESR2 on the phase margin is investigated. Two different output capacitors are used for the phase margin measurements and the results are compared. Additional information on stability measurement with the Bode 100 can be found in (OMICRON Lab, 2009): "Measurement of DC/DC Converters with Bode 100" 1 2 See: http://www.picotest.com/products_injectors.html Equivalent Series Resistance Smart SmartMeasurement MeasurementSolutions Solutions® Bode 100 - Application Note Traditional and Non-Invasive Stability Measurements Page 4 of 24 2 Measurement Task The phase margin of the LM317 linear voltage regulator is evaluated using two different methods: 1 2 Traditional stability measurement via the Loop Gain-Phase (Bode plot) Non Invasive output impedance measurement The two measurements are then compared. The Picotest VRTS kit is used as the basis for the testing. The VRTS can be used to perform most of the common voltage regulator measurements using the Bode 100 in conjunction with the Picotest Signal Injectors. The kit includes the regulators and capacitors used for the measurements in this application note. Voltage Regulator Test Standard board. Source: (Picotest, Voltage Regulator Test Standard, 2010) To highlight the influence of the output capacitance on the phase margin of the regulator two different capacitors are used for the measurements. The two capacitors are the 100 µF tantalum capacitor (capacitor no. 1) and the 100 µF aluminum electrolytic capacitor (capacitor no. 3). Smart SmartMeasurement MeasurementSolutions Solutions® Bode 100 - Application Note Traditional and Non-Invasive Stability Measurements Page 5 of 24 3 Measurement Setup & Results 3.1 Stability Measurement of the Control Loop We can measure the loop gain 𝑇(𝑠), of the LM317 feedback system by breaking the control loop and injecting a small-signal voltage into the feedback pin. This can be done with the B-WIT wideband injection transformer and two 1:1 voltage probes. A constant load current of 25 mA is achieved by switching on the positive bias current of the J2111A Picotest Current Injector. The injector can provide positive, negative or zero bias, so that the J2111A can operate in class A mode for use with a Network Analyzer. The negative bias is for use with negative voltages, while the positive bias is for positive voltages. The Current Injector is normally in parallel with the normal circuit load current and impedance. In this case, the J2111A Current Injector is acting as a constant current load. 3.1.1 Measurement Setup The VRTS board is powered using a universal wall adapter power supply, which comes with interchangeable plugs for use in various countries. The J2111A is powered using the J2170 High PSRR power supply. The LM317 IC is plugged into the board as shown below. Please make sure that the polarity is correct as shown in the picture below! The LM317 provided with the kit is configured with a 410 Ω to 249 Ω voltage divider to deliver a 3.3V output voltage. The injection resistor has a value of ≈ 5 Ω. It is recommended that you measure the output voltage to verify its 3.3 V before continuing. Stability measurement of the LM317 board using VRTS, Bode 100, B-WIT and J2111A Current Injector. Smart SmartMeasurement MeasurementSolutions Solutions® Bode 100 - Application Note Traditional and Non-Invasive Stability Measurements Page 6 of 24 The B-WIT injection transformer connects the Bode 100 to the test board BODE connectors as shown below. Two oscilloscope probes are connected to the same connectors as the injection transformer. The picture below shows the connection points on the test board. It should be noted that the probe ground connections are both connected to the VOUT connector to measure the voltage respect to the output voltage. This is only true for floating voltage regulators, such as the LM317, since the reference voltage is with respect to the output voltage and not to ground. CH2 CH1 Capacitor no. 1 is a tantalum capacitor and capacitor no. 3 a standard aluminum capacitor. Both have a nominal capacitance value of 100 µF. The figures below show the capacitors connected to the test board output. Capacitor no. 1 (tantalum) Capacitor no. 3 (aluminum) With this setup we can measure the loop gain and determine the phase margin of the system. For the stability measurement the Bode 100 needs to be configured correctly. Smart SmartMeasurement MeasurementSolutions Solutions® Bode 100 - Application Note Traditional and Non-Invasive Stability Measurements Page 7 of 24 3.1.2 Device Setup To measure the loop gain and phase, two voltages at the injection point must be measured. The Bode response is then calculated by: 𝑇(𝑠) = 𝑉2 (𝑠) 𝑉1 (𝑠) This measurement can be performed directly with the Bode 100 using an external reference. The Bode 100 is set up as follows: Measurement Mode: Start Frequency: Stop Frequency: Sweep Mode: Number of Points: Receiver Bandwidth: Attenuator 1 & 2: Level: Frequency Sweep Mode 100 Hz 10 MHz Logarithmic 201 or more 100 Hz 0 dB 0 dBm To switch on the external reference start the device configuration window and click on the external reference switch symbol: To directly measure the Bode plot we want to display the magnitude in dB and the phase of the loop gain T. To do so, the second trace in the Bode Analyzer Suite has to be activated. By setting the correct Diagram Setup the phase can be displayed in a separate diagram. Smart SmartMeasurement MeasurementSolutions Solutions® Bode 100 - Application Note Traditional and Non-Invasive Stability Measurements Page 8 of 24 Trace 1 & 2 Settings: Trace 1 settings Trace 2 settings 3.1.3 Calibration A calibration has to be performed if the two voltage probes are not identical. As we are measuring a voltage gain we need a THRU calibration. To do so both probes are connected to the same injection point as shown in the left picture below and the THRU calibration is started. THRU calibration setup Measurement setup The calibration removes differences between the two probes. It is recommended that you check the influence of the THRU calibration. To do so, you can switch off the calibration and check the influence of the calibration. If the calibration influence on the measurement results is high even if two similar voltage probes are used the measurement setup may be inaccurate. The calibration can be switched ON and OFF by clicking on the calibration indicator. Smart SmartMeasurement MeasurementSolutions Solutions® Bode 100 - Application Note Traditional and Non-Invasive Stability Measurements Page 9 of 24 3.1.4 Measurement We will first measure the Bode plot with the tantalum capacitor. Starting a single sweep leads to the following Bode plot: 80 60 TR1/dB 40 20 0 -20 -40 -60 102 103 104 105 106 107 105 106 107 f/Hz TR1: Mag(Gain) 250 TR2/° 200 150 100 50 0 102 103 104 f/Hz TR2: Unwrapped Phase(Gain) The marked ranges indicate that the measurement result is not correct. The distortions are due to the excessive measurement level which causes nonlinearities of the system to be measured. This is not a result of the analyzer, but is due to large signal effects within the regulator (Steven M. Sandler, 2011). Smart SmartMeasurement MeasurementSolutions Solutions® Bode 100 - Application Note Traditional and Non-Invasive Stability Measurements Page 10 of 24 The injection signal level needs to be decreased. Reducing the measurement level to a value of −27dBm leads to the following Bode plot: 80 60 TR1/dB 40 20 0 -20 -40 -60 102 103 104 105 106 107 105 106 107 f/Hz TR1: Mag(Gain) 250 TR2/° 200 150 100 50 0 102 103 104 f/Hz TR2: Unwrapped Phase(Gain) Now two unwanted effects appear. Smart SmartMeasurement MeasurementSolutions Solutions® Bode 100 - Application Note Traditional and Non-Invasive Stability Measurements Page 11 of 24 Due to the low injection level the measurement shows more noise in the high gain magnitude range. However, in the more interesting zero gain area the measurement level is still too high. The output level of the Bode 100 can further be reduced by connecting an external attenuator between the Bode output and the B-WIT input. In this example we are using the Picotest J2140A Attenuator. Connecting a 20dB attenuator between the Bode 100 output and the B-WIT and restarting the measurement leads to the following result: 80 60 TR1/dB 40 20 0 -20 -40 -60 102 103 104 105 106 107 105 106 107 f/Hz TR1: Mag(Gain) 250 TR2/° 200 150 100 50 0 102 103 104 f/Hz TR2: Unwrapped Phase(Gain) The nonlinearities disappear while the noise on the measurement increases. To check if the output level is small enough it should be possible to increase the output level about +6 dB without the nonlinear effects reappearing on the measurement and without shifting the crossover frequency. To reduce the measurement noise the shaped level function of the Bode 100 can also be used. The Bode 100 also allows averaging and selectable Receiver Bandwidth for noise reduction. Smart SmartMeasurement MeasurementSolutions Solutions® Bode 100 - Application Note Traditional and Non-Invasive Stability Measurements Page 12 of 24 Activate the Shaped Level feature as shown in the following picture: Next the shaped level function has to be entered. In the Shaped Level window frequency and the associated level can be entered. This enables the Bode 100 to reduce the level only at the points where a reduction is necessary and to increase the level in regions were the measurement shows too much noise. It is possible to use an optimal measurement level for every frequency range using a shaped level as shown in the picture above. Smart SmartMeasurement MeasurementSolutions Solutions® Bode 100 - Application Note Traditional and Non-Invasive Stability Measurements Page 13 of 24 3.1.5 Measurement Result Measurements using the 100 µF tantalum capacitor: 60 f/Hz TR1/dB Cursor 1 8,315k 0,000 TR1/dB 40 20 0 1 -20 102 103 104 105 106 107 105 106 107 f/Hz TR1: Mag(Gain) 250 f/Hz TR2/° Cursor 1 8,315k 21,757 TR2/° 200 150 100 50 0 102 103 1 104 f/Hz TR2: Unwrapped Phase(Gain) The loop gain Bode-plot with a 100 µF tantalum capacitor shows a phase margin of φ𝑚 ≈ 21.8° at the crossover frequency of 𝑓𝑐 ≈ 8.3 kHz. In the higher frequency range additional crossover frequencies can exist. The Bode 100 performs measurements up to 40 MHz allowing investigation of these high frequency effects, which are often related to capacitor, PCB or connection parasitics. Smart SmartMeasurement MeasurementSolutions Solutions® Bode 100 - Application Note Traditional and Non-Invasive Stability Measurements Page 14 of 24 Measurements using the 100 µF electrolytic capacitor: 60 f/Hz TR1/dB Cursor 1 59,178k -28,422f TR1/dB 40 20 0 1 -20 102 103 104 105 106 107 105 106 107 f/Hz TR1: Mag(Gain) 250 f/Hz TR2/° Cursor 1 59,178k 91,409 TR2/° 200 150 100 50 0 102 103 1 104 f/Hz TR2: Unwrapped Phase(Gain) The loop gain Bode-plot with a 100 µF electrolytic capacitor shows a phase margin of φ𝑚 ≈ 91.4° at the crossover frequency of 𝑓𝑐 ≈ 59.2 kHz. Smart SmartMeasurement MeasurementSolutions Solutions® Bode 100 - Application Note Traditional and Non-Invasive Stability Measurements Page 15 of 24 3.2 Output Impedance Measurement Together with the Picotest J2111A Current Injector the Bode 100 offers a simple and non-invasive method to measure the output impedance of a regulating system. The output impedance data provides a measurement of the phase margin without the need to inject a signal into the control loop. This is the only way to measure the phase margin of a fixed voltage regulator, where the control loop is not available for a traditional Bode measurement. Output impedance measurement using the J2111A. Source (Picotest, Signal Injector Documentation, 2010) 3.2.1 Measurement Setup The figure above shows the basic measurement setup to measure the output impedance of a regulator system with the Bode 100 and the Picotest J2111A Current Injector. The output of the Bode 100 is connected to the modulation input of the J2111A (MOD). A signal at the MOD input of the injector leads to a change in load current according to the input signal at a gain of 10 mA⁄V . The monitor output of the injector then delivers a voltage signal that is proportional to the current flowing through the injector output (1 A = 1 V) when terminated with 50 Ω. This signal is measured at channel 1 of the Bode 100. The output voltage is measured using a 1:1 probe with channel 2. Performing a gain measurement with an external reference leads to the output impedance: 𝑉𝑐ℎ2 𝑉𝑐ℎ1 ≙ 𝑉𝑜𝑢𝑡 𝐼𝑜𝑢𝑡 ≙ 𝑍𝑜𝑢𝑡 Smart SmartMeasurement MeasurementSolutions Solutions® Bode 100 - Application Note Traditional and Non-Invasive Stability Measurements Page 16 of 24 Output impedance measurement example 3.2.2 Device Setup Current Injector J2111A: The positive bias of the current injector has to be switched on (+bias) as the Bode output voltage does not have an offset and the LM317 is a positive voltage regulator. The positive bias will provide a 25 mA offset current, allowing the current injector to operate in class “A” mode. For best performance, the output wires from the J2111A should be twisted or a coax. They are shown here untwisted for clarity. Bode 100: The Bode 100 is set up as follows: Measurement Mode: Start Frequency: Stop Frequency: Sweep Mode: Number of Points: Receiver Bandwidth: Attenuator 1 &2: Level: Frequency Sweep Mode 100 Hz 10 MHz Logarithmic 201 3 Hz 0 dB 0 dBm Smart SmartMeasurement MeasurementSolutions Solutions® Bode 100 - Application Note Traditional and Non-Invasive Stability Measurements Page 17 of 24 To switch on the external reference start the device configuration window and click on the external reference switch symbol. In addition, the input impedance of channel 1 has to be set to 50 Ω, while channel 2 stays in high impedance mode: Trace 1 & 2 settings: Smart SmartMeasurement MeasurementSolutions Solutions® Bode 100 - Application Note Traditional and Non-Invasive Stability Measurements Page 18 of 24 3.2.3 Phase Margin Calculation: According to reference (Erickson & Maksimovic, 2004) the phase margin 𝜑𝑚 is related to the quality factor 𝑄 by: 𝑄= √cos 𝜑𝑚 . sin 𝜑𝑚 The quality factor at the crossover frequency can be calculated from the measured group delay by 𝑄(𝑇𝑔 ) = 𝜋 ⋅ 𝑓 ⋅ 𝑇𝑔 . Hence, the phase margin at crossover frequency can be calculated from an output impedance measurement using the above relationships. The Bode Analyzer Suite supports the direct phase margin calculation from the output impedance measurement. There are two different ways to measure the phase margin: 1. Basic PM Calculation (single cursor) 2. Advanced PM Calculation (two cursors) The basic PM calculation uses one cursor value to determine the phase margin value from the 𝑄(𝑇𝑔 ) peak. This method is very accurate for low phase margin values below approximately 40°. For higher phase margin systems the output impedance peak will not exactly occur at the same frequency as the 𝑄(𝑇𝑔 ) peak. The advanced PM calculation accounts for this difference in frequency. Therefore it needs two cursor values to calculate the phase margin. One cursor must be placed at the peak of the output impedance magnitude and the other cursor must be placed at the peak of 𝑄(𝑇𝑔 ). In the following we use the Basic PM Calculation (single cursor). As you will see later this method is sufficient in this case since the peak in impedance and the peak in 𝑄(𝑇𝑔 ) occur at the same frequency. The basic PM calculation is activated by right clicking in the cursor area of the Bode Analyzer Suite as shown in the figure below: Smart SmartMeasurement MeasurementSolutions Solutions® Bode 100 - Application Note Traditional and Non-Invasive Stability Measurements Page 19 of 24 Activating the cursor calculation leads to an additional line in the cursor table showing the results of the calculations: 𝑄(𝑇𝑔) 𝑃𝑀 Note: The phase margin calculation is only available if one trace measurement format is set to 𝑄(𝑇𝑔 ). Note: 𝑄(𝑇𝑔 ) is a function of group delay 𝑇𝑔 . 𝑇𝑔 is calculated by numerical differentiation. Therefore we recommend not to choose too many points in the sweep. 201 points is the recommended choice. Furthermore sometimes we recommend to use the logarithmic Y-scale for a better visibility of the meaningful result areas. 3.2.4 Measurement First we measure the phase margin with the tantalum output capacitor. Starting a single sweep leads to the following measurement result: 2,5 1 10 2,0 0 1,5 1,0 -10 0,5 -20 f/Hz TR1/dB TR2 TR2: PM Cursor 1 8,042k -4,521 2,359 22,748 ° -30 TR2 TR1/dB 20 102 103 104 105 106 0,0 107 f/Hz TR1: Mag(Gain) TR2: QTg(Gain) Setting the cursor to the resonance peak in the output impedance leads to the crossover frequency and the calculated phase margin which are displayed in the cursor table. Smart SmartMeasurement MeasurementSolutions Solutions® Bode 100 - Application Note Traditional and Non-Invasive Stability Measurements Page 20 of 24 The output impedance measurement with a 100 µF tantalum capacitor shows a phase margin of φ𝑚 ≈ 22.7° at the crossover frequency of 𝑓𝑐 ≈ 8.0 kHz. These results are in agreement with the results from the loop gain measurement (φ𝑚 ≈ 21.8° and 𝑓𝑐 ≈ 8.3 kHz). Next, we connect the electrolytic capacitor to the output and restart the measurement. 20 0,6 1 0,5 10 0 0,3 -10 0,2 TR2 TR1/dB 0,4 0,1 -20 f/Hz TR1/dB TR2 TR2: PM Cursor 1 50,878k -294,401m 255,658m > 71° -30 102 103 104 105 106 0,0 -0,1 107 f/Hz TR1: Mag(Gain) TR2: QTg(Gain) The aluminum capacitor has a very high ESR which results in high damping. As the phase margin is >71° the damping is very high and no resonance peak appears in the output impedance. This output impedance curve therefore shows a very stable system with high damping and the display indicates a phase margin of 𝜑𝑚 > 71°. Smart SmartMeasurement MeasurementSolutions Solutions® Bode 100 - Application Note Traditional and Non-Invasive Stability Measurements Page 21 of 24 3.3 Equivalent Series Resistance The great difference in stability of the system depending on the output capacitor is caused by the different ESR of the capacitors. The ESR of the two capacitors is shown in the following figures. The measurements were performed using the Bode 100 with the B-WIC impedance adapter (see also (OMICRON Lab, 2010)). The tantalum capacitor has a very low resistance of about 50 mΩ in the vicinity of the crossover frequency. The electrolytic capacitor has a series resistance of about 1.5 Ω. ESR of capacitor 1 (tantalum capacitor): 1.0 TR1/Ohm 0.8 0.6 0.4 0.2 0.0 102 103 104 105 106 107 105 106 107 f/Hz TR1: Rs(Impedance) ESR of capacitor 3 (electrolytic capacitor): TR1/Ohm 2.0 1.5 1.0 0.5 0.0 102 103 104 f/Hz TR1: Rs(Impedance) Smart SmartMeasurement MeasurementSolutions Solutions® Bode 100 - Application Note Traditional and Non-Invasive Stability Measurements Page 22 of 24 3.4 Step Load Response The same measurement setup used for the output impedance measurement can also be used to measure the step load response. The Bode 100 output has to be replaced with a function generator and the inputs with an oscilloscope. The chosen step size is 10 mA around the 25 mA operation point. Step load response with tantalum output capacitor Step load response with electrolytic aluminum capacitor. The step load response shows that the electrolytic capacitor suppresses ringing. The measurement with the tantalum capacitor shows ringing at a frequency of about 1 1 𝑓= = = 9.4 kHz 𝑇 106 µs Smart SmartMeasurement MeasurementSolutions Solutions® Bode 100 - Application Note Traditional and Non-Invasive Stability Measurements Page 23 of 24 4 Conclusion The Bode 100 can be used to measure a traditional Bode response as well as a non-invasive output impedance measurement when combined with the Picotest J2111A Current Injector. The noninvasive measurement has been shown to be in excellent agreement with the traditional measurement, offering a simple and reliable method to evaluate the stability of voltage regulators without breaking the feedback loop. The non-invasive method, therefore, allows the stability of regulators to be assessed when the feedback loop is not accessible, as in the case of a fixed voltage regulator. In addition, it can be seen that the equivalent series resistance has a very high influence on the stability of the voltage regulator. As the ESR is not always specified in the high frequency range it can be useful to measure the ESR. The Bode 100 with the impedance adapters offers an easy way of measuring the ESR. References: Erickson, R. W., & Maksimovic, D. (2004). Fundamentals of Power Electronics. Springer. OMICRON Lab. (2009). www.omicron-lab.com/application-notes. Retrieved 12 2010, from Measurement of DC/DC converters with Bode 100. OMICRON Lab. (2010). Capacitor ESR Measurement Application Note. www.omicronlab.com/application-notes. Retrieved 12 2010 Picotest. (2010). Signal Injector Documentation. Version 1.0c. Picotest. (2010). Voltage Regulator Test Standard. Version 1.0d. Steven M. Sandler, T. B. (2011). Network Analyzer Signal Levels Affect Measurement Results. 37(1). . Smart SmartMeasurement MeasurementSolutions Solutions® Bode 100 - Application Note Traditional and Non-Invasive Stability Measurements Page 24 of 24 OMICRON Lab is a division of OMICRON electronics specialized in providing Smart Measurement Solutions to professionals such as scientists, engineers and teachers engaged in the field of electronics. It simplifies measurement tasks and provides its customers with more time to focus on their real business. OMICRON Lab was established in 2006 and is meanwhile serving customers in more than 40 countries. Offices in America, Europe, East Asia and an international network of distributors enable a fast and extraordinary customer support. OMICRON Lab products stand for high quality offered at the best price/value ratio on the market. The products' reliability and ease of use guarantee trouble-free operation. Close customer relationship and more than 25 years in-house experience enable the development of innovative products close to the field. Europe, Middle East, Africa OMICRON electronics GmbH Phone: +43 59495 Fax: +43 59495 9999 Asia Pacific OMICRON electronics Asia Limited Phone: +852 3767 5500 Fax: +852 3767 5400 Americas OMICRON electronics Corp. USA Phone: +1 713 830-4660 Fax: +1 713 830-4661 [email protected] www.omicron-lab.com Smart SmartMeasurement MeasurementSolutions Solutions®