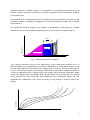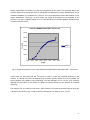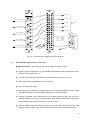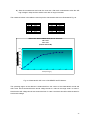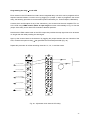
1
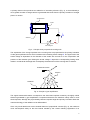
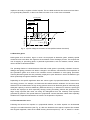
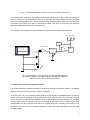
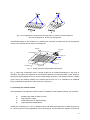
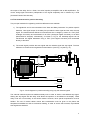
2D Position-Sensitive Neutron Detector DENEX-300TN User Manual and Technical Specification Lueneburg, February 2008 1. General 1.1. Guarantee declaration 1.2. EU- Declaration of conformity 2. Working principles of Denex detectors 2.1. Primary ionisation 2.2. Secondary ionisation 2.3. The proportional counting tube 2.4. Detection gases 2.5. The characteristic curve 2.6. The position-sensitive proportional counter 2.7. The delay line readout method 2.8. Time measurement for position decoding 3. Design and construction of the DENEX-300TN detector 3.1. Construction of the detector 3.2. Quality control during production 4. Installation and initial operation of the detector 4.1. General precautionary measures during handling and operating the detector 4.2. Detector orientation 4.3. Connecting the electronics to the detector 4.4. Recording the characteristic anode curve 4.5. Recording the characteristic drift curve 4.6. Adjusting the efficiency 4.7. The constant fraction discriminator 4.8. Gamma suppression 4.9. Switching off the detector 4.10. Detector maintenance 5. Detector Specifications 5.1. 3He-Gas Analysis Certificate 5.2. Detector specifications 5.3. Detector cross-section 5.4. Front and rear views 5.5. Side view 1 1. General This manual contains important information on understanding the way in which the Denex 300 TN/B detector functions, as well as instructions for installation and operation of the detector. We strongly recommend that you read carefully the instructions contained in this user manual, in order to ensure that your detector functions optimally right from the start. The detector as supplied is ready for operation. It should be unpacked immediately following delivery, even if the installation and start of operation is planned for a later date. The transport container should be inspected for any signs of external damage. Transport packaging should be completely removed. The container and packaging material should be stored safely in case of any possible claims for damages. 1.1 Guarantee declaration The detector you have purchased has been manufactured with great care under continuous quality control. Should however any defects or faults be found over a period of 1 year from the date of purchase, please inform Denex in writing either with information on the fault or a description of the problem at the address below. Assistance will be given without charge. This guarantee is void in the case of damage caused through accident (e.g. mechanical shock), improper operation (e.g. the use of excessively high anode or drift voltages) and acts of nature beyond control (e.g. lightening, flooding etc.). This guarantee will lapse, if it transpires that in any way unauthorised changes are made to the detector. In the case that the detector has to be shipped to Denex for repairs, please ensure that the detector is free of contamination and appropriately packed, as Denex cannot assume responsibility for damage that may be incurred during transportation. Guarantee claims should be addressed to: DENEX, Detektoren für Neutronen und Röntgenstrahlung GmbH Stöteroggestrasse 71 D-21339 Lüneburg (Germany) Tel. +494131 248932 Fax +494131 248933 E-Mail: [email protected] Following expiry of the guarantee period the detector may also be returned to the above address for repair. In this case repair costs will be invoiced. 2 CE DENEX EU-Declaration of Conformity The Manufacturer of the Product covered by this Declaration is DENEX- Detectors for Neutrons and X-Rays GmbH Stöteroggestrasse 71 21339 Lüneburg Federal Republic of Germany The Directives covered by this Declaration 97/23/EEC Pressure Equipment directive (PED) Section EEC No. L18158.1 from 9.7.1997 Test pressure 6 bar. Calculated according to AD 2000, Bulletins 5D and W7 89/336/EEC Electromagnetic Compatibility directive as amended The Product covered by this Declaration 2D-position-sensitive detector for the registration of neutrons Type: DENEX-300TN Serial No. 0706-0015 The manufacturer hereby declares under his sole responsibility that the product identified above, by reason of its design and construction, complies with the essential health and safety requirements of the EU-directives. Attention! The attention of the specifier, purchaser, installer, or user is drawn to special measures and limitations to use that must be observed when this product is taken into service to maintain compliance with the above directives. If changes are made to the product without prior agreement with the manufacturer, this declaration will become invalid. Signed: ................................................... Authority: ..... 3 2. Working principles of Denex detectors 2.1 Primary ionisation The physical principle employed for the detection of photons or neutrons is based on their interaction with the gas present in the detector chamber. Absorption of the incoming photon or neutron by the gas is accompanied by local ionisation of the gas and the production of electrons and positive ions. A Denex detector is in principle constructed like an electrical plate capacitor (Fig. 1). The plates are designated as electrodes with the anode connected to the + pole and the cathode to the – pole of the voltage supply U. The electrodes are located opposite and parallel to each other and are separated by a small distance d within the gas-filled chamber. The voltage U applied to the electrodes serves to generate a homogeneous electric field F between them. When photons or neutrons enters the space between the electrodes, collisions with the gas molecules along their trajectories lead to the creation of positive and negative charge carriers (ions and electrons) which are then attracted to the correspondingly oppositely charged electrodes. The resulting charge impulses can be measured as electrical impulses i. Plattenkondensator + + ++ + +++ + Ionisierendes Photon + F + d - - - - - -- - - - U i Strommeßgerät Fig. 1: Measurement of the ionisation current The applied voltage U and the distance between the electrodes d are chosen such that U is large enough and d is small enough to ensure that the charge carriers are collected quickly enough by the electrodes to avoid their recombination. In the case of low energy photons the entrance window of the detector has to be very thin to allow transmission of the photons without significant energy losses and thus to ensure that they can give up almost their entire energy within the detection volume. For the efficient detection of photons and neutrons it is therefore necessary to give careful consideration to detector design and to the selection of the window material and the detection gas. 2.2 Secondary ionisation In contrast to photons, neutrons can only interact with atom nuclei, for example via absorption. The absorption process involves incorporation of the neutron into the atom nucleus. This generally leads to excitation of the atom nucleus and the subsequent emission of particles. 4 3 He + 1 n 4 He + 1p + T + 0,77 MeV T 3 4 He He P N Fig. 2: Nuclear reaction between a neutron and 3He Fig. 2 shows schematically such a reaction between a neutron and a 3He-atom. Excitation of the 3Heatom by the incoming neutron leads to the emission of a proton and a tritium atom; + 0.77 MeV is released and the 3He-atom is transformed to 4He. The proton (p) and Tritium (T) released generate positive und negative charged particles via collisions with the gas molecules along their trajectories. These are attracted to the correspondingly oppositely charged electrodes of the capacitor plate. As illustrated in Fig. 3, the two electrodes are normally configured in practise as a cylindrical capacitor or as tube-detector or counting tube. Zylinderkondensator + - U i Strommeßgerät Fig. 3: Detector as cylinder-capacitor 2.3 The proportional counting tube Whereas in a plate capacitor only the directly or indirectly generated charge carriers contribute to the signal, the proportional detector makes use of an amplification effect that is based on the multiplication of these charge carriers in the gas volume. The positive electrode (anode) of the cylinder-capacitor illustrated in Fig. 4 takes the form of a thin wire, in the neighbourhood of which, free electrons between two collisions with the gas atoms are so strongly accelerated, that they can generate further charge carriers. 5 A primary electron thus produces an avalanche of secondary electrons (Fig. 5), so that ultimately a much greater number of charge carriers is generated than result from the primary ionisation of a single photon or neutron. Zylinderkathode Isolator + - U Zähldraht i Strommeßgerät Fig. 4: Principle of the proportional counting tube The amplitudes of the charge impulses at the counting wire are proportional to the primary ionisation via the gas amplification factor which increases with increasing anode voltage U. The upper limit to the anode voltage is dependent on the diameter of the anode wire as well as on the composition and pressure of the detection gas. Raising the anode voltage U beyond the corresponding limiting value results in an electrical discharge and consequently the destruction of the counting tube or detector. Einfallendes Photon Elektron Zähldraht Fig. 5: Principle of gas amplification The signals measured therefore correspond to the short-lived impulses caused by the highly mobile electrons generated by gas amplification. Proportional detectors are therefore mainly used to count these impulses, although the proportionality between impulse height and primary ionisation allows the nature and energy of the radiation to be differentiated. Since very small dead times are an essential feature of proportional counters (Fig. 6), the maximum count rate depends solely on the time interval needed by the counter following registration of an 6 impulse to be ready to register a further impulse. This so-called resolution time amounts to less than 1 µs in good quality detectors, so that count rates in excess of 106 counts /s are achievable. Erholungszeit Auflösungzeit Totzeit Zeit Impulshöhe S Schwelle Diskriminator T = Ra x C Fig. 6: Impulse voltage as a function of time (S Discriminator threshold) 2.4 Detection gases Noble gases such as helium, argon or xenon are employed as detection gases, whereby special measures have to be taken with regard to the termination of the discharge process. This requires the use of stopping or quenching gases, in particular hydrocarbons, such as methane, butane, ethane, carbon dioxide or tetrafluormethane. The operating lifetime of closed detectors filled with noble gases is practically unlimited. However, leakage and ageing processes can lead to changes in the detector characteristics. Decomposition of the hydrocabon gases as a result of the ionisation events contributes to such ageing processes. These hydrocarbon gases are thus preferably employed in open detectors in which the detection gas flows dynamically through the detection chamber. Depending on the specific application there are various types of proportional detector. Detectors for low energy photons, for example, are fitted with thin-walled entrance windows. On the other hand, detectors for the measurement of high energy photons have to be filled with gases of sufficiently high absorption capacity to achieve satisfactory detection efficiency. In detectors for neutrons, special gas mixtures are employed in which especially strongly ionising secondary particles are generated. The large charge impulses that result can easily be distinguished from the relatively small impulses generated by photons. This special feature of proportional counters therefore makes them especially suitable for the separate measurement of neutrons in the presence of photons. 2.5 The characteristic curve Following the arrival of an impulse in a proportional detector, no further impulse can be detected during the so-called dead-time (see Fig. 6). After the dead-time has expired, impulses first reattain their original magnitude, when the so-called recovery-time has expired (T = R x C, where R = anode7 resistance (Ra) and C = detector capacity). For registration in a counting device the resolution time is decisive. The time period after resolution of an impulse is determined by the discriminator threshold (S) (resolution time). The amplitude of the impulses depends only on the detection gas, the thickness of the anode wire and the applied voltage U, although the amplitude of the impulses generally increases with increasing anode voltage U. The appropriate operating voltage for the detector is established by determining the so-called characteristic curve, which illustrates the dependence of the count rate on the applied voltage U. Geiger-MüllerBereich Proportionalbereich Dauergasentladung Impulsrate in s-1 Plateau U Anode [V] Fig. 7: Characteristic curve for a detector Impulsrate in s-1 Fig. 7 shows a schematic of such a curve, determined e.g. with a discriminator threshold of 0 V. A distinctive feature of the characteristic curve is the so-called plateau or “Geiger-Müller-Regime”, which for good quality detectors should extend over a voltage range of more than 100V and a have slope of a few %. The operating voltage of the detector is selected such that random voltage fluctuations do not lead to departures from the voltage range of this plateau regime. Electron avalanches created outside this voltage regime will propagate along the entire length of the counting wire. The resulting charge impulses are much larger than those generated in the proportional regime and their magnitudes are independent of the nature and energy of the photons or neutrons entering the detector. Spannung in V 8 Fig. 8: Characteristic detector curves for various discriminator thresholds The discrimination required for the separate measurement of neutrons in the presence of photons is here more difficult or even impossible to achieve. In this case, the anode voltage should not be raised above the average plateau value. Above and beyond the average plateau value the count rate starts to increase more rapidly as a result of interference effects, until finally a continuous gas discharge takes place that leads to destruction of the detector. Fig. 9 shows a circuit diagram of a proportional counting tube with its associated electronics. Start Stop Reset Teimer Impulsverstärker Zähler Diskriminator Ck Ra Koinzidens Gate Cp Rb Ci + - U Fig. 9: Circuit diagram of a proportional counting tube with electronics Ck Coupling capacitor, Cp Pump capacitor, Ci Integrator capacitor Ra Work resistor, Rb Current limiting resistor 2.6 The position-sensitive proportional counter The position-sensitive proportional counter is designed to ascertain the specific position in a radiation field from which the incoming photon or neutron originates. As shown in Fig. 10, a 1-D position-sensitive detector for the detection of scattered photon or neutrons can be constructed by arranging counting tubes next to each other in arrays. The positional resolution of such devices corresponds to the diameter of the counting tubes employed. Between the individual counting tubes there is a dead zone which is created by the walls of the counting tubes. Such arrangements are very expensive and difficult to operate since each counting tube needs its own electronics and these have to be exactly trimmed to match each other and should show the same temperature drift. 9 Fig. 10: Arrangements of proportional counting tubes as position-sensitive detectors a) Linear arrangement, b) Circular arrangement The DENEX solution to this problem is to combine each individual counting tube into the proportional counter.The cathodes are connected via a delay line. Gehause Kathodestreifen Gasventil c b Ausgang X1 a Delay-Line Ausgang X0 Anodedraht Isolator Fig. 11: Design principle of the DENEX-1D-Detector Fig. 11 shows the arrangement used. A single anode wire is located perpendicular to the array of cathodes. The signals are registered in the individual cathodes and are transmitted via the delay line through the signal outputs X0 and X1 to the corresponding electronics. The spatial resolution is simply given here by the distance between one cathode and the next one. In a 2D-detector an additional array of cathodes perpendicular to the first array is employed. 2.7 The delay line readout method The advantages of the delay line readout method, compared to other readout systems, are as follows: a) b) c) d) parallel signal read out (wire per wire) large frequency range simple electronics for signal handling signal amplitude independence A delay line consisting of "L" und "C" elements with a total delay time depending on detector type from ca. 100 ns to 400 ns and an impedance of 50 Ω is employed. The first electronic element connected to 10 the output of the delay line is a linear, low-noise impulse pre-amplifier with 56 dB amplification. For correct timing-signal information (independent of the signal amplitude) this is followed by a CFD (Constant Fraction Discriminator). 2.8 Time measurement for position decoding Two principal methods for registering small time differences are available: 1) The signals X0 and X1 are transmitted via a "Gate and Delay Generator" for position-specific detection. One signal output of the delay line provides the start signal and the other the stop signal. The measured time difference is transformed into a voltage by means of a TAC (Time Analogue Converter) and transmitted via an ADC (Analogue Digital Converter) to an MCA (Multi-Channel Analyser). Alternatively, as shown in Fig.12, the start/stop-signals can be transformed into digital addresses using a TDC (Time Digital Converter) and transmitted directly to the MCA. 2) The anode signal provides the start signal and the cathode signal the stop signal. The time difference is measured and registered as described in a) and Fig. 12 (see Fig. 13). PC Compact PCI CAMAC or VME Y-TAC FAST ComTec MPA-3 Y-Start Y-Stop X-ADC X-TAC Y-ADC CF- discriminator Cathode preamplifier DENEX -FD2 Drift filter X-Start X-Stop 7072T FAST ComTec Display Gate and delay generator VAX Keyboard DENEX - FTP8a Anode filter and preamplifier Test point +HV-Anode electrode bias supply FAST ComTec -HV-Drift electrode bias supply FAST ComTec Fig.12: Circuit diagram for position decoding using only the cathode signals The cathode method requires two additional delay units in order to obtain a well-defined stop signal. Setting the stop signal with the delay units allows the spectrum to be shifted on the display. These delay units are not necessary in the anode method. However, other special requirements must be fulfilled. The use of coaxial cables means that consideration must be given to the phase and temperature stabilities as well as mechanical loading, in order to ensure that constant, reproducible start signals are obtained. 11 Compact PCI CAMAC or VME PC FAST ComTec MPA-3 CF- discriminator X-TDC Cathode preamplifier Drift filter Y-Start Y-Stop Y-TDC X-Start X-Stop 7072T FAST ComTec Display VAX Keyboard Anode filter and preamplifier FAST ComTec +HV-Anode electrode bias supply FAST ComT4ec -HV-Drift electrode bias supply Fig.13: Circuit diagram for position decoding using both the anode and cathode signals 3. Design and construction of the DENEX-300TN detector The DENEX-300TN detector is a 2-dimensional position-sensitive multi-wire proportional counter for the detection of thermal neutrons. The principle of position decoding is illustrated in Fig. 14. The externally applied voltages generate strong and almost homogeneous electric fields (red arrows) between the electrode planes. When a neutron undergoes absorption in this detection volume, the free electrons released via the ionisation process are accelerated towards the anode (blue arrow). The strong electric fields in the neighbourhood of the anode wires accelerate the electrons such that charge multiplication occurs by an avalanche process. The resulting charge avalanche is registered as an electrical impulse (green arrow) by both read-out cathodes (X and Y cathodes) and fed into the delay line, which divides the incoming impulse into two equally strong pulses. These flow to the two ends of the delay line. The delay lines consist of a series of LC-Elements that result in a delay of 2.7 ns between the pulses from two adjacent cathode wires. The longer the distance of the event from the end of the delay line, the greater is the time needed before it is registered at this end of the delay line. The X and Y coordinates of the position of the event can thus be determined from the arrival times of the two impulses. 12 Driftelektrode Y-Kathode Nachweisvolumen Delay line Anode X-Kathode Delay line Einfallendes Neutron Driftelektrode Fig. 14: Principle of position decoding in a 2D-multi-wire proportional detector with a delay line 3.1 Mechanical construction of the DENEX-300TN detector The DENEX-300TN detector consists of a housing unit (Al-Mg3) that supports a series of electrodes and which is closed by a pressure-resistant cover plate (Al-Mg4.7M) (Fig.15).The neutron entrance window is integrated into the cover plate. The size of the window, 300 mm x 300 mm, corresponds to the area spanned by the electrode wires. The detection volume is limited by two drift electrodes each located at a distance of 5 mm from the X and Y cathodes. The distance between the first and second drift electrodes corresponds to 20 mm. The first drift electrode consists of a metallic foil which has been vulcanised with insulating material directly onto the window in order to avoid having a dead volume between the drift electrode and the entrance window. All materials are chosen such that neutron absorption or scattering effects can practically be neglected. 13 SMA SMA SMA SHV SMA SHV Fig. 15: Diagram showing the housing, the electrodes and cover plate of the DENEX-300TN detector 3.2 Quality control during production During the production process DENEX tests the detector with 55Fe und 57Co-photons, in order to check the quality of the individual components and the performance of the entire detector system. Tests with 55Fe involve the measurement of photons with low energy (5.9 keV) employing flowing ArCO2 as counting gas. The experimental setup is shown in Fig. 16. Fig. 16: Testing the DENEX-300TN detector with a 55Fe-source 14 Initially experiments are carried out to test the homogeneity of the signal over the entire area of the detector. Effects due to defective wires or entrapped dust particles are easily identified and can be rectified immediately by replacement or removal. The next experiment involves determination of the anode characteristic curve (Fig. 17) which allows the quality of the detector to be assessed. In this case the count rate vs applied voltage curve is characterised by an excellent plateau regime between Ua 2670 V and Ua 2740 V. Kennlinie DENEX-300TN (55Fe und Ar-Co2) 60000 50000 Count/10s 40000 30000 Reihe1 20000 10000 0 2450 2500 2550 2600 2650 2700 2750 2800 Ua [kV] Fig.17: Anode characteristic curve of the DENEX-300TN/B detector determined with a 55Fe-source Further tests are performed with the 55Fe-source in order to check the positional resolution of the detector. The image of the pliers so obtained (Fig. 18) allows specific details, such as for example, the spring between the handles or the suspending cord with diameters of ca. 0.6 mm to be resolved. Although this test object is very simple, it enables the spatial resolution of the detector to be tested effectively. The image in Fig. 18 contains in total 1024 x 1024 channels. Line scans across the image in the X and Y directions are shown in Fig. 19. Each channel corresponds to a distance of ca. 0.3 mm. 15 Fig.18: Test of the positional resolution with a 55Fe-source Fig. 19: Line scans in the X and Y directions of the spring and the cord After testing with 55Fe, the detector is closed with a pressure-resistant covering plate and subjected to pressure and leakage tests (5 bar overpressure with 10-9 mm bar/l s). The detector is then filled with an Ar-CO2 gas mixture at 1 bar and again tested for contamination using a 57Co-source. The detector is then heated and evacuated over a period of 5-6 days to remove hydrogen. Subsequently, the detector is tested once more with respect to gas tightness and functionality. When all these tests are successfully completed, the detector is filled with the gas mixture (3He-CF4) required by the customer and the detector as shown in Fig. 20 is now ready for shipping. 16 Fig. 20: The finished DENEX-300TN/B detector 17 4. Installation and initial operation of the detector 4.1 General precautionary measures for the handling and operation of the detector: The DENEX-300TN detector is an extremely sensitive measuring instrument that should be treated with extreme care. When the detector is put into operation or is running, this means that voltage is being applied to the anode or the drift electrodes and it should be ensured that: 4.2 • the detector is not subjected to any mechanical forces such as jolts or vibrations; however it may be mounted and operated on a goniometer stage. • no sudden voltage changes are caused by removal of the SHV connectors from the anode or drift filter. This could lead to damage of the anode and all the pre-amplifiers. It is recommended that the high voltage always be switched off via the high voltage supply unit which as a result of its very large time constant can avoid any unacceptably rapid voltage changes. Detector orientation Normally, the detector is delivered with the geometry as illustrated in Fig. 21. The resolution along the X-axis is better than along the Y-axis because the anode wires are oriented horizontally, i.e. parallel to the X-axis. The detector may be rotated by 90° to interchange the X and Y axes, if e.g. a better resolution is desired in the vertical direction. XO X1 OPEN Anode Drucksensor Gasventill CLOSE Y1 Y0 Drift Fig. 21: Front and rear views of the DENEX-300TN detector 18 4.3 Connecting the electronics to the detector • First connect the anode and drift high voltages to the NIM-high voltage supply using the two red cables supplied. Take care that the anode is connected to the positive and the drift to the negative voltage respectively. • Connect the cathode preamplifier FTP-110 and the anode preamplifier FTP-111 with the NIMmodule N-145 using the LEMO-cables supplied, see Fig. 22. Adjust the individual trimming potentiometers with a small screwdriver until the voltage of the corresponding channels reaches a value of approx. + 9.7 V. To X0 preamplifier 9,7 V To X1 preamplifier 9,7 V To Y0 preamplifier 9,7 V To Y2 preamplifier 9,7 V To anode preamplifier 9,7 V Reserve Fig. 22: Connecting the detector preamplifier to the NIM-module DENEX-N-145 • Connect the preamplifier to the NIM-main amplifier TFA-111 using the SMA-coaxial cable supplied as shown in Fig. 23. • Connect the A-outputs of the main amplifier TFA-111 to the inputs of the Ortec discriminator using short LEMO-coaxial cables of equal length as shown in Fig. 23. Set the zero-crossing voltage of the individual channels with a small screwdriver, see Fig. 23. 19 DENEX OCT CF DISCR CF 8000 TFA-111 OUT IN X0 1 A IN TH OUT From X0 preamplifier 2 IN A TH TH 3 Y1 TH 4 IN B IN A 6 B From Y1 preamplifier 5 A IN TH B 8 From anode preamplifier A OUT IN OUT TH A NH M OR TH Σ B X0 = - 0,135 V X1 = - 0,143 V Y0 = - 0,122 V Y1 = - 0,161 V Anode = - 0,182 V B 7 B Zero crossing voltage for: A OUT IN Reserve A OUT TH OUT Anode output B 5 TH From Y0 preamplifier A OUT IN Anode OUT Y1 output B 4 A IN To MCA A OUT IN B Y0 output B 3 From X1 preamplifier A OUT IN Y0 OUT X1 output B 2 B A OUT IN X1 X0 output B 1 TB MAINAMPLIFIER ORTEC Fig. 23: Connecting the preamplifier to the CFD-8000 4.4 Recording the characteristic anode curve: Equipment required: An oscilloscope and a pre-selection impulse counter a) Connect a good oscilloscope, e.g. TEKTRONIX TDS 3054B to the B-outputs of the anode channel main amplifier TFA-111 b) Turn the zero-crossing of the anode-CF-discriminators to a minimum (ca. 7 mV) c) Leave the drift-high voltage supply unit switched off d) Open up the neutron beam e) Now switch on the anode-high voltage supply unit and slowly increase the anode voltage from zero volts until the neutron signals just appear on the oscilloscope f) Connect a B-output of the ORTEC-CFD of the anode channel to the input of the preselection impulse counter with a LEMO-coaxial cable. Set the preselection counter such that the anode pulses can be counted for a time of ca. 20 s g) Start the measurement and note the measured count rate. After each measurement, raise the high voltage in steps of e.g. 50 V until the anode count rate increases dramatically 20 The measured values in the table are used to plot the characteristic anode curve illustrated in Fig. 24. U-Anode Count/10s U-Anode Count/10s U-Anode Count/10s 1800 1850 1900 1950 2000 2050 2100 2150 2200 2250 2300 12 14 41 311 1536 5084 10347 14460 18709 21954 23405 2350 2400 2450 2500 2550 2600 2650 2700 2750 2800 2850 24674 25712 26178 26413 26938 26956 27019 27433 27984 28600 28878 2900 2950 3000 3050 3100 29804 30428 31810 32745 34370 Anodenkennlinie Detektor DENEX-300TN Ser. No.: 0706-0015 Helium Isotop 3 = 5 bar CF4 = 1 bar (Neutronenquelle: Am-241 Be) 40000 35000 Anodenzählrate / 20s 30000 25000 20000 15000 10000 5000 0 1800 2000 2200 2400 2600 2800 3000 3200 Anodenspannung [ V ] Fig. 24: Characteristic anode curve of the DENEX-300TN detector at a discriminator setting of -0.7 V. 4.5 Recording the characteristic drift curve of the detector Equipment required: Pre-selection counter a) Set the anode high voltage to an arbitrary value on the plateau of the characteristic curve (for example 2600 V) b) Switch on the drift high voltage supply and set it to 0 V c) Set the preselection counter such that the anode pulses can be counted for a time of 20 s 21 d) Start the measurement and note the count rate. After each measurement raise the drift high voltage in steps until the anode count rate no longer increases. The measured values in the table are used to plot the characteristic drift curve illustrated in Fig. 25. U-Drift 0 100 200 300 400 500 600 Count/10s U-Drift 11041 12065 13614 15330 17020 17887 18975 Count/10s 700 800 900 1000 1100 1200 1300 19649 19873 20365 20547 20939 20843 20974 Driftkennlinie Detektor DENEX-300TN, Ser.No.: 0704-0015 3He = 5 bar CF4 = 1 bar (N-Quelle: Am-241/Be) 23041 21041 19041 17041 15041 13041 11041 0 200 400 600 800 1000 1200 1400 1600 D riftspannung [V] Fig. 25: Characteristic drift curve of the DENEX-300TN detector The operating regime of the detector is determined from the course of the characteristic anode and drift curves. We recommend that the anode voltage be set to a value in the range 2400 V to 2900 V. Note that the drift voltage should not exceed the limit of -1000 V and that it should be held constant for each anode voltage. 22 4.6 Adjusting the efficiency Equipment required: A black 3He-counter with impulse counter A 3He-counter tube is placed in front of the detector (Fig. 26). Make sure that this counter is black (light-tight). Ensure that the counter captures the entire neutron beam and then measure the maximum count rate. Then, with the same neutron beam, measure the maximum count rate with the Denex detector using an arbitrary anode voltage in the range + 2400 V to + 2900 V, e.g. + 2700 V. Differences in the count rates can be compensated by adjusting the anode high voltage. In this particular example, the DENEX-detector has an operating anode voltage of exactly + 2800 V. Fig. 26: Setup for measuring the efficiency 4.7 The Constant Fraction Discriminator (CFD) General: A constant fraction discriminator (CFD) is an electronic signal processing device, designed to mimic the mathematical operation of finding a maximum of a pulse by finding the zero of its slope. Some signals do not have a sharp maximum, but short rise times tr. (see Fig. 27) The input signals to the CFD are pulses from the cathode and anode of the DENEX detector. However the detector pulses have identical rise times that are significantly longer than the desired temporal resolution in the nanosecond regime. This forbids simple threshold triggering with a TDC (Time Digital Converter) which introduces a dependence of pulse height on trigger time, the so called Time WalkEffect (Fig. 27 left). Identical rise times and pulse shapes permit triggering not on a fixed threshold but on a constant fraction of the total pulse height (Fig. 27 right) yielding trigger times (Zero-Crossing) independent of pulse height. 23 Walk t t t1 Fig. 27: Comparison of threshold triggering (left) and constant fraction triggering (right) Principle of operation: The incoming signal is split into two components. One of the components is delayed by a time τ where 0 « τ ≤ t and is inverted, while the other component is multiplied by a factor c where 0 < c < 1. The two components are added together again and the first zero-crossing with a positive first derivative is taken as the trigger time (Fig. 28). Threshold + Zero-Crossing In x 1 3 + + - D Q 1 shot Out CK τ Fig. 28: Function diagram of a CFD 24 Programming the delay τ on the CFD Each channel in the CFD-8000 from Ortec has an integrated delay unit which can be programmed in a stepwise manner between 2 ns and 12 ns by plugging in a jumper. In order to programme the correct delay, the following procedure is recommended (method devised by Dr. Thomas Wilpert, HMI-Berlin): Connect the A and B outputs of any of the channels e.g. the X-channel of the main amplifier TFA-111 to the CFD using LEMO-coaxial cables of equal length as shown schematically in Fig. 29. Set the jumper of the delay unit for both CFD channels to identical positions. Note that the LEMO-coaxial cable of the CFD output that provides the stop-signal has to be at least 5 cm longer than the cable providing the start-signal. Open up the neutron beam to the detector. By toggling the jumper between the two channels of the CFD, measure the optimum delay τ that generates the narrowest peak-width (Fig. 30). Repeat this procedure for all the remaining channels: X1, Y0, Y1 and the anode. DENEX OCT CF DISCR CF 8000 TFA-111 1 A IN OUT IN TH OUT B 2 IN A TH B TH 3 B 4 A IN TH B 5 TH From Y0 preamplifier 4 IN B IN A 6 B TH B 5 A IN B TH B 8 From anode preamplifier A OUT IN OUT A OUT 7 From Y1 preamplifier A OUT IN OUT A OUT IN OUT A OUT IN B A OUT 3 From X1 preamplifier TH A NH M OR TH Σ B Stop B IN OUT To theTDC A OUT IN 2 From X0 preamplifier Start B 1 TB MAINAMPLIFIER ORTEC Fig. 29: Adjustment of the internal CFD delay 25 Messung mit 2 ns interne CFD- Messung mit 4,5 ns interne CFD- Messung mit 12 ns interne CFD- Fig. 30: Programming the delay τ in the CFD 4.8 Gamma (γ) suppression An essential requirement for optimum background reduction is the effective shielding of the detector with polyethylene and boron carbide plates to prevent interference by stray neutrons from the reactor or from neighbouring experiments. Successful elimination of these sources of interference will not 26 however result in zero background because of the contribution caused by ionisation of the unavoidable impurities in the counting gas of the detector, as occurs e.g. in fluorescent lighting. This process is halted by the presence of the additional constituent of the gas mixture, the CF4 (quenching gas) but does generate undesirable signals whose count rates and amplitudes depend on the magnitude of the anode high voltage (interference effects, see section 2.5). The quenching gas (CF4) also serves the purpose of limiting the path of the protons and tritium produced by the interaction of the neutrons with the counting gas (secondary ionisation, see section 2.2) and thus enables the desired positional resolution to be achieved. Interactions between the photons (γ) generated in the detector shielding and the quenching gas CF4 produce a further contribution to the background. This can be mitigated by reducing the amount of the CF4 gas in the detector, but this is not always an acceptable option. An alternative is to adjust the zero-crossing potentiometer on the CFD (Constant Fraction Discriminator) until the output of the discriminator shows a γ count rate of zero. The best approach here is to connect an oscilloscope to the main amplifier of the detector and measure the output signal amplitudes in volts. The corresponding zero-crossing potentiometers on the CFD can then be set with the help of a voltmeter. 4.9 Switching off the detector The detector is switched off by reducing the anode and drift voltages to ZERO Volt. The order in which the voltages are reduced is unimportant. 4.10 Detector maintenance The detector is a closed system filled with noble gas with a lifetime which is practically unlimited. Service and maintenance is therefore generally not required. However leakage and ageing processes ca lead to changes in the detector characteristics. The detector has been tested for gas tightness at DENEX. If the gas valve remains well closed, the gas pressure should not change significantly over a period up to a decade. Should leakage occur, contrary to expectations, this could lead to damage of the anode. In such a case, the special measures described in the following should be taken: a. Check that the electrical connections are consistent with the diagrams in Figs. 11 and 13. It is especially important to ensure that the anode and drift electrode are supplied with a positive and a negative voltage respectively. b. Carry out the procedure described in section 4.4 - Recording the characteristic anode curve Check that characteristic anode curve is similar to that in Fig. 24. If this is not the case, contact DENEX immediately. 27 5.0 General specifications 5.1 Gas certificate 28 5.2 Detector Specifications 1 Active area 2 3 Depth of detect. volume Detection gas 4 Position resolution (FWHM): 5 Efficiency for thermal neutrons 6 Window material Window thickness Uncorrected differential nonlinearity of position detection 7 8a Background rate without neutrons 8b γ-efficiency εγ 9 Electronic components inside the detector Anode wire Cathode wire Drift electrodes 10 11 12 13 14 15 16 17 18 19 20 21 22 23 24 25 26 27 28 29 30 31 Connector for HV supply Connector for delay lines signal Valve for pumping and gas filling • Manufacturer • Type Gas quality: 3 He 4 HE delay lines • number of steps • delay per step • total delay • Bandwidth Anode capacity Drift capacity Anode work voltage Anode work current Anode work resistor Drift work voltage Anode work current Detector dead time Detector restoration time Dead zones Pressure sensor Type Gaskets Dimensions: • height • width • depth • weight EU-Declaration of Conformity 300 x 300 mm 2 20mm He: 5 bar CF4: 1. bar 2 mm x 3 mm 3 0.9 Å: 2Å: 4 Å: 8 Å: 16 Å: > 48 % > 76 % > 94 % > 99 % 100 % Al Mg 4,5 Si Alloy 10 mm <3% << 1/s -5 εγ < 10 (E ~ 1 MeV) 50 Ω Delay lines Ø ~ 8 μm Ø ~ 30 μm Comments Size of the free space of electrode frames; Neutron sensitive area: ~ 280mm x 280mm Limited by drift electrodes Maximal total detection gas pressure: 6 bar Horizontally: FWHM 2 mm (due to CF4 pressure) Vertically: FWHM 3 mm (due to CF4 pressure and anode wire distance) i) nominal neutron capture probability inside the detection volume (depth: 20mm) ii) absorption in neutron window not taken into account iii) electronic detection of every captured neutron assumed iv) dead-volume losses between entrance window and first drift electrode can be neglected due to electrode design Material and thickness is optimized Measurement: Starting from the centre of an uncorrected spectrum and assuming a constant ratio "change in x- or y-position per channel" the relative distortion will not exceed 3%, ie less than 4.5 mm at the border. Depends on the surroundings, the analogue electronics and its adjustment. Based on efficiencies as measured recently at GKSS for the DENEX500-CN and DENEX-200CN detectors filled with 1, 1.5 and 3 bar CF4. Au-coated Tungsten/Rhenium wire Au-coated Tungsten/Rhenium wire Metallic-coatings on isolating layers on window and bottom of the detector 50 Ω SHV 50 Ω SMA Swagelok 6L-ELD8-DDXX 99,91 0,09 The detector housing is heated to ~ 60°C and evacuated for more than 100h before the detection gas is introduced. 150 ~2.7 ns ~ 400 ns 100 Mz ~ 470 pF ~ 160 pF +2800 V ~0,008 μA 1 MΩ -1100 V max ~0,008 μA ~ 250 ns Τ = 470 μs 70 cm min. 78 cm max. AC Plateau regime Plateau regime RA Plateau regime RA x AC DRUCK PTX660 Metallic. INDIUM ~ 447 mm ~ 447 mm ~ 115 mm ~ 50 kg CE The directives covered by this declaration: 97/23/EEC Pressure Equipment directive (PED) Section ECC No. L 18158.1 from 09.07.1997 Test pressure 6 bar gauge pressure according to AD200. Bulletins 5D and W7 29 SHV 384 300 Anode Date Signature Firma Änderung CAD- TCD Maßstab Sachb. Gez. Marmotti Gepr. 20.12.2004 Marmotti Name Datum Querschnitt (Blatt 2) DENEX-300TN Oberflächenbehandlung 2 Sätze Pos. Teil Stück DIN 3141, REIHE 2 DIN ISO 1302 Datum Name 0,3 mm gebrochen Alle Kanten _______ DIN Mittel ____________ Freimaßtoleranz n. DIN ISO 2768 Index 8 Unterschrift Approvato 18,5 35 Data Datum Genehmigt Approved SMA 42 Id.Nr. Gehört zu Stückliste 00-300-04-UT-Qs2 Zeichnungs-Nr. DENEX Nachweis n. DIN 50049 DETEKTOREN FÜR NEUTRONEN UND RÖNTGENSTRAHLUNG GmbH Werkstoff 5.3 Detector Cross-Section Support 30 300 Y0 OPEN Y1 X1 Drift Änderung CAD- TCD 1:1 Maßstab Sachb. Gez. Gepr. Marmotti Marmotti 06.11.2004 Front and rear views DENEX-300TN Oberflächenbehandlung Name Datum Pos. Teil Stück DIN 3141, REIHE 2 DIN ISO 1302 Datum Name Alle Kanten _______ mm gebrochen DIN Mittel ____________ Freimaßtoleranz n. DIN ISO 2768 Index M4 Anode X0 Id.Nr. Gehört zu Stückliste 00-300-06-Frw Zeichnungs-Nr. DENEX Nachweis n. DIN 50049 DETEKTOREN FÜR NEUTRONEN UND RÖNTGENSTRAHLUNG GmbH Werkstoff 5.4 Detector Front and Rear Views CLOSE 300 M4 31 10 115 Index M8 Helicoll M8 Helicoll M8 Helicoll Änderung DIN Mittel ____________ Name CAD- TCD 1:1 4:1 Maßstab Oberflächenbehandlung 08.10.2005 Marmotti Sachb. Gepr. Marmotti Name Side view DENEX-300TN Gez. Datum Pos. Teil Stück DIN 3141, REIHE 2 DIN ISO 1302 Datum 0,3 mm gebrochen Alle Kanten _______ ~78 Freimaßtoleranz n. DIN ISO 2768 Nachweis n. DIN 50049 DETEKTOREN FÜR NEUTRONEN UND RÖNTGENSTRAHLUNG GmbH Id.Nr. Gehört zu Stückliste 00-300-06-TN-Sw Zeichnungs-Nr. DENEX Werkstoff 5.5 Detector Side view 447 M8 Helicoll M8 Helicoll M8 Helicoll M8 Helicoll M8 Helicoll 32