1
56
Process Control Features
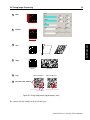
Axial Nonuniformity
≤ 0.06
≤ 0.08
≤ 0.10
≤ 0.12
> 0.12
Grade
A
B
C
D
F
Table A.4: Axial Nonuniformity grading.
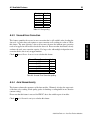
A.5.5
Grid Nonuniformity
This feature quantifies the deviation of the modules of the data code from their ideal grid. However, a bad value might also be caused by problems with the finder pattern, in which case the
“ideal grid” may not be positioned correctly.
Check
√
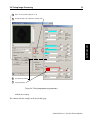
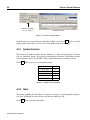
Grid Nonuniformity to calculate this feature.
Grid Nonuniformity
≤ 0.38
≤ 0.50
≤ 0.63
≤ 0.75
> 0.75
Grade
A
B
C
D
F
Table A.5: Grid Nonuniformity grading.
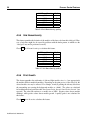
A.5.6
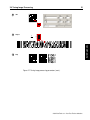
Print Growth
This feature quantifies the uniformity of dark and light module sizes, i.e., how appropriately
the modules fill their module boundaries. Depending on the print process of the data code, the
desired module size may be affected. For example, in ink-jet printing the ink may bleed into
the surrounding area causing the background modules to ‘shrink’. The values are calculated
for both horizontal and vertical module sizes (hence Print Growth X and Print Growth Y are
reported). The value 0.0 correlates to a module size of 100%. Negative values denote module
shrinkage, while positive values denote module growth. A quality grade is not calculated for
this feature.
Check
√
ActivDataCode / 2008-04-23
Print Growth to calculate this feature.