1
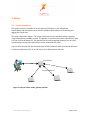
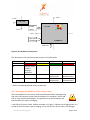
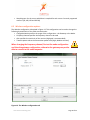
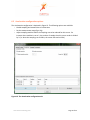
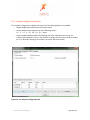
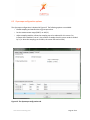
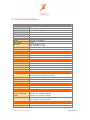
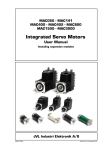
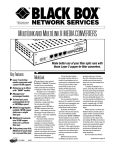
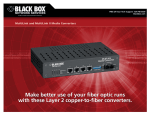
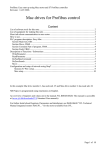
ProMove-2
Wireless Inertial and Orientation Sensor Platform
User Manual
v1.1
www.inertia-technology.com
Page 1 of 23
Table of contents
1
Introduction.................................................................................................................................3
2
Setup ............................................................................................................................................4
3
4
2.1
System description .......................................................................................................................... 4
2.2
Recharging the batteries of the sensor nodes................................................................................ 5
2.3
Installing the Gateway driver.......................................................................................................... 6
2.4
Installing the Visual-C redistributable ............................................................................................ 6
2.5
Installing the ProMove GUI............................................................................................................. 6
Graphical User Interface ............................................................................................................7
3.1
Data graphs...................................................................................................................................... 8
3.2
Control and info area ...................................................................................................................... 8
3.3
Menus .............................................................................................................................................. 9
Real-time data capture ..............................................................................................................10
4.1
Serial port selection and configuration .........................................................................................10
4.2
Logging to file .................................................................................................................................11
4.3
Finding the serial port of the Gateway..........................................................................................12
5
Visualization settings ................................................................................................................14
6
Wireless configuration ..............................................................................................................17
6.1
Global configuration options .........................................................................................................17
6.2
Wireless configuration options......................................................................................................18
6.3
Acceleration configuration options ...............................................................................................19
6.4
Compass configuration options .....................................................................................................20
6.5
Gyroscope configuration options ..................................................................................................21
7
Calibration.................................................................................................................................22
8
Technical Specifications ...........................................................................................................23
www.inertia-technology.com
Page 2 of 23
1 Introduction
The ProMove-2 is a highly miniaturized inertial sensor node that captures and communicates
wireless full 3-D motion and orientation information. It combines the latest advances in MEMS
sensor design and low-power wireless communication. Featuring a suite of modern inertial and
magnetic sensors, a dedicated microcontroller for application-specific software, and a separate
System-on-Chip (SoC) solution for wireless networking, ProMove-2 is a powerful, versatile
platform for motion sensing applications.
The sensor information provided by ProMove-2 consists of: 3-D acceleration, 3-D turn rate
(gyroscope) and 3-D magnetic field intensity (compass). The data is communicated using the 2.4
GHz wireless radio to a central node – the FastGateway, which connects through USB to a
computer. The data can be visualized in the ProMove GUI software and is logged for post-analysis.
Multiple ProMove-2 nodes can form a network and report the sensor data fully synchronized to
the FastGateway. The sampling rate scales with the number of nodes in the network and the
activated sensors, e.g. 200 Hz for all inertial sensors for 6 nodes, 100 Hz for 12 nodes.
ProMove-2 features additionally an RF power amplifier for extended coverage and improved
sensitivity and a mini-USB connector for charging the Li-Ion battery. Everything fits in a compact
casing of 65x50x30 mm.
www.inertia-technology.com
Page 3 of 23
2 Setup
2.1 System description
The system consists of a number of sensor nodes (the ProMove-2), the USB gateway
(FastGateway) and the Graphical User Interface (ProMove GUI) software for monitoring and
logging the inertial data.
The setup is depicted in Figure 1. The sensor nodes communicate wirelessly with the gateway,
using the proprietary FastMAC protocol. The gateway is connected via its mini-USB connector with
a PC that runs the ProMove GUI. The gateway can be easily recognized because it has no on/off
switch and has only two LEDs (whereas the sensor nodes have four LEDs).
Figure 2 shows the top-view and side-view layout of the ProMove-2 nodes, with the identification
of reference system axes (X-Y-Z), on/off switch, mini-USB connector and LEDs.
Fast Gateway
USB
Fastmac / 802.15.4
ProMove-2
ProMove-2
ProMove-2
Figure 1: Setup of sensor nodes, gateway and GUI
www.inertia-technology.com
Page 4 of 23
Y-axis +
X-axis +
Side-view
1
Top-view
On/Off
switch
Z-axis +
2
3
4
X-axis +
Mini-USB
connector
ProMove-2
Side-view
Figure 2: The ProMove-2 node layout
The description of the LEDs functionality is given in the table below.
LED
Colour
On
2
YELLOW
-
3
GREEN
-
4
RED
-
Blinking fast
1
RED
Charging, turns
off when
charging is
completed
-
For future use
Blinking slow
-
For future use
Communication
with sensors*
Communication
with sensors*
Wireless
communication*
Wireless
communication*
* Slow or fast blinking depends on the set data rate.
2.2 Recharging the batteries of the sensor nodes
The internal batteries of the sensor nodes should be periodically recharged using
their mini-USB connector, either from the USB ports of a computer / active USB
hub, or using standard USB chargers. The gateway has no internal battery and
therefore does not require recharging.
A red LED on the sensor nodes, marked as number 1 in Figure 2, indicates the charging status. It is
turned on while the sensor node is charging. It turns off once the sensor node is fully charged.
www.inertia-technology.com
Page 5 of 23
2.3 Installing the Gateway driver
The FTDI driver must be installed for the USB connection of the Gateway to the PC. There is a
setup application for the different ms-windows operating systems in the Drivers directory on the
installation CD. Windows7 can find the FTTD driver itself when it is connected to the internet.
2.4 Installing the Visual-C redistributable
The Visual-C redistributable is required for the ProMove GUI to run. This redistributable is
available as a setup application in the Drivers directory of the installation CD.
2.5 Installing the ProMove GUI
The ProMove GUI can be found in the ProMoveGUI folder on the installation CD. Copy the folder
ProMoveGUI from the CD to the hard drive of your PC. Double-click on the application
ProMoveGUI to launch the program.
www.inertia-technology.com
Page 6 of 23
3 Graphical User Interface
Figure 3 shows the Graphical User Interface (GUI). It is available for Microsoft Windows and for
recent versions of Ubuntu Linux. The GUI contains 10 Graphs that show by default the following
parameters:
• Acceleration on X, Y and Z axes
• Compass / magnetic field intensity on X, Y and Z axes
• Gyroscope / turn rate on X, Y and Z axes
• Signal strength (RSSI) information
A different line colour corresponds to a different sensor node in the network.
The Control and Info Area at the bottom right shows :
1. The Packet loss statistics panel, displaying:
a. The number of lost packets
b. The total number of packets received from the sensor nodes
c. The button for resetting the statistics
d. The drop-down menu for the Complete history
e. The drop-down menu for selection of one or All nodes
2. The Toolbox panel, used to control the data capturing, to zoom and pan the data
3. The reserved area for system messages
4. The legend with the corresponding colors for each sensor in the graphs
Figure 3: ProMove GUI with 2 nodes, Main window
www.inertia-technology.com
Page 7 of 23
3.1 Data graphs
In the default setting the following graphs are displayed from left to right and top to bottom:
•
•
•
•
•
•
•
•
•
•
Acceleration X
Acceleration Y
Acceleration Z
Compass X
Compass Y
Compass Z
Gyroscope X
Gyroscope Y
Gyroscope Z
RSSI (Received Signal Strength Indicator)
3.2 Control and info area
A close-up of the Control and Info Area is depicted in Figure 4.
Figure 4: The Control and Info Area window of the ProMove GUI
Packet loss statistics
The drop-down menu Complete history selects between statistics for One minute or for the
Complete history. The All nodes drop-down menu gives the option to monitor the statistics of one
node or all nodes. The statistics can be reset by pushing the Reset statistics button. After changing
the sensor configuration, it is recommended to reset the statistics.
Toolbox
Push █ to Stop capturing and ►to Start capturing. The Zoom slider zooms in or out the data
displayed in the graphs. The Pan X option enables shifting the data displayed in the graphs to left
or right.
Legend
The legend window shows which line color is used for each sensor node in the graphs.
www.inertia-technology.com
Page 8 of 23
System messages
The system messages are displayed in the reserved area.
3.3 Menus
There are four top menus: File, Options, View and Help. The File menu has the menu items
Capture, for setting the data capture configuration, and Exit to quit the GUI. The Options menu has
the menu item Wireless configuration, which configures the sensor and the wireless connection
parameters. The View menu has the menu items Config, for the configuration of the graphs, and
Clear all graphs, for clearing the graph windows. The Help menu has the items Manual, for a copy
of the users manual, and About, with the revision information for the ProMoveGUI.
The menus and functionality are further described in the following sections.
www.inertia-technology.com
Page 9 of 23
4 Real-time data capture
The File-Capture menu enables the real-time data capturing and logging to files.
Figure 5: The File-Capture window
4.1 Serial port selection and configuration
The serial port (COM) must be set for the ProMove GUI. See section 4.3 for an
example on how to find the correct serial port. For COM ports higher than 9, type in
directly the COM number in the drop box . It is recommended to use the default
settings for Baudrate and Flow control.
Use the Start and Stop buttons to start and stop receiving data. A previous serial connection will
be removed after pressing the Remove button.
www.inertia-technology.com
Page 10 of 23
4.2
Logging to file
Data logging is performed in real-time, in parallel with plotting the graphs. Log files can optionally
be split in separate files per sensor node. Data logging is done in comma-separated values file
format, with the following fields on each line:
•
•
•
•
•
•
•
•
•
•
•
•
timestamp: a 16 bit timestamp
node-id: the node id
ax: the x-value of the acceleration
ay: the y-value of the acceleration
az: the z-value of the acceleration
cx: the x-value of the compass
cy: the y-value of the compass
cz: the z-value of the compass
gx: the x-value of the gyroscope
gy: the y-value of the gyroscope
gz: the z-value of the gyroscope
rssi: the RSSI value of the last received packet
Note that there can be empty values in a log file, since not all sensors sample at the
same rate. The sampling rate can be adjusted separately per sensor type (see section
6). The compass sensor has an internal maximal sampling rate of 50 Hz, so only one
out of four values is actually sampled when the global sampling rate is set at 200Hz.
Additionally, the RSSI information is relevant for one out of seven samples.
To enable logging, tick the box Logging enabled and select the type of logging:
• Global file for one file with all the nodes data
• One file per node for one file per senor node
For the Logfile creation method there are the following options:
• Overwrite: the existing file is overwritten
• Append: data is added after the last entry in the current file
• Auto-number: all created files are numbered in sequence
In the Logging filename field, the filename for the log should be given.
www.inertia-technology.com
Page 11 of 23
4.3
Finding the serial port of the Gateway
The serial port used by the ProMove Gateway must be specified in the GUI. After plugging in the
ProMove Gateway on one of the USB connections of your computer, you need to get the number
of this serial port.
As an example, for Windows 7 Home Premium, go to Menu Start and select peripherals and
printers. A list of all connected equipment will appear.
The
Gateway
Figure 6: Finding the serial port
www.inertia-technology.com
Page 12 of 23
Select the FT232 USB UART, click right, and select Properties from the menu.
It is connected
to COM17
Figure 7: Properties of the serial port
www.inertia-technology.com
Page 13 of 23
5 Visualization settings
The View-Config menu shows the various options for visualization.
Figure 8: View configuration, Global tab
Tick the box to set Auto scaling on the Y axis.
Select Black or the White for the background colour.
Select Lines or Points for the type of Graph you prefer.
Select the Graph update speed by moving the slider between the Fast and Slow markers.
Choose Apply to make the changes or choose Close to exit while discarding all changes.
www.inertia-technology.com
Page 14 of 23
Select the Node tab:
Figure 9: View configuration, Node tab
The line color for each node can be changed by selecting the node number and pressing the color
button after Line color.
www.inertia-technology.com
Page 15 of 23
Select the Graph tab.
Figure 10: View configuration, Graph tab.
The Graph number corresponds to the graph windows seen in the ProMove GUI from left to right
and top to bottom.
Select the Graph number and then the Sensor type you would like to see in that graph window.
You can add your own label by typing a text in the box Y-axis label.
www.inertia-technology.com
Page 16 of 23
6 Wireless configuration
The configuration of the sensor nodes can be changed wirelessly. All configurable options are
accessible via the Options-Wireless configuration menu.
The changes made through wireless configuration are not permanent. This means that
once the nodes are powered off and back on, the default settings are automatically
reloaded on the sensor nodes.
6.1 Global configuration options
Figure 11: The Global configuration tab
Press the Get button. The received result is shown in the Received Configurations panel. Double
clicking on a line loads the result in the settings window. The default settings are restored by
pushing the Set Default button.
The following parameters can be changed in the Global configuration window:
• Global data sampling: Overall sampling is enabled. If switched off, no data is sampled
• Global wireless transmit: Can be switched off to stop receiving data
www.inertia-technology.com
Page 17 of 23
•
Sampling rate: Set the rate at which data is sampled for each sensor. Currently supported
rates are [50, 100, 150 and 200 Hz]
6.2 Wireless configuration options
The Wireless configuration is depicted in Figure 12. This configuration can be used to change the
following characteristics of the radio communication:
• Config destination specifies the target of the configuration – the Gateway or the Nodes
• Frequency channel specifies the frequency channel to be used
• Gain specifies the sensitivity of the receiver (High gain is recommended)
• Transmit power selects the transmission power level [High, Medium and Low]
When changing the frequency channel, first set the node configuration
and then the gateway configuration, otherwise the gateway may not be
able to connect to the nodes anymore.
Figure 12: The Wireless configuration tab
www.inertia-technology.com
Page 18 of 23
6.3 Acceleration configuration options
The Acceleration configuration is depicted in Figure 13. The following options are available:
•
Enable sampling and transmission of acceleration
•
Set the measurement range (2g or 6g)
•
Adjust sampling modulus allows the sampling rate to be reduced for this sensor. For
instance when modulus is set to 2, the number of samples that this sensor sends is divided
by 2 (i.e. when the sampling rate is 100Hz, the sensor will send at 50Hz)
Figure 13: The Acceleration configuration tab
www.inertia-technology.com
Page 19 of 23
6.4 Compass configuration options
The Compass configuration is depicted in Figure 14. The following options are available:
•
Enable sampling and transmission of compass values
•
Set the measurement range to one of the following values:
0.7 1 1.5 2 3.2 3.8 4.5 6.5 Gauss
•
Adjust sampling modulus allows the sampling rate to be reduced for this sensor. For
instance when modulus is set to 2, the number of samples that this sensor sends is divided
by 2 (i.e. when the sampling rate is 100Hz, the sensor will send at 50Hz)
Figure 14: The Compass configuration tab
www.inertia-technology.com
Page 20 of 23
6.5 Gyroscope configuration options
The Gyroscope configuration is depicted in Figure 15. The following options are available:
•
Enable sampling and transmission of gyroscope values
•
Set the measurement range (2000°/s or 440°/s)
•
Adjust sampling modulus, allows the sampling rate to be reduced for this sensor. For
instance when modulus is set to 2, the number of samples that this sensor sends is divided
by 2 (i.e. when the sampling rate is 100Hz, the sensor will send at 50Hz)
Figure 15: The Gyroscope configuration tab
www.inertia-technology.com
Page 21 of 23
7 Calibration
All sensors are factory calibrated. For improved performance and adaptation to the specific
experimental environment, we recommend to perform:
•
Custom compass calibration of the offset and scale values, by using for example the
method presented in [1].
•
Custom gyroscope calibration of the offset values, by collecting a short data log in still
position.
[1] Caruso, M. J., 2000, Applications of magnetic sensors for low cost compass systems. IEEE
Position Location and Navigation Symposium, pp. 177–184
www.inertia-technology.com
Page 22 of 23
8 Technical Specifications
Accelerometer
Range
Resolution
Sensitivity
Non-linearity
Cross-axis
Calibration
Gyroscope
Range
Non-linearity
Resolution
±2 g / ±6 g
1 mg @ ±2 g range
1024 LSb/g @ ±2 g range
±2 %FS
±3.5 %
On-chip factory calibration
Dual 440 °/s and 2000 °/s
<1 %FS
0.21 °/s @ 440 °/s range
0.98 °/s @ 2000 °/s range
±1 %
On-chip factory calibration
Cross-axis
Calibration
Compass
Range
±4.5 Gauss
Resolution
7 mGauss
Cross-axis
±0.2 %FS/Gauss
Wireless communication
Frequency band
2.4 GHz
Data rate
250 kbps
TX power
Selectable, max. 22 dBm
RX sensitivity
11 dB high-gain, 1 dB low-gain
Range
> 50 m at max. TX power
Data collection
Sampling rate
Scales with the number of nodes in the network
200 Hz for 6 nodes, 100 Hz for 12 nodes
Synchronization
< 6 μs
Wired interface
USB 2.0 full-speed compatible
Storage
128 Mbit Flash memory
Software and accessories
Visualization software ProMove GUI (runs on Windows 7/Vista/XP/2000, Ubuntu Linux)
Gateway
FastGateway, with USB interface
Electrical characteristics
Power consumption in 275 mW - max. TX power, high-gain
real-time streaming
260 mW - max. TX power, low-gain
mode
210 mW - min. TX power, low-gain
Battery
3.7 V / 950 mAh rechargeable
> 10 h operation at max. TX power
Form factor
Dimensions
65x50x30 mm
Weight
70g (with enclosure)
www.inertia-technology.com
Page 23 of 23