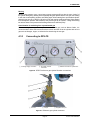
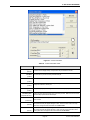
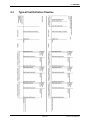
1
GFS2102™ Gravimetric Flow Standard Operation and Maintenance Manual © 2011 Fluke Calibration Warning High pressure liquids and gases are potentially hazardous. Energy stored in these liquids and gases can be released unexpectedly and with extreme force. High pressure systems should be assembled and operated only by personnel who have been instructed in proper safety practices. Caution While the thermodynamic properties of a variety of gases can be supported by the molbox/molbloc, Fluke Calibration does not advocate the use of toxic, flammable, oxidizing, or other highly hazardous gases with the GFS system. The GFS system should be operated only by personnel who have been instructed in proper safety practices for compressed gases and are familiar with the Material Safety Data Sheets (MSDS) of the gases being used. © 2011 Fluke Calibration All rights reserved. Information in this document is subject to change without notice. No part of this document may be reproduced or transmitted in any form or by any means, electronic or mechanical, for any purpose, without the express written permission of Fluke Calibration, 4765 East Beautiful Lane, Phoenix, Arizona 85044-5318 USA. Fluke Calibration makes sincere efforts to ensure the accuracy and quality of its published materials; however, no warranty, expressed or implied, is provided. Fluke Calibration disclaims any responsibility or liability for any direct or indirect damages resulting from the use of the information in this manual or products described in it. Mention of any product or brand does not constitute an endorsement by Fluke Calibration of that product or brand. This manual was originally composed in English and was subsequently translated into other languages. The fidelity of the translation cannot be guaranteed. In case of conflict between the English version and other language versions, the English version predominates. Products described in this manual are manufactured under international patents and one or more of the following U.S. patents: 5,142,483, 5,257,640, 5,331,838, 5,445,035. Other U.S. and international patents pending. Fluke Calibration, FCAL, DH, DHI, GFS2102, GFS Tools, AMH, LCM, MFC-CB, molbloc and molbox are trademarks, registered and otherwise, of Fluke Corporation. Swagelok and Nupro are registered trademarks of the Swagelok Company. Krytox is a registered trademark of the Dupont de Nemours Company. Windows, Excel, Word are registered trademarks of the Microsoft Corporation. Products described in this manual are manufactured under international patents and one or more of the following U.S. patents: 6,701,791, 5,142,483, 5,257,640, 5,331,838, 5,445,035. Other U.S. and international patents pending. Document No. 3889628 110824 Printed in the USA © 2011 Fluke Calibration Page II Table of Contents Table of Contents ................................................................. III Tables ................................................................................. IX Figures ................................................................................ XI Ab o u t T h i s M a n u a l . . . . . . . . . . . . . . . . . . . . . . . . . . . . . . . . . . . . . . . . . . . . . . . . . . . . . . . . . . . . . . . X V 1. Introduction .....................................................................1 1.1 Specifications ......................................................................................................................................... 1 1.1.1 1.1.2 1.1.3 1.1.3.1 1.1.3.2 1.1.3.3 1.1.3.4 1.1.3.5 1.1.4 1.1.5 2. System Overview .............................................................. 5 2.1 2.2 Balance and AMH-GFS2102 .................................................................................................................. 6 Reference Gas Cylinder Assembly ....................................................................................................... 8 2.2.1 2.2.2 2.2.3 2.2.4 2.2.5 3. GFS2102 General Specifications ............................................................................................................ 1 GFS2102 Mass Balance Specifications .................................................................................................. 2 LCM Ambient Conditions Measurement Specifications ........................................................................ 2 PRT Balance Ambient Temperature Measurement ................................................................................ 2 TH Probe Reference Gas Cylinder Surroundings Ambient Condition Measurement ............................... 2 Infrared Probe Reference Gas Cylinder Surface Temperature Measurement ......................................... 2 Ambient Conditions Measurement ......................................................................................................... 2 Balance Reading Time Measurement .................................................................................................... 2 MFC-CB Specifications ............................................................................................................................ 3 Flow Measurement Specifications .......................................................................................................... 3 Reference Gas Cylinder ........................................................................................................................... 8 Cylinder Support .................................................................................................................................... 10 Reference Gas Cylinder Connector ...................................................................................................... 10 Regulator Assembly............................................................................................................................... 11 Reference Gas Cylinder Case................................................................................................................ 12 2.3 GFS Draft Enclosure and Vibration Isolation Table .......................................................................... 12 2.4 Laboratory Conditions Monitor (LCM) ................................................................................................ 14 2.5 MFC-CB ................................................................................................................................................. 14 2.6 GFS Tools ............................................................................................................................................. 14 2.7 Heat Exchanger .................................................................................................................................... 14 2.8 GFS-FS Reference Gas Cylinder Fill Station...................................................................................... 14 2.9 Mass flow controllers .......................................................................................................................... 15 2.10 molbloc molstics .................................................................................................................................. 15 2.11 Mass Set ................................................................................................................................................ 16 Installation ..................................................................... 17 3.1 Unpacking and Inspection................................................................................................................... 17 3.1.1 3.1.2 3.1.3 3.1.4 3.1.5 3.1.6 3.1.7 3.1.8 3.1.9 Granite Vibration Isolation Table and Stand ........................................................................................ 18 GFS Draft Enclosure and System Accessories .................................................................................... 18 Laboratory Conditions Monitor ............................................................................................................. 19 MFC-CB................................................................................................................................................... 20 GFS-FS Reference gas cylinder Fill Station ......................................................................................... 20 GFS Mass Balance ................................................................................................................................. 21 AMH-GFS2102 ........................................................................................................................................ 21 Reference Gas Cylinder Assemblies..................................................................................................... 22 System Controller .................................................................................................................................. 23 Page III © 2011 Fluke Calibration GFS2102™ OPERATION AND MAINTENANCE MANUAL 3.1.10 3.1.11 3.2 Site Requirements ................................................................................................................................ 25 3.2.1 3.2.2 3.3 Position the Vibration Isolation Table .................................................................................................. 28 Install Draft Enclosure on Vibration Isolation Table ............................................................................ 28 Setup LCM .............................................................................................................................................. 30 Setup MFC-CB ........................................................................................................................................ 30 Set up the System Controller (PC) ........................................................................................................ 31 Verify GFS Calibration Data................................................................................................................... 31 Assemble Reference Gas Cylinder(s) ................................................................................................... 32 Enter Reference Gas Cylinder Data ...................................................................................................... 34 Installation of Reference Mass on Mass Plate ..................................................................................... 34 Initial Balance and AMH Base Setup .................................................................................................... 36 Setup balance location .......................................................................................................................... 38 AMH Position Fine Adjustment ............................................................................................................. 38 Setup Probe Locations .......................................................................................................................... 41 Prepare The Heat Exchanger................................................................................................................. 42 Connect the DUT Flow Path .................................................................................................................. 43 Connect Gas Conveyance Loop ............................................................................................................ 43 Operation ....................................................................... 45 4.1 General Operating Principles .............................................................................................................. 45 4.1.1 4.1.2 4.1.3 4.1.4 4.1.4.1 4.1.4.2 4.1.4.3 4.1.5 4.1.5.1 4.2 4.3 Reading the Balance .............................................................................................................................. 50 AMH Operation ....................................................................................................................................... 51 Balance Zero and Span Adjustment ..................................................................................................... 51 Reference Gas Cylinder Filling ........................................................................................................... 51 4.3.1 4.3.2 4.3.3 4.3.4 4.4 GFS2102 Measurement Principle .......................................................................................................... 45 Gas Dependent Mass Ranges and Cylinder Size Selection ................................................................ 46 AutoZero ................................................................................................................................................. 48 GFS2102 Data Collection Methods And Conventions ......................................................................... 48 Accumulations ..................................................................................................................................... 48 Samples ............................................................................................................................................... 48 Averages And Best Fits........................................................................................................................ 49 Settings for Flow Sampling ................................................................................................................... 49 Setting Up Starting and Ending Sample Tolerance .............................................................................. 50 Manual GFS Tools Operation .............................................................................................................. 50 4.2.1 4.2.2 4.2.3 Transporting the Reference Gas Cylinder Assembly........................................................................... 52 Draining, Evacuating and Rinsing ........................................................................................................ 52 Connecting to GFS-FS ........................................................................................................................... 53 Filling the Cylinder ................................................................................................................................. 54 Considerations for Making Reliable Measurements ......................................................................... 56 4.4.1 4.4.2 4.4.3 4.4.4 4.4.4.1 4.4.4.2 4.4.4.3 4.4.5 5. GFS2102 system .................................................................................................................................... 25 GFS-FS Reference Gas Cylinder Fill Station ........................................................................................ 26 Setup ..................................................................................................................................................... 28 3.3.1 3.3.2 3.3.3 3.3.4 3.3.5 3.3.6 3.3.7 3.3.8 3.3.9 3.3.10 3.3.11 3.3.12 3.3.13 3.3.14 3.3.15 3.3.16 4. MS-2102-0.7 Mass Set ............................................................................................................................ 24 molstics .................................................................................................................................................. 24 Cooling and Condensation at High Flow.............................................................................................. 56 Stability of Ambient Conditions ............................................................................................................ 56 Comparing Reference and DUT Measurements Using Flow Vs. Mass Calculations ......................... 57 Leaks....................................................................................................................................................... 57 Leak Test Option in a Test Definition ................................................................................................... 58 Semi-Automated Leak Test .................................................................................................................. 58 Semi-Automated Leak Test to Manual Isolation Point .......................................................................... 59 Flow Control and Stability ..................................................................................................................... 60 GFS Tools Software ........................................................ 61 5.1 Main Display and Features .................................................................................................................. 61 5.1.1 5.1.2 5.1.2.1 5.1.2.2 5.1.2.3 5.1.2.4 5.1.2.5 5.1.2.6 5.1.3 5.1.4 5.1.4.1 © 2011 Fluke Calibration Overview ................................................................................................................................................. 61 Main Menu Bar ....................................................................................................................................... 61 [Run] .................................................................................................................................................... 61 [Setup] ................................................................................................................................................. 62 [Tools] .................................................................................................................................................. 62 [Data] ................................................................................................................................................... 62 [Window] .............................................................................................................................................. 63 [Help] ................................................................................................................................................... 63 Status Bar ............................................................................................................................................... 63 Main Toolbar .......................................................................................................................................... 64 Run Test Tools..................................................................................................................................... 64 Page IV TABLE OF CONTENTS 5.1.4.2 Run Display Tools ................................................................................................................................ 64 5.1.4.3 Data Acquisition Tools ......................................................................................................................... 66 5.1.5 Run Screens ........................................................................................................................................... 68 5.1.5.1 Overview .............................................................................................................................................. 68 5.1.5.2 GFS Run Screen .................................................................................................................................. 68 5.1.5.3 GFS Diagnostics Run Screen .............................................................................................................. 73 5.1.5.4 Balance Output Run Screen................................................................................................................. 74 5.1.5.5 Ambient Conditions Run Screen .......................................................................................................... 75 5.1.5.6 DUT/Reference Comparison Run screen ............................................................................................. 76 5.1.5.7 Device Output Run Screen................................................................................................................... 78 5.1.5.8 Spy Windows ....................................................................................................................................... 78 5.1.5.9 molbox Output Run Screen .................................................................................................................. 79 5.1.5.10 Tare molbox ......................................................................................................................................... 81 5.1.5.11 MFC-CB Run Screen ........................................................................................................................... 82 5.1.5.12 Data Grid Run screen .......................................................................................................................... 83 5.1.5.13 Data Plot Run Screen .......................................................................................................................... 84 5.2 [Tools] Menu ......................................................................................................................................... 85 5.2.1 5.2.2 5.2.2.1 5.2.2.2 5.2.2.3 5.2.2.4 5.2.2.5 5.2.3 5.2.4 5.2.5 5.2.6 5.2.7 5.3 [Data] Menu ........................................................................................................................................... 95 5.3.1 5.3.2 5.3.3 5.3.3.1 5.3.3.2 5.3.3.3 5.3.3.4 5.3.4 5.4 Overview ................................................................................................................................................. 95 [View Data File] ...................................................................................................................................... 95 [Plot Data] ............................................................................................................................................... 96 Plot Toolbar.......................................................................................................................................... 97 Plot Options Menu................................................................................................................................ 98 Create/Edit Plots .................................................................................................................................. 98 Plot Points...........................................................................................................................................100 [Report Data] .........................................................................................................................................102 Data Files ............................................................................................................................................ 102 5.4.1 5.4.2 5.4.3 5.4.4 5.5 Overview ................................................................................................................................................. 85 [Options] ................................................................................................................................................. 85 [Run Test] tab ...................................................................................................................................... 85 [Initialize test] tab ................................................................................................................................. 87 [End Test] tab ...................................................................................................................................... 88 [Data File] tab....................................................................................................................................... 90 [Data Grid] Tab .................................................................................................................................... 91 [Unit of Measure Converter] .................................................................................................................. 93 [Remote Communications].................................................................................................................... 93 [Process Gas Editor].............................................................................................................................. 94 [Change GFS AMH State]....................................................................................................................... 94 [PC Timer Calibration] ........................................................................................................................... 95 Overview ................................................................................................................................................102 Data File Creation..................................................................................................................................103 Naming and Storing Data Files ............................................................................................................103 Data File Structure ................................................................................................................................104 [Setup] Menu....................................................................................................................................... 105 5.5.1 5.5.1.1 5.5.1.2 5.5.2 5.5.2.1 5.5.2.2 5.5.2.3 5.5.2.4 5.5.2.5 5.5.2.6 5.5.2.7 5.5.2.8 5.5.2.9 5.5.3 5.5.3.1 5.5.3.2 5.5.3.3 5.5.3.4 5.5.3.5 5.5.3.6 5.5.4 5.5.5 5.5.6 5.5.6.1 5.5.6.2 5.5.6.3 5.5.6.4 Overview ................................................................................................................................................105 Setup Selector ....................................................................................................................................106 Editor Toolbar .....................................................................................................................................106 [Setup], [Test] ........................................................................................................................................108 Creating test definitions .......................................................................................................................108 Editing test definitions .........................................................................................................................109 Test Point Sequence ...........................................................................................................................109 [Pre-Test] Tab .....................................................................................................................................109 [Control] ..............................................................................................................................................111 [Data] ..................................................................................................................................................112 [AutoZero] ...........................................................................................................................................114 [Options] .............................................................................................................................................115 [Comment] ..........................................................................................................................................116 [DUT ] .....................................................................................................................................................117 [Header] Tab .......................................................................................................................................117 [Calibration] Tab ..................................................................................................................................119 [Communications] Tab ........................................................................................................................121 Remote Command Editor....................................................................................................................123 [Output] Tab ........................................................................................................................................128 [Comment] Tab ...................................................................................................................................131 [Support Hardware]...............................................................................................................................132 [Reference Gas Cylinder]......................................................................................................................132 [Configuration] ......................................................................................................................................134 [System] ..............................................................................................................................................134 GFS AMH ...........................................................................................................................................136 [limits] .................................................................................................................................................137 [LCM] ..................................................................................................................................................138 Page V © 2011 Fluke Calibration GFS2102™ OPERATION AND MAINTENANCE MANUAL 5.5.6.5 5.5.6.6 5.5.7 5.5.7.1 5.5.7.2 5.5.7.3 5.5.7.4 5.5.7.5 5.5.7.6 5.6 [RUN] Modes ....................................................................................................................................... 146 5.6.1 5.6.2 5.6.3 5.7 Overview ................................................................................................................................................154 Errors .....................................................................................................................................................155 Tolerance ...............................................................................................................................................156 AutoZero Correction .............................................................................................................................156 Reference Cylinder Buoyancy ..............................................................................................................157 Fully Compensated Mass .....................................................................................................................159 Average Flow .........................................................................................................................................159 Best Fit Flow .........................................................................................................................................160 Integrated Mass.....................................................................................................................................161 %Reading GFS Tolerance, Starting and Ending .................................................................................161 Sample Rate ..........................................................................................................................................163 G e n e r a l M a i n t e n a n c e , Ad j u s t m e n t s , a n d S t o r a g e . . . . . . . . . . . . . 1 6 5 6.1 Summary ............................................................................................................................................. 165 6.2 AMH-GFS2102 Plate Positioning Posts Lubrication ....................................................................... 165 6.3 Reference Gas Cylinder Alignment................................................................................................... 166 6.3.1 6.3.2 Check Reference Gas Cylinder Alignment ..........................................................................................166 Alignment of the Reference Gas Cylinder ...........................................................................................167 6.4 Preparing the Reference Gas Cylinder Assembly for Shipment or Long Term Storage .............. 168 6.5 Reference Gas Cylinder Hydrostatic Testing ................................................................................... 169 6.6 Removing or Reassembling the Cylinder Carrier ............................................................................ 170 6.6.1 6.6.2 7. RUN TEST ..............................................................................................................................................147 Run Manual Test ...................................................................................................................................152 Run Diagnostic Test .............................................................................................................................154 Calculations ........................................................................................................................................ 154 5.7.1 5.7.2 5.7.3 5.7.4 5.7.5 5.7.6 5.7.7 5.7.8 5.7.9 5.7.10 5.7.11 6. [Balance] .............................................................................................................................................139 [Interface] ............................................................................................................................................140 [Calibration] ...........................................................................................................................................141 [TIME/MASS] ......................................................................................................................................141 [AMBIENT] ..........................................................................................................................................142 [TH PROBE #2]...................................................................................................................................144 [TH PROBE #3]...................................................................................................................................145 [EXTERNAL PRT] ...............................................................................................................................145 [IR PROBE] .........................................................................................................................................146 Removing the Cylinder Carrier .............................................................................................................170 Reassembling the Carrier to the Cylinder ...........................................................................................170 6.7 Check/Change Fluid in Heat Exchanger .......................................................................................... 171 6.8 Relevel System Surfaces ................................................................................................................... 171 6.9 Leak Check the Flow Path ................................................................................................................. 171 Maintenance of Traceability and Recalibration ................ 173 7.1 Principles of GFS2102 Traceability Maintenance ............................................................................ 173 7.2 [PC Timer Calibration] ....................................................................................................................... 173 7.3 molbox AutoZ and Tare Operations ................................................................................................. 173 7.4 Reference Mass Recalibration .......................................................................................................... 173 7.5 Laboratory Conditions Monitor (LCM) Recalibration ...................................................................... 174 7.5.1 7.5.2 7.5.3 7.5.3.1 7.5.3.2 7.5.3.3 7.5.3.4 7.5.3.5 7.5.4 7.5.4.1 7.5.4.2 7.5.4.3 7.5.4.4 7.5.5 7.5.5.1 © 2011 Fluke Calibration Overview ................................................................................................................................................174 As Received Data Review .....................................................................................................................175 LCM Time Verification or Adjustment ..................................................................................................175 Principle ..............................................................................................................................................175 LCM Time Verification .........................................................................................................................175 LCM Time Adjustment.........................................................................................................................176 Equipment Required ...........................................................................................................................176 Operation ............................................................................................................................................176 Ambient P, T, H Sensor Adjustment ....................................................................................................177 Principle ..............................................................................................................................................177 Enclosure Pressure Sensor.................................................................................................................179 Ambient Temperature Sensor (If Present) ...........................................................................................179 Relative Humidity Sensor (If Present) .................................................................................................180 TH Probe Adjustment ............................................................................................................................181 TH Probe Temperature Sensor ...........................................................................................................181 Page VI TABLE OF CONTENTS 7.5.5.2 7.5.6 7.5.7 7.5.8 7.5.9 7.5.10 7.6 molbox Recalibration ......................................................................................................................... 188 7.7 MFC-CB Recalibration ....................................................................................................................... 188 7.8 Balance Recalibration ........................................................................................................................ 188 7.8.1 7.8.2 7.8.3 8. Internal Balance Calibration .................................................................................................................188 GFS Tools Zero and Span Calibration .................................................................................................188 Verification by Mass Carrier .................................................................................................................189 Troubleshooting ........................................................... 191 8.1 9. TH Probe Relative Humidity Sensor ....................................................................................................182 External PRT Temperature Adjustment ...............................................................................................183 Infrared (T5) Cylinder Temperature Adjustment..................................................................................184 Standard Resistor Measurement and Adjustment ..............................................................................185 LCM Remote Command for Automation..............................................................................................187 LCM Front Panel Display modification ................................................................................................187 Overview ............................................................................................................................................. 191 Ap p e n d i x . . . . . . . . . . . . . . . . . . . . . . . . . . . . . . . . . . . . . . . . . . . . . . . . . . . . . . . . . . . . . . . . . . . . . . 1 9 3 9.1 Glossary .............................................................................................................................................. 193 9.2 Typical Test Setups ............................................................................................................................ 194 9.3 Typical Test Definition Timeline........................................................................................................ 195 9.4 GFS Electrical Schematic .................................................................................................................. 196 9.5 GFS Pneumatic Schematic ................................................................................................................ 197 9.6 Limited Warranty and Limitation of Liability .................................................................................... 198 Page VII © 2011 Fluke Calibration GFS2102™ OPERATION AND MAINTENANCE MANUAL Notes © 2011 Fluke Calibration Page VIII TABLES AND FIGURES Tables Table 1. GFS2102 packing list ................................................................................................................... 17 Table 2. Draft enclosure and system accessories list ................................................................................ 19 Table 3. LCM parts list ................................................................................................................................ 20 Table 4. MFC-CB parts list. ......................................................................................................................... 20 Table 5. GFS-FS fill station parts list ........................................................................................................... 21 Table 6. GFS mass balance parts list ........................................................................................................ 21 Table 7. AMH-GFS2102 parts list ............................................................................................................... 22 Table 8. Reference gas cylinder assemblies’ parts lists ............................................................................ 22 Table 9. European Reference gas cylinder assemblies’ parts lists ............................................................ 23 Table 10. MS-2102-0.7 mass set parts list................................................................................................. 24 Table 11. Molstic Parts List ........................................................................................................................ 24 Table 12: Maximum mass available for flow testing for various GFS2102 supported gases. .................... 47 Table 13. Main Toolbar, Run Test Tools .................................................................................................... 64 Table 14. Main Toolbar, Run Display Tools ............................................................................................... 65 Table 15. <Control> Toolbar, Data Acquisition Options ............................................................................. 66 Table 16. GFS Control Panel Fields........................................................................................................... 70 Table 17. GFS System Display Fields ........................................................................................................ 71 Table 18. GFS Control Toolbar icons .......................................................................................................... 72 Table 19. GFS Diagnostics Fields .............................................................................................................. 73 Table 20. Balance Output Run Screen Fields ........................................................................................... 75 Table 21. GFS Ambient Conditions Run Screen Fields ............................................................................ 76 Table 22. DUT/Reference Comparison Run Screen Fields ...................................................................... 77 Table 23. Spy Window Information ............................................................................................................ 79 Table 24. <molbox Output> Run Screen Fields ......................................................................................... 80 Table 25. Tare molbox Fields ..................................................................................................................... 82 Table 26. MFC CB Fields ........................................................................................................................... 83 Table 27. Options, [Run Test] Tab Fields .................................................................................................. 86 Table 28. Options, [Initialize Test] Tab Fields ............................................................................................ 88 Table 29. Options, [End Test] Tab Fields ................................................................................................... 89 Table 30. Options, [Data File] Tab Fields ................................................................................................... 90 Table 31. Options, [Data Grid] Tab Selections ........................................................................................... 92 Table 32. Data File Viewer Options ............................................................................................................ 96 Table 33. Data Plot Toolbar ....................................................................................................................... 97 Table 34. Custom Plot Editor Fields ........................................................................................................... 99 Table 35. Plot Points General Tab Fields................................................................................................. 101 Table 36. Plot Points Best Fit Tab Fields ................................................................................................. 102 Table 37. Data Files Types ...................................................................................................................... 102 Table 38. Data File Data Field Optional Selections .................................................................................. 104 Table 39. Data File Structure ................................................................................................................... 105 Table 40. Editor Toolbar Features ........................................................................................................... 107 Table 41. Test Editor, [Pre-Test] Tab, <Leak Test> Fields ...................................................................... 110 Table 42. Test Definition Editor, Point Sequence Tab, [General] Child Tab Fields ................................. 111 Table 43. Test Definition Editor [Data] Tab Fields ................................................................................... 113 Table 44. Test Definition Editor [AutoZero] Tab Fields ............................................................................ 115 Table 45. Test Definition Editor [Options] Tab Fields ............................................................................... 116 Table 46. DUT Editor, [Header] Tab Fields .............................................................................................. 118 Page IX © 2011 Fluke Calibration GFS2102™ OPERATION AND MAINTENANCE MANUAL Table 47. Table 48. Table 49. Table 50. Table 51. Table 52. Table 53. Table 54. Table 55. Table 56. Table 57. Table 58. Table 59. Table 60. Table 61. Table 62. Table 63. Table 64. Table 65. Table 66. Table 67. Table 68. Device Editor, [Calibration] Tab Fields ..................................................................................... 120 Device Editor, [Communications] Tab Fields .......................................................................... 122 Remote Command Editor, [Command] Tab Fields .................................................................. 126 Remote Command Editor, [Global Settings] Tab Options ....................................................... 127 DUT Editor, [Output] Tab Fields ............................................................................................... 129 Tolerance Type Choices .......................................................................................................... 130 Device Type Options ................................................................................................................ 132 Reference Cylinder Editor Fields .............................................................................................. 133 GFS Configuration Editor [System] Tab Fields ........................................................................ 135 GFS Configuration Editor [GFS AMH] Tab Fields .................................................................... 136 GFS Configuration Editor [Limits] Tab Fields ........................................................................... 137 GFS Configuration Editor [LCM] Tab Fields ............................................................................. 138 GFS Configuration Editor [Balance] Tab .................................................................................. 140 GFS Configuration Editor [Interface] Tab Fields ...................................................................... 141 Calibration Editor [Time/Mass] Tab Fields ............................................................................... 142 Calibration Editor [Ambient] Tab Fields .................................................................................... 143 Calibration Editor [TH Probe #2] and [TH Probe #3] Tab Fields .............................................. 144 Calibration Editor [External PRT] Tab Fields ........................................................................... 146 Calibration Editor [IR Probe T5] Tab Fields ............................................................................. 146 Mechanical maintenance procedures ...................................................................................... 165 Troubleshooting checklist......................................................................................................... 191 Fluke Calibration Authorized Service Providers ....................................................................... 199 © 2011 Fluke Calibration Page X TABLES AND FIGURES Figures Figure 1. GFS2102 system .......................................................................................................................... 5 Figure 2. Reference gas cylinder resting on GFS balance and AMH-GFS2102 .......................................... 6 Figure 3. AMH reference mass plate ........................................................................................................... 7 Figure 4. Custom mass tray supporting the reference gas cylinder ............................................................. 7 Figure 5. Reference gas cylinder assembly .................................................................................................... 8 Figure 6. 1.5 liter and 1.1 liter reference gas cylinder assemblies ............................................................... 9 Figure 7. Reference gas cylinder support .................................................................................................. 10 Figure 8. Reference gas cylinder connector............................................................................................... 11 Figure 9. GFS draft enclosure on vibration isolation table ......................................................................... 13 Figure 10. Laboratory Conditions Monitor .................................................................................................. 14 Figure 11. GFS-FS Reference gas cylinder fill station ............................................................................... 15 Figure 12. Typical layout of overall GFS2102 system at site of use .......................................................... 26 Figure 13. Installation of draft enclosure doors. ......................................................................................... 29 Figure 14. LCM rear panel connections ..................................................................................................... 30 Figure 15. Reference gas cylinder assembly ................................................................................................ 32 Figure 16. Reference gas cylinder connector............................................................................................. 33 Figure 17. Regulator assembly position before and after tightening for right side operation ..................... 34 Figure 18. Reference Mass Legs (Spherical (x 2) and Flat) ...................................................................... 34 Figure 19. Location of balance positioning bracket mounting holes .......................................................... 36 Figure 20. GFS balance rear panel connections ........................................................................................ 36 Figure 21. GFS balance inside AMH with custom mass tray installed. ..................................................... 37 Figure 22. Checking height and level of gas conveyance loop connections using loop alignment tool ..... 38 Figure 23. Reference Gas Cylinder resting on balance. AMH top plate installed; reference mass plate uninstalled. ............................................................................................ 39 Figure 24. View of cylinder support legs through AMH top plate. ............................................................. 39 Figure 25. Temperature probe positions around reference gas cylinder. .................................................. 41 Figure 26. Heat Exchanger, Low ................................................................................................................ 42 Figure 27. Heat Exchanger unassembled .................................................................................................. 42 Figure 28. Single, Low flow molstic ............................................................................................................ 43 Figure 29. GFS-FS reference gas cylinder fill station connections ............................................................. 53 Figure 30. Reference gas cylinder connector ............................................................................................. 53 Figure 31. <Status Bar> ............................................................................................................................. 63 Figure 32. Test Status ................................................................................................................................ 63 Figure 33. Progress Indicator ..................................................................................................................... 63 Figure 34. Main Toolbar - Display while idle............................................................................................... 64 Figure 35. Manual Averaging Options ........................................................................................................ 67 Figure 36. <Average Setup> ...................................................................................................................... 67 Figure 37. GFS Run Screen ....................................................................................................................... 69 Figure 38. GFS Control Panel section of GFS Run Screen ....................................................................... 69 Figure 39. GFS System Display section of GFS Run Screen .................................................................... 71 Figure 40. GFS Control Toolbar section of GFS Run Screen .................................................................... 72 Figure 41. GFS Diagnostics Run Screen ................................................................................................... 73 Figure 42. Balance Output Run Screen .................................................................................................... 75 Figure 43. GFS Ambient Conditions Run Screen ..................................................................................... 76 Figure 44. DUT/Reference Comparison Run Screen ............................................................................... 77 Figure 45. Device Output Run Screen ....................................................................................................... 78 Page XI © 2011 Fluke Calibration GFS2102™ OPERATION AND MAINTENANCE MANUAL Figure 46. Figure 47. Figure 48. Figure 49. Figure 50. Figure 51. Figure 52. Figure 53. Figure 54. Figure 55. Figure 56. Figure 57. Figure 58. Figure 59. Figure 60. Figure 61. Figure 62. Figure 63. Figure 64. Figure 65. Figure 66. Figure 67. Figure 68. Figure 69. Figure 70. Figure 71. Figure 72. Figure 73. Figure 74. Figure 75. Figure 76. Figure 77. Figure 78. Figure 79. Figure 80. Figure 81. Figure 82. Figure 83. Figure 84. Figure 85. Figure 86. Figure 87. Figure 88. Figure 89. Figure 90. Figure 91. Figure 92. Figure 93. Figure 94. Figure 95. Figure 96. Spy Window Screen .................................................................................................................. 79 <molbox Output> Run Screen .................................................................................................. 80 molbox Output Run Screen in Tare Mode ................................................................................ 82 MFC-CB Run Screen ................................................................................................................ 83 Data Grid Run Screen ............................................................................................................... 84 Data Plot Run Screen ............................................................................................................... 84 Options, [Run Test] Tab ............................................................................................................ 85 Options, [Initialize Test] Tab...................................................................................................... 87 Options, [End Test] Tab ............................................................................................................ 89 Options, [Data File] Tab ............................................................................................................ 90 Options, [Data Grid] Tab ........................................................................................................... 92 Direct Remote Communication ................................................................................................. 94 Change GFS AMH State ........................................................................................................... 95 Data File Viewer ........................................................................................................................ 96 [Data], [Plot Data File] Screen................................................................................................... 97 Custom Plot Editor .................................................................................................................... 99 Plot Points display ................................................................................................................... 101 Plot Points Best Fit Tab........................................................................................................... 101 Setup Selector ......................................................................................................................... 106 Editor Toolbar.......................................................................................................................... 107 Test Definition Editor, Point Sequence ................................................................................... 109 Test Definition Editor [Control] Tab ......................................................................................... 111 Test Definition Editor [Data] Tab ............................................................................................. 113 Test Definition Editor [AutoZero] Tab ...................................................................................... 114 Test Definition Editor [Options] Tab ........................................................................................ 115 Test Definition Editor, [Comment] Tab .................................................................................... 116 DUT Editor, [Header] Tab ....................................................................................................... 118 DUT Editor, [Calibration] Tab .................................................................................................. 120 Date Selection ......................................................................................................................... 120 DUT Definition Editor [Communications] Tab ......................................................................... 121 Remote Command Editor ....................................................................................................... 124 DUT Device Edit [Output] Tab ................................................................................................ 128 %Reading Tolerance............................................................................................................... 130 %Span Tolerance.................................................................................................................... 130 %Span or %Reading (Greater of) ........................................................................................... 131 %Span + %Reading ................................................................................................................ 131 DUT Device Edit [Comment] Tab............................................................................................ 132 Reference Cylinder Editor ....................................................................................................... 133 GFS Configuration [System] Tab ............................................................................................ 134 GFS Configuration [GFS AMH] Tab ........................................................................................ 136 GFS Configuration [Limits] Tab............................................................................................... 137 GFS Configuration [LCM] Tab ................................................................................................ 138 Remote interface settings window .......................................................................................... 139 GFS Configuration [Balance] Tab ........................................................................................... 139 GFS Configuration [Interface] Tab .......................................................................................... 140 Calibration [Time/Mass] Tab ................................................................................................... 141 Calibration [Ambient] Tab........................................................................................................ 142 Calibration [TH Probe #2] Tab ................................................................................................ 144 Calibration [TH Probe #3] Tab ................................................................................................ 145 Calibration [External PRT] Tab ............................................................................................... 145 Calibration [IR Probe T5] Tab ................................................................................................. 146 © 2011 Fluke Calibration Page XII TABLES AND FIGURES Figure 97. Run Test - Setup Test Definition window ................................................................................ 147 Figure 98. Run Test - Select Test Definition Window .............................................................................. 148 Figure 99. Run Test - Select DUTs window ............................................................................................. 148 Figure 100. Run Test - Configure DUT Device window ........................................................................... 149 Figure 101. Run Test – Configure DUT Device window, legacy molbloc ................................................. 149 Figure 102. Run Test – Configure DUT Device window, enhanced molbloc .......................................... 150 Figure 103. Run Test – Configure DUT Device window, Tare Pressure.................................................. 150 Figure 104. Run Test - Setup Flow Controller window ............................................................................. 151 Figure 105. Run Test - Configure MFC Device window ........................................................................... 151 Figure 106. Run Test - Initializing Test Instruments window .................................................................... 152 Figure 107. Run Manual Test - Setup Manual Test window .................................................................... 153 Figure 108. Accumulation Sample Setup window .................................................................................... 154 Figure 109. US-DOT and European Reference Gas Cylinder labels ....................................................... 169 Figure 110. Reference gas cylinder carrier .............................................................................................. 170 Figure 111. Time Calibration window ....................................................................................................... 176 Figure 112. Calibration Time/Mass tab .................................................................................................... 177 Figure 113. LCM default front panel display............................................................................................. 178 Figure 114. Ambient sensors adjustment tab........................................................................................... 179 Figure 115. LCM TH probe front panel display ........................................................................................ 182 Figure 116. TH Probe #2 adjustment tab .................................................................................................. 182 Figure 117. External PRT adjustment tab. ............................................................................................... 184 Figure 118. LCM IR probe front panel display.......................................................................................... 185 Figure 119. IR Probe adjustment tab ....................................................................................................... 185 Figure 120. View of main board socket J19 or top view of calibration cable ............................................ 186 Page XIII © 2011 Fluke Calibration GFS2102™ OPERATION AND MAINTENANCE MANUAL Notes © 2011 Fluke Calibration Page XIV About This Manual This manual provides the information necessary to operate a GFS2102 gravimetric mass flow calibration standard to make gas mass flow measurements. It also provides additional recommendations and information to help you optimize use of the GFS2102 system and take full advantage of it’s many features and functions. Before using the manual, take a moment to familiarize yourself with the Table of Contents structure. Set up of a GFS2102 system should not be attempted without using Section 3. All first time GFS2102 users should read Section 4. There is a glossary of common terms in Section 9.1, a troubleshooting guide in Section 8, and a chart of typical test settings in Section 9.2. Manual Conventions Caution “Caution” is used in throughout the manual to identify conditions or actions that could cause harm to the GFS2102 or to the devices that are connected to the GFS2102. Warning “Warning” is used in throughout the manual to identify actions that could pose a hazard to the user of the GFS2102. Note “Note” is used throughout the manual to identify operating and applications advice and additional explanations. [ ] indicates direct function keys or objects (e.g., [RANGE]) on an instrument front panel keypad or in a software user interface. < > indicates instrument front panel screen displays or labels in a software user interface (e.g., <1yes>) Page XV © 2011 Fluke Calibration GFS2102™ OPERATION AND MAINTENANCE MANUAL Notes © 2011 Fluke Calibration Page XVI 1. Introduction GFS2102 is a primary gravimetric gas flow measurement standard. It is intended for use in calibrating gas flow transfer standards or other flow devices requiring a very low uncertainty reference. GFS2102 is recommended when low uncertainty is the primary requirement of a flow measurement or the ability to internally maintain traceability of mass flow measurements is desired. GFS2102 covers the range of 10 sccm to 10 slm in several gases selectable on a molbox/molbloc system. GFS2102 measures gas mass flow by measuring the loss of mass from a reference gas cylinder over a measured period of time. The reference gas cylinder assembly rests on the GFS mass balance and flow is transmitted from the cylinder through a flow path designed to have minimal effect on the balance mass measurement. Balance mass and time measurements and a number of ambient conditions are all read using a component of the GFS2102 system called LCM, the Laboratory Conditions Monitor. Since test times may be long, a special automated mass handling platform is used to load a fixed reference mass on the GFS balance at intervals throughout the test to quantify and remove any effects from balance drift over time. All measurement functions of the GFS2102 system are operated by a system controller (personal computer) running GFS Tools software. The system is made up of several individual components working together and controlled by GFS Tools. 1.1 Specifications 1.1.1 GFS2102 General Specifications Power Requirements Balance LCM MFC-CB 100 to 240 VAC, 50 to 60 Hz, 27 W max. consumption 100 to 240 VAC, 50 to 60 Hz, 40 W max. consumption 85 to 264 VAC, 50 to 60 Hz, 36 W max. consumption 15 to 25 °C 5 to 70% RH, non-condensing Operating Temperature Range Humidity Range Weight Granite table and stand Rest of system 320 kg (700 lb) approx. 70 kg (150 lb) approx. Dimensions Enclosure on Granite Table w/ stand LCM MFC-CB GFS-FS Supported Gases Flow Measurement Range He, H2 All other gases Pressure Connections 150 cm H x 90 cm W x 60 cm D (58 in. x 36 in. x 24 in.) 8 cm H x 22.5 cm W x 20 cm D (3.1 in. x 8.9 in. x 7.9 in.) 8 cm H x 22.5 cm W x 20 cm D (3.1 in. x 8.9 in. x 7.9 in.) 20 cm H x 41.4 cm W x 20 cm D (7.9 in. x 16.3 in. x 7.9 in.) Nitrogen (N2), Air, Argon (Ar), Helium (He), Carbon Dioxide (CO2), Carbon Tetrafluoride (CF4), Fluoroform (CHF3), Hexafluoroethane (C2F6), Nitrous Oxide (N2O), Sulfur Hexafluoride (SF6), Xenon (Xe) at least: 100 sccm to 10 slm 10 sccm to 10 slm 1/8” Swagelok tube fitting or equivalent, with adaptor to outlet flow path from enclosure 1/4” Swagelok tube fitting or equivalent Reference Gas Cylinder Pressure Limit CE Conformance 18 MPa (2700 psi) Available, must be specified. Page 1 © 2011 Fluke Calibration GFS2102™ OPERATION AND MAINTENANCE MANUAL 1.1.2 GFS2102 Mass Balance Specifications Operating temperature range 15 to 30 °C Operating humidity (maximum) 70% RH, non-condensing Resolution 0.1 mg Mass Uncertainty 10 ppm of span or better 1.1.3 LCM Ambient Conditions Measurement Specifications 1.1.3.1 PRT Balance Ambient Temperature Measurement Temperature: Range Uncertainty 1.1.3.2 Range Uncertainty Relative Humidity: Range Uncertainty Range Uncertainty Temperature: Range Uncertainty Relative Humidity: Range Uncertainty 5 to 95 %RH ± 10 %RH [°C] 0 to 30 ± 2.2 [kPa] 70 to 110 ± 0.2 [°C] 15 to 30 ± 1.0 5 to 95 %RH ± 10 %RH Balance Reading Time Measurement Uncertainty: © 2011 Fluke Calibration 15 to 30 ± 0.2 Ambient Conditions Measurement Pressure: Range Uncertainty 1.1.3.5 [°C] Infrared Probe Reference Gas Cylinder Surface Temperature Measurement Temperature: 1.1.3.4 15 to 30 ± 0.1 TH Probe Reference Gas Cylinder Surroundings Ambient Condition Measurement Temperature: 1.1.3.3 [°C] 32 ppm Page 2 1. INTRODUCTION 1.1.4 MFC-CB Specifications Analog Output Voltage Range Voltage Accuracy 0 to 6.000 VDC ± 0.015 % FS Voltage Resolution 0.1 mVDC Current Range 4 to 20 mA Current Accuracy Current Resolution ± 0.025 % FS 0.4 µA Analog Input Voltage Range Min/Max Measurable Voltage Voltage Accuracy - 0.25/6.00 VDC ± 0.015 % FS Voltage Resolution 0.1 mVDC Current Range 4 to 20 mA Current Accuracy Current Resolution 1.1.5 0 to 6.000 VDC ± 0.025 % FS 0.4 μA Flow Measurement Specifications Repeatability less than ± 0.05% of reading Measurement Uncertainty less than ± 0.1% of reading Page 3 © 2011 Fluke Calibration GFS2102™ OPERATION AND MAINTENANCE MANUAL Notes © 2011 Fluke Calibration Page 4 2. System Overview GFS2102 is a primary gravimetric gas flow measurement standard. It is intended for use in calibrating gas flow transfer standards or other flow devices requiring a very low uncertainty reference. GFS2102 is recommended when low uncertainty is the primary requirement of a flow measurement. GFS2102 covers the range of 10 sccm to 10 slm in several gases selectable on a molbox/molbloc system. All measurement functions of the GFS2102 system are managed by a system controller (personal computer) running GFS Tools software. The system is made up of several individual components working together and controlled by GFS Tools, which is the user interface for the GFS2102 instrument. Precision mass balance Catenary gas conveyance loop Reference mass Laboratory conditions monitor AMH-GFS2102 automated mass handler MFC control box Infrared probe Flow terminal (for device under test) (not included) Reference gas cylinder Mass flow controller Ambient conditions probe Device under test (not included) Ambient conditions probe molstic (mid flow stic shown) Figure 1. GFS2102 system GFS2102 measures gas mass flow by measuring the loss of mass from a reference gas cylinder over a measured period of time. The reference gas cylinder assembly rests on the GFS mass balance that is placed on a vibration isolation table and inside an insulated draft enclosure. Flow is transmitted from the cylinder and out through the enclosure wall in a flow path designed to cause minimal effect on the balance mass measurement. Page 5 © 2011 Fluke Calibration GFS2102™ OPERATION AND MAINTENANCE MANUAL In order to mitigate mass measurement errors due to balance drift over time, the balance sits inside an automated mass handling platform assembly, AMH-GFS2102, that allows the cylinder assembly to be lifted off the balance, and a reference mass to be loaded on the balance, without interrupting the flow measurement. The Laboratory Conditions Monitor (LCM) is a central piece of hardware for GFS system operation. It performs several different functions for the system. These include measurement of temperature under the AMH platform, measuring temperature and humidity surrounding the reference gas cylinder, measuring the temperature of the reference gas cylinder, actuating the AMH platform movement, measuring ambient pressure and recording the precise time at which each balance reading is taken. Another piece of support hardware, MFC-CB is used for sending flow command signals to the flow controllers, and possibly reading the device under test if the device has a voltage output. 2.1 Balance and AMH-GFS2102 GFS2102 measures the changing reference gas cylinder mass using a high precision 2.3 kg range mass balance. It is a mass comparator type balance, so there is no significant deflection of the custom mass tray while the mass load is placed on it. The balance has a digital serial output which is read by the LCM. In a typical mass measurement, the balance can be zeroed, or tared, immediately before placement of the mass, and the measurement can be made relatively quickly after zeroing. Since gravimetric gas flow measurements can require up to several hours or days for some gases and flow ranges, the balance’s stability over time and level of influence from surrounding conditions becomes very significant to GFS2102 measurements. A key to reaching the desired level of uncertainty using GFS2102 is to eliminate or minimize the uncertainty due to drift of the mass balance over time. In order to quantify and correct for the balance drift, a specialized automated mass handling platform called AMH-GFS2102 has been developed to allow the GFS balance to be AutoZeroed at selected intervals during a flow measurement. The AMH alternately lifts the reference gas cylinder assembly off the balance, loads a fixed reference mass in its place for measurement, and returns the reference gas cylinder assembly without interrupting the flow measurement. Figure 2. Reference gas cylinder resting on GFS balance and AMH-GFS2102 © 2011 Fluke Calibration Page 6 2. SYSTEM OVERVIEW The reference mass is approximately 2.0 kg, which is close to the mid point between a full 1.1 liter reference gas cylinder and an empty 1.5 liter reference gas cylinder, so that the balance is checked and corrected for drift at a mass load that is close to the cylinder mass being measured. The balance readings are then corrected for any drift that has occurred since the last time a balance zero or AutoZero were checked. Figure 3. AMH reference mass plate AMH-GFS2102 lifts the reference gas cylinder vertically only 3 mm when unloading it from the balance so that the gas flow is not disturbed and no unnecessary deflection of the gas conveyance loop takes place. The standard mass tray has been replaced with a custom mass tray that uses a three point locating system to assure consistent physical placement of the reference gas cylinder on the balance during and after each balance AutoZero process (see Section 4.1.3). Figure 4. Custom mass tray supporting the reference gas cylinder The reference gas cylinder and reference mass are loaded and unloaded from the balance by two AMH plates that are keyed to lift one of the components when the plate is raised and allow it to rest on the balance when the plate is lowered. The plates move vertically along two posts on the AMH base that orient them, and are raised and lowered by three cams on two shafts in the AMH base which contact rollers that support each plate. A small motor is included in the AMH base to turn the shafts, which are actuated by 12V valve drivers in the LCM. Page 7 © 2011 Fluke Calibration GFS2102™ OPERATION AND MAINTENANCE MANUAL 2.2 Reference Gas Cylinder Assembly The GFS2102 reference gas cylinder assembly is built around a high pressure carbon fiber composite cylinder. In addition to the cylinder itself, the assembly includes a cylinder support, a cylinder connector with fill port and valve, and a two stage welded regulator assembly. Reference gas cylinder Reference gas cylinder connector Regulator assembly Cylinder support Figure 5. Reference gas cylinder assembly The reference gas cylinder is a metrological component of the GFS2102 system. Each cylinder assembly is individually tested to determine the internal volume of the assembly. This information, along with the external volume and coefficients of thermal and pressure expansion, allow proper calculation of an air buoyancy correction on the measured mass value and the total mass of test gas available in the cylinder. The characteristics of each cylinder are included on a technical data report that accompanies a new cylinder assembly and must be entered in GFS Tools software (see Sections 3.3.8 and 5.7.5 for more information). The components of the reference gas cylinder assembly are designed or selected to be as light as possible so that the mass of the test gas makes up a relatively large portion of total measured mass on the balance, allowing sufficient resolution on the measurement of the mass change during the test. The components of the GFS2102 reference gas cylinder assemblies are described below. 2.2.1 Reference Gas Cylinder The cylinders used for GFS are composite cylinders made with a thin aluminum internal lining, wrapped in carbon fiber in epoxy resin for strength and covered with a fiberglass lining and gel coat finish for resistance to abrasion, impact and UV degradation. The fiber composite design allows them to be lighter than most high pressure cylinders, so a smaller percentage of the total filled cylinder assembly mass comes from the cylinder itself. © 2011 Fluke Calibration Page 8 2. SYSTEM OVERVIEW There are two different reference gas cylinder sizes offered with the GFS2102 system, a 1.1 liter cylinder and a 1.5 liter cylinder. The two cylinders are offered to accommodate the greatly varying gas densities that can be used with the system (see Section 4.1.2). The cylinders are rated for a maximum working pressure of 18 MPa (2700 psi) for either cylinder. Warning The fill station incorporates a 20 MPa (3000 psi) burst disc and a selfresetting Pressure Relief Device set to ~19 MPa (2750 psi), use of the system above ~18 MPa (2700 psi) is not advised. The user is strongly advised not to tamper with these pressure relief devices. In addition, due to the operational nature of these devices, it is highly recommended to hard plumb the vent to direct any potential occurrence away from an operator and/or out of the room. The cylinders are delivered with appropriate labeling to meet European or US-DOT requirements depending on the location of the GFS2102 end user. Figure 6. 1.5 liter and 1.1 liter reference gas cylinder assemblies US-DOT and European regulations require that the composite Reference Gas Cylinders be hydrostatically tested at a required interval and have a maximum service life of 15 years from the date of manufacture of the cylinder (See Section 6.6 and Figure 109). At that time, the cylinders should be replaced. The hydrostatic testing should be performed on the cylinders to ensure safe operation, by default every 5 years from the date of manufacture of the cylinder unless otherwise required by local jurisdiction authorities. Note that in some European countries, the 5 year period is shortened to 3 years. Do not expose the reference gas cylinder to temperatures above 56 °C (133 °F). If you suspect that a reference gas cylinder has been heated to temperatures of 56 °C or more, it must be hydrostatically retested and fully re-qualified before further use. Reference gas cylinders exposed to or with evidence of exposure to heat in excess of 72 °C (162 °F) must be condemned and removed from service. Page 9 © 2011 Fluke Calibration GFS2102™ OPERATION AND MAINTENANCE MANUAL Avoid letting the cylinder come in contact with strong solvents or cleaning agents, vehicle fluids or corrosive materials as the composite material may be damaged. For safety, heat dissipation and to maximize the life of the cylinder, filling of the reference gas cylinder should be performed as described in section 4.3. Also see section 2.8 for an overview on the GFS Fill Station. 2.2.2 Cylinder Support The reference gas cylinder is supported on the GFS balance by a custom assembly whose three legs pass through the two plates of the AMH and rest directly on the custom mass tray. The three leg design of the cylinder support and the custom mass tray make up a locating system for the reference gas cylinder so that it is placed on the custom mass tray in the same way each time it is set down, to optimize the repeatability of mass measurements. The foot of each leg of the cylinder support is a ruby sphere which is press-fit into the steel support leg. The spheres help to minimize friction as the reference gas cylinder assembly is placed on the custom mass tray and guided into its resting position. Figure 7. Reference gas cylinder support The cylinder support is made of stainless steel legs threaded into a machined aluminum body. Six threaded, spring-loaded pins located around the top ring of the cylinder support are used to attach the support to the reference gas cylinder. An adhesive plastic is used to protect the cylinder from damage where the pins make contact and to help hold the support in place on the cylinder. 2.2.3 Reference Gas Cylinder Connector The reference gas cylinder connector is a threaded cylinder plug that provides the connection to the cylinder’s regulator assembly and also has a built-in fill port and valve so that the cylinder can be filled without removing the regulator assembly. © 2011 Fluke Calibration Page 10 2. SYSTEM OVERVIEW Fill valve Fill port Regulator stem port Figure 8. Reference gas cylinder connector The regulator stem port and the fill port connections are both DH200 coned and threaded connectors. This type of fitting is suitable for pressures beyond the reference gas cylinders maximum operating pressure and the connection can be broken and reconnected many times. The regulator stem port will rarely be disconnected except for shipment, but the fill port will be used frequently for cylinder refills. The fill valve is a threaded plug which operates a valve pin with an o-ring seal. The valve opens or closes the flow path to the fill port so that the fill port connection can be broken and reconnected while the cylinder is under pressure. To open the valve, it is not necessary to turn the valve any more than ½ turn. If the valve is fully backed out counter-clockwise while the cylinder is under pressure, the valve could dislodge from the cylinder connector dangerously. The valve is designed to start venting through a side vent approximately 3 turns before release as a warning. See Section 4.3 for reference gas cylinder filling instructions. Warning • Pressurized gases are potentially hazardous. Energy stored in these gases can be released unexpectedly and with extreme force. Pressurized systems should be assembled and operated only by personnel who have been instructed in proper safety practices. • To open the valve, it is not necessary to turn the valve any more than ½ turn. If the valve is fully backed out counter-clockwise while the cylinder is under pressure, the valve could dislodge from the cylinder connector dangerously. The valve is designed to start venting through a side vent approximately 3 turns before release as a warning. 2.2.4 Regulator Assembly Each reference gas cylinder assembly includes a two-stage pressure regulator assembly to deliver a well-regulated gas flow through the gas conveyance loop and out of the GFS draft enclosure. The regulator assembly is made up of two fixed pressure regulators on a welded assembly that is designed to be centered over the reference gas cylinder and to have a low center of gravity. The center support of the regulator assembly is a solid piece that does not conduct any gas flow. All of the flow follows the flow path to the side and through both regulators. On all reference gas cylinder assemblies, the first stage regulator is set to deliver downstream pressure of 1 MPa (150 psi). On 1.1 liter reference gas cylinder assemblies, the second regulator delivers 690 kPa (100 psi). On 1.5 liter reference gas cylinder assemblies, the second regulator delivers 550 kPa (80 psi). Page 11 © 2011 Fluke Calibration GFS2102™ OPERATION AND MAINTENANCE MANUAL 2.2.5 Reference Gas Cylinder Case All the pieces for the reference gas cylinder assembly are delivered in a custom fill/carry case to provide a convenient way to store and carry the reference cylinder assembly around the laboratory. This case is designed to allow the user to fill the cylinder while it is resting in the case (with the case lid open) and provides adequate ventilation for the cylinder to cool during and after the filling operation. The reference gas cylinder assembly should NOT be shipped or transported for any distance outside the lab in the fill/carry case while the regulator assembly is installed on the cylinder or the cylinder is pressurized. If the unit encounters a significant shock while the reference gas cylinder with fully installed regulator assembly is inside the case, the vertical nipple of the regulator assembly could bend under the weight of the regulators, which may cause alignment problems for the cylinder assembly in the GFS system, and may compromise the strength of the tubing in a high pressure section of the regulator assembly. For assembling the reference gas cylinder, always follow the instructions in section 3.1.8. For filling the cylinder, always follow the instructions in Section 4.3. For shipping the cylinder, always follow the instructions in section 6.4. Warning 2.3 • Never ship an assembled or pressurized reference gas cylinder. Always follow the instructions in Section 6.4 for disassembling the reference gas cylinder for shipment. • Never leave a pressurized reference gas cylinder in a sealed case for an extended time. Leave the case unlatched if storing a pressurized cylinder. GFS Draft Enclosure and Vibration Isolation Table The GFS balance, AMH, and reference gas cylinder assembly are operated inside an insulated enclosure to isolate them from air drafts and rapid changes in temperature or humidity. The entire enclosure is placed on a granite vibration isolation table, which further stabilizes the temperature inside the enclosure. The granite table top measures 600mm x 900mm x 150 mm (23.6” x 35.4” x 5.9”) and has ledges which are used as a connection point for the draft enclosure mounting brackets. The granite table rests on a steel stand. © 2011 Fluke Calibration Page 12 2. SYSTEM OVERVIEW Figure 9. GFS draft enclosure on vibration isolation table There are a total of three pass through openings on the sides and back of the enclosure. The openings on the sides of the enclosure are for the exit of the flow path tube depending on which side is chosen, and the back opening is for electrical connections to the balance, AMH, internal temperature and humidity probes, and ambient pressure tube. After the gas travels from the reference gas cylinder and through the gas conveyance loop it passes through a quick connector mounted on a column on the inside of the GFS draft enclosure. A tube leading from this connector passes inside the column, through an isolation valve, and down through the enclosure pass through opening below. The vertical position of the quick connector on the enclosure column may be adjustable. The height of the quick connector at the outlet of the reference gas cylinder assembly is different for 1.1 liter and 1.5 liter cylinders and also may not be consistent among cylinders of the same size. Therefore it may be necessary to adjust the quick connector on the on the draft enclosure bracket to keep the ends of the gas conveyance loop level. It is important that the loop ends are level so that no unintended forces are imparted to the cylinder while its mass is being measured. Three probe positioning arms are mounted on the inside of the back wall of the draft enclosure. The adjustable arms hold the two TH probe devices and infrared temperature probe in proper positions relative to the reference gas cylinder assembly to get accurate measurements of the cylinder’s surface and surrounding conditions. A loop alignment tool is delivered with the GFS draft enclosure to help in positioning the AMH so that the loop takes its ideal natural shape, minimizing the possibility of unintended forces applied to the reference gas cylinder while it is on the balance. Page 13 © 2011 Fluke Calibration GFS2102™ OPERATION AND MAINTENANCE MANUAL 2.4 Laboratory Conditions Monitor (LCM) The LCM is the central data collection component of GFS2102. All GFS balance mass measurements are read by the LCM and the precise time of each balance reading is recorded using LCM’s calibrated onboard timer and passed on to GFS Tools software. Measurements of pressure, temperature and humidity in the vicinity of the reference gas cylinder and balance are needed for GFS Tools to calculate the instantaneous mass of the cylinder, corrected for air buoyancy, throughout the test. All of these measurements are made by the LCM using internal ambient condition measurements and probes that are placed in critical locations inside the GFS draft enclosure. Figure 10. Laboratory Conditions Monitor 2.5 MFC-CB MFC-CB is used for controlling flow setpoint signals to mass flow controllers included in the GFS2102 system. It may also be used for reading the output of a device under test that has an analog signal output. Communication with MFC-CB for controlling flow is supported automatically in GFS Tools software. For reading device under test (DUT) output, some configuration of MFC-CB and/or GFS Tools is needed (See Section 5.5.3). See the separate MFC-CB Operation and Maintenance Manual for details on MFC-CB. 2.6 GFS Tools The user interface for operating GFS2102 is GFS Tools software. GFS Tools handles all collection of data from the GFS system components and devices under test and calculation and reporting of mass flow and errors. Some operating principles of GFS Tools are described in Section 4.1 and 4.2 and GFS Tools is described in detail in Section 5. 2.7 Heat Exchanger At flows above 1 slm in N2, the calibration gas is discharging from the Reference Gas Cylinder quickly enough that the cooling of the gas from decompression can effect the regulator, MFC, and molbloc(s) downstream of the GFS. This in turn can effect the stability and control of the flow, and ultimately the overall accuracy. To significantly reduce these effects a heat exchanger is used. A fully assembled heat exchanger consists of a 3.2 Qt. stainless steel can filled with water or a water/antifreeze mix with approximately 7-10 feet of 1/8” stainless tubing coiled up and submerged in the liquid. For shipping purposes the exchanger is shipped without liquid and needs to be prepared prior to use. Preparation of the heat exchanger is described in Section 3.3.14. 2.8 GFS-FS Reference Gas Cylinder Fill Station A specialized filling station is provided with the GFS2102 system to help users fill the reference gas cylinders safely and slowly with minimal heating of the cylinder. The design of the fill station allows the © 2011 Fluke Calibration Page 14 2. SYSTEM OVERVIEW user to quickly set the desired fill pressure and the cylinder is filled at a slow rate that is controlled by a flow limiter. The user can view the set pressure that the cylinder will ultimately achieve and the current cylinder pressure as it fills. Warning The fill station incorporates a 20 MPa (3000 psi) burst disc and a self-resetting Pressure Relief Device set to ~19 MPa (2750 psi), use of the system above ~18 MPa (2700 psi) is not advised. The user is strongly advised not to tamper with these pressure relief devices. In addition, due to the operational nature of these devices, it is highly recommended to hard plumb the vent to direct any potential occurrence away from an operator and/or out of the room. Figure 11. GFS-FS Reference gas cylinder fill station See Section 4.3 for details on GFS-FS operation and connections. 2.9 Mass flow controllers Four mass flow controllers are included with the GFS2102 system. There are (1) 10 sccm MFC, (1) 100 sccm MFC, (1) 1 slm MFC, and (1) 10 slm MFC all adjusted to operate in these ranges for N2. These can be used for any gas that they can reasonably operate with by applying the K factors found in GFS Tools. When working with gases other than N2, in most cases a test will have to be sectioned into two or more tests in order to work with multiple MFC’s. 2.10 molbloc molstics Two molstics are included with the GFS-2102 system: a single low flow (PN 3069758) and a single mid flow (PN 3069712). If calibration of molblocs or MFC’s will be the primary use of the GFS, it is recommended to use these molstics for the ease of setup. These molstics each come with a filter, regulator, manual shutoff valve, molbloc cradles, and MFC supports. Page 15 © 2011 Fluke Calibration GFS2102™ OPERATION AND MAINTENANCE MANUAL Depending on the Reference Gas Cylinder selected, the output of the GFS is either 690 kPag (100 psig) or 550 kPag (80 psig). For most applications this pressure will need to be regulated down to an operational pressure before going through the device under test (DUT). For example, a LoP calibrated molbloc at 270kPaa (39 psia) or a HiP calibrated molbloc at 525kPaa (76 psia). If molstics are not used, then at a minimum a filter, regulator, and manual shutoff valve are recommended, and consideration will have to be given to the varying height locations of these connections as well as those of any molblocs, MFC’s, or other DUT’s to be connected. 2.11 Mass Set A mass set with a custom mass carrier assembly is included with the GFS-2102 system. It can be used if additional assurance is desired to prove the balance is correctly operating in the range of normal use from 1.6kg to 2.3kg. The carrier allows for a quick exchange with the Reference Gas Cylinder and is designed to weigh nominally 1.6kg in order to simulate an empty gas cylinder. The carrier provides a platform outside of the AMH for the placement of masses in order to check the balance performance without having to remove the plates of the AMH. The mass set includes three 200g masses and one 100g mass, which in combination allows for a measurement in 100g increments from 1.6kg to 2.3kg. For detailed instructions on the use of the mass carrier and masses see section 7.8.3. © 2011 Fluke Calibration Page 16 3. Installation 3.1 Unpacking and Inspection Check that all items included in the GFS2102 system are present and have NO visible signs of damage. A parts list of the major components supplied and how they are packed is provided in Table 1. Unpack and inspect the items following the instructions in Sections 3.1.1 to 3.1.11 and detailed parts lists in GFS2102 packing list to Table 1. Table 1. GFS2102 packing list COMPONENT SHIPPED IN SECTION DETAIL TABLE Granite Vibration Isolation Table See below 3.1.1 Table 2 Granite Table Stand See below 3.1.1 Table 2 GFS draft enclosure corrugated container in wood crate 3.1.2 Table 2 Draft enclosure glass doors corrugated container 3.1.2 Table 2 Draft enclosure accessories corrugated container 3.1.2 Table 2 LCM and accessories corrugated container 3.1.3 Table 3 MFC-CB and accessories corrugated container 3.1.4 Table 4 mass flow controllers corrugated container 3.1.2 Table 2 Low flow molstic corrugated container 3.1.11 Table 11 Mid flow molstic corrugated container 3.1.11 Table 11 3.1.2 Table 2 GFS Tools CD GFS-FS corrugated container 3.1.5 Table 5 GFS mass balance corrugated container 3.1.6 Table 6 AMH-GFS2102 (2) corrugated containers 3.1.7 Table 7 Reference gas cylinder assembly (one or more may be delivered) molded transit case in corrugated outer carton 3.1.8 Table 8 GFS2102 mass set molded transit case in corrugated outer carton 3.1.10 System controller (2) corrugated containers 3.1.9 Table 2 Accessories corrugated container 3.1.2 Table 2 Page 17 © 2011 Fluke Calibration GFS2102™ OPERATION AND MAINTENANCE MANUAL 3.1.1 Granite Vibration Isolation Table and Stand Warning The granite vibration isolation table top weighs over 600 lb. (270 kg). Professional assistance and special equipment are needed to move it into position in the laboratory. The granite vibration isolation table is generally drop-shipped directly from the manufacturer to the customer since it is very heavy item and does not require assembly or modification by Fluke Calibration. It is best to make plans for the final location of the GFS system well before installation of the system so that the vibration isolation table can be put into place. The granite table is shipped along with a steel support stand. For use with the GFS2102 system, the table will be aligned so that the widest dimension is seen from the front of the system. 3.1.2 GFS Draft Enclosure and System Accessories The draft enclosure is shipped partially assembled in a wooden crate. It is first padded and packed inside a corrugated container, and then the container is packed inside the crate. The draft enclosure’s glass doors, external gas conveyance tube, enclosure pressure transport tube and surface plate clamps are removed for shipping. Brackets and hinges for holding these items are pre-installed on the enclosure before shipping to simplify mounting them onsite. To unpack: Remove top and sides from the wood crate. Open the corrugated container taking care not to damage the side of the draft enclosure. Remove the draft enclosure from the pallet. The draft enclosure is packed alone in the wooden crate. Two glass doors are packaged separately from the draft enclosure in a corrugated container. Carefully open the container and remove the glass doors. Accessories for the GFS draft enclosure are packed along with other GFS2102 system accessories in two separate corrugated containers. Open the corrugated containers and remove the accessories. Many of these will be individually wrapped inside the corrugated container to protect them from damage. Table 2 details all items included in the GFS draft enclosure accessories and system accessories. © 2011 Fluke Calibration Page 18 3. INSTALLATION Table 2. Draft enclosure and system accessories list DESCRIPTION 1 ea. PART # 3889201 GFS Draft enclosure assembly including: • Draft enclosure glass doors (removed for shipping) • Enclosure door lock bar (removed for shipping) • Sidewall column with isolation valve • Telescoping probe support arms • Mounting brackets for probe support arms • External gas conveyance tube (removed for shipping) • IR converter box cable • Granite vibration isolation table (removed for shipping) System Accessories including: 1 ea. Granite Vibration Isolation Table, 24 IN X 36 IN, 2 Ledge 3860256 1 ea. Stand, Stationary, Granite Table, 24 IN X 36 IN 3860263 1 ea. Heat Exchanger, Low 3888205 1 ea. Mass flow controller, 10 sccm N2 3858027 1 ea. Mass flow controller, 100 sccm N2 3858066 1 ea. Mass flow controller, 1 slm N2 3858075 1 ea. Mass flow controller, 10 slm N2 3858082 1 ea. System Controller (PC) with monitor, keyboard, mouse 3141260 1 ea. Catenary gas conveyance loop, high flow (shipped in Reference Gas Cylinder molded case) 4007371 1 ea. Catenary gas conveyance loop, low flow (shipped in Reference Gas Cylinder molded case) 4087060 Accessory kit including: 1 ea. Catenary loop alignment tool 3996882 1 ea. 1/8” x 1/4” Swage reducing union 3852801 4 ea. RS-232 cable 1 ea. USB to RS-232 adaptor, 4 port 3221922 1 ea. Operation and Maintenance Manual 3889628 1 ea. GFS Tools Software CD 4087217 1 ea. General Accessory CD 3139043 3.1.3 2758335 Or 3077381 CE Laboratory Conditions Monitor The LCM is delivered in a corrugated container with foam inserts. The LCM accessories are sealed in plastic and included in the same corrugated container. Open the corrugated container and remove the accessories and LCM. You may wish to retain the foam inserts for future shipping. Table 3 details all items included with the LCM. Page 19 © 2011 Fluke Calibration GFS2102™ OPERATION AND MAINTENANCE MANUAL Table 3. LCM parts list DESCRIPTION 1 ea. PART # Laboratory Conditions Monitor 3889197 Accessory kit including: 1 ea. AMH-GFS2102 driver cable 3934518 1 ea. Enclosure pressure transport tube 3859906 2 ea. TH Probe temperature and humidity probe 2106009 2 ea. TH Probe cable 3837033 1ea. Infrared Temperature Transmitter 4068469 1 ea. PRT temperature probe with cable 3934590 1 ea. 100-240VAC to 12VDC power adaptor (black) 3335610 1 ea. Standard resistor calibration cable 4068478 1 ea. Power cord 3.1.4 3133781 and 3153005 CE MFC-CB The MFC-CB is delivered in a corrugated container with foam inserts. The MFC-CB accessories are sealed in plastic and included in the same corrugated container. Open the corrugated container and remove the accessories and MFC-CB. You may wish to retain the foam inserts for future shipping. Table 4 details all items included with the MFC-CB. Table 4. MFC-CB parts list. DESCRIPTION 1 ea. PART # 3119928 MFC-CB Platform Accessory kit including: 2 ea. 1 ea. MFC cable, standard edge connect 3068736 or 4087189 (CE) Power Cord 3133781 or 3153005 (CE) 1 ea. Analog calibration cable 3069720 1 ea. Operation and Maintenance Manual 3152238 3.1.5 GFS-FS Reference gas cylinder Fill Station The GFS-FS reference gas cylinder fill station is shipped in a corrugated container along with an accessory kit that is sealed in plastic. Open the corrugated container and remove the accessories and fill station. Table 5 details all items included with the GFS-FS. © 2011 Fluke Calibration Page 20 3. INSTALLATION Table 5. GFS-FS fill station parts list DESCRIPTION 1 ea. GFS-FS: Gravimetric Flow Standard – Fill Station PART # 3871426 Accessory kit including: 1 ea. F1414SNF-96 flex tube 3069393 1 ea. F1550-96 flex tube 3871385 1 ea. DH200 gland 3068428 1 ea. DH200 collar 3068599 1 ea. ¼” NPTF x ¼” Swage adaptor 3863098 3.1.6 GFS Mass Balance The GFS balance is delivered in a custom molded black foam insert inside a corrugated container along with the custom mass tray, which is individually wrapped inside the insert in the same container. Carefully remove the insert from the corrugated container. The insert is a two piece design held together by two manually operated reusable buckle straps. Release the straps and remove the top piece of the insert. Carefully remove the custom mass tray and balance from the insert. Avoid imparting any excessive shock to the balance while handling. Table 6 details all items included with the GFS balance. Table 6. GFS mass balance parts list DESCRIPTION 1 ea. Mass Comparator including: PART # 3858223 • 100-240VAC to 12VDC power adaptor (white) • Power cord Accessory kit including: 1 ea. Custom mass tray 3869000 1 ea. Custom mounting bracket (to connect to AMH-GFS2102) 3869039 3.1.7 AMH-GFS2102 The AMH-GFS2102 automated mass handler is shipped in two or more corrugated containers. There are 4 main parts to the AMH that are disassembled prior to shipment; The AMH base, the reference mass, reference mass plate and top plate. To unpack: Remove each of the four AMH parts from the corrugated containers. The AMH base should be set so that the three adjustable feet support it. The two plates and reference mass can be placed directly on a table. Take care not to damage or scratch the reference mass and to keep it clean so that its calibration is not changed. See Sections 3.3.9 to 3.3.12 for AMH-GFS2102 assembly and positioning instructions. Table 7 details all items included with the AMH-GFS2102. Page 21 © 2011 Fluke Calibration GFS2102™ OPERATION AND MAINTENANCE MANUAL Table 7. AMH-GFS2102 parts list DESCRIPTION 1 ea. PART # AMH-GFS2102 Automated Mass Handler Including: 3889172 • AMH platform base • AMH reference mass plate assembly (including Reference mass, mass mounting legs, screws) • AMH top plate assembly 3.1.8 Reference Gas Cylinder Assemblies Reference gas cylinder assemblies are not included with the base GFS2102 system, so the customer has the option to purchase one or more with their system. Often, a set of two cylinder assemblies are ordered and delivered with the GFS system, one of the smaller 1.1 liter cylinder assemblies with 690 kPa (100 psi) output and one of the larger 1.5 liter cylinder assemblies with 550 kPa (80 psi) output to cover requirements for a variety of gases. For customers who expect a high rate of usage, two sets of cylinders are recommended so that for whatever size of cylinder is in use a second identical cylinder can be filled and prepared for use once the first is depleted. Each reference cylinder assembly is shipped in a black, molded plastic case in a corrugated liner. During shipment, the plastic case holds the disassembled cylinder unit and regulator assembly in place using a custom plastic and foam liner. Also packed inside the plastic case is a catenary gas conveyance loop that is held in a foam cutout in the case lid. To unpack: Remove the plastic molded case from the corrugated liner. Open the case and inspect the reference gas cylinder, regulator assembly, and catenary gas conveyance loop. Both can be stored inside the case when not in use. When removed from the case, the cylinder assembly can be placed on a level surface resting on the cylinder support legs. Make sure the reference gas cylinder support is attached on the cylinder straight, so that the cylinder stands vertically. Follow the instructions in Section 3.3.7 for assembling the regulators with the reference gas cylinder. Follow the instructions in Section 6.4 to disassemble the Reference Gas Cylinder for shipment. Table 8 details all items included with each option of the Reference Gas Cylinder. Table 8. Reference gas cylinder assemblies’ parts lists Note Two cylinders, one of each size for the appropriate geographic location, can be ordered with the system. DESCRIPTION 1 ea. US-DOT 1.1 Liter Reference gas cylinder assembly including: PART # 3888744 • Reference gas cylinder, US-DOT 1.1 Liter • Reference gas cylinder connector • Regulator assembly, 690 kPag (100 psig) • Reference gas cylinder support, 1.1 Liter 1 ea. US-DOT 1.5 Liter Reference gas cylinder assembly including: • Reference gas cylinder, US-DOT 1.5 Liter • Reference gas cylinder connector • Regulator assembly, 550 kPag (80 psig) • Reference gas cylinder support, 1.5 Liter © 2011 Fluke Calibration Page 22 3888759 3. INSTALLATION Accessories included with every cylinder 1 ea. NPN Molded case with inserts including: • 1/16” Swage QC stem and plug assembly • Foam insert for shipment of regulator assembly • Technical data sheet 1 ea. Catenary Gas conveyance loop, part of GFS2102 system accessories (secured in the lid of the molded case) Table 2 Table 9. European Reference gas cylinder assemblies’ parts lists Note Two cylinders, one of each size for the appropriate geographic location, can be ordered with the system. DESCRIPTION 1 ea. European 1.1 Liter Reference gas cylinder assembly including: PART # 3888726 • Reference gas cylinder, European 1.1 Liter • Reference gas cylinder connector • Regulator assembly, 690 kPag (100 psig) • Reference gas cylinder support, 1.1 Liter 1 ea. European 1.5 Liter Reference gas cylinder assembly including: 3888732 • Reference gas cylinder, European 1.5 Liter • Reference gas cylinder connector • Regulator assembly, 550 kPag (80 psig) • Reference gas cylinder support, 1.5 Liter Accessories included with every cylinder 1 ea. Molded case with inserts including: NPN • 1/16” Swage QC stem and plug assembly • Foam insert for shipment of regulator assembly • Technical data sheet 1 ea. 3.1.9 Catenary Gas conveyance loop, part of GFS2102 system accessories (secured in the lid of the molded case) Table 2 System Controller Warning Check the System Controller power supply voltage setting prior to connecting it to power. For installations of the GFS system outside of the United States the System Controller voltage setting may have to be changed to prevent damage to its power supply. The system may ship with the power supply set for 110-120 VAC power, but can be changed for 200240 VAC operation. The system controller consists of a personal computer, flat screen display, keyboard and pointing device (“mouse”). These are packed in (2) to (4) corrugated containers, depending on configuration. The system controller is delivered with all necessary GFS2102 system software pre-loaded including GFS Tools™. The part number of the system controller is 3141260. Page 23 © 2011 Fluke Calibration GFS2102™ OPERATION AND MAINTENANCE MANUAL 3.1.10 MS-2102-0.7 Mass Set The MS-2102-0.7 mass set and mass carrier are not included in the GFS2102 base system but may be purchased with the system. The full mass set may be purchased, which includes a mass carrier, or the mass carrier may be purchased alone. Either option is packed in a molded plastic case inside a corrugated liner. The plastic case comes with a foam insert with custom cutouts to hold both the mass carrier and the four piece, 700 g mass set. The MS-2102-0.7 mass set is included in the GFS2102 base system. The mass set is packed in a molded plastic case inside a corrugated liner. The plastic case comes with a foam insert with custom cutouts to hold both the mass carrier and the four piece, 700 g mass set. Table 10 details all items included with the MS-2102-0.7 mass set. Table 10. MS-2102-0.7 mass set parts list DESCRIPTION 1 ea. MS-2102-0.7 mass carrier set including: PART # 3888268 • mass carrier assembly • molded plastic shipping and storage case with inserts 3 ea. 200 g mass 3124455 1 ea. 100 g mass 3124443 3.1.11 molstics The low flow molstic and mid flow molstic are included in the GFS2102. Each molstic is wrapped in plastic and shipped individually inside corrugated containers. See section 3.3.15 for more information on molstics. Table 11 details all items included with the molstics. Table 11. Molstic Parts List DESCRIPTION 1 ea. MOLSTIC-L MOUNTING SYSTEM, SINGLE, LO FLOW PART # 4089196 Accessory kit including: 2 ea. O-RING, VITON, BROWN, 2-202 3135450 1 ea. CAP, SS, 4VCR 3135624 1 ea. STEM, QC, SS, 4T, DESO 3136774 1 ea. ROD, VOLUME FILL, MOLSTIC 3118179 1 ea. INSTRUCTIONS, MOLSTIC LO FLOW 3152468 DESCRIPTION 1 ea. MOLSTIC-L MOUNTING SYSTEM, SINGLE, MID FLOW PART # 4089205 Accessory kit including: 2 ea. O-RING, VITON, BROWN, 2-202 3135450 1 ea. CAP, SS, 4VCR 3135624 1 ea. STEM, QC, SS, 4T, DESO 3136774 1 ea. BRACKET, CRADLE, MOLSTIC HI/MID 3146103 1 ea. INSTRUCTIONS, MOLSTIC MID FLOW 3152454 © 2011 Fluke Calibration Page 24 3. INSTALLATION 3.2 Site Requirements 3.2.1 GFS2102 system The environment required to operate the GFS2102 gravimetric flow standard within its estimated measurement uncertainty limits is generally that of a high level, physical metrology laboratory. When selecting and preparing a site to set up the GFS2102 system, the following environmental influences should be considered: Ambient conditions: To achieve optimum metrological performance, ambient conditions should be controlled and maintained within the following limits: Temperature: 15 to 25 °C, with a minimized rate of change of temperature. Relative Humidity: 5 to 70% RH (non-condensing). Ambient Pressure: Minimize external influences that will cause barometric instability. Air Currents: Do not install the GFS2102 draft enclosure near or under a source of air currents such as an overhead air conditioning duct. These can exaggerate the magnitude and rate of changes in ambient temperature. Vibration: Minimize local vibration. Excessive vibration will reduce the stability of the mass and subsequent flow values measured by GFS2102. Following are other site selection criteria to consider: Overall footprint and system layout: The GFS2102 draft enclosure and vibration isolation table should be set up in relation to the work surface for the device under test (DUT) as shown in Figure 12. As the draft enclosure is viewed from the front, the flow path exit from the enclosure is designed to be from the left or right side. To minimize the volume of the flow path and number of connections, the GFS enclosure and table should be placed near the location of the DUT work surface. The height of the flow path exit from the draft enclosure is approximately 40 in. from the floor. Both the enclosure and table are approximately 36 in. wide by 24 in. deep. The table top is 34 in. high and the top of the enclosure is 58 in. high. Electrical power supply: Plan the supply of electrical power to the vicinity or the GFS system. See Section 1.1.1 for GFS system electrical power requirements. Be sure to consider DUT electrical requirements also. Note If low flow (<100sccm) tests will be performed on a regular basis and power interruptions, brown outs, or other power anomalies can occur, a battery backup UPS is recommended. At a minimum, the PC, balance, LCM, MFCCB, and any units powering or interfacing with the DUT (i.e. molbox1) need to be on the battery backup. Vacuum pump: Vacuum is not required for the operation of the GFS2102 system. If the device under test is a molbloc-S or other device that may be used with vacuum, plan to locate the vacuum pump so that heat, noise and vibration do not have negative effect on the system and consider electrical supply needs of the pump. The vacuum pump exhaust outlet should be allowed to exit the room where the GFS is located, preferably to the outdoors, particularly if the calibration gas is volatile or toxic. Note A vacuum pump interconnect kit is normally ordered with a vacuum pump and includes a check valve to vent gas in the event of a power failure rather than over pressurizing the molbox1 pressure transducers. This check valve should also be connected to an exhaust vent. Page 25 © 2011 Fluke Calibration GFS2102™ OPERATION AND MAINTENANCE MANUAL Figure 12. Typical layout of overall GFS2102 system at site of use 3.2.2 GFS-FS Reference Gas Cylinder Fill Station The GFS-FS reference gas cylinder fill station may be located away from the flow measurement components of the GFS2102 system. Following are site selection criteria to consider for the GFS-FS: GFS-FS dimensions and mounting: GFS-FS is designed so that it can be easily mounted to a wall or bench for convenient operation. The GFS-FS base if positioned on a vertical wall or surface, measures 20 cm (7.9 in.) high by 41.4 cm (16.3 in.) wide. The overall depth from the wall is 20 cm (7.9 in.) at the pressure regulator handle. The mounting holes are spaced center-to-center 38 cm (15 in.) across by 17.4 cm (6.9 in.) down and are designed to use M6 or ¼” bolts or screws. There is a keyhole feature to the upper holes that allows it to be hung while marking or installing the lower screws making it convenient for one person to install. When mounting GFS-FS, leave adequate room to access the gas connections on both the left and right side of the base. GFS-FS should be located in close proximity to both a high pressure gas supply and a workbench or surface where the reference gas cylinder can be safely placed during filling. The high pressure flex tubes delivered in the GFS-FS accessory kit for connecting GFS-FS to both the gas supply source and the reference gas cylinder are 8 feet (244 cm) in length. Unless alternate plumbing is fabricated to make these connections, the tubing lengths will define the limits for positioning the GFS, gas supply and reference gas cylinder during cylinder filling. © 2011 Fluke Calibration Page 26 3. INSTALLATION High pressure gas supply: The maximum supply pressure and expected gas source to provide the supply for GFS-FS is a gas cylinder at no more than 18 MPa (2700 psi). The supply media should be a clean, dry gas. Gas purity is an important factor in the quality of GFS2102 flow measurements, so the highest level of gas purity is recommended. Accurate measurement of several pure gases is supported with GFS2102. (See Section 4.1.2). The supply connection on GFS-FS is a ¼” Swage bulkhead. An 8 ft (244 cm) flex tube with ¼” Swage connections and a ¼” Swage to ¼” NPT female adaptor are provided as GFS-FS accessories. To connect to this standard hardware, the user must provide a ¼” NPT male nipple or connector from the high pressure cylinder or other supply. Safety: GFS-FS is used to perform recurring high pressure fills of the carbon fiber composite reference gas cylinder. The fill pressure of the reference gas cylinder is within the safe operating pressure rating specified by the cylinders’ manufacturer, but ideally the cylinder filling should be performed in a location that minimizes the possible risks of injury due to the failure of any cylinder, tube or connector at high pressure. The design of GFS-FS allows filling of the reference gas cylinder to occur slowly so that the temperature of the cylinder remains low. The filling operation can be largely unattended once it is started. See Section 4.3 for safe cylinder filling procedures. Warning • The fill station incorporates a 20 MPa (3000 psi) burst disc and a selfresetting Pressure Relief Device set to ~19 MPa (2750 psi), use of the system above ~18 MPa (2700 psi) is not advised. The user is strongly advised not to tamper with these pressure relief devices. In addition, due to the operational nature of these devices, it is highly recommended to hard plumb the vent to direct any potential occurrence away from an operator and/or out of the room. • Pressurized gases are potentially hazardous. Energy stored in these gases can be released unexpectedly and with extreme force. Pressurized systems should be assembled and operated only by personnel who have been instructed in proper safety practices. Ventilation: If any gas other than air is used to fill the reference gas cylinder, proper ventilation should be in place in the location where the reference gas cylinder is filled and the GFS2102 system is used. Volatile or toxic gases especially must be vented, and even inert gases present a real hazard to operators, especially in small spaces, if they force the oxygen levels in the room to drop. Convenience to GFS2102 system: Minimizing the distance between the filling location and the GFS2102 system is desired since the reference gas cylinder must be transported between the two locations, often while pressurized. A molded plastic case is provided for each reference gas cylinder assembly to make transport of the cylinder safer and more convenient. Vacuum availability: One method for ensuring gas purity after changing test gases in a reference gas cylinder or opening the cylinder to atmosphere is to evacuate the cylinder using vacuum before refilling (See Section 4.3.2). If this method will be used, the vacuum source and connection should be convenient to the cylinder filling location. Warning Never connect and open the reference gas cylinder to the vacuum pump while pressure remains in the cylinder or damage could occur to the vacuum pump. Always vent the cylinder to atmosphere first. Page 27 © 2011 Fluke Calibration GFS2102™ OPERATION AND MAINTENANCE MANUAL 3.3 Setup Note Before setting up the GFS2102 system, see Section 3.2 for information on site requirements. To set up the GFS2102 system, first unpack it following the instructions in Section 3.1. Then follow the set up instructions in Sections 3.3.1 to 3.3.14 sequentially. 3.3.1 Position the Vibration Isolation Table Refer to the Site Requirements section of this manual when considering location and placement of the granite vibration isolation table and draft enclosure (See Section 3.2). Consideration for positioning of all items including the granite table, GFS draft enclosure, and a lab bench for the LCM, MFC-CB, device under test, flow controllers and other flow path hardware, and system controller. It is highly recommended to use a bubble (spirit) level and the four adjustable feet on the steel support stand to level the surface of the granite table surface before proceeding. Warning The granite vibration isolation table top weighs over 600 lb. (270 kg). Professional assistance and special equipment are needed to move it into position in the laboratory. 3.3.2 Install Draft Enclosure on Vibration Isolation Table Set the draft enclosure on the granite vibration isolation table so that the open side with hinges for mounting the glass doors faces the front. The bottom of the enclosure is open so that the top of the granite table is exposed. Install the draft enclosure positioning brackets on the enclosure so that they hold the granite table top under each ledge. Remove the draft enclosure sidewall column by removing the six screws that secure it. A 3 mm Allen wrench should be used to remove the screws. The column is typically installed on the right but can be mounted on the left for operational convenience. Connect the external gas conveyance tube to the bottom of the isolation valve mounted inside of the sidewall column and run the remaining tube out through the flow path passthrough opening in the enclosure. It is important that this connection does not leak. © 2011 Fluke Calibration Page 28 3. INSTALLATION Place the clear enclosure pressure transport tube just inside the rear enclosure utility pass-through opening and run the remaining tube out through the opening for connection later to the LCM. Locate the two TH probe assemblies, one PRT probe assembly, and one infrared probe. These are all accessories of the LCM. Run the cables for the two TH probes, the cable for the PRT probe, and the cable from the IR probe converter box (blue box mounted in the sidewall column) through the utility pass-through opening so that the probes remain on the inside of the enclosure. The five pin end of the AMH driver cable should be attached to the inside of the enclosure by a cable clamp. The 12 pin end is run through the utility passthrough opening in the enclosure. Connect the white cable attached to the black IR probe sensor to the blue converter box in the column. Locate the DC volts power cord of the GFS balance power adaptor. Run it through the utility pass-through opening also so that it can connect to the balance inside the enclosure. The power adaptor and AC power cord should remain on the outside of the enclosure. Run one 9 pin D-sub cable through the utility passthrough opening of the draft enclosure. The end of the cable with male pins should be inside the enclosure. Replace the draft enclosure sidewall column onto the side of the draft enclosure (left or right) that presents the most operational convenience. Locate the glass doors for the draft enclosure. Hang one door on the hinges. Repeat for the other door. The hinges may need to be adjusted to allow the glass doors to sit level and flush with each other in the center. Adjust the doors to minimize the gap between the doors which could allow air currents to enter the draft enclosure and affect the balance measurements. When closed, the doors should be in contact with the rubber seal along the entire edge of the draft enclosure. The doors are held closed by a foam backed metal bar that runs vertically up the center of the enclosure, held in place by a thumb screw on the top of the enclosure. Figure 13. Installation of draft enclosure doors. Page 29 © 2011 Fluke Calibration GFS2102™ OPERATION AND MAINTENANCE MANUAL 3.3.3 Setup LCM Place the LCM on a workbench, shelf, or on top of the enclosure and within reach of the enclosure probe cables and connections (TH, PRT, IR, AMH driver, balance 9 pin D-sub, pressure tube). Figure 14. LCM rear panel connections Connect one TH probe cable to the TH2 port on the rear panel of the LCM. Connect the other TH probe cable to the TH3 port on the rear panel of the LCM. Connect the PRT probe cable to the T4 port on the rear panel of the LCM. Connect the infrared box cable to the T5 port on the rear panel of the LCM. Attach the clear enclosure pressure transport tube on to the fitting of the ATM P1 port of the LCM. Connect the AMH driver cable to the DRIVERS port on the rear panel of the LCM. Connect a 9 pin D-sub cable from the COM1 port on the rear of the LCM to the COM1 serial port of the system controller (preferred) or to one port of the system controller’s USB serial adaptor. Connect the 9 pin D-sub cable that runs into the draft enclosure to the COM2 port on the rear panel of the LCM. Connect the LCM power cord to the connector labeled 12 VDC on the LCM rear panel. 3.3.4 Setup MFC-CB Place the MFC-CB on a workbench, shelf, or on top of the enclosure so that the MFC cable can comfortably reach a mass flow controller in the system flow path near the device under test. Connect a 9 pin D-sub cable from the COM1 port on the rear of the MFC-CB to one port of the system controller’s USB serial adaptor. Connect the power cord to the MFC-CB rear panel. © 2011 Fluke Calibration Page 30 3. INSTALLATION 3.3.5 Set up the System Controller (PC) The system controller is a standard personal computer with flat screen display, keyboard and pointing device. These may be installed on the laboratory work surface near the GFS draft enclosure. It will help to have the PC within a close proximity to the rest of the system since there are at least two serial connections between the system controller and other components in the GFS system (via the USB serial adaptor). GFS Tools software must be installed on the system controller and in general will be preinstalled by Fluke Calibration. Connect the USB serial adaptor to any convenient USB port on the system controller. Serial connections for GFS2102 system Use 9 pin D-sub cables to connect the following: • Any COM port (COM1 is preferred) of USB serial adaptor to LCM COM1 port • COM 2 port of LCM to COM port of GFS balance • Any COM port of USB serial adaptor to MFC-CB COM 1 port • Use any remaining COM ports of the USB serial adaptor to connect to DUT serial connection, for example a molbox1 COM1 port. 3.3.6 Verify GFS Calibration Data Certain calibration coefficients are stored in either the LCM, the TH probes or GFS Tools software, all of which should be verified to be correct before making measurements. Regardless of location, all coefficients can be viewed in GFS Tools by selecting the [Setup][Calibration] menu choice to access the Calibration Editor (see Section 5.5.7). Verify/enter the following data: On the Time/Mass tab, verify that the Reference Mass and Reference Mass density field entries match the data in the most recent reference mass calibration report. This mass value must be manually entered into GFS Tools each time the Reference Mass is recalibrated. On the Ambient tab, verify that the Ambient Pressure, PRT Temperature (if used), and ambient Humidity (if used) calibration data match the most recent LCM calibration report. These values are stored in the LCM and are read automatically from LCM into GFS Tools. Note that newer LCMs do not contain an ambient PRT or ambient humidity sensor as these readings were not used by the GFS system. On the TH Probe #2 and TH Probe #3 tabs, verify that each set of data matches the TH probe data in the most recent LCM calibration report. This data is stored inside each individual TH probe and is read by the LCM and into GFS Tools. The probes must be connected to the LCM to access the data. On the External PRT tab, verify that the balance PRT calibration data matches the data from the most recent LCM calibration report. This data is stored inside the LCM and is read automatically into GFS Tools. On the IR Probe tab, verify that the infrared probe calibration data matches the data from the most recent LCM calibration report. This data is stored inside the LCM and is read automatically into GFS Tools. Page 31 © 2011 Fluke Calibration GFS2102™ OPERATION AND MAINTENANCE MANUAL 3.3.7 Assemble Reference Gas Cylinder(s) Each GFS2102 reference gas cylinder assembly includes the reference gas cylinder, the regulator assembly, the reference gas cylinder connector, and the cylinder support. (See Figure 15.) Figure 15. Reference gas cylinder assembly Reference gas cylinder Reference gas cylinder connector Regulator assembly Cylinder support Caution Never ship the reference gas cylinder assembly in the fill/carry case while the regulator assembly is installed on the reference gas cylinder. This could lead to damage of the regulator assembly, potentially causing a failure of the regulator assembly tubing under high pressure. Warning Energy stored in high pressure gases can be released unexpectedly and with extreme force. High pressure systems should be assembled and operated only by personnel who have been instructed in proper safety practices. The reference gas cylinder assembly will arrive from the factory with the regulator assembly disconnected from the rest of the cylinder assembly. All parts of the reference gas cylinder assembly are shipped inside the carry/fill case. The regulator assembly is packed in a custom foam cut-out inside the case to protect it from damage. The reference gas cylinder connector is installed in the cylinder. Use the following steps to install the regulator assembly into the reference gas cylinder connector: © 2011 Fluke Calibration Page 32 3. INSTALLATION Remove the reference gas cylinder assembly and the regulator assembly from the carry/fill case. Locate the regulator stem port of the connector. (See Figure 16.) 1. Fill valve 2. Fill port 3. Regulator stem port Figure 16. Reference gas cylinder connector Remove the DH200 gland and plug from the regulator stem port of the reference gas cylinder connector and retain the gland. The regulator assembly will be packaged with a steel collar that threads onto the regulator stem. If the collar is already on the stem, it must be removed. The collar uses a left-hand thread. Slide the gland from step onto the regulator stem with the threads facing down (away from the regulators), and thread the collar back onto the stem below the gland. Engage the collar threads fully so that at least one thread shows between the collar and the coned end of the stem. Place the regulator assembly on the reference gas cylinder assembly with the regulator stem in the cylinder connector’s regulator stem port. The position of the regulator assembly should be such that when the fill port and valve on the cylinder connector face forward towards the operator, the exit tube of the regulator assembly with the quick connector faces to the perpendicular left or right depending on which side of the enclosure the sidewall column was installed in section 3.3.2. Hand-tighten the DH200 gland into the cylinder connector. Tighten the DH200 gland into the reference cylinder connector, using a wrench to hold the cylinder connector. DO NOT use any type of pipe wrench or vise to hold the assembly by the carbon fiber body of the cylinder. You may want to use a cloth or other material to protect the finish on the reference cylinder connector from scratches. Note: It is critical that the final position of the regulator assembly is such that the exit tube is lined up precisely with the leg of the reference cylinder support on the right side of the cylinder if the sidewall column was installed on the right, or lined up precisely half way between the legs of the reference cylinder support on the left if the sidewall column was installed on the left. View the whole assembly from the top to be sure they are aligned (See Figure 17). Tightening the DH200 gland will rotate the regulator assembly a few degrees clockwise, so it will be necessary to offset the regulator assembly before tightening so that it finishes in the correct position. Several attempts may be necessary to achieve the correct final alignment. If needed, additional alignment steps can be found in Section 6.3. Page 33 © 2011 Fluke Calibration GFS2102™ OPERATION AND MAINTENANCE MANUAL Figure 17. Regulator assembly position before and after tightening for right side operation 3.3.8 Enter Reference Gas Cylinder Data Before making measurements, it is necessary to enter the technical data for each reference gas cylinder assembly you have into GFS Tools software. This data can be found on the technical data sheet that is delivered with each cylinder. Some of the data will be unique to each cylinder so failing to enter the correct data can result in errors in the air buoyancy correction and other calculations that are made. In GFS Tools, use the [Setup][Reference Gas Cylinder] menu choice to access the Reference Cylinder Editor. Fill in the Header Information and Cylinder Characteristics. See Section 5.5.5 for details on the GFS Tools Reference Cylinder Editor. The Cylinder Characteristics can be found on the Cylinder Technical Data sheet provided for each cylinder. 3.3.9 Installation of Reference Mass on Mass Plate Locate the reference mass and the AMH reference mass plate (the AMH plate with NO bubble level on the top surface). The reference mass MUST be installed such that once the legs are installed the leg screws are relatively flush to the surface. The side that has been etched with the nominal mass and mass serial number is typically facing AWAY from the AMH reference mass plate so that these identifiers are plainly visible once installation is complete and the legs will maintain the proper distance between the reference mass and AMH plate. If both sides of the reference mass were etched more attention should be given to the depth of the leg screw assemblies. The mounting legs are indexed similar to the reference gas cylinder, two of the legs have a spherical curve at one end and one has a flat. The legs with the spherical curve need to be mounted so they correspond to the chamfer and groove brass inserts in the AMH plate. The leg with the flat end corresponds to the flat brass AMH plate insert. Figure 18. Reference Mass Legs (Spherical (x 2) and Flat) © 2011 Fluke Calibration Page 34 3. INSTALLATION Invert the AMH plate painted side down on a flat surface, taking care not to damage the painted surface. Padding or cloth of some kind would help keep the surface from damage. Step 1 Install the mass hanger legs by lifting one side of the AMH plate, and starting with the farthest hole place the corresponding leg (spherical to chamfer, flat to flat) through the hole. Continue this with the other two legs. Step 2 Place the reference mass down on the legs with the nominal mass and serial number facing up. Make sure the mass sits completely down on the legs. Step 3 Secure the reference mass to the legs with the screws provided. Once the screws are installed the screw heads should be relatively flush with the surface of the mass. If the screw heads are recessed it is possible the mass is upside down and will not operate properly when placed on the AMH. If a screw is ever lost or misplaced, never simply replace the screw: the reference mass will have to be recalibrated including the original legs and screws and the replacement screw. Note When installing or uninstalling the reference mass, always keep careful track of the screws and mounting legs as these are an integral part of the calibrated reference mass, not only for mounting but also part of the total mass value. When recalibrating, all of these pieces (mass, three legs, three screws) must be calibrated as one mass. If a screw is lost or misplaced the entire assembly needs to be recalibrated with the replacement screw. When picked up and carefully turned back over the reference mass should hang evenly below the plate. Page 35 © 2011 Fluke Calibration GFS2102™ OPERATION AND MAINTENANCE MANUAL 3.3.10 Initial Balance and AMH Base Setup Optional: Install the balance positioning bracket around the two adjustable front legs of the balance. Thread the balance legs fully counterclockwise and remove them so that the legs can be passed through the holes in the bracket and threaded back into the balance. The bracket should be positioned so that the front portion angles upward to where it will attach to the AMH base. Figure 19. Location of balance positioning bracket mounting holes Place the GFS balance on the granite surface inside the draft enclosure. Place the AMH-GFS2102 base over the balance so that the base surrounds the balance. Optional: Connect the balance positioning bracket to the front wall of the AMH base using the two screws and lock washers provided. The AMH belts must be gently pushed aside to access the holes in the AMH base. If you are unable to thread in the screws with the balance in place, it is possible to first connect the bracket to the AMH base only, then install the balance legs through the holes in the bracket while the bracket is already installed on the AMH base. Both methods require some dexterity, and great care should be taken not to shock or drop the balance while doing this. Install the PRT probe through the PRT hole in the back wall of the AMH base. A set screw accessible from the bottom of the AMH may have to be backed out to allow the PRT to slide in. Insert the PRT so that the end of the PRT is even with the center of the custom mass tray post. Tighten the set screw only enough to hold the PRT in place. Connect the 9 pin D-sub cable in the enclosure to the serial port in the rear of the balance. Connect the balance power cord. Balance power connection Serial port Figure 20. GFS balance rear panel connections Turn the balance and AMH base together so that the balance positioning bracket (if installed) is in front and the balance electrical connections are in the rear. Connect the AMH driver cable that is permanently mounted to the GFS sidewall column © 2011 Fluke Calibration Page 36 3. INSTALLATION to the connector on the right side of the AMH base. Install the custom mass tray into the keyed slot on the balance post. Note that the custom mass tray can be placed into the keyed slot in two ways. The correct position for the custom mass tray is such that two legs of the tray are left of the center of the balance (viewed from the front, brass insert with flat recess closest to operator, brass insert with chamfered recess farthest from operator) and one leg is to the right of center (groove in brass insert). Figure 21. GFS balance inside AMH with custom mass tray installed. Using a level placed directly across the top of the custom mass tray, adjust the balance feet so that the custom mass tray sits level in each direction. There is a level indication on the body of the balance, disregard that level in favor of the level placed directly on the custom mass tray. When leveling, make sure that the balance legs are not hung up on the balance positioning bracket and the balance sits freely on the granite surface. Ideally, the bracket will make little or no contact with the balance legs. Using a level, do a rough adjustment of the three adjustable feet on the AMH base so that the sides of the base sit level at approximately 105mm above the granite table. The rough location of the AMH position is 16.0 cm (5 9/32") from the sidewall column or 21.0 cm (8 1/4") from the right side of the enclosure, and 12.5 cm (4 7/8") from the back wall of the enclosure. Final adjustments to the AMH and balance position will be performed later when the AMH plates are installed. Page 37 © 2011 Fluke Calibration GFS2102™ OPERATION AND MAINTENANCE MANUAL 3.3.11 Setup balance location Place the reference gas cylinder on the custom mass tray so that the quick connector on the regulator assembly is on the right side. Visually confirm that the reference gas cylinder assembly sits vertically. If it does not, adjust the cylinder position in the cylinder support, or adjust the balance feet to level the custom mass tray. Move the balance and AMH base so that the distance between the quick connect fittings on the reference gas cylinder assembly and the draft enclosure sidewall column allows the correct shape of the catenary gas conveyance loop. The distance is set by using the loop alignment tool, which slips over the Swage nuts on each stem of the loop and should have little clearance between the hex shoulders of the two quick connect stems when they are connected. A. Loop alignment tool. If you connect the loop to check this distance, be sure to consider that gas will begin to flow from a pressurized cylinder if the cylinder side of the quick-connect is connected first. It is possible to check this distance without connecting the loop by resting the loop in the alignment tool upside down and making sure the outside surface of the hex shoulders on each quick connect stem fit between the quick connect bodies with little clearance. Measure the distance between the ceiling of the draft enclosure and the quick connect fitting on the reference gas cylinder assembly. This distance should match the distance from the bulkhead quick connect fitting on the draft enclosure sidewall column to the ceiling. If it is not the same, adjust the height of the quick connect on the sidewall column so that the flow conveyance loop will sit level. Measure the distance from the back wall of the enclosure to both quick connectors. Reposition the balance if necessary to ensure that the flow path will be parallel to the back wall. 3.3.12 B. Quick check using loop alignment tool. C. Checking loop connector height. Figure 22. Checking height and level of gas conveyance loop connections using loop alignment tool AMH Position Fine Adjustment Proper position of the AMH-GFS2102 assembly relative to the GFS balance is critical to making accurate mass and flow measurements under flowing conditions. When the reference gas cylinder is placed on the custom mass tray, the legs of the cylinder support must pass through the AMH plates without contacting the plates, so that the cylinder mass can be measured with the required sensitivity. This step must be performed AFTER section 3.3.11. Until the operator is fully accustomed to the setup, the steps in this section may have to be repeated several times for proper alignment. © 2011 Fluke Calibration Page 38 3. INSTALLATION During setup, it is necessary to have access to “live” balance output and control of the AMH platform movement, so communication should first be established between a PC running GFS Tools software, the LCM which controls the drivers for the AMH-GFS2102, and the GFS balance. See section 4.2.1. Continue setup with the AMH state set to have the cylinder lowered. After the proper balance location has been established (see Section 3.3.11), install the AMH top plate onto the AMH base. The AMH top plate has a bubble level on the top surface, but no reference mass hanging from it. The top plate should be oriented so that the narrow holes for the reference gas cylinder support are aligned with the custom mass tray; two holes on the left and one on the right. Lower the top plate over the two steel posts on the front and rear of the AMH base. A tight tolerance is used for the fit of the plates over the two posts so that the plates stay well-aligned while moving vertically. Therefore, special care and some practice is required to slide the plates over the posts without binding. Holding the plates at the area of the holes, ensuring that the plate is held level and rocking slightly allows the plates to slide down into place. A light coating of a clean lubricant like Krytox® can be used on the posts if needed. When the top plate is fully in place, the three rollers under the plate can be seen resting directly on the camshafts in the AMH base. Verify the level position of the AMH top plate in both directions using a level. Also verify the indication of the built-in level on the top plate. Adjust the top plate resting position or the AMH adjustable feet to level the top plate. The bubble level is adjusted initially at Fluke Calibration but may shift during shipment. Adjust the bubble level if needed to match the separate level indication so that the built-in level can be used for future leveling. Place the reference gas cylinder onto the balance, passing the cylinder support legs through the holes in the top plate. Recheck the distance between the reference gas cylinder and the draft enclosure wall using the loop alignment tool as described in Section 3.3.11. Visually check the position of the reference gas cylinder assembly on the balance in relation to the AMH top plate. Through the center hole in the top plate the feet of the cylinder support can be seen resting on the custom mass tray. The rear left foot should be centered in a conical hole in the mass tray. The foot on the right should slide into the bottom of the straight groove of the right support on the custom mass tray. The front left foot will simply rest on a flat support. All three legs of the cylinder support should pass through the top plate without contact and appear centered in the holes in the plate. Leaving the balance in place, make small movements in the AMHGFS2102 base position in order to ensure clearance of the reference gas cylinder legs and engage the cylinder support feet as described above. Page 39 Figure 23. Reference Gas Cylinder resting on balance. AMH top plate installed; reference mass plate uninstalled. Figure 24. View of cylinder support legs through AMH top plate. © 2011 Fluke Calibration GFS2102™ OPERATION AND MAINTENANCE MANUAL Using the GFS Tools software, set the AMH to the Zero position (See Section 4.2.2). Adjust the three legs of the AMH evenly to raise or lower the AMH over the balance so that the legs of the cylinder assembly are very close to but not touching the custom mass tray. Exercise (cycle) the AMH platform (See Section 4.2.2). While the AMH is in motion the reference gas cylinder should remain vertical with only very slight or no lateral motion. Also, the feet of the reference gas cylinder support should set down on each cycle into the center of the conical hole and straight groove supports on the custom mass tray without much lateral sliding into place. The flat support is purposefully a large target to account for any other alignment issues. Use the AMH to set the reference gas cylinder to rest on the balance (See Section 4.2.2). Close the doors of the draft enclosure. Using GFS Tools software, view the GFS balance output. (See Section 4.2.1) The mass of the reference gas cylinder should be displayed and should stabilize to within 1 mg (0.001 g). If the indicated mass appears unstable, the reference gas cylinder may be making contact with the AMH plate and further adjustments are needed. Open the doors of the draft enclosure. Remove the reference gas cylinder from the balance and AMH and place it aside. Remove the top plate of the AMH and place it aside. The AMH should still be set for the position of the reference gas cylinder resting on the balance even though it is not installed, this helps with the installation of the bottom plate. Install the bottom AMH plate with the reference mass attached. The bottom plate should be oriented so that the pass through holes for the reference gas cylinder legs are aligned with the custom mass tray; two holes on the left and one on the right, and the legs of the reference mass are just the opposite, two on the right and one on the left. Lower the bottom plate over the two steel posts on the front and rear of the AMH base. A tight tolerance is used for the fit of the plates over the two posts so that the plates stay wellaligned while moving vertically. As with the top plate, special care and some practice is required to slide the plates over the posts without binding. Holding the plates at the area of the holes, ensuring that the plate is held level and rocking slightly allows the plates to slide down into place. A light coating of a clean lubricant like Krytox® can be used on the posts if needed. Exercise the AMH platform again to ensure that the bottom plate is raising and lowering evenly without binding. Set the AMH position to have the reference mass down. Install the AMH top plate. Install the reference gas cylinder. Close the doors of the draft enclosure. Switch between the three states of the AMH: cylinder on the balance, reference mass on the balance, and zero state (neither cylinder or reference mass on the balance). In any of these states the balance output should be stable within 1mg (0.001g) and read a mass value close to the nominal values for the reference mass or cylinder, or close to zero for the zero state. If the cylinder value seems normal but the reference mass value is light or unstable the AMH platform assembly may be too high and can be adjusted down by small counterclockwise adjustments of the legs. If the zero state is reading a high mass and or unstable value the AMH platform assembly may be too low and can be adjusted up by small clockwise adjustments of the legs. Once the AMH height and alignment are correct, the legs can be locked in place with the knurled brass lock nuts on the legs. © 2011 Fluke Calibration Page 40 3. INSTALLATION 3.3.13 Setup Probe Locations Use the telescoping probe positioning arms to hold the two TH probes and the IR temperature probe in the locations as shown in Figure 25. It is important that the position of the three probes is consistent with the labeling and use in GFS Tools software because the measurements are used for different functions. The probe connected to the TH3 port on the LCM rear panel is used to determine the temperature of the air surrounding the reference gas cylinder for air buoyancy mass correction. The probe connected to the TH2 port is used to calculate the air buoyancy on the regulator assembly. The IR probe is used in part to calculate the pressure of the test gas inside the cylinder, to calculate the temperature expanded external volume in the cylinder, and to predict the possible onset of condensation due to cooling of the cylinder surface. TH Probe #2 TH Probe #3 T5 IR Probe Figure 25. Temperature probe positions around reference gas cylinder. Probe positions (not touching reference gas cylinder assembly): • TH Probe #2 should be close to the bottom of the first stage pressure regulator. • TH Probe #3 should be close to the side of the cylinder at mid cylinder height. • T5 IR Probe should be about 4 inches away from cylinder surface, pointed at the cylinder surface at mid cylinder height. Page 41 © 2011 Fluke Calibration GFS2102™ OPERATION AND MAINTENANCE MANUAL 3.3.14 Prepare The Heat Exchanger The heat exchanger will arrive without any liquid and will need to be prepared prior to its initial use. While water can be used alone, it is recommended to use a 50/50 mix of water and antifreeze due to the prolonged period of time that the liquid would be expected to remain in the exchanger. Figure 26. Heat Exchanger, Low Remove the fasteners holding the lid on the heat exchanger and pull the lid/coil out of the exchanger (See Figure 27). Figure 27. Heat Exchanger unassembled If using water only, distilled water is recommended. If using a water/antifreeze mix, prepare an approximately 50/50% mixture of water to antifreeze. Fill the exchanger approximately 80% full. Place the coil assembly in the liquid as far a possible while still being able to observe the liquid level. If necessary add more liquid until the level is about ½” from the top of the exchanger. If liquid spillage from the exchanger is a concern (i.e. frequent bumping or tipping) then run a bead of caulk or gasket compound along the lip of the exchanger before placing the lid completely on. Keep in mind this will complicate future liquid replacement. A three point fastener system is used to secure the lid in place, and typically the lid will only go on in one orientation that will allow alignment of all three holes in the lid with those in the can. Orient the lid and place it on the can. Install the screws through the holes and place the nuts on the screws. Tighten the screws until snug. The Heat Exchanger is now ready to use. When in use it should be between the outlet of the GFS and any downstream hardware such as a pressure regulator, MFC, or molbloc. To facilitate checking the fluid level, weigh the prepared Heat Exchanger and record the mass somewhere on the Exchanger (see Section 6.7). © 2011 Fluke Calibration Page 42 3. INSTALLATION 3.3.15 Connect the DUT Flow Path molstic molbloc mounting systems are available to assist you in flow path setups on the GFS2102™ system. molstics provide an engineered solution to the practical issues of mounting the molbloc, connecting to the gas supply from the GFS, regulating the pressure and connecting the device to be tested. Highest quality components are integrated into a compact assembly to assure optimum molbloc/molbox performance. Figure 28. Single, Low flow molstic molstics provide a quick means to connect to the gas supply output of the GFS. This is followed by a 2 micron (0.5 micron for low flow) filter to protect the downstream components. Then, an adjustable regulator sets and regulates optimum molbloc upstream pressure and protects the molbox transducers against accidental overpressure. The regulator range(s) supports all standard molbloc operating pressure ranges. A bellows shut-off valve, just before the molbloc, allows the gas supply to be shut-off for configuration changes and/or system leak checking. Special cradles support the molbloc(s). A connection and pads are provided downstream of the molbloc for mounting the MFC (mass flow controller), and/or another device under test. There are low, mid and high flow versions of molstic. Only the single channel, low and mid-flow molstics are used with the GFS2102 system. Low flow molstics use a unique, very high stability pressure regulator and minimize dead volumes. They are required for effective use of 2E2 and lower molblocs and can be used up to the 1E3 molbloc size. The mid flow molstics cover the ranges of all the molblocs from as low 2E2 up to the 3E4, and the low end ranges of molbloc-S. If an appropriate molstic for the DUT is unavailable, then at a minimum an individual non-venting regulator and shutoff valve upstream of the DUT are required. If the DUT is a molbloc 1E3-L or below an LNI or equivalent regulator is recommended. If the DUT is larger than a 1E3-L then an appropriate standard non-venting regulator is recommended. For an upstream molbloc, the recommended flow path is GFS, (heat exchanger when appropriate), regulator, shutoff valve, upstream molbloc, flow controller, and optionally a downstream molbloc. For a downstream DUT, the recommended flow path is GFS, (heat exchanger when appropriate), regulator, shutoff valve, optional upstream molbloc, flow controller, and a downstream molbloc. While the optional molblocs are not required, they help the flow controllers to operate more efficiently and can serve as a check standard. Both an upstream and downstream molbloc can be calibrated at the same time against the GFS. 3.3.16 Connect Gas Conveyance Loop Connect the gas conveyance loop by connecting the quick-connect fittings at each end. Note that some versions of GFS come with a low flow and a high flow conveyance loop, choose the one most appropriate for the tests about to be performed. If the flow path outside of the enclosure is prepared, then install the loop by first connecting the downstream side at the enclosure sidewall column quick-connector, then connecting the reference gas cylinder assembly quick-connector. Attempting to connect in the opposite order will cause gas to flow out of the cylinder into the enclosure until the downstream connection is made. Be careful not to disturb the position of the reference gas cylinder while making the connection. Use the loop alignment tool to align the connections and ensure the loop is parallel from end to end. After connecting the gas conveyance loop, check again that a stable mass indication can be viewed in GFS Tools software before starting to flow. This indicates that the balance, cylinder and AMH are still in correct position. Page 43 © 2011 Fluke Calibration GFS2102™ OPERATION AND MAINTENANCE MANUAL Notes © 2011 Fluke Calibration Page 44 4. Operation After the GFS2102 system has been setup, much of the operation of the system is done using the system controller running GFS Tools software. The features and operation of GFS Tools are described in detail in Section 5 of this manual. Section 1 is intended to provide a concise description of important GFS Tools selections and physical operations required for effective use of the GFS2102 system. 4.1 General Operating Principles 4.1.1 GFS2102 Measurement Principle GFS2102 is a gravimetric gas flow standard; that is, it measures the mass flow of a gas by measuring the change in the mass of gas contained in a reference gas cylinder over time as gas flows out of the cylinder. This simple principle makes it a truly fundamental primary mass flow standard. A benefit of the gravimetric principle is that the flow measurement is not strongly dependent on precise knowledge of the gas properties since mass and time are measured directly. Gas purity and knowledge of gas properties is typically important for the measurement made by any device being tested with GFS2102, but they do not contribute significantly to the uncertainty of the mass flow measured by GFS2102, although high purity or research grade gases are recommended. The uncertainty of mass flow measurements made with GFS2102 is dependent largely on its ability to measure the change in mass of the reference gas cylinder during the test. The measurement can be challenging because: • The mass of gas flowed from the reference gas cylinder during one measurement is usually a small fraction of the total mass of the entire assembly on the balance, and thus the mass range of the balance. The high resolution of the balance is critical to allow GFS to perform at its best. • The mass is changing throughout the measurement, which is not an ideal environment for mass balance operation. • The reference gas cylinder must be connected to a fixed flow path to conduct the flow and so it cannot sit freely on the balance. Special effort has been made to minimize the potential impact this physical connection has on GFS mass measurements. • Gravimetric flow measurements often require a very long time, up to hours or days, so considering the already extreme demand GFS has for resolution and precision on mass measurement relative to the balance range, drift in the balance indication over time easily becomes significant to GFS flow measurements and a special system must be used to eliminate its effects. Time measurement is equally important to gravimetric flow measurements, but time is easier to measure with low uncertainty than is mass with the relatively low flow rates and long test times selected in the design of GFS2102. Recording of the precise time at which each mass measurement is made is a key aspect of mass and time measurement for GFS2102. The design of GFS2102 effectively addresses the challenges above to deliver a gas flow measurement with very low uncertainty. Much of the expertise required from the user is to understand the factors that limit the range, convenience and performance of the system as different gases and flow rates are measured. Below are several general topics regarding use of the features of the GFS2102 system to optimize your results. Page 45 © 2011 Fluke Calibration GFS2102™ OPERATION AND MAINTENANCE MANUAL 4.1.2 Gas Dependent Mass Ranges and Cylinder Size Selection Table 12 shows the maximum mass for of each GFS2102 supported gas that will be available for flow testing after a reference gas cylinder fill. Typical supply cylinder fill pressures are listed in the table but actual fill pressures may vary from different gas suppliers and locations. If higher gas supply pressures are available to the user, then higher starting mass loads may be used, up to the limits imposed by the balance maximum mass range of 2.3 kg, and the maximum reference gas cylinder fill pressure and/or GFS-FS supply inlet pressure of 18 MPa (2700 psi). For cylinder selection, the 1.1 liter cylinder with its 690 kPa (100 psi) regulated output is optimal for all flow ranges with most gases except Helium, Hydrogen, or Sulfur Hexafluoride. The maximum nominal expected mass of an empty 1.1 liter cylinder is 1650 grams. With the possible exception of Carbon Tetrafluoride, the 1.1 liter cylinder can not be overfilled at the typical supply cylinder fill pressures in Table 12. The 1.5 liter cylinder with its 550 kPa (80 psi) regulated output is optimal for maximizing test mass and run time available with Helium, Hydrogen, or Sulfur Hexafluoride, but due to the lower regulated output pressure it is not ideal for the other gases in high flow or high pressure test conditions (i.e. 10 slm @ 525 kPa). This cylinder can also easily be overfilled with other gases if taken over the typical maximum fill pressures listed in Table 12 for the 1.5 liter cylinder. The maximum nominal expected mass of an empty 1.5 liter cylinder is 2100 grams. The number of accumulations that can be run from a typical cylinder fill varies depending on several factors, including flow regulation and dwell times, minimum gas pressures, the use and timing of Balance Zero and AutoZero functions, flow stability, and other influences. These are not accounted for in the GFS Tools Test Editor “Minimum Required Test Mass”, this minimum being based only on the mass needed per accumulation, the number of accumulations per flow rate, and the number of flow rates. GFS Tools will warn of blatant overages where the actual Cylinder mass is less than the minimum required, but no more. It is recommended to plan on 25% of the total available mass to be used towards these unaccounted factors. For example; Nitrogen in the 1.1L cylinder could be up to 219 grams of gas mass, which would yield 164.25 grams of useable mass, or sixteen 10 gram accumulations. Warning The fill station incorporates a 20 MPa (3000 psi) burst disc and a selfresetting Pressure Relief Device set to ~19 MPa (2750 psi), use of the system above ~18 MPa (2700 psi) is not advised. The user is strongly advised not to tamper with these pressure relief devices. In addition, due to the operational nature of these devices, it is highly recommended to hard plumb the vent to direct any potential occurrence away from an operator and/or out of the room. Caution • © 2011 Fluke Calibration Do not exceed the maximum gas mass of 650 grams for the 1.1 liter cylinder or 200 grams for the 1.5 liter cylinder. While exceeding these mass limits will not necessarily harm the precision balance, it will place the balance in an overload condition beyond its 2.3kg range and require gas mass to be bled off before a GFS accumulation can be successfully run. Page 46 4. OPERATION • While the thermodynamic properties of a variety of gases can be supported by the molbox/molbloc, Fluke Calibration does not advocate the use of toxic, flammable, oxidizing, or other highly hazardous gases with the GFS system. The GFS system should be operated only by personnel who have been instructed in proper safety practices for compressed gases and are familiar with the Material Safety Data Sheets (MSDS) of the gases being used. • Consideration for switching from a questionable gas When switching from a gas that may interact with another gas, such as Nitrous Oxide, it is recommended to follow the instructions in section 4.3.2 to drain and then rinse the cylinder with an inert gas such as Nitrogen, Argon, or Helium before introducing the new gas. Table 12: Maximum mass available for flow testing for various GFS2102 supported gases. GAS GAS SYMBOL TYPICAL SUPPLY CYLINDER FILL PRESSURE 1.1 LITER CYLINDER 1.5 LITER CYLINDER (MAXIMUM MASS 655g) (MAXIMUM MASS 210g) TYPICAL MAXIMUM FILL PRESSURE TYPICAL GAS MASS TYPICAL MAXIMUM FILL PRESSURE TYPICAL GAS MASS (psig) (MPa) (psig) (MPa) (g) (psig) (MPa) (g) Nitrogen N2 2640 18.2 2610 18 219 1680 11.6 199 Argon Ar 2640 18.2 2610 18 345 1130 7.8 200 Helium He 2640 18.2 2610 18 30 2610 18 41 Air Air 2640 18.2 2610 18 232 1610 11.1 200 Carbon Dioxide CO2 830 5.7 725 5 155 700 4.85 200 Nitrous Oxide N2O 725 5.0 725 5 169 670 4.65 199 Carbon Tetrafluoride CF4 1595 11.0 1560 10.8 650 460 3.2 198 Trifluoromethane CHF3 600 4.1 580 4 245 450 3.1 197 Sulfur Hexafluoride SF6 290 2.0 290 2 185 240 1.69 199 Hexafluoroethane C2F6 430 3.0 435 3 388 250 1.75 196 Xenon Xe 800 5.5 725 5 488 300 2.1 194 Warning The fill station incorporates a 20 MPa (3000 psi) burst disc and a selfresetting Pressure Relief Device set to ~19 MPa (2750 psi), use of the system above ~18 MPa (2700 psi) is not advised. The user is strongly advised not to tamper with these pressure relief devices. In addition, due to the operational nature of these devices, it is highly recommended to hard plumb the vent to direct any potential occurrence away from an operator and/or out of the room. Page 47 © 2011 Fluke Calibration GFS2102™ OPERATION AND MAINTENANCE MANUAL Caution Do not exceed the maximum gas mass of 650 grams for the 1.1 liter cylinder or 200 grams for the 1.5 liter cylinder. While exceeding these mass limits will not necessarily harm the precision balance, it will place the balance in an overload condition beyond its 2.3kg range and require gas mass to be bled off before a GFS accumulation can be successfully run. 4.1.3 AutoZero In order for the GFS2102 mass measurements to be made with the precision and repeatability that is required for the system’s target flow uncertainties, the drift of the balance that occurs over time must be removed from the GFS mass measurements. The AMHGFS2102 platform allows a reference mass to be loaded on the balance at intervals throughout a flow measurement, without disturbing the gas flow, in order to check the balance for drift. The time interval at which this is done can be selected in GFS Tools. Using AMH and the calibrated GFS reference mass, the balance zero and span can be calibrated at any time, and this function can be automatically programmed to occur before each flow measurement if desired. It is known that the primary type of drift that occurs in the balance over time is a “zero shift” and not a span error, so each time a new AutoZero is performed, subsequent mass readings use a corrected zero so that balance drift does not have a significant effect on the system’s ability to measure the critical mass change over long test times. For low flows, which result in long test times, several AutoZero functions will occur during one measurement. For higher flows, often no AutoZero occurs. When a fixed time interval is selected for the AutoZero function to take place, the system will determine if and when it should be done during a test. (See Sections 5.5.2.7, 5.7.4). 4.1.4 GFS2102 Data Collection Methods And Conventions 4.1.4.1 Accumulations During GFS2102 measurements, mass and time data is continuously collected from the time that the test is started until either the user or pre-set test limits end the measurement. Raw mass readings are taken from the balance and are corrected for drift by way of the AutoZero function and for air buoyancy. Since the gas is flowing out of the reference gas cylinder, the mass readings are successively smaller as the mass is depleted from the cylinder. Although the mass is in fact being depleted, we are actually interested in quantifying the amount of gas that is flowing through the GFS2102 hardware and the device under test, not the mass that is still contained in the cylinder, so the change in cylinder mass is reported by GFS Tools software as a positive value known as the accumulated mass. A single GFS flow measurement that is completed after a sufficient amount of mass and time change occurs is known as an accumulation. In the scope of a typical multi-point flow device calibration, an accumulation would be the culmination of many samples into one final reading or data point at a given flow rate. It is possible to setup GFS Tools to take multiple accumulations at each flow point. For details on setting up GFS Tools tests, see Section 5.5.2. 4.1.4.2 Samples Throughout an accumulation, mass measurements are read from the balance at a rate of several readings per second. This is necessary to achieve good results at higher flows where the rate of mass change is relatively large. At low flows, the © 2011 Fluke Calibration Page 48 4. OPERATION rate of mass change is so slow that short term noise, or perturbations, of mass output from the balance can cause more movement in mass values over a small time period than the actual flow does. If all of these mass measurements are translated into flow values, the effect would be a flow indication that is rapid and unstable looking. All of the high speed balance and time output is not used, less frequent updates of mass and time are selected for display and logging in the GFS Tools data files. These updates are known as samples. The rate of sampling is set by recording a sample at a fixed amount of mass change throughout the sampling period, so that only meaningful mass changes are used for flow calculation. Since a fixed amount of mass change is used to define the sampling interval, flow updates occur much faster at higher flows than at low flow rates. This is a logical characteristic of a system that is based on measurement of changes in mass. 4.1.4.3 Averages And Best Fits Each reference flow rate that is displayed during and accumulation represents the system’s measurement of the average mass flow rate since the start of the accumulation. The total accumulated mass and total elapsed time is used to calculate mass flow. In an attempt to record new mass and time values as frequently as reliable values are available, some instability of the displayed mass flow and/or error of the device under test can be observed. This instability is partially due to actual instability in the flow that is controlled and partially due to limits in the system’s ability to read and synchronize mass, time and DUT output readings. This instability falls well within the limits of acceptable performance of the system, but it is clear that to achieve the best results that GFS2102 is capable of delivering, some averaging of the real-time mass flow indications should be done. When averaging is used, the resulting dynamic output is more stable and overall repeatability is improved between accumulations. GFS Tools uses a rolling average mass value setup with a user-definable number of consecutive samples to be averaged. Although not recommended, if the user would like to use a real-time mass value instead, the rolling averaging time can be set to 1 sample (see Section 5.5.6.1). GFS Tools also uses a rolling average flow setup with a user-definable number of consecutive samples to be averaged. If the user would like to use a real-time calculated flow instead, the rolling averaging time can be set to 1 sample (see Section 5.5.6.1). A best fit of the mass vs. time curve is available for flow and flow error calculation in GFS Tools as well. This method uses a fit of all of the calculated flow values during an accumulation instead of just a rolling average of just a few, and appears to give the best repeatability possible, but the method is not as reliable when AutoZero updates occur during an accumulation because of discontinuity of mass measurements. The best fit flow may be a useful output for users when measuring high flow with short test times not requiring an AutoZero (see Section 5.1.5.6, 5.7.8). 4.1.5 Settings for Flow Sampling GFS2102 is a dynamic gravimetric flow standard, which means that changes in mass are measured and flow calculated “on the fly” as the gas is flowing. But the key benefit of the dynamic property of the system is not in the fact that real-time flow can be displayed. The ultimate goal of low-uncertainty flow measurement requires that a significant amount of mass and time are used in each accumulation, as with static gravimetric measurements. More important benefits of the dynamic system are that problems associated with starting and stopping the flow are eliminated since steady flow can be established before the measurement starts and the fact that the system can run multiple automated test points unattended. One could say that the only calculated flow rate or DUT flow error that is Page 49 © 2011 Fluke Calibration GFS2102™ OPERATION AND MAINTENANCE MANUAL important for a GFS2102 accumulation is the one that is determined at the end of the accumulation when uncertainty is minimized. But it is instructive for the user to view the realtime changes in calculated flow or flow error as the accumulation progresses. It gives the user a guide as to how stable the calculated flow value is and when enough time and mass has accumulated to produce the very repeatable results. 4.1.5.1 Setting Up Starting and Ending Sample Tolerance While the absolute value of the reference cylinder mass reading is not critical, the change in mass since the start of the accumulation is the key measurement. At any given time after the start of the accumulation, the accumulated mass divided by the elapsed time gives a value of the average mass flow for the accumulation up to that point. The mass flow would be the slope of a plot (or best fit line of the plot) of accumulated mass vs. elapsed time. At the beginning of the accumulation, relatively small variations in the mass or time readings will change the slope significantly. As more time and mass is accumulated, the slope becomes more consistent and any contributors to uncertainty in time or mass measurement become less significant. For this reason, calculated flow values are not usually displayed at the beginning of an accumulation. The initial calculated flow values are not meaningful and in the frequent cases where DUT flow errors are plotted throughout the accumulation, these large early error values cause scaling problems that do not allow easy viewing of the precise error values that result later in the accumulation. To assist the user with determining useful limits on how much mass to deplete during an accumulation and when useful samples and flow calculations should begin during the accumulation, the GFS Tools test setup allows the user to select these starting and stopping points in terms of a predicted uncertainty of the flow value at that point. There is always an inherent trade off with gravimetric measurements between flow uncertainty and time taken for a measurement. This method helps the user get the results desired, maintain practical test times, and estimate how much mass must be used for each point. The predicted uncertainty at which the user would like to end the accumulation is called the Ending Sample % Rdg Tolerance. When this value is entered in the Test Definition Editor, GFS Tools predicts the amount of mass that will be used for the accumulation and the amount of time needed for it and displays them. The user can also enter a fixed value of mass to use, and view a calculated Ending Sample % Rdg Tolerance. In the same Test Definition Editor tab, the user selects a Starting Sample % Rdg Tolerance, which defines the point at which the first flow sample is displayed and recorded. The time to reach this point is also displayed to help determine a reasonable selection. These entries in the Test Definition Editor are described in detail in Section 5.5.2.6. 4.2 Manual GFS Tools Operation Using GFS Tools software, GFS2102 users can setup and run fully automated flow tests. However, since GFS Tools is the main user interface to GFS2102, frequently users will want to operate and read parts of the system without conducting a full flow test. Below, several functions are described that may be done manually using GFS Tools. 4.2.1 Reading the Balance It is necessary to read the balance during setup of the GFS2102 system to ensure that it is communicating correctly and the positioning of the balance and AMH-GFS2102 allows stable mass indications. At any time, to quickly get a direct indication from the balance, first run a diagnostic test using [Run][Run Diagnostic Test]. During the diagnostic test initialization, most of the device setups and pre-test operations are automatically skipped to quickly take © 2011 Fluke Calibration Page 50 4. OPERATION you to a point where the balance output and LCM conditions can be viewed. When the test is initialized, select the Balance Interface from the drop down menu option next to the [GFS] display toolbar button. Real time output of the balance is displayed. 4.2.2 AMH Operation For several reasons a user may want manual control of the AMH-GFS2102 platform movement to raise and lower the reference mass or reference gas cylinder. It is helpful to test the position and movement of the cylinder assembly and AMH during setup of the system. There are two ways to gain manual control of the AMH, one by using [Tools][Change GFS AMH State] within GFS Tools, or to start a diagnostic test as described above in Section 4.2.1. Select the icon for the GFS display. At the bottom of the GFS display window the four icons at the right allow access to all three AMH positions, and an option to continuously cycle the AMH through each position. 4.2.3 Balance Zero and Span Adjustment Although the change in mass during an accumulation is more important than the absolute value of the mass, it may be desirable to zero the balance or to calibrate zero and span on the balance before the beginning of a test or accumulation. Zeroing the balance before starting allows easy viewing of the balance’s stability during an accumulation by viewing the size of the AutoZero correction each time an AutoZero is performed. Running a zero and span ensures that the slope of the balance output is as accurate as possible in the mass range where it will be relied on to measure a change in mass. Icons are available in the GFS Tools, GFS display window that allow a user to quickly run a zero and span correction on the balance. The reference mass is used for the span and the states of zero or reference mass loaded are controlled by the AMH automatically so the process is easy and fast. (See Section 5.1.5.2.3) Users can also set up GFS Tools to automatically perform a balance zero function before each test or accumulation (see Sections 5.5.2.7, 5.2.2.1), but the zero and span function is reserved for occasional use and cannot be set to run automatically. 4.3 Reference Gas Cylinder Filling Warning Pressurized gases are potentially hazardous. Energy stored in these gases can be released unexpectedly and with extreme force. Pressurized systems should be assembled and operated only by personnel who have been instructed in proper safety practices. Caution While the thermodynamic properties of a variety of gases can be supported by the molbox/molbloc, Fluke Calibration does not advocate the use of toxic, flammable, oxidizing, or other highly hazardous gases with the GFS system. The GFS system should be operated only by personnel who have been instructed in proper safety practices for compressed gases and are familiar with the Material Safety Data Sheets (MSDS) of the gases being used. Page 51 © 2011 Fluke Calibration GFS2102™ OPERATION AND MAINTENANCE MANUAL It will be necessary for the GFS2102 user to regularly refill the reference gas cylinders between tests. Filling of the cylinders is done using the GFS-FS reference gas cylinder fill station. The fill station is specifically designed for filling the reference gas cylinders at a slow rate so that heating of the cylinder is minimized. If the cylinder is filled to its working pressure quickly, the cylinder temperature may rise to 50 °C or more. The cylinders are designed and tested to withstand certain fast filling and levels of heating, but if the cylinder is heated to extremes the aluminum could separate from the carbon fiber/resin coating or such temperature instability will cause major GFS flow measurement problems unless the cylinder is completely cooled. It is better to fill the cylinder slowly and avoid excessive heating. Even after filling with GFS-FS, the cylinder may require more than one hour to completely cool. Frequent users of the system will find it efficient to have more than one cylinder of each size that they use so that one can be refilled and cooled while the other is in use. The following guidelines should be used for reference gas cylinder refills. 4.3.1 Transporting the Reference Gas Cylinder Assembly The reference gas cylinder assembly is used to contain very high pressure gas and should be handled with care, especially when it is filled. The risk of high pressure cylinders becoming projectiles when stems or valves are broken off is well documented. A molded plastic case is provided with each reference gas cylinder assembly for the purpose of storage and transport. The cylinder support, connector and regulator assembly can all remain attached to the cylinder while it is placed in the plastic case. The assembly can be carried to the location of the GFS fill station, filled and returned to the GFS2102 work area all inside the case. Warning Do not ship the reference gas cylinder while pressurized or with the regulator assembly attached. See Section 6.4 for instructions on preparing a cylinder for shipment. 4.3.2 Draining, Evacuating and Rinsing When the test gas used in the reference gas cylinder will be changed from one test to the next, or when the cylinder has sat for a long time between tests and may be fully or partially filled with air, some action is needed to ensure that the cylinder is refilled with a pure gas for further testing. Do not rely on the quick connect fitting on the regulator assembly to provide a positive shutoff from gas leaving or entering the cylinder if the quick connector has no stem connected. Stems with plugs are provided with the GFS2102 system to allow a positive seal to the cylinder to be made when a filled cylinder sits disconnected from the flow system. Draining When preparing to switch from one gas to another, use proper precautions for safely bleeding the pressurized gas and venting or disposing of any remaining gases to drain the gas from inside the reference gas cylinder. If the flowpath from the DUT is safely vented away from personnel, the safest way to drain the cylinder is to allow it to flow out through a connected flowpath as if a test were to be run, for example starting a manual test and setting 100% flow of the connected DUT molbloc. The gas can also be drained slowly from the cylinder independent of the system through the cylinder fill port, loosening and leaving the fill port plug in place to assist in controlling the drain rate, and slowly opening the fill valve to start the flow of gas. Never perform these operations in an enclosed space. Evacuation When switching gases, an effective way to produce a pure gas fill with the new gas is to first evacuate the cylinder using vacuum. If a vacuum pump is used for cylinder evacuation, it is important that either a dry pump is used, or precautions are taken to avoid any backflow of pump oil into the cylinder assembly. Under low vacuum conditions with little flow, molecular backflow of oil vapor from an oil lubricated pump to upstream components is common. It is not necessary to use a pump that generates a low ultimate vacuum, especially if some “rinsing” of the cylinder is done. © 2011 Fluke Calibration Page 52 4. OPERATION Rinsing Whether using vacuum or not, a good way to ensure a pure gas fill is to also do some “rinsing” of the cylinder during filling. Rinsing refers to partially filling the cylinder with the new gas, then venting it until close to atmospheric pressure and refilling again. When starting from an evacuated cylinder, doing this one time up to 700 kPa (100 psi) or more and venting would be sufficient. When starting from atmospheric pressure with remains of the previous gas in the cylinder, a filling and draining two to three times to this pressure before filling would ensure sufficient purity. Consideration for switching from a questionable gas When switching from a gas that may interact with another gas, such as Nitrous Oxide, it is recommended to follow the instructions above to drain and then rinse the cylinder with an inert gas such as Nitrogen, Argon, or Helium before introducing the new gas. 4.3.3 Connecting to GFS-FS 4T Swage supply connection 4T Swage exhaust DH500 connection to cylinder tube connection Figure 29. GFS-FS reference gas cylinder fill station connections Fill valve Fill port Regulator stem port Figure 30. Reference gas cylinder connector Page 53 © 2011 Fluke Calibration GFS2102™ OPERATION AND MAINTENANCE MANUAL Use the following steps to make connections from the reference gas cylinder to GFS-FS • Be sure that the GFS-FS pressure regulator is fully backed out. • Make sure that reference gas cylinder fill valve is closed. • Connect ¼” Swage flex tube to gas pressure supply of no more than 18 MPa (2700 psi) using Swage to NPTF adaptor or other connections as needed. Do not apply pressure from supply source at this point. • Connect the other end of the ¼” Swage flex tube to the Supply port on GFS-FS • Apply pressure from the supply to the GFS-FS. Pressure supplied to GFS-FS supply port must be no more than 18 MPa (2700 psi). • Remove the fill port plug from reference gas cylinder connector. • Connect the DH200 fitting of the flex tube to the reference gas cylinder connector fill port but do not tighten at this time to allow for purging the supply lines in Section 4.3.4. • Connect the DH500 fitting of the flex tube to the Reference Cylinder port on GFS-FS. • An exhaust connection is available to optionally vent to an exhaust tube in case of overpressure or while backing the regulator off. 4.3.4 Filling the Cylinder Warning The fill station incorporates a 20 MPa (3000 psi) burst disc and a selfresetting Pressure Relief Device set to ~19 MPa (2750 psi), use of the system above ~18 MPa (2700 psi) is not advised. The user is strongly advised not to tamper with these pressure relief devices. In addition, due to the operational nature of these devices, it is highly recommended to hard plumb the vent to direct any potential occurrence away from an operator and/or out of the room. • Check Table 12 in Section 4.1.2 to determine the desired reference gas cylinder fill pressure for the test gas being used. • Rest the reference gas cylinder assembly in its carrying case with the lid of the case open during filling. This will provide a convenient place for the assembly to set and allows adequate ventilation of the cylinder during filling. The cylinder will rise in temperature temporarily as high pressure gas is added to it. • To purge the lines with pure gas between the supply cylinder and Reference Cylinder, turn the GFS-FS regulator clockwise until gas can be heard venting from the reference gas cylinder fill port DH200 connection that was left loose in Section 4.3.3. Allow a few moments (~5 seconds) for purging, then tighten the DH200 connection. Caution Always set the Adjusted Output prior to opening the fill valve. It is important to follow the next steps exactly in order. There are two concerns if the fill valve is opened before the Adjusted Output is set: 1) residual pressure in a cylinder being refilled will flow backwards from the cylinder and out the Fill Station exhaust port; or 2) an evacuated bottle has the potential to pull ambient air in before the pure fill gas is applied, which would contaminate the gas sample slightly. © 2011 Fluke Calibration Page 54 4. OPERATION • Turn the GFS-FS regulator clockwise to bring the indicated pressure on the Adjusted Output gauge to the desired reference gas cylinder fill pressure. As there is little volume in the fill station and no flow yet, the Reference Cylinder gauge will fairly quickly match the Adjusted Output gauge. • Open the fill valve of the reference gas cylinder fill connector. To open the valve, it is not necessary to turn the valve any more than ½ turn counter-clockwise. If the valve is fully backed out while the cylinder is filling or is under pressure, the valve could dislodge from the cylinder connector dangerously. As a safety feature, the valve is designed to start venting through a hole in the side of the cylinder connector approximately two full turns prior to dislodging as an audible warning that an unsafe condition is occurring. Warning To open the valve, it is not necessary to turn the valve any more than ½ turn. If the valve is fully backed out counter-clockwise while the cylinder is under pressure, the valve could dislodge from the cylinder connector dangerously. The valve is designed to start leaking through a side vent hole two turns before release as an audible warning that an unsafe condition is occurring. • Once the fill valve is opened, the indicated pressure on the Reference Cylinder gauge will rapidly drop to the actual pressure in the cylinder, and then will slowly approach the Adjusted Output pressure over the course of several minutes. If the fill station is in a location where it is safe from disturbance by untrained persons, it can be left unattended while filling. During filling and discharging, some movement of the reference gas cylinder’s composite overwrapping may occur and this may generate some noise, often described as snapping or popping. This is normal. • When the cylinder has reached the desired fill pressure, close the reference gas cylinder fill valve. • Turn the GFS-FS regulator counter-clockwise to reduce the Reference Gas Cylinder adjust pressure to zero. Any remaining pressure in the connections to the reference gas cylinder will be vented. • Disconnect the DH200 fitting from the reference gas cylinder fill port, reinsert the fill plug into the fill port, and tighten the fill plug. • To transport the reference gas cylinder assembly back to the GFS2102 work area, securely close and latch its case and transport it inside the case. • The reference gas cylinder temperature will be elevated after filling. It should be left open to the surrounding air to cool off for at least one hour before use. Best results will be obtained only when the cylinder has reached room temperature before starting an accumulation. A test can be started immediately if the Pre-Test Time Delay feature is used to delay the automated test from running until the cylinder has had a chance to cool (See Section 5.5.2.4). Caution • Do not expose the reference gas cylinder to temperatures above 56 °C (133 °F). If you suspect that a reference gas cylinder has been heated to temperatures of 56 °C or more, it must be hydrostatically retested and fully re-qualified before further use. Reference gas cylinders exposed to or with evidence of exposure to heat in excess of 72 °C (162 °F) must be condemned and removed from service. • The design life of the GFS reference gas cylinders is 15 years from the date of manufacture. After 15 years the cylinders should be discarded and replaced. Hydrostatic testing should also be performed on the cylinders every 5 years to ensure safe operation. Page 55 © 2011 Fluke Calibration GFS2102™ OPERATION AND MAINTENANCE MANUAL 4.4 Considerations for Making Reliable Measurements 4.4.1 Cooling and Condensation at High Flow At flows above 2 slm, the fast discharge of gas pressure from the reference gas cylinder causes a fairly rapid drop in the temperature of the cylinder and regulator assembly. This cooling in itself does not create a large measurement problem for the GFS2102 system since the air temperature surrounding the cylinder is measured to account for changes in air buoyancy. This correction is a small contributor to uncertainty of GFS2102 flow measurements. Also the design of the balance and AMH platform and the granite tabletop keep the balance at a relatively constant temperature even under high flow conditions. But a very significant problem can result if the temperature of any surface of the reference gas cylinder assembly drops below the local dew point, causing water to condense on the assembly. The added mass of the condensation makes reliable mass measurements impossible. As a solution, an infrared (IR) probe T5 is positioned to read the surface temperature of the reference gas cylinder and used to predict when condensation is a risk (See Section 3.3.13, 5.1.5.5). When the IR probe is detecting a temperature within 3°C of the dew point, a “D” is displayed in the circular Ready/Not Ready indicator in the GFS Main Run Screen (See Table 16 in Section 5.1.5.2.1) and is also logged to the Status column in the data file. A secondary consideration occurs for gases that have a higher tendency to cool such as CO2 or N2O. For these gases the first stage of the dual regulators attached to the cylinder assembly will cool far faster than the cylinder itself. The surface area of this regulator is far less than that of the cylinder, but if the temperature drops below the local dew point condensation can occur at this localized point and it will make the mass measurements less reliable. Since the IR probe is adjusted for the infrared emissivity of the cylinder, it cannot be used to read the temperature of the first regulator. To assist the system in overcoming these issues while maintaining automation, a “Pause Flow” function is available in the options of a test setup. This function allows the test to complete an accumulation and then pause for a user set predetermined amount of time, usually 30 – 60 minutes, before proceeding with the next accumulation, thus allowing the cylinder and regulator to warm back up and lower the risk of condensation (See Section 5.5.2.8). 4.4.2 Stability of Ambient Conditions The automated nature of the GFS2102 system allows users to select the time to run test that is best suited to making the best measurements. Two common examples of changing conditions that can be avoided are a warm cylinder that has been recently filled and needs to cool, or a laboratory area which experiences significant changes in temperature and humidity throughout the day. Often when lab personnel leave the workplace, the laboratory experiences a reduction in both temperature and humidity over the course of a few hours. Outdoor conditions may also contribute to laboratory changes. Using a test start time delay feature in GFS Tools software, the user can program a test to begin at a time when environmental transients are minimized so that the GFS system, DUT and flow controller all have the best chance to perform at their highest level. The possibility of unattended operation and programmed start times allows a user to complete a test overnight using a cylinder freshly filled at the end of the workday, when the user would otherwise have to wait until the next day. (See Section 5.5.2.4) © 2011 Fluke Calibration Page 56 4. OPERATION 4.4.3 Comparing Reference and DUT Measurements Using Flow Vs. Mass Calculations The GFS2102 system makes a direct measurement of the mass that flows from the reference gas cylinder during operation. At the end of an accumulation, an accurate measure of the total accumulated mass, or the average mass flow over the total elapsed time, is available. GFS Tools software reads and records the flow output from the device under test during an accumulation and calculates both the average DUT flow and the total mass measured by the DUT by integrating all of the mass flow values from the DUT. Our assumption is that the output of the DUT is a mass flow measurement, not a totalized mass. So the user has an opportunity to compare the reference and DUT measurements in either total mass or mass flow terms. A pure view of the gravimetric nature of the GFS2102 system may lead one to suspect that using total mass eliminates some timerelated uncertainty from the GFS measurement and is a more correct choice. But when the logging of measurements from both the reference and DUT are considered, it is apparent that using the average mass flow is likely to produce the best result. Although every effort is made to integrate the DUT flow over a time period that matches the time used for the GFS measurement, the update rate of the readings from the DUT will force some interpolation between DUT values in order to match the DUT timing to that of the GFS. Also, any delay or error in timing the start and stop times of the GFS and DUT will result in some finite error that can be significant. The case is worst at higher flows. When the average DUT flow is used instead, a very good measure of the average DUT flow over a time period that is very close to that of the GFS measurement can be obtained. The time measurement-related errors that affect the GFS average flow measurement are handled within the GFS system to produce very good results when flow output is used for comparisons. 4.4.4 Leaks Leaks are of great concern when using the GFS2102. Any loss of gas mass between the Reference Gas Cylinder and the DUT(s) will impinge upon the accuracy of the measurements. It is recommended to test the flow path for leaks often, particularly with every hardware setup change, i.e. every time a different molbloc, MFC, molstic, Reference Gas Cylinder or catenary tube is used, or a heat exchanger is installed in the flow path. This section describes three methods to check for leaks: an automated leak check in a test definition; a semi-automated leak check of the flow path up to the isolation valve; and a semiautomated leak check to a external manual isolation valve placed in the flow path by the user. Regardless of the method used, the user must establish what the maximum “acceptable” leak rate can be for the gas and flow rate to be tested. When the uncertainty of the GFS accumulation is analyzed, if a leak was detected and could not be eliminated, the error contributed by the leak should be treated as an asymmetrical distribution because a leak would always be in one direction: gas can leak out of the system, but it cannot leak in. To establish the significance of a leak, or what amount of leak would be acceptable during a test, the user must consider the gas being tested, the minimum flow point of the gas during the test, the uncertainty target being sought, and the amount of time to get a valid leak test result. Using a 1E2L molbloc as an example being tested in Nitrogen, a typical minimum flow of 10% of full scale is 10 sccm (2.084E-1 mg/s), and if the user is seeking less than 0.02% effect from a potential leak then a leak rate under 0.002 sccm (4.168E-5 mg/s) would be acceptable. In order to ensure a valid leak test result, the leak test should run a minimum of 10% of the accumulation time of the lowest flow point: if the accumulation takes 26 hours the leak test should run for AT LEAST 2.6 hours, if the accumulation takes 10 hours the leak test should run for AT LEAST 1 hour. Page 57 © 2011 Fluke Calibration GFS2102™ OPERATION AND MAINTENANCE MANUAL 4.4.4.1 Leak Test Option in a Test Definition This leak test option checks for leaks in the Reference Gas Cylinder, though the catenary tube, and up to the isolation valve in the GFS enclosure sidewall column. Once an acceptable limit in flow has been established as described above with a minimum time for a valid result, these values can be entered on the Pre-Test tab of a Test Definition as detailed in Section 5.5.2.4. The leak test will occur based upon the options selected as defined in that section. The automated leak test sequence is as follows: • Set 0 flow • Wait for stability using settings on the Control tab of the test • Dwell using the dwell settings on the Control tab of the test • AutoZero GFS • Read and store starting fully corrected mass value • Start Leak test clock and dwell for the duration of the user entered Leak time of the test • Read ending fully corrected mass value • Calculate flow value using starting and ending fully corrected mass values over elapsed time and store in the data file. 4.4.4.2 Semi-Automated Leak Test This operation is similar to 4.4.4.1 in that it checks for leaks in the Reference Gas Cylinder, though the catenary tube, and up to the isolation valve in the GFS enclosure sidewall column, but it is run outside of a test definition in manual mode. The user must still establish an acceptable leak limit and minimum time, but these values could be determined at any time up to the point where the user is ready to end the test. The semi-automated leak test is performed as follows: A manual test is run as outlined in Section 5.6.2, steps 1 to 6. If the user wishes to record the leak test data then a data file is opened as in Section 5.6.2, step 7. In order to keep the isolation valve closed, a flow point should NOT be set as in Section 5.6.2, step 8. An accumulation is started per Section 5.6.2, step 9, but in the accumulation setup window a large starting tolerance (~5%) that results in a short starting time, a flow value, and a mass to deplete greater than 1 gram are all entered. The flow and mass values actually entered are irrelevant as the system will ideally be neither flowing nor depleting mass, but the setup will not continue with zero or null values. The “OK” button is selected to continue. The test is allowed to continue for the minimum time established to get an accurate result. If the data is being recorded to a data file, the “Take Point” options as in Section 5.6.2, Step 10 need to be defined. Once the minimum time has elapsed, the user must judge the significance of the “Depleted Mass/Time” calculated flow value reported in mg/s on the GFS Diagnostics run screen (see Section 5.1.5.3) against the minimum test flow in mg/s. The leak test can be aborted at any time by using the “Stop” icon. © 2011 Fluke Calibration Page 58 4. OPERATION 4.4.4.3 Semi-Automated Leak Test to Manual Isolation Point This leak test is nearly identical to Section 4.4.4.2 except a flow point will be requested, which will open the isolation valve and pressurize the flow path to the point where the user has chosen to install a manual isolation valve. Other than the regulators on the Reference Gas Cylinder, the flow path for the leak test should not include a regulator or the regulator needs to be bypassed as it has the potential to continue to bleed pressure through and cause a false leak indication. If an MFC is in the flow path included in the leak check then the user must ensure that the setpoint is high enough to fully open the MFC valve and allow the pressure to equalize across the MFC or a leak could be falsely indicated. An MFC should never be used as the isolation valve as MFC’s are not designed as shutoff devices. Since this type of leak test can result in the full output pressure of the Reference Gas Cylinder reaching the molbox(s), the molbox pressure tubes should be disconnected from the molbloc(s) in the flow path to prevent overpressure and damage to the molbox pressure transducers. The molboxes should be leak tested separately per the molbox1 Operation and Maintenance Manual. The semi-automated leak test is performed as follows: A manual isolation valve is installed in the flow path and is closed. A manual test is run as outlined in Section 5.6.2, steps 1 to 8. Step 7 can be bypassed if the user does not wish to record the leak test data to a data file. When setting a flow point as in Step 8, a value close to the maximum of the MFC should be chosen. An accumulation is started per Section 5.6.2, step 9, but in the accumulation setup window a large starting tolerance (~5%) that results in a short starting time and a mass to deplete greater than 1 gram are entered. The flow value will be automatically transferred from the set point, and the mass value actually entered is irrelevant as the system will ideally be neither flowing nor depleting mass, but the setup will not continue with zero or null values. The “OK” button is selected to continue. The test is allowed to continue for the minimum time established to get an accurate result. If the data is being recorded to a data file, the “Take Point” options as in Section 5.6.2, Step 10 need to be defined. Once the minimum time has elapsed, the user must judge the significance of the “Depleted Mass/Time” calculated flow value reported in mg/s on the GFS Diagnostics run screen (see Section 5.1.5.3) against the minimum test flow in mg/s. The leak test can be aborted at any time by using the “Stop” icon. Page 59 © 2011 Fluke Calibration GFS2102™ OPERATION AND MAINTENANCE MANUAL 4.4.5 Flow Control and Stability Poor flow control and flow stability can impact the integration of DUT mass, leading to inaccurate results. The GFS2102 is delivered with 4 mass flow controllers (MFC’s) calibrated for Nitrogen use. The MFC’s are typically designed to be able to work in the gas they are calibrated for down to 5% of full scale, but for the GFS2102 it is recommended to switch to a lower range MFC if operating below 10% of full scale for improved flow control and stability. The k-factor adjusted N2 range of the MFC should be kept in mind when using the GFS2102 with a gas other than N2. For example: an AERA MFC with a 10-100% flow range of 1001000 sccm when used with Sulfur Hexafluoride (SF6, k-factor of 0.263) would have a working equivalent flow range of 26.3-263 sccm. K-factors can be found and if necessary altered under [TOOLS][PROCESS GAS EDITOR] for the manufacturer of the MFC. © 2011 Fluke Calibration Page 60 5. GFS Tools Software 5.1 Main Display and Features 5.1.1 Overview The GFS Tools main screen contains the interface between the program setup and all of the data acquisition run screens. When the program is first started, the main screen displays without any child windows. Only after a menu option is selected does the screen update to display the corresponding window. The following features are available on the main screen: Main menu bar To access all GFS Tools menus and functions. Status bar At the bottom of the screen that contains information on the status of test execution. Run mode display To indicate the current GFS Tools run mode. Main toolbar Provides quick access to runtime program displays and functions. Several individual run screens Are available when running to provide real time data acquisition information. 5.1.2 Main Menu Bar The main menu bar is divided into six separate selections. Each menu item is summarized below and covered in detail in various sections of this manual. 5.1.2.1 [Run] [Run Test] Initialize and run a Test Definition. Test Definitions are pre-defined test scripts. See Section 5.6.1 for detailed information on using this mode. [Run Manual Test] Initialize and run a manual test. Manual tests provide monitoring and control features without a pre-defined test script. Manual tests also support data acquisition. See Section 5.6.2 for detailed information on using this mode. [Run Diagnostic Test] Display a real time output of the LCM sensor outputs and the balance. Options are provided to allow the user to change the state of the AMH. Diagnostic tests are provided to allow a test operator quickly monitor and manipulate the GFS system without a complete initialization. GFS flow data cannot be acquired in this mode of operation. See Section 5.6.3 for additional information on this mode. [Exit] Close GFS Tools. Page 61 © 2011 Fluke Calibration GFS2102™ OPERATION AND MAINTENANCE MANUAL 5.1.2.2 [Setup] All of the necessary program setup features are contained in this menu choice. The ability to create Test Definitions and DUT Definitions, and options to configure and change the calibration of the GFS are possible choices in the [Setup] menu. [Test] Create, edit, view and delete Test Definitions using the Test Editor. [DUT] Create, edit, view and delete DUT Definitions using the DUT Device Editor. [Support Device] Create, edit, view and delete non-DUT devices using the Support Device Editor. Typically flow controllers and instruments used define the controller setup point are defined by this option. [Reference Gas Cylinder] Create, edit, view and delete Reference Gas Cylinder Definitions using the Reference Gas Cylinder Editor. [Configuration] View and edit options effecting core GFS functionality. This includes communication, timing, sampling and tolerance criteria. [Calibration] View and edit the calibration of the LCM sensors, reference mass, balance and PC clock. 5.1.2.3 [Tools] [Options] Select options to customize GFS Tools behavior (see 5.2.2). [Unit of Measure Converter] Run the Unit of Measure Converter. This tool not only acts as a convenient unit converter, it also provides the ability to create custom flow units. On-line help is available in the Unit of Measure Converter by accessing the [Help] menu within the tool. (see 5.2.3). [Remote Communications] Send and receive remote commands manually using the Direct Remote Communication tool (see 5.2.4). [Process Gas Editor] Open the Process Gas Editor to define manufacturer specific gas relationship information. On-line help is available in the Process Gas Editor by accessing the [Help] menu within the tool (see 5.2.5). [Change GFS AMH State] Manipulate the GFS AMH or the isolation valve without running a test (see 5.2.6). [PC Time Calibration] Run an automatic comparison of the internal PC clock with the LCM clock (see 5.2.7). 5.1.2.4 [Data] [View Data File] View a GFS Tools Data File using the Data File Viewer (see 5.3.2). The ASCII text file and a data grid is used to display the information in the Data File. [Plot Data File] Plots information from GFS Tools Data Files using the Plot Tool. The Plot Tool provides features to create custom 2D and 3D plots (see 5.3.3). [Report Editor] Run the COMPASS Report Editor to generate a report from a Test Data File (see 5.3.4). © 2011 Fluke Calibration Page 62 5. GFS TOOLS SOFTWARE 5.1.2.5 [Window] Options to select, tile or cascade active GFS Tools run screens are provided by this menu choice, or an active window that is hidden can be brought to the front by selecting it from the list at the bottom. Use the Main Toolbar, display icons to display run screens that are not already active. 5.1.2.6 [Help] Access on-line help and the <About GFS Tools > dialog for version information. 5.1.3 Status Bar The Status Bar is located at the bottom of the main screen. In all run modes, GFS Tools flashes information related to the current status of test execution on this display. While running tests, two panels and a progress indicator also display with status information on the current test step and point. The red panel on the left displays the current major test step: setting target flow, AutoZero, etc. The blue panel indicates the minor test step: stability test, dwell, taking point, etc. Figure 31. <Status Bar> Clicking either of the inset panels of the status bar or using the [Back] or [Next] toolbar options displays the Test Status form. This form lists the current test status when running a Test Definition, including the current point in a test relative to the maximum number of points as well as the status of the leak test if included in the test. Figure 32. Test Status The progress indicator is a visual indication of the relationship between the current test point and the number of points in a test. The indicator is a progress bar located across the bottom of the run screen just above the status bar. The left side of the progress bar represents 0 progress and the right side represents 100 %. Each test point increments the progress indicator. When [Skip Back] and [Skip Forward] buttons are used, the progress indicator also reflects the current position. Figure 33. Progress Indicator Page 63 © 2011 Fluke Calibration GFS2102™ OPERATION AND MAINTENANCE MANUAL 5.1.4 Main Toolbar The Main Toolbar in GFS Tools is used as a shortcut to many menu options and is used to control test execution. The options that are visible and enabled on the toolbar vary with the active run mode. There are four distinct sections of the toolbar. Each of these sections is described in the following tables. Figure 34. Main Toolbar - Display while idle 5.1.4.1 Run Test Tools The Run Test Tools section of the Main Toolbar, controls test execution. The icon selections allow tests to begin, end, pause and rapidly move through test steps. Table 13 lists the run tool icons. Table 13. Main Toolbar, Run Test Tools ICON DESCRIPTION Run Test This feature is a shortcut to the Main Toolbar [Run] menu choice. When selected for the first time it will initiate the [Run Test] mode. If selected after another type of test has been run it will run that same test again. When GFS Tools is running a test, this option is disabled. Step Back Causes the current test point to be interrupted and the test point sequence to step back to the most recent target output step. Subsequent clicks cause the test to step back one point for each click. This feature is used to repeat points when needed in [Run Test] mode. Not functional with Manual tests as they do not have a defined point sequence to skip through. Step Back does not step back through pre-test operations such as the leak test or pre test delay. Step Forward Causes the current test point to be interrupted and the test point sequence to step forward to the next step in a point sequence. This feature only moves forward up to the take data step of the highest point executed. The limitation is to ensure that data is logged at each point and points are not skipped entirely. Most often this feature is used to skip through the test dwell step or to move on to the next accumulation or flow point before the active accumulation is complete. Pause Suspends test execution and remote communications with all devices being used by GFS Tools. Use this feature to allow front panel access to a device while running a test. Click [Pause] again to resume operation. Abort Causes the <Abort Test> confirmation pop-up to appear to abort the test that is running. 5.1.4.2 Run Display Tools Run Display Tools provide toolbar features that relate to GFS Tools run screens. Each of the toolbar icons forces the corresponding run screen to the top of the display. Run display tools are available based on the current run mode and the data acquisition state of an active test. © 2011 Fluke Calibration Page 64 5. GFS TOOLS SOFTWARE Table 14. Main Toolbar, Run Display Tools ICON View Test DESCRIPTION Causes the Test Definition Editor to display in the main screen with the information corresponding to the active Test Definition (see 5.5.2). This allows complete information on the current test procedure to be reviewed without interrupting the test. This feature is available only in [Run Test] mode. Note Do not confuse this option with the [Open Test Editor] toolbar shortcut. It is not possible to edit a Test Definition while a test is running. GFS Run Screen Device Run Screen Display Press the button to display the GFS Run Screen. Use the drop down arrow menu choice next to the button to display the GFS Diagnostics, Ambient Conditions or the Balance Interface run screens. Generates a popup menu to allow the selection of the desired Device Run Screen to display (see 5.1.5.7). The selected Device Run Screen automatically displays in the main window. Depending on the selections of the [Tools], [Options], [Run Test] tab, the displayed Run Screen may or may not allow direct control of the device (see 5.2.2.1). There are several different run screens. Each Fluke Calibration product has it’s own run screen to support it’s unique features. All other non- Fluke Calibration devices use a common run screen that lists the device’s raw output and corresponding final output. Note Click outputs on the various run screens to get a list of options that apply to the output. Display unit of measure and resolution can be changed for most outputs. DUT/Reference Comparison Display the DUT/Reference Comparison Run Screen. This display provides convenient, real time, error information calculated for each DUT compared to the active reference (see 5.1.5.2). Data Grid Display the Data Grid with the data logged for the current test. The drop down arrow next to the image allows the selection of data from other DUTs to display when a test is executed with more than one DUT. Note The information displayed in the grid can be modified by using [Tools], [Options], [Data Grid] (see 5.2.2.5). Changes made during a test will not reflect in the current test. Data Plot Display the Plot Tool loaded with data from the current test. No new Data Files can be loaded in the Plot Tool while a test is running. Data from all active Data Files or any one Data File is plotable while running a test. Use the toolbar on the Plot Tool to generate the desired plot (see 5.3.3). Page 65 © 2011 Fluke Calibration GFS2102™ OPERATION AND MAINTENANCE MANUAL 5.1.4.3 Data Acquisition Tools In [Run Manual Test] run mode, data can be acquired based on the selection of data acquisition tools that will appear on the Main Toolbar in this mode. The first requirement is to open a Data File by using the [Create Data File] function. After the file is selected, the remainder of the data acquisition options are enabled. To log a data point, simply choose the appropriate toolbar button. Points can be taken individually, averaged individually and averaged automatically. When the run mode is ended or a new Data File is created, the [Options], [End Test] and [Options], [Data File] selections are activated (see 5.2.2.3 and 5.2.2.4). This allows test notes to be entered and empty test files to be deleted. Note When a Data File is created in [Run Manual Test] mode, data points can be taken without the constraints of a specific test sequence, however, the resulting Data File is identical to files generated with the [Run Test] option. Therefore, reports and plots can be created from the Data File. Caution Using any of the automatic data logging options can result in very large Data Files. These are files with significantly greater than 1000 data points per flow accumulation. GFS Tools was not intended to manipulate such files. Lower performance PC’s will experience significant delays in generating reports and plots of large Data Files. Therefore, use of the plotting and reporting functions with very large Data Files is not recommended. Instead, export the Data File to a spreadsheet application for further analysis. The table below describes each of the data acquisition toolbar options in detail. Table 15. <Control> Toolbar, Data Acquisition Options ICON Create Data File DESCRIPTION Press this button to create a new Data File. A standard windows filebox allows the selection of the Data File name and location. The choices in [Options], [Data File] determine the default file naming convention and file location. It also specifies whether or not to automatically name the file and avoid the filebox prompt. A separate Data File is created for every active DUT. If there are no DUTs, only one Data File is created and no DUT information is logged. Log a single data point © 2011 Fluke Calibration Logs the instantaneous output of all devices to the Data File. This is identical in function to using a 0 averaging time in a test. All non-automated devices must have their outputs entered in the <Manual Data Entry > window. Page 66 5. GFS TOOLS SOFTWARE ICON DESCRIPTION Average and take 1 point Average all devices according to the active averaging method. This is identical to averaging data during a test. Both automatic and manual averages can be used to average the data. The drop down arrow displays a menu that lists the automatic and manual averaging options. The option with an “*” preceding it is the active averaging mode. To change the automatic averaging time select it in the menu and enter the desired averaging time in the input box that follows. Data can be automatically averaged from 1 to 9999s. Figure 35. Manual Averaging Options Log 1 point at fixed intervals Logs an instantaneous data point at fixed time intervals. When the icon is pressed, an input box displays to allow entry of the time interval. GFS Tools automatically logs a data point when the option is pressed and repeatedly logs data points at the specified time interval until the [Abort Data Acquisition] button is pressed or the test is aborted. Taking data in this manner is the best way to monitor the evolution of error over a flow accumulation. Caution Taking data at short time intervals can quickly result in a very large Data File. Average and log points at fixed intervals Averages all device outputs and logs the results at fixed time intervals. When the icon is pressed the <Average Setup> window displays to allow entry of the averaging time and the interval between averages. After the entry, GFS Tools automatically begins averaging data. When the average is complete, the results are logged and the countdown to the next average begins. When the time specified as the <Timed Point Interval(s)> has been reached, another averaging cycle begins. This process is repeated until the [Abort Data Acquisition] button is pressed or the run mode is closed. Taking data in this way can be convenient when trying to mimic a test that includes multiple readings per point. Caution Taking data at short time intervals can quickly result in a very large Data File. Note Press the [Abort Data Acquisition] option to abort fixed interval data acquisition. Figure 36. <Average Setup> Page 67 © 2011 Fluke Calibration GFS2102™ OPERATION AND MAINTENANCE MANUAL ICON DESCRIPTION Abort data acquisition Press this icon to abort data acquisition at fixed intervals or a point currently being averaged. Caution Never use other Toolbar features when this icon is enabled. Changing the state of the system while a point is in progress may lead to faulty data logged in the Data File. 5.1.5 Run Screens 5.1.5.1 Overview GFS Tools uses several different run screen types to display output information while in a run mode. Use the Run Display choices on the Main Toolbar to display a specific run screen. Click and drag the border of a run screen to adjust its size. Closing, minimizing or maximizing any of the run screens has no affect on the run mode. A test continues to run even if all run screens are closed. The [Window] menu includes cascade and tile options for common default displays. The combination of these features makes the user interface totally customizable. Note By default, each run window is displayed in the last used size and position. To preserve the display or run screens, simply end a test by pressing [Abort]. Do not close run screens before ending a test. Note Change the unit of measure, display resolution or view a strip chart by right-clicking any displayed output and selecting the desired function. Right-click any output and select the [Strip Chart] option to create a strip chart using the selected output. Some run screens have toolbars and allow manual input of output information. Others are simple displays of device raw and final outputs. Most numeric outputs support unit and resolution changing as well as strip charting. Access these features by clicking any of the numeric displays. 5.1.5.2 GFS Run Screen The GFS Tools GFS Run Screen is the equivalent of an instrument front panel. The GFS Run Screen is the main interface and front panel of the GFS system. Through this interface system functions are controlled and readings are observed. The display and toolbar contain all functions necessary to determine the state of the GFS and change the flow or AMH state. The GFS Run Screen is opened by pressing the [GFS] button on the GFS Tools Main Toolbar. The screen can be resized and repositioned as desired. The run screen has three main sections: 1. Control Panel: The Control Panel is for reading and controlling the GFS system. 2. System Display: The System Display is an animated operational schematic of the GFS system to provide real time information on system status. © 2011 Fluke Calibration Page 68 5. GFS TOOLS SOFTWARE 3. GFS Control Toolbar: The GFS Control Toolbar buttons are for controlling GFS specific functions. Figure 37. GFS Run Screen The features on the GFS Run Screen are summarized in the tables below. 5.1.5.2.1 GFS Control Panel The GFS Control Panel is the main information interface to the GFS system. The display contains all the most basic information to determine the state of the GFS and change the flow. Included are specific instrument outputs, flows, time, and accumulated mass. The information and fields are summarized in the table below. Figure 38. GFS Control Panel section of GFS Run Screen Page 69 © 2011 Fluke Calibration GFS2102™ OPERATION AND MAINTENANCE MANUAL Table 16. GFS Control Panel Fields FEATURE Circular Ready/Not Ready Indicator DESCRIPTION Use this indicator as a quick reference to determine the uncertainty on the GFS flow. The indicator will be one of 3 colors and may include text in the display . The color codes are listed below. Green – The GFS accumulated the final tolerance mass defined by the sample criteria. Blue - The GFS accumulated the starting sample tolerance mass defined by the sample criteria. Red – The GFS is either Idle, has an error or has not accumulated enough mass to reach the starting sample tolerance. Text that displays within the indicator are used to describe system errors or warning condition. Use [Setup][Configuration][Limits] to modify the limits used to generate the warnings. Z – The balance PRT has changed temperature more than the configured limit. An AutoZero operation or a Balance Zero operation should be performed to correct for any drift in the balance. C - The cylinder temperature probe (TH Probe #3) has a rate of change of temperature that exceeds the configured limit. This can happen under high flow conditions. Abort flow control and allow the cylinder to reach equilibrium before continuing. D – The infrared temperature (T5) from the surface of the cylinder has dropped to within 3°C of the dew point. Water vapor buildup on the reference gas cylinder ultimately results in a lower mass flow rate from the GFS. The extra mass of water reduces the net mass loss of the cylinder for a given period of time. This condition will occur under sustained high flow conditions. When this limit displays, abort flow control and wait for the cylinder to reach equilibrium. E – One or more of the ambient sensor probes on the LCM is not responding properly. Make sure that all probes on the LCM are properly connected. The error may also be the result of faulty calibration data. P – The calculated reference gas cylinder pressure is below 1.4 MPa (200 psi). Below this value pressure regulation in the cylinder loop is no longer consistent and can lead to faulty flow data. Re-fill the cylinder to remedy the situation. T – The temperature difference between the two TH probes exceeds the limit defined by [Setup][Configuration][Limits]. Verify that the probe calibration data is valid. Both probes must be securely connected to the LCM and positioned next to the GFS. (see section 3.3.13, Setup Probe Locations) Calibration Gas Flow The rolling average flow of the GFS. The value displayed in this field is identical to the value displayed on the GFS Diagnostics Display <Roll Avg Flow> field. Accumulated Mass The mass accumulated by the GFS for the active accumulation. When an accumulation is complete the last value remains on the display but does not change. Target Flow The current GFS target flow. When running a manual test enter a flow value in this field and press [Enter] to change the target flow. Regulate Flow (Optional Check Box with Numeric Entry Field) Enclosure Pressure © 2011 Fluke Calibration The current calibration gas selected at the start of a manual test or defined in a Test Definition. The regulate flow option is present to allow GFS Tools to dynamically adjust the set point of a flow controller to achieve a nominal flow rate in either the first or second DUT. If running a manual test, when the option is checked a pop-up window displays allowing flow regulation to DUT1 or DUT2. The entry field next to the check box is used to specify the regulation adjustment interval. This is the time in seconds between set point adjustments. A value greater than 2s is recommended as that is the time required for a molbox1 flow update. The pressure as output by the LCM ambient pressure sensor. Page 70 5. GFS TOOLS SOFTWARE FEATURE DESCRIPTION The temperature as indicated by the LCM TH Probe #3 temperature sensor. This probe should be placed in close proximity to the reference gas cylinder. The enclosure temperature is used for the air buoyancy correction on the reference gas cylinder. Enclosure Temperature The humidity as indicated by the LCM TH Probe #3 humidity sensor. The enclosure humidity value is used to determine the dew point temperature. Enclosure Humidity The elapsed time since the current accumulation officially started. This time does not include times associated with pre accumulation options such as Time Delay, AutoZero and Balance Zero operations. Those functions occur before the accumulation actually begins. Elapsed Time The predicted time remaining to complete the active accumulation. The value is calculated based on the current GFS flow rate, mass used and the required accumulation mass. At lower flow rates this indication may change dramatically until enough mass is accumulated to stabilize the prediction. Time Remaining The approximate GFS Flow tolerance. The value is composed of the mass and time components of the GFS uncertainty as defined in [Setup][Configuration][LCM] and [Balance]. Flow Tolerance 5.1.5.2.2 GFS System Display The GFS System Display is an animated operational schematic of the GFS system including what object is currently on the balance, specific information on the DUT(s), and the Target Mass to be accumulated. The information and fields are summarized in the table below. Three black lines graphically represent the flow of the gas from the Reference Gas Cylinder through the flow path “tube” and past the DUT(s) before resetting back to the cylinder. The lines move slowly at low flows and progressively faster at higher flows. This is a animated representation only and is not based on the actual flow of gas. Figure 39. GFS System Display section of GFS Run Screen Table 17. GFS System Display Fields FIELD Mass of Gas (far left center) Balance Output Display DESCRIPTION The calculated mass of gas in the GFS Reference Gas Cylinder available for use, in grams. This value is calculated from the Instantaneous Mass minus the “Mass of evacuated cylinder assembly” value of the currently selected Reference Gas Cylinder. The instantaneous uncorrected output of the balance in grams. (far lower left) Cylinder Icon When shown indicates that in the current AMH state the Balance Output Display is indicating the mass of the Reference Gas Cylinder. When no icon is present above the Balance Output Display, the AMH is in the zero/unloaded position where nothing is on the balance and the Balance Output indication should be close to zero. When a long rectangular icon is present above the Balance Output Display, the AMH is in the Reference Mass position and the Balance Output indication should be close to the mass value of the Reference Mass. Page 71 © 2011 Fluke Calibration GFS2102™ OPERATION AND MAINTENANCE MANUAL FIELD DESCRIPTION molbox1 / BSN: The molBloc Serial Number of the DUT molbloc attached to the molbox1. Mass Error: The % reading error between the accumulated masses of the GFS and the DUT(s). Flow Error: The % reading error between the averaged flows of the GFS and the DUT(s). Target Mass: 5.1.5.2.3 The total mass to be accumulated by the GFS for the active accumulation before the test will end or the next accumulation will initialize. GFS Control Toolbar The Control Toolbar is used for GFS specific operation. The toolbar is the main source of system control for Manual Test operation. Use of the toolbar during test definitions is not required or desirable in most situations. Figure 40. GFS Control Toolbar section of GFS Run Screen Table 18. GFS Control Toolbar icons FEATURE DESCRIPTION Start a flow accumulation. When an accumulation is started, the accumulation sample setup dialog displays allowing the operator to specify the starting and ending sample tolerance values and the flow rate. The information entered determines the total mass to deplete and the test time. Abort the active flow accumulation. When abort accumulation is pressed, no final accumulation operations are taken. AutoZero the GFS. The GFS AMH lowers the reference mass onto the balance and determines a correction for any drift in the balance since the last Balance Zero or AutoZero. Zero the balance by removing all mass from the balance and setting the stable residual mass to 0. A balance zero runs automatically before all tests begin. Use the drop down menu choice next to the button to display the GFS Zero and Span Balance option to zero the balance as described above, then lower the Reference Mass to check or adjust the Mass Span Multiplier (see Section 5.5.7.1). Set the GFS AMH state to load the reference gas cylinder onto the balance. Set the GFS AMH state to load the reference mass onto the balance. The mass indicated on the balance display represented the reference mass. Set the GFS AMH state to remove all mass from the balance. This is the zero condition. © 2011 Fluke Calibration Page 72 5. GFS TOOLS SOFTWARE FEATURE DESCRIPTION Cycle the GFS AMH. It is important to cycle the AMH after system setup or when the reference gas cylinder is changed. The cycle operation helps to realign miss aligned mechanical components. Abort the active GFS AMH cycle. This button is available only when a cycle is active. The red icon indicates the isolation valve is closed, clicking on this will switch to the black icon and Activate (open) the isolation valve in the flow path. The black icon indicates the valve is open and will Deactivate (close) the isolation valve and switch to the red icon. This button is available only when a cycle is active. 5.1.5.3 GFS Diagnostics Run Screen The GFS Diagnostics run screen is used to view incremental flow calculation values used by the GFS. Access this display by selecting the drop down menu option next to the [GFS] display toolbar button. All data relevant to the gravimetric flow is available on the display. This feature is provided for trouble shooting purposes only. The information displayed is logged in an SDF file when the option is enabled. Figure 41. GFS Diagnostics Run Screen Table 19. GFS Diagnostics Fields FEATURE Instantaneous Mass Corrected Mass Starting Corrected Mass DEFINITION Mass as directly output by the balance with the format specified in the balance setup. The AutoZero and buoyancy corrected instantaneous mass. The corrected mass value when the accumulation was started. AutoZero Correction The AutoZero correction that represents the drift of the balance. A count down to the left of this field displays the time to the next AutoZero when timed AutoZero operations are active. Mass Span Correction The mass span multiplier. In addition to the buoyancy correction, mass span multiplier is applied to the Instantaneous Mass to get the Corrected Mass. The value remains a constant throughout a test unless the <Zero and Span balance> option is selected from the Control Toolbar on the GFS Run Screen. Page 73 © 2011 Fluke Calibration GFS2102™ OPERATION AND MAINTENANCE MANUAL FEATURE DEFINITION The calculated gas pressure in the reference gas cylinder. The pressure is based on the cylinder properties specified in the Reference Cylinder Editor, the current total mass of the cylinder, and the current Calibration Gas. Cylinder Pressure The difference between the corrected mass (g) and starting corrected mass over the elapsed time (s). Dividing these two numbers results in the current mass flow in mg/s. Depleted Mass/Time Flow determined by the depleted mass divided by the elapsed time in the current flow unit of measure. Flow The running Best Fit flow of the balance. The value is Not the <Average Flow> flow and will only compare to the average flow when the flow is very stable. The values are calculated as though the “Y” axis were depleted mass and the “X” axis were corresponding elapsed time. Each new balance output generates a new point on the plot, new depleted mass and corresponding elapsed time. The best fit of all data on the plot forced through zero yields a slope that is the mass flow. Best Fit Flow Note This field should be ignored when an AutoZero takes place during an accumulation. The AutoZero correction typically results in a mass change in a short amount of time. This value unfairly biases the running best fit. Rolling Avg Flow The flow determined by the rolling average of the <Flow> value. This value is logged in the data file as the Reference Flow and displays as the <GFS Flow> on the GFS run screen. The duration of the rolling average is controlled by the GFS Tools configuration. Accumulated Mass The accumulated mass of the balance. The value here is identical to the mass value in the <Depleted Mass/Time> field. The information is repeated here for convenience. The current dew point temperature calculated from the Enclosure Temperature, Enclosure Pressure, and Relative Humidity. Dew Point Temperature Higher flows decrease the temperature of the reference gas cylinder. As the temperature approaches the dew point, moisture will build up on the reference gas cylinder. The moisture increases the mass of the balance therefore decreasing the calculated flow. Use [Setup][Configuration][limits] to define a dew point approach limit to avoid taking data when moisture is on the reference gas cylinder. Status information specific to GFS operation displays in this field. This information is not always the same as the information displayed on the status bar. Status 5.1.5.4 Balance Output Run Screen The Balance Output run screen is a display specific to balance related information. Access this display by selecting the drop down menu option next to the [GFS] display toolbar button. Use this display to troubleshoot the balance or to perform maintenance operations. Use the tools on this display when running Manual or Diagnostic Tests only. Use the GFS AMH manipulation options on the GFS run screen to ensure that the AMH is in a state such that the balance operation is valid. Caution © 2011 Fluke Calibration • It is the users’ responsibility to set the proper GFS AMH state prior to using the manual balance options. Leaving the AMH in the wrong state can over-range the balance or yield an erroneous calibration. • When the [Balance Calibration] option is used, the [Setup][Configuration][Time/Mass]<Mass Span Multiplier> must be set back to 1. Failure to reset this correction back to one will yield erroneous results. Page 74 5. GFS TOOLS SOFTWARE Figure 42. Balance Output Run Screen Table 20. Balance Output Run Screen Fields LABEL DESCRIPTION Tare the balance. This option is equivalent to pressing the tare button on a balance terminal (not provided). No AMH state manipulation operations are imposed before taring. This feature is provided for balance specific operation only. Balance Tare For normal system operation use the [AutoZero] button on the GFS run screen. Zero the balance. This option is equivalent to pressing the zero button on a balance terminal (not provided). No AMH state manipulation operations are imposed before taring. This feature is provided for balance specific operation only. Balance Zero Balance Calibration For normal system operation use the [Balance Zero] button on the GFS run screen. Run the internal calibration on the balance. During this process the balance lowers an internal calibration mass and makes a span correction. Do not confuse this correction with the span correction performed by GFS Tools. The Balance Calibration correction adjusts coefficients internal to the balance affecting the instantaneous mass output by the balance. The GFS Tools span correction is applied to the instantaneous balance output. After using this option, the user must re-set the [Setup][Calibration][Mass/Time]<Mass Span Multiplier> back to 1 or rerun the GFS Tools Zero and Span function. Failure to do so will result in an erroneous correction being applied to the balance output leading to erroneous data. 5.1.5.5 Ambient Conditions Run Screen All sensory information obtained by the LCM is displayed on the Ambient Conditions run screen. Access this display by selecting the drop down menu option next to the [GFS] display toolbar button. The ambient conditions information is grouped by sensor and function on the display. Use this feature to verify and to compare LCM sensory output information. Not all values displayed are directly used by GFS Tools to determine GFS flow. The information is provided to simplify the calibration processes. Note Change the unit of measure and resolution of all ambient output values by clicking the displayed output value. One unit and resolution setting is imposed on all similar ambient output values. For example all temperature measurements will display in the same unit of measure with the same format. Page 75 © 2011 Fluke Calibration GFS2102™ OPERATION AND MAINTENANCE MANUAL Figure 43. GFS Ambient Conditions Run Screen Table 21. GFS Ambient Conditions Run Screen Fields LABEL DESCRIPTION Ambient Pressure Ambient pressure as measured by the LCM internal ambient pressure sensor. The sensor is pneumatically connected to the enclosure interior. Ambient Humidity Not available on all LCM versions, not shown on this run screen if not available. Ambient humidity as indicated by the LCM internal humidity probe. This output indicates the ambient humidity surrounding the LCM. This output is not used by GFS Tools. Ambient Temperature Not available on all LCM versions, not shown on this run screen if not available. Ambient temperature as indicated by the LCM internal temperature probe. This output indicates the ambient temperature surrounding the LCM. This output is not used by GFS Tools. Regulator Probe (TH2) The temperature and humidity of the LCM external TH Probe #2. The value should indicate the temperature and humidity surrounding the regulator assembly at the top of the reference gas cylinder. The temperature value is used for the air buoyancy correction of the regulator assembly connected to the top of the reference gas cylinder. Cylinder Probe (TH3) The temperature and humidity of the LCM external TH Probe #3. The value should indicate the temperature and humidity surrounding the reference gas cylinder. The temperature output is used to perform an air buoyancy correction on the reference gas cylinder. Cylinder Surface Probe (T5) (Infrared) The temperature output of the LCM infrared temperature probe T5. The temperature output is used for the thermal expansion correction of the reference gas cylinder. The temperature output also generates a warning in the GFS status indicator when the temperature output approaches the current dew point temperature. External PRT (T4) 5.1.5.6 The temperature output of the external LCM PRT. This PRT is used to measure the temperature of the air surrounding the Reference Mass. The output of this probe is used to perform the air buoyancy correction of the Reference Mass required for AutoZero. DUT/Reference Comparison Run screen This run screen contains a simple display of errors of all DUTs compared to the GFS. The most common error output information is available on this display. The information on the display is organized into rows and columns. The columns separate different pieces of information. With the exception of the <%Rdg Error> row, the rows separate the different devices. The first row is always the GFS, the remaining rows alternate between DUT and %Rdg Error for the different DUT comparisons to the GFS. Up to 2 simultaneous DUTs are supported by GFS Tools. © 2011 Fluke Calibration Page 76 5. GFS TOOLS SOFTWARE Note Change the unit of measure and resolution of reference and DUT outputs by right-clicking the output and selecting the desired function. Right-click any output and select the [Strip Chart] option to create a strip chart using the selected output. Figure 44. DUT/Reference Comparison Run Screen The display features of the DUT/Reference Comparison Run Screen are listed in the table below. Table 22. DUT/Reference Comparison Run Screen Fields LABEL Red, Blue, or Green Circular Indicator Inst. Mass/ Mass DESCRIPTION Displays to indicate the current GFS tolerance state. The indicator is always red when an accumulation is not active. When an accumulation is active, the indicator is one of 3 colors. Each color represents a specific tolerance state for the active accumulation. • Red – Not enough time and or mass has been used to reach the starting sample tolerance. • Blue – Enough mass and time have been used to start sampling. • Green – The ending sample tolerance was reached. All GFS flows are in the final averages and the accumulation will end soon. When not accumulating, the instantaneous uncorrected balance mass displays for the GFS and no mass information displays for any other field. When an accumulation is active, the column name changes to <Mass Used>. The column indicates the depleted mass according to the GFS and DUTs. The <%Rdg Error> row indicates the error as determined by comparing the integrated DUT mass used to the GFS mass used. Inst. Flow / Average Flow When not accumulating, the GFS has no instantaneous flow. The instantaneous value measured by the DUTs is listed in this column. There is no error information when an accumulation is not active. When an accumulation is active, the column name changes to <Average Flow>. The GFS rolling average flow displays along with the average flow of each DUT. The <%Rdg Error> row indicates the error as determined by comparing the DUT Average flow to the GFS flow. Best Fit Flow When not accumulating, this column does not display information. There is no error or best fit flow when an accumulation is not active. When an accumulation is active, the GFS best fit flow displays along with the average flow of each DUT. The <%Rdg Error> row indicates the error as determined by comparing the DUT Average flow to the GFS best fit flow. This error comparison is valid when the GFS is running at higher flows or in any situation in which AutoZero was not activated during the test. Page 77 © 2011 Fluke Calibration GFS2102™ OPERATION AND MAINTENANCE MANUAL 5.1.5.7 Device Output Run Screen A Device Output Run Screen is created for each non-Fluke Calibration device. All outputs of a device that are in use have a final output display on one row and all corresponding raw outputs on the next row. The label next to each output is the specified <Final Output Label> and the raw output type defined in the output specific setup of the device. Controllers display <Final Set> fields with white backgrounds. Right-Click these fields to enter a new target output value. Entering output information into these fields automatically updates the target (setpoint) of the controller. Any associated remote commands are automatically issued by GFS Tools to set the entered target. It is assumed any output entered is in the current display unit of measure. Outputs that require manual entry have a white background for the <Raw Output> field. Entering a value in these fields automatically updates the <Final Output>. It is assumed any output entered is in the current display unit of measure. Devices that have a remote interface also support the use of Spy Windows (see 5.1.5.8). These display output specific commands and responses used by GFS Tools to communicate with a device. Each output has it’s own Spy Window. This makes it easy to view the commands used to generate a specific output or response in GFS Tools. To view a Spy Window, click the <Final Output> of any output and select [Spy Window] from the popup menu. Note • Change the unit of measure and resolution of the final output by clicking the output and selecting the desired function. Click any output and select [Strip Chart] to create a strip chart using the selected output. • GFS Tools converts the specified final output of a device to the specified display unit of measure. By default, the display unit is the test specified unit or the unit defined in the device setup. It depends on the type of output and the active run mode. For this reason, the output displayed in GFS Tools will not necessarily match the output displayed on the device. Figure 45. Device Output Run Screen 5.1.5.8 Spy Windows A Spy Window exists for each device output that requires remote commands. Spy Windows are accessed by right clicking a Final Output on a Device Output Run Screen and selecting the [Spy Window] menu choice. This feature is provided to troubleshoot or analyze remote communications. The caption of the Spy © 2011 Fluke Calibration Page 78 5. GFS TOOLS SOFTWARE Window contains the device name and interface being spied on. Use the information in the <Command>, <Raw Response>, and <Manipulated Response> fields to determine if GFS Tools is properly configured for the remote device. The command/response information is updated real time as long as the interface is active and GFS Tools is not paused. Figure 46. Spy Window Screen Note Pay close attention to the device interface in the spy window caption. If the interface displayed does not correspond to the actual device interface, there is a configuration problem in GFS Tools or the wrong Spy Window is being viewed. The actual device interface used can be modified during Test Initialization. Table 23. Spy Window Information FRAME LABEL Command Raw Response Manipulated Response 5.1.5.9 DESCRIPTION The exact command sent by GFS Tools over the device interface. The command terminator is the only portion of the command that is typically not visible. For set commands, make sure the command and set value are properly formatted. The unmanipulated response to the <Command> value issued. This field should always be blank if the command does not have a response. The <Manipulate Response> option setup in the Remote Command Editor is used to format the <Raw Response> (see 5.5.3.4.4). The numeric result is displayed in this field and logged as data. Responses not specifically used by GFS Tools do not have a value in this field. When troubleshooting, make sure the value displayed includes the correct device output information. molbox Output Run Screen If a molbox1 or molbox RFM is used as a DUT or as a support device to DUT or controller, the molbox Output run screen is an available run screen choice. The run screen displays a real time update of molbox output information. The <molbox Output> run screen can be very useful for troubleshooting. Table 24 provides information on each field of the molbox Output run screen. Note • Always use the molbox Output run screen instead of the molbox front panel to view real time molbox output information. The units of measure on the display may not always correspond to the units of measure indicated on the display of the molbox. • When a molbloc-S does not have a valid back pressure ratio (BPR), the displayed flow is N/A. Page 79 © 2011 Fluke Calibration GFS2102™ OPERATION AND MAINTENANCE MANUAL Figure 47. <molbox Output> Run Screen Table 24. <molbox Output> Run Screen Fields LABEL DESCRIPTION Red/Green Circle molbox flow Ready/Not Ready indicator (see the molbox Operation and Maintenance Manual, Ready/Not Ready Section). The circle is green when molbox flow is ready and red when not ready. Rate Instantaneous molbox flow rate of change in unit of flow per second. Flow molbloc flow in the current test unit of measure. Reynolds Number Upstream Pressure Downstream Pressure Differential Pressure Reynolds number of the flow through the molbloc as calculated by the molbox. Pressure read by the molbox upstream pressure transducer. Pressure read by the downstream molbox pressure transducer. The pressure drop across the molbloc that is currently being used by the molbox to calculate flow. The differential pressure is the difference between the molbox upstream and downstream RPTs (in molbox RFM, it may be the measurement made by the microrange RPT). The molbox determines the differential pressure and outputs it to GFS Tools.. © 2011 Fluke Calibration BPR BPR is the back pressure ratio, downstream pressure/upstream pressure. This field is present only when the DUT is a molbloc-S. The value displayed is either the measured ratio or N/A when the value is not measured. The molbox front panel BPR setting determines whether or not BPR is measured or if the 2 molbox RPTs are averaged. Refer to the molbox operation and maintenance manual for more information. Temperature The molbloc temperature as calculated by the molbox from the average of the molbloc upstream and downstream PRT’s. Set Active molbox flow set point. This value is used only when the molbox is equipped with the MFC control option and is used as the analog supply to a flow controller. For manual tests change target flow set point by using the GFS Run Screen. For trouble shooting purposes, change the set point by entering a new set point value and pressing [Enter]. Output Active molbox analog output. As with the <Set>, this value is used only when the molbox is equipped and used in to support an analog flow controller or DUT. Switchbox molbox MFC switchbox control and measurement channels. The format is <Set Channel . Measurement Channel>. This field has no value if the molbox does not have the MFC control option and an MFC switch box is not in use. Page 80 5. GFS TOOLS SOFTWARE K Factor Active DUT gas conversion value in use by the molbox. The value is specified during Test Initialization. Change the value in Manual Test operation by entering a new K Factor and pressing [Enter]. See the molbox Operation and Maintenance Manual, K Factor Section, for details on the use of K factors. LABEL DESCRIPTION Gas Active molbox calibration gas. When running a Manual Test, this value can be changed using the toolbar at the bottom of the display. In all other run modes, the test gas is selected during test initialization. Stability Setting Active Ready/Not Ready stability criterion in the molbox. This value is fixed by the Test Definition in use when in Run Test mode. In all other run modes, the stability setting can be changed by entering a new stability setting and pressing [Enter]. See the molbox Operation and Maintenance Manual, Ready/Not Ready Section, for additional information. molbloc The serial number and molbox channel of the active molbloc. The molbloc channel displays only when a two channel molbox is the active reference. Tare the molbox. Use this option when running a Manual Test to tare the RPTs of a molbox1 or molbox RFM (see 5.1.5.10). This feature does not apply to molbloc-S type flow elements Change the active molbloc channel by using the drop down arrow next to the button. When the button is pressed, the active molbloc channel is simply re-loaded. Change the active molbox calibration gas. Changing this gas does not affect the GFS test gas. This option is intended to help troubleshoot problems and assist in the calibration of blended gases. 5.1.5.10 Tare molbox The tare molbox feature is represented by the toolbar icon: See the molbox Operation and Maintenance Manual, Tare Section, for complete information and recommendations on molbox pressure transducer taring. This function executes the molbox tare function. When pressed, a message displays allowing the selection of the tare pressure: upstream or downstream. After this selection, the molbox’s internal valves are actuated to set up the tare configuration. The current pressure measured by the molbox pressure transducers is displayed on the molbox Output run screen. When the pressure is stable, the circular ready indicator will change to green and the tare button is enabled. Press [Tare] to activate the current value. The <Status Bar> displays <Tare Complete> after the tare is set. The tare display on the molbox Output run screen does not automatically close after the tare function has been executed. This allows the tare to be repeated as many times as desired. Use the close control box or the <Continue> button to complete the tare process and resume normal operation. See Table 25 for information on each of the tare molbox panel fields. Page 81 © 2011 Fluke Calibration GFS2102™ OPERATION AND MAINTENANCE MANUAL Figure 48. molbox Output Run Screen in Tare Mode Table 25. Tare molbox Fields LABEL Red/Green Circular Ready Indicator DESCRIPTION This indicator is green only when the pressure rate of change is within the molbox’s internal tare rate criterion. In this state, the <Tare> button is enabled. When the indicator is red, the <Tare> button is disabled. Pressure Rate (Pa/s) Current differential pressure rate of change. Differential Pressure (Pa) Non-tare corrected differential pressure. After taring, this pressure value should be equivalent to the <Previous Tare> display. Previous Tare (Pa) Value of the old tare. This value is updated each time the tare button is pressed. Microrange Pressure (Pa) Curent molbox RFM microrange option pressure. If the microrange is not supported by the molbox, this field displays as N/A. After taring, this pressure value should be equivalent to the <Previous Microrange Tare> display. Previous Microrange Tare (Pa) Value of the old microrange tare. If the microrange is not supported by the molbox, N/A is displayed Downstream Pressure Instantaneous downstream pressure. This value is corrected by 1/2 of the current tare value. Upstream Pressure Instantaneous upstream pressure. This value is corrected by 1/2 of the current tare value. 5.1.5.11 MFC-CB Run Screen If a MFC-CB is used to measure the output of a DUT or to control flow by supplying an analog set point, the MFC-CB run screen is an available run screen choice. The run screen displays a real time update of analog output information on the MFC-CB channels that are in use. The MFC-CB run screen can be very useful for troubleshooting. Table 26 provides information on each field of the MFC-CB OUTPUT run screen. Note © 2011 Fluke Calibration • Use the Target Flow field on the GFS Run Screen to change the flow set point of a controller. The ability to change the analog set point of the MFC-CB using the MFC-CB run screen is provided for troubleshooting purposes. • Only MFC-CB channels specifically activated during Test Initialization are enabled on the MFC-CB run screen. Page 82 5. GFS TOOLS SOFTWARE Figure 49. MFC-CB Run Screen Table 26. MFC CB Fields LABEL DESCRIPTION Output The measured analog output of the MFC-CB channel. The output unit of measure is based on the DUT or flow controller used. Set Point The measured analog set point of the MFC-CB channel. The output unit of measure is based on the test flow controller that uses the MFC-CB Set Point Target The target analog output. Change the value when running a manual test by entering a new target output and pressing [Enter]. Buttons The toolbar buttons are disabled when running tests in GFS Tools. 5.1.5.12 Data Grid Run screen While in a run mode with at least one Data File open, the Data Grid Run Screen is available to display the list of points taken and data associated with each point. Every point up to the current point in the current test cycle is displayed in this grid. The unit of measure for many data types is specified in the corresponding column header. As with the other run screens, the grid display is scalable. As a test progresses, the current point is automatically highlighted and selected in the grid. Use the options on the [Tools], [Options], [Data Grid] tab to prevent the automatic selection of the current test point. When automatic selection is ON, and the grid is scrolled to the top to view points taken earlier in the test, completion of a new point forces the grid back to the last point. The data types logged and how they are ordered in the grid can be customized (see 5.2.2.5). Any or all of the different data items logged during a test can be displayed at run time in the Data Grid Run Screen. The order of points logged in the Data File is not affected by the grid display. By default, GFS Tools displays a common set of data. The [Data],[View Data File] option and the Data File Viewer always displays all data columns logged to the file in the embedded grid (see 5.2.7). Page 83 © 2011 Fluke Calibration GFS2102™ OPERATION AND MAINTENANCE MANUAL Figure 50. Data Grid Run Screen 5.1.5.13 Data Plot Run Screen When running a test, the Data Plot Run Screen can be used to display a variety of graphs of the data currently logged in the Data File. The graph can be changed or printed without affecting test execution. Unlike the [Data], [Plot Data File] graphing function, no new Data File(s) can be selected (see 5.3.3). However, all other functions supported by the graphing tool are available during tests. Each point taken during a test causes the graph to update with the current test point information. If the <Force grid selection> option on the [Tools], [Options], [Grid] tab is not selected, the current cycle test data is not automatically displayed on the plot unless that cycle is specifically selected for plotting. For example, if flow point 3 of a 10 point test is currently plotted, and the test is executing point 7, the results of point 7 do not appear in the plot unless flow point 7 is selected using the [Plot Properties] toolbar option. Figure 51. Data Plot Run Screen © 2011 Fluke Calibration Page 84 5. GFS TOOLS SOFTWARE 5.2 [Tools] Menu 5.2.1 Overview The [Tools] menu provides features to customize and troubleshoot GFS functions. Most menu choices in the [Tools] menu are available when running a test as well as when the system is idle. 5.2.2 [Options] 5.2.2.1 [Run Test] tab The [Tools], [Options], [Run Test] tab is used to set user preferences affecting the run test part of test execution. Various aspects of run test behavior can be changed using this feature. When selections are complete, click [OK] to save changes or select another tab to change other options. Note The balance zero and AutoZero choices made on this tab affect Manual Tests only. Each Test Definition contains a unique set of zero and AutoZero options. The purpose of the [Run Test] tab fields and settings as well as instructions on how to use them are provided in Table 27. Figure 52. Options, [Run Test] Tab Page 85 © 2011 Fluke Calibration GFS2102™ OPERATION AND MAINTENANCE MANUAL Table 27. Options, [Run Test] Tab Fields FEATURE Zero Balance/ AutoZero Setup (option box) AutoZero at end of of accumulation (check box) DESCRIPTION There are 3 automatic zero choices. The selections effect how the GFS is set to zero before an accumulation begins. The choices effect manual tests only, where a Test Definition contains a unique set of AutoZero choices. GFS and DUT samples are not taken until all preaccumulation options are complete. Any option selected will occur in addition to an initial balance zero that GFS Tools performs to establish the amount of gas mass available for tests. If Zero balance is selected, but the accumulation will begin within 5 minutes of this zero, GFS Tools will NOT zero the balance again. • Do not use any pre accumulation options- There are no specific zero operations performed when an accumulation begins. • AutoZero at start of accumulation- The GFS AutoZero function is run before the accumulation begins. • Zero balance at start of accumulation- The balance is set to zero before the accumulation begins. After the required accumulation mass is consumed, a final AutoZero is performed when this option is selected. The accumulation is forced to continue until at least one more sample from the GFS is taken. It is not recommended to use this option for long accumulations that may require a large correction. The resultant shift in data makes error plots created during the accumulation less useful. It is also makes it more difficult to troubleshoot problems. AutoZero at timed interval (check box) Save AutoZero information to file (check box) Select this option to run the AutoZero at a timed interval. In typical laboratory environments, an AutoZero should run approximately every 300 seconds (5 minutes). This minimizes the absolute drift correction and provides a more continuous accumulation error plot. In very stable environments this interval can be extended. All information used to determine the AutoZero correction is saved to a delimited text file when this option is selected. The resultant file is used to validate and quantify the corrections determined by the AutoZero process. All AutoZero files are automatically saved in the \AutoZ directory relative to the root data file directory selected in [Tools][Options][Data File] and have an “.atz” extension. The file is not handled by GFS Tools. Analysis of the AutoZero files requires a separate spreadsheet application such as MS Excel. Save SDF file for each accumulation (check box) The SDF file (Sample Data File) provides a complete account for all outputs and calculations used to determine flow from the GFS and DUTs. Check this option to create a SDF file for each flow accumulation. Use this option to troubleshoot problems or to verify GFS Tools calculations. When this option is selected, the SDF file for the GFS is automatically saved in a \SDF directory relative to the root data file directory selected in [Tools][Options][Data File]. SDF files for a DUT are saved in the same directory as the DUT data file and have an “.sdf” file extension. SDF files are not manipulated by GFS Tools. Analysis of the SDF files requires a separate spreadsheet application such as MS Excel. Allow manual GFS manipulation when running a Test Definition Check this option to allow a user to use the run time toolbars on the GFS Run Screen and other device run screens when running a Test Definition. By default this option is not selected. The choices selected in the Test Definition govern the test process. However, there are times in which manual user interaction is more efficient. For example a user may manually adjust the target flow or AutoZero the GFS when a test is active. (check box) Delay timed point collection until GFS takes a data sample (check box) © 2011 Fluke Calibration Check this option to allow GFS Tools to trigger timed point sampling only after the GFS has started to sample data. This choice affects manual tests only. By default this option is selected. Depending on the sample setup, a significant amount of time may be required to collect the first sample. Un-check this option to log data during this pre-sample period. Although a GFS flow will not be available, valuable information on the changes in ambient conditions and the AutoZero correction can be used. Page 86 5. GFS TOOLS SOFTWARE FEATURE DESCRIPTION Abort timed point collection when accumulation is aborted Check this option to allow GFS Tools to automatically stop timed point collection when the GFS accumulation is complete. This option affects manual tests only. By default this option is selected, however it may be desirable to uncheck this option to log additional ambient conditions information after the accumulation is complete. (check box) Abort flow control when accumulation is aborted (check box) Abort accumulation after target mass is reached Check this option to set the flow to zero after the accumulation is complete. This option affects manual tests only. Do not select this option when multiple accumulations will be used at the same flow rate. The intended use of this option to save cylinder gas when a long duration unattended accumulation is performed. Check this option to end the flow accumulation after the target mass is reached. If the option is not checked, user intervention is required to stop the accumulation. This option affects manual tests only. By default this option is checked. (check box) 5.2.2.2 [Initialize test] tab The [Tools], [Options], [Initialize Test] tab is used to set user preferences affecting the initialization portion of test execution. The test initialization steps can be adjusted to avoid extra prompts and/or checks performed during the test initialization process. The purpose of the [Initialize Test] tab fields and settings as well as instructions on how to use them are provided in Table 28. When selections are complete, click [OK] to save changes or select another tab to change other options. Figure 53. Options, [Initialize Test] Tab Page 87 © 2011 Fluke Calibration GFS2102™ OPERATION AND MAINTENANCE MANUAL Table 28. Options, [Initialize Test] Tab Fields FEATURE DESCRIPTION Verify remote SN of Fluke Calibration DUT’s Displays a warning when Fluke Calibration device setup SN and remote SN do not match The serial number of a Fluke Calibration device that has the <Auto Detect> setup option enabled is automatically read during test initialization. This serial number is automatically compared to the serial number specified in the device definition. If this option is checked, a warning message displays when the serial numbers do not match. This is an easy way to help guarantee that the proper instruments are used during tests. (check box) Do not check this option if the serial number specified for DH instruments products includes information other than the serial number of the device. Set DUT molbox to test gas and unit of measure Check this option to force GFS Tools to change the unit of measure and gas information of a DUT molbox to the settings required by the GFS during test initialization. (check box) Prompt for MFC-Switchbox Check this option when an MFC switchbox will be used with the system. An option to select the MFC switchbox channel is available when configuring a device during test initialization. (check box) Disable entry of K factors for Fluke Calibration products Check this option to always use 1 as the K factor for a Fluke Calibration molbloc DUT. This option is provided to help avoid logging erroneous or inconsistent data caused by an incorrect K factor. (check box) Disable entry of K factors for non Fluke Calibration products (check box) Un-check (recommended) this option to automatically populate the K factor field of a non Fluke Calibration product (such as an MFC) with the K factor information stored in the Process Gas Editor. If the manufacturer gas information is not sorted in the Process Gas Editor, the K factor field is enabled for user entry. Use the [Tools][Process Gas Editor] menu choice to update gas information for a specific manufacturer. 5.2.2.3 [End Test] tab The [Tools], [Options], [End Test] tab is used to set user preferences affecting operations that occur to conclude a test sequence. The purpose of the [End Test] tab fields and settings as well as instructions on how to use them are provided in Table 29. When selections are complete, click [OK] to save changes or select another tab to change other options. Note Selecting a fixed repeat point delay, deactivating the test notes and enabling the auto report generation can allow an automated test to run and generate a complete report without user intervention. © 2011 Fluke Calibration Page 88 5. GFS TOOLS SOFTWARE Figure 54. Options, [End Test] Tab Table 29. Options, [End Test] Tab Fields FEATURE Final point of each cycle (radio button selection) DESCRIPTION GFS Tools provides the capability to repeat test points using the Run Toolbar, [Back] icon. However, if a test ends automatically after the last point, there is no opportunity to repeat points when the last point has completed. This option determines whether a pause to allow points to be repeated after the last point is complete or automatically end the test without pause. There are three choices: Enable repeat for fixed time delay After the last test point is complete, the test pauses for a fixed time delay. During the delay, the Run Toolbar, [Back] icon remains active allowing points to be repeated. This choice gives the possibility of repeating points after the last point is complete but also causes the test to eventually continue automatically without operator intervention. Auto generate report after complete tests (check box) Prompt for test notes at the end of the test (check box) Prompt to repeat Systematically pauses the test at the end of each test cycle and prompts the user to indicate whether the last test point should be repeated. This selection guarantees that the operator will consider whether to repeat points but it also prevents the test from completing automatically. No repeat option The test concludes automatically after the last point. There is no opportunity to repeat points after the last point is complete. Use this choice to prevent any delays or interruptions in the test sequence. Check this option to automatically create a report when a test completes. The report is generated using the last report template used. The <Test Complete> options still display at the end of the test. If checked, GFS Tools always prompts for test notes to be entered at the end of the test. The test notes prompt does not interfere with unattended tests. The prompt occurs after all test data is collected and the flow is set to 0. Uncheck this option to avoid the test notes prompt. In this case, no test notes can be included in the test’s Data File. Page 89 © 2011 Fluke Calibration GFS2102™ OPERATION AND MAINTENANCE MANUAL 5.2.2.4 [Data File] tab The [Tools], [Options], [Data File] tab is used to set user preferences affecting the Data File (*.dat) which records the data from a test. See section 5.4, Data Files, for details on how data files are named and structured. The purpose of the [Data File] tab fields and settings as well as instructions on how to use them are provided in Table 30. When selections are complete, click [OK] to save changes or select another tab to change other options. Figure 55. Options, [Data File] Tab Table 30. Options, [Data File] Tab Fields FEATURE Use default Data File naming convention DESCRIPTION Check this option to automatically name new Data Files using the default Data File naming convention as specified by the options that follow. If this is not checked, a pop-up window will appear during test initialization prompting to the Save As filename to be entered. (check box) Use long Data File name format (check box) Write protect all complete Data Files (check box) Check this option to use the long Data File naming convention as described in. This feature is checked by default. Although GFS Tools is a 32-bit Windows application, Data Files may be stored on a network or other location that does not support the long file naming convention. To avoid file name truncation, uncheck this option to create default file names that are 8 characters or less. When this option is checked, completed test Data Files are write protected. Check this option to protect data gathered from completed tests. Write protected files are not easily modified, so this option helps to prevent accidental data alteration. If this option is unchecked, Data Files are NOT write protected. © 2011 Fluke Calibration Page 90 5. GFS TOOLS SOFTWARE FEATURE Data file name format (display and drop down list boxes) DESCRIPTION This preference allows for the selection of how the default data file name is created and displays an approximation of how the data file name will appear. There is a large selection of possibilities identical to those listed below under <Major sub-directory named by>, including the molbloc serial number and calibration gas (recommended). The “#” symbols represent the automatic number sequence that GFS Tools assigns to the file name. If the “Use long Data File name format” is selected then GFS Tools will automatically sequence the data files up to 999 files, otherwise the limit is 99 before a new directory would need to be created. Note The <molbloc SN> and <Calibration Gas> selections are recommended for these fields. The resulting file would appear similar to “ xxxxN2_001.dat ” Auto delete incomplete Data Files (check box) Data file delimiter (drop down list box) When this option is checked, GFS Tools automatically deletes Data Files that do not include at least one complete test cycle. This avoids collecting partial Data Files for tests that were not completed. If this option is unchecked, a prompt for whether to delete the partial Data File or not appears whenever a test is aborted. This preference sets the data delimiter for the data in test Data Files (*.dat). The choices are comma, tab or semicolon. The semicolon delimiter is the default. The choice can be useful to assure compatibility when Data Files will be exported to another program. The Report Editor automatically detects and handles which delimiter was used in the Data File so the choice can be changed occasionally without affecting program operation. Caution Be sure that the selected delimiter is not used as a character in any entry field or file delimiting will be incorrect. Root Data File directory (text entry field) <Major subdirectory named by> (dropdown selection list) Defines the root directory to use when creating new DUT based sub-directories and copying Data Files. The selected directory can be on a network or on an internal hard drive. Any directory selection can be used provided there is enough room to store test Data Files and that the location is not write protected. Use the <Browse> button next to the entry field to select a new or existing directory using a directory browsing tool. GFS Tools generates default file names for the Data Files (*.dat) it creates when a test is run. It also creates and uses default directories for the Data Files based on the DUT on which the test was run. This DUT dependent data directory is created as a subdirectory of the <Root Data File directory>. This feature automatically sorts Data Files in DUT dependent directories so that they can easily be located when desired. This option determines how major Data File directories will be named. The choices are: Calibration Gas, Customer ID, Identification, Label, Manufacturer, Model, molbloc SN, and serial number. In addition, <None> can be selected. The directory name will include the full text of the selected DUT field unless the <Use long Data File name…> option is unchecked or the DUT field contains one of the following invalid characters as part of the field: /, \, ?, :, *, <, >, |, or “. If so, the directory name will contain all text up to the first occurrence of the invalid character. Note The <molbloc SN> selection is recommended for this field even when only one type of DUT will be used by GFS Tools. <Minor subdirectory named by> (dropdown selection list) This option is similar to the <Major sub-directory named by>. The difference is that the directory created by this selection is created as a subdirectory of the Major Sub-directory. Note The <Calibration Gas> of the DUT selection is recommended for this field. 5.2.2.5 [Data Grid] Tab The [Tools], [Options], [Grid] tab is used to customize the Data Grid Run Screen that is available while running tests. The grid can be customized to display only the desired data field columns while suppressing other columns. The order of the columns can also be changed. Any test data item logged in the Data File can be included in any column of the Data Grid run screen by using the correct combination of features. Press the [Default Settings] button to automatically display the GFS Tools default data fields. Page 91 © 2011 Fluke Calibration GFS2102™ OPERATION AND MAINTENANCE MANUAL Instructions on the operation of the [Grid] tab are provided in Table 31. When selections are complete, click [OK] to save changes or select another tab to change other options. Note • Selections made on the [Grid] tab have no effect on the data that is logged to the Data File. The grid setup is provided for customization of the Data Grid Run Screen only (see 5.1.5.9,). Use the [View Data File] option to view all columns of test data. • Multiple grid display fields can be selected in two ways: a) hold down the SHIFT key and use the UP and/or DOWN arrow keys to make multiple contiguous selections; b) hold down the CTRL key and us the mouse to make multiple non-contiguous selections. Add or remove the selections by using the appropriate shift button. • Sort the <Columns in grid> display by selecting an item then using the UP or DOWN arrow keys while holding the CTRL button Figure 56. Options, [Data Grid] Tab Table 31. Options, [Data Grid] Tab Selections FEATURE Available fields (list box) © 2011 Fluke Calibration DESCRIPTION Contains an alphabetically sorted list of the data field columns not currently included in the Data Grid Run Screen. Individual fields can be dragged and dropped onto the <Columns in grid> list. Alternatively, multiple fields can be selected and moved by using combinations of the shift, arrow and control keys along with the shift right button “>>>>>>”. Page 92 5. GFS TOOLS SOFTWARE FEATURE DESCRIPTION Fields in grid (list box) Scroll to display current data point (check box) These are the data field columns that display in the Data Grid Run Screen when a test is running. The <Point> field is always included and is always at the top of the list. All other data fields can be added, removed or arranged in any order. Double-click a field to remove it from the list. Alternatively, multiple fields can be selected and moved by using combinations of the shift, arrow and control keys along with the shift left button “<<<<<”. Move a field’s position in the list by selecting the field then using the UP or DOWN arrow keys while holding the CTRL button. When checked, the current data point is automatically displayed in the Data Grid run screen when a test point is logged. If the grid is scrolled between points, and a new point is taken, the grid automatically scrolls to the bottom to display the new point. The plot is also updated to force the display of the current point in the current test cycle even if the plot has been customized to not display the current cycle. Uncheck this box to avoid automatic forced updating of the Data Grid and Plot Run Screens. 5.2.3 [Unit of Measure Converter] All unit conversions and custom units are handled by the Fluke Calibration Unit of Measure Converter. Run the Unit of Measure Converter as a stand-alone application using the program group icon, or use the [Tools], [Unit of Measure Converter] option in GFS Tools. The [Options] menu in the Unit of Measure Converter contains features to allow custom unit creation. Custom units created in this way are available throughout GFS Tools. Refer to the help menu of the Unit of Measure Converter for details on unit conversion factors, supported units and custom unit creation. 5.2.4 [Remote Communications] The Direct Remote Communication form is accessible by using the shortcut icon in the GFS Tools program group or by using the [Tools], [Remote Communications] menu choice in the program. This tool provides a simple means of sending individual command strings to remote devices and receiving and displaying the response. Direct Remote Communications is used for discreet remote device communication and communications testing. Use this tool to familiarize yourself with the device’s communications, for troubleshooting communications problems and determining the appropriate commands to send prior to entering command information into of the Remote Command Editor (see 5.5.3.4, Remote Command Editor). If a command issued to a device does not give the desired result, refer to the device documentation for information on how to troubleshoot the problem. Try cycling power on the device and also try a command more than one time before concluding the command is in error. Note Fluke Calibration device COM2 options are not supported by the Direct Remote Communication form. To test this functionality, manually set the device COM2 port to the RS232 settings of the device connected to the COM2 port. Then send commands with the COM2 prefix required by the product. In most cases, the prefix “#” will work. Refer to the Operation and Maintenance manual of the specific product for details on the pass through support. Page 93 © 2011 Fluke Calibration GFS2102™ OPERATION AND MAINTENANCE MANUAL Figure 57. Direct Remote Communication Select an <Interface> and enter the necessary interface settings. Enter the command to be sent in the command field. Clicking [Send] or pressing the [Enter] key, causes the command to be sent using the current interface setup. Results and return strings are displayed in the white portion of the form on the bottom of the display. These return strings are logged as output and are not unmodified. The communications time-out is fixed at 10 seconds. A time-out is indicated by displaying <INTERFACE ERROR>. If the command does not have a response or the target communications device does not normally respond to commands, click the <Send Only> check box or GFS Tools will expect a response and time-out if none is received. Commands sent are automatically added to the drop down <Command> list; the list is cleared each time the Direct Remote Command option is selected. Some RS232 devices automatically output data without requiring a command response pair. To test these interfaces, check the <Poll Interface> option. When active, this feature polls the selected RS232 port and automatically log any response. After a command has been issued, the selection can be toggled without any other required actions. A mechanism is provided to send specific data bytes to a device. Enter the text “BYTE:=” followed by a series a data bytes (0 – 255) separated by spaces. The numeric values are converted to a sequence of characters and sent to the remote device. Make sure that decimal values are entered and not hex (255 not FF). For example, enter the command “BYTE:= 2 27” to send the characters 2 and 27 (Hex 02, 1B). Most devices that require specific byte data in this way do not use command or response terminators. 5.2.5 [Process Gas Editor] The Process Gas Editor is a stand-alone program that is used to manage K-Factors and DUT models and manufacturers. Like the Unit of Measure Converter, the Process Gas Editor has its own on-line help and is available in the GFS Tools program group and in the [Tools] menu. Refer to the on-line help in the Process Gas Editor for details on using this program. Defining specific gas conversion information based on gas and manufacturer simplifies the DUT and Support Device setups. GFS Tools automatically obtains the correct K-Factor based on the selected manufacturer and calibration gas. Manual entry of K-Factor information is always available. There is no requirement to use the Process Gas Editor. 5.2.6 [Change GFS AMH State] Use this menu choice to change the state of the GFS AMH without running a test. This is necessary for routine maintenance of the LCM and the GFS system. This option is not available when a test is active. The Command Toolbar on the GFS Run Screen is available © 2011 Fluke Calibration Page 94 5. GFS TOOLS SOFTWARE for AMH manipulation when a test is active. Refer to the GFS Run Screen, Command Toolbar section 5.1.5.2.3 for details on the meaning of each button on this window. Figure 58. Change GFS AMH State 5.2.7 [PC Timer Calibration] The [PC Timer Calibration] menu choice is provided to adjust and/or compare the internal clock of the host PC to the calibrated clock of the LCM. The internal clock of the host PC is used to integrate flow from a DUT to obtain a mass. For this reason, it is important for the PC clock and LCM clock to agree. However, perfect agreement is not critical. Flow is inherently an average quantity. Integrating a flow that updates ever second with a time that has error off ±5 ms will not yield a significant flow integration error. Use the displayed Time Calibration form to perform the comparison. Press [Start] to begin the process. The LCM and PC clock comparison information displays on the screen while the test is active. Allow the clocks to run for at least one hour (3 to 24 hours are recommended, the longer it runs the more accurate it will be) then press [Stop]. A predicted span correction is provided. Press [Apply] to use this new span correction to adjust the PC clock. Repeat the process as many times as desired then close the form to return to the main program. 5.3 [Data] Menu 5.3.1 Overview The [Data] menu choice provides features related to data already collected by GFS Tools. Features are available to view raw data, data plots and to format data into a custom report. 5.3.2 [View Data File] When GFS Tools runs a test, it logs exhaustive test related data in a Data File (*.dat). The Data File is automatically generated and stored to a DUT dependent directory as defined in 5.2.2.4. Data Files can be viewed as raw text in almost any text editor or spreadsheet application. Data Files can be merged with report templates to generate custom test reports. However, there are occasions in which it is desirable to view a Data File without leaving GFS Tools. For this purpose, the Data File Viewer is provided. This tool is accessible using [Data], [View Data File]. When [Data], [View Data File] is selected, a standard Windows file browser appears with the default directory set to the root Data File directory. Selecting a Data File causes that file to be opened and displayed in the Data File Viewer. The Data File Viewer provides no formatting. It displays only, there are no options to edit and/or save Data Files using this feature. The name and directory path of the Data File currently being viewed are shown at the top of the window. While viewing a Data File, a toolbar on the top left of the display is available for new file selection, printing and displaying the test data in a grid format. The function of each toolbar option is described in the table below. Page 95 © 2011 Fluke Calibration GFS2102™ OPERATION AND MAINTENANCE MANUAL Figure 59. Data File Viewer Table 32. Data File Viewer Options FEATURE Select Data File Print Data File Toggle Grid Plot Data 5.3.3 DESCRIPTION Used to select a different Data File to view. Used to print the Data File that is being viewed using the standard Windows print function and the current default printer. The data is not formatted prior to printing. Toggles the display of the data grid inside the data viewer. If the Data File is incomplete, this option is disabled. The data in the grid is equivalent to the data that would be displayed in MS Excel if the proper Data File delimiter were selected. Plot the current Data File. Refer to section 5.3.3, for details on how to use the plot tool. [Plot Data] [Data], [Plot Data File] is used to generate plots using data stored in Data Files (*.dat). The plots generated may be viewed and/or printed. This function is useful to quickly analyze data. Plots formatted using this tool are also available in reports. There are several default plots that are installed with GFS Tools. However any number of custom plots can be created to analyze data logged by GFS Tools. Use the toolbar on the plot form to include a tolerance bar, legend or best fit error data. When [Data], [Plot Data File] is selected, a standard Windows file browser appears set to the directory that holds the Data Files. Selecting a file causes the GFS Tools Plot screen to appear loaded with a plot generated using the data from the Data File. © 2011 Fluke Calibration Page 96 5. GFS TOOLS SOFTWARE Figure 60. [Data], [Plot Data File] Screen 5.3.3.1 Plot Toolbar A plot toolbar is provided to select new Data Files, print the current plot, change the type of plot, access common plot properties and create/edit custom plots. Use the list box at the top of the display to change plots. The toolbar features are summarized below: Table 33. Data Plot Toolbar FEATURE DESCRIPTION Select/Append Data File Allows selection, using a standard Windows file browser, of a different Data File(s) to be plotted. During test execution, this icon is disabled. Only the current test can be viewed in the plot tool while a test is active. Print Data File Print the displayed plot using the standard Windows print function. Create/Edit Plot Edit Plot Data Displays the Custom Plot Editor loaded with all existing plots. The editor allows plots to be created, edited and removed (see 5.3.3.3, Create/Edit Plots). Displays an options window to customize the points used for plotting. Plots can include different combinations of accumulations, flow points and data files. Note Data can only be plotted in groups, i.e. all accumulations at one flow point or the first accumulation of each flow point. The plot cannot handle all accumulations at all flow points. This is further complicated when running multiple DUTs, only a single accumulation from each of two DUTs can be displayed at a single flow point. Edit Plot Properties Displays an options window to customize the appearance of a plot, including scale, color, titles and fonts related to the plot. This can be used to re-scale the plot and zoom in on specific sections of a plot. Page 97 © 2011 Fluke Calibration GFS2102™ OPERATION AND MAINTENANCE MANUAL 5.3.3.2 Plot Options Menu An [Options] menu is available for use in place of the toolbar when GFS Tools is not running a test. The options in the menu directly correspond to options on the plot toolbar. In addition there is an [Add Plot] option used to add additional Data Files to the plotting tool. This is a useful feature that allows Data Files created at different times to be compared on a single plot. 5.3.3.3 Create/Edit Plots All plots used by the plotting tool can be customized using the Custom Plot Editor. Use the toolbar or menu choice to access this tool. The features on this form allow plots to be created, edited and removed. Note Editing custom plots follows the same basic editing rules as all other editors within GFS Tools. The one exception is that the [Edit] button must be pressed prior to modifying plot properties. Plot properties cannot be modified directly prior to pressing this button. To edit an existing plot simply select the plot in the list and press the [Edit] button. Use the [New] toolbar option to create a new plot. Using either of these options puts the editor into edit mode. Only in this state can plot properties be changed. Use any combination of test data to generate plots. Always start by entering a <Plot Description> that accurately represents the plot. The text entered displays at the top of each plot and is used to select plots. Select the type of plot by changing the state of the <3D Plot> check box. Select the data to include on each axis by using the drop down list box next to each axis label. All numeric data logged for each point in the Data File can be used on any plot axis. Press the ellipsis button next to the list box to edit the axis text. Make plot property selections at the bottom of the display then press the [Save] toolbar button to save the plot. Prior to saving the plot, the color scheme, line type, fonts and many other aspects of the plot can be modified by pressing the [Properties] button. This displays the plot properties dialog that allows customization of the non data related plot features. Note 3D plots cannot be used for any combination of data in the Data File. The data plotted must be related such that one axis value is fairly constant while the other axis values change. This is only possible when accessing Data Files that include multiple cycles. For example a test that executes multiple accumulations or flow points is available for 3D plotting. Data from a single cycle test cannot be used on a 3D plot. In this case, use the secondary Y axis on a 2D plot. Figure 61 shows the Custom Plot Editor loaded with several plots. Table 34 explains the features available on the form. © 2011 Fluke Calibration Page 98 5. GFS TOOLS SOFTWARE Figure 61. Custom Plot Editor Table 34. Custom Plot Editor Fields FEATURES DESCRIPTION Existing Plots (list box) Plot Data The list box displays all plots stored in the GFS Tools database. The plot axis data at the bottom of the display always corresponds to the plot selected in this list. Use this button to plot the currently selected data plot. (button) Exit Closes the Custom Plot Editor. (button) Edit (button) Properties Begins the editing the currently selected plot. Only when this button is pressed can changes be made to a custom plot. Displays the plot properties dialog to allow non data related plot properties to be edited. (button) Plot Description (required text entry) 3D Plot (check box) X Axis Data (list box) Y Axis Data (list box) Displays the text used select plots and to use as the plot title. Make sure the text in this field accurately represents the selected plot. Check this box to crate a 3D plot. The box is not checked, it is assumed that a 2D plot will be created. Select the data that will display along the X axis. The text of the selection followed by units (when selected) will appear along the X axis. Press the button next to the drop down list to change the text to associate with <X Axis Data>. Select the data that will display along the Y axis. The text of the selection followed by units (when selected) will appear along the Y axis of the plot. Press the button next to the drop down list to change the text to associate with <Y Axis Data>. Page 99 © 2011 Fluke Calibration GFS2102™ OPERATION AND MAINTENANCE MANUAL FEATURES Y2 Axis Data (list box) Z Axis Data (list box) DESCRIPTION Select the data that will display along the secondary Y axis. This axis is labeled on the right side of a plot. The text of the selection followed by units (when selected) will appear along the right side of the plot. Press the button next to the drop down list to change the text to associate with <Y2 Axis Data>. Select the data that will display along the Z axis. The text of the selection followed by units (when selected) will appear along the Z axis. Press the button next to the drop down list to change the text to associate with <Z Axis Data>. 5.3.3.4 Plot Points Use the toolbar or [Options] menu to display the Plot Points dialog. The features on this form allow the selection of which points, Data Files and point cycles to include in a test data plot. The tabs available on this display vary with the information stored in the Data File. The [General] tab contains features to apply tolerance, subset and legend options. The remaining tabs contain point, accumulation and flow values to include in the plot. Check options that you wish to include in the plot and uncheck options that you do not wish to include in the plot. Multiple selections are available on only one tab other than the [Points] tab. This limit is imposed to restrict the number of points on a plot. For example plotting is available for 1 flow point selected on the [Flow Points] tab with multiple selections on the [Accumulations] tab. In this case, all accumulations for the selected flow point are plotted. However, selecting all flow points and accumulations will not work as expected. Only accumulation data from the first flow point is plotted. Note • Only one tab other than the [Points] tab should have multiple selections. If any one of the [Accumulation], [Flow Points], or [Data Files] tabs have multiple options checked the other 2 tabs must have only 1 item selected. This restriction is necessary to limit the amount of information plotted at a time. • Target flow information is automatically displayed as the plot sub-title when 1 flow point is selected. • Target flow information is listed in the plot legend when the plot legend is turned on in the [General] tab and multiple flow points are selected. When the selected plot type uses %Reading Error, %Span Error or DUT Difference on the Y-Axis, an additional tab is available to plot best fit error data. The best fit DUT error is determined using the best fit order selected on the [Best Fit] tab. See Figure 63 and Table 36 for information on the options on the [Best Fit] tab. This is a convenient way of viewing predicted error information. This option is not available for 3D plots and plots with a secondary Y axis. To view best fit data when the [Best Fit] tab is not available, use the Custom Plot Editor and specify best fit information for an axis in the plot. © 2011 Fluke Calibration Page 100 5. GFS TOOLS SOFTWARE Figure 62. Plot Points display Table 35. Plot Points General Tab Fields FEATURES Include tolerance bars (check box) Limit Y axis to 1.5X tolerance (check box) New subset for each data point (button) Include subset legend DESCRIPTION Causes tolerance bars to be displayed on the graph. The tolerance bars are calculated using the tolerance value stored in the Data File. Tolerance bars are displayed only when plotting errors and or flow information related to the DUT. Tolerance bars are also not displayed when a secondary Y axis is included in the plot. This option is active only when tolerance bars are included in the plot and an error plot type is selected. If the error exceeds the tolerance by 50 %, the actual DUT error plot will not be visible. When this function is not active, all plots are auto-scaled. This option is often used for plots included in reports so that all plots are scaled in the same manner regardless of actual error magnitude. Check this option to create a new subset of points for each flow point. Use this option to generate lines of data for the same point when multiple cycles are used. For example, a 6 flow point 6 accumulation test would yield 6 lines of data. The error of each point can be plotted to quickly display how error changed at a single point in each accumulation. This feature is most useful when viewing accumulation information from the same flow point. Check this option to display a legend at the top of the plot to for each subset. Do not check this option when many subsets will be used. (button) Figure 63. Plot Points Best Fit Tab Page 101 © 2011 Fluke Calibration GFS2102™ OPERATION AND MAINTENANCE MANUAL Table 36. Plot Points Best Fit Tab Fields FEATURES DESCRIPTION Plot best fit error data Check this box to plot best fit error (predicted error) when the selected plot type uses a DUT to reference error on the Y Axis. (check box) Plot best fit data only Plot only best fit data when this item is checked. When it is not checked, the original error and best fit error are plotted. (check box) Best fit order (drop down list) 5.3.4 The order of the polynomial fit to use to determine the best fit error. A least squares best fit is used on the DUT and Reference data to determine the polynomial coefficients. The determined values are applied to the DUT data to determine the predicted DUT data. A new error based on the selected plot type is calculated using the predicted DUT data and the reference data. [Report Data] The COMPASS Report Editor is accessed by: selecting the [Data], [Report Data] menu option, pressing the [Generate Report] button in the Test Complete form at the end of a test, or run directly by selecting the short-cut icon in the GFS Tools program group. In all cases the Report Editor runs as a separate application and may be closed at any time without affecting the operation of GFS Tools. The COMPASS Report Editor is used to generate reports from *.dat files output by Fluke Calibration PC based software applications. The COMPASS Report Editor provides the features to create, view and edit reports and templates. The report templates are merged with the *.dat files to create fully customized reports. The editor is essentially a customized word processor and as such, navigation and use is intuitive to users familiar with other word processors. During the report generation process, user defined templates are merged with Data Files to create final reports. These newly generated reports may be saved as Microsoft Word documents or PDF documents if Adobe Acrobat is installed. Use the [Help][On-Line Manual] menu choice for complete information on this program. Several default report templates are installed with the software. Use these templates as examples on how to create new templates to better customize a report. 5.4 Data Files 5.4.1 Overview GFS Tools provides 3 different types of data files: Test Data files (*.dat), AutoZero Data Files (*.atz) and Sample Data Files (*.sdf). An error log file errorlog.log is created or appended every time GFS Tools is executed. Only Test Data files can be viewed and reported using GFS Tools. The other data files are provided for system diagnostics purposes. All files created by GFS Tools are designed for easy export into third party applications for analysis. Table 37. Data Files Types FILE Test Data Files EXTENSION *.dat © 2011 Fluke Calibration LOCATION USEAGE Based on the data file naming convention. Created during manual or automated test execution. These files can be viewed, edited, printed and made into custom reports all within GFS Tools. Test Data Files are the output of GFS Tools. Page 102 5. GFS TOOLS SOFTWARE FILE EXTENSION LOCATION USEAGE AutoZero Data Files *.atz All AutoZero data files are stored in the \AutoZ directory relative to the root data file directory. AutoZero data files are used to monitor the AutoZero correction while the GFS is active. The files are simple ASCII delimited files that require a separate application for manipulation. Sample Data Files *.sdf All GFS data files are stored in the \SDF directory relative to the root data file directory. Sample data files contain all information used to determine the GFS and DUT flows. Use the information in this file to recalculate flows, integrated DUT mass or to troubleshoot bad points or other system anomalies. DUT SDF files are stored in same directory as the DUT data files. Error Log *.log 5.4.2 There is only one error log file. This file is stored in the installation directory of GFS Tools. By default this is “C:\Program Files\GFS Tools”. All system errors are logged to this file. Use the information in this file to track down system errors and to correlate erroneous data with other GFS events. Data File Creation At the beginning of a test definition, a Data File (*.dat) is created automatically. At the beginning of a manual test, a data file needs to be created by selecting the yellow file folder icon on the Main Toolbar (see Section 5.1.4.3). This creates a separate data file for each DUT in a test, and the files are named according to the settings and options described in Section 5.4.3 below. If no DUTs are selected during test initialization, one file is created. The file contains all the details on the test (GFS gas and cylinder information, DUT information, test information) and test data is logged to it as the test runs. If a test is aborted before test conclusion is reached, the [Tools], [Options], [Data File] tab setting determines whether GFS Tools queries the operator as to whether to keep or delete the partial Data File or if the Data File is automatically deleted. 5.4.3 Naming and Storing Data Files Data files are named and stored automatically. The default directory for GFS TOOLS Data Files is “\data\DUTIDinfo\*.dat”. The “DUTIDinfo” sub-directory is created automatically by GFS TOOLS using the DUT information selected on the [Tools], [Options], [Data File] tab. By default, the DUT serial number is used (specified in the DUT Definition). The DUT based sub directories are automatically created by GFS TOOLS in the designated Root Data File Directory. The automated Data File name follows the format defined by the [Tools], [Options], [Data File] <Data file name Format> selection. Realize that this is a default file name and that all complete Data Files can be renamed using the [Re-Name] option on the Test Complete dialog at the end of a test. All file names are composed of 3 sections followed by a "*.dat" file extension. The first 2 sections are user selectable fields that are based on the date or a specific piece of DUT information. The third field is always a run counter that increments to prevent files run on the same day from having the same file name. The increment is 4 characters by default and is set to 2 characters when long file names are disabled. The complete directory and name structure is: Data Root\DUT Major\DUT Minor\[Data Field1][Data Field2][Run Number].dat Page 103 © 2011 Fluke Calibration GFS2102™ OPERATION AND MAINTENANCE MANUAL Table 38. Data File Data Field Optional Selections Selection DESCRIPTION None No date or DUT information included in the data file field. Serial Number The active DUT serial number is added to the data file field. If long file name support is disabled, the field is limited to 8 characters. molbloc Serial Number The serial number of a molbloc that is connected to a molbox. Identification The active DUT serial number is added to the data file field. If long file name support is disabled, the field is limited to 8 characters. Customer Number The active DUT customer number is added to the data file field. If long file name support is disabled, the field is limited to 8 characters. Julian Day This field has the format of YYDDD where YY represents a 2 digit year and DDD Is the three digit day of the year (Julian date). e.g., 001 for January 1 and 365 for December 31 (non leap year). Long Date Long year format (YYYYMMDD) that includes a 4 digit year, 2 digit month (01 to 12) and a 2 digit day field (01 to 31). Short Date Short year format (YYMMDD) that includes a 2 digit year, 2 digit month (01 to 12) and a 2 digit day field (01 to 31). Calibration Gas The defined gas symbol is used in the data file, "N2" for example not "Nitrogen". Caution • The use of date based file names is intended to maintain sequential file order in a given directory . • The automatic naming convention for Data Files makes it possible for two *.dat files to have the same name. However, the two files will always be stored in different directories since they would have to be for DUTs with different identifications. To avoid conflicts or accidental overwrites when moving Data Files to new locations, the user should keep in mind that different Data Files might have the same name. 5.4.4 Data File Structure Unlike Compass for Flow, the information logged in the Data File is not user selectable, all data related to the test is logged for every test. Data Files have 6 distinct sections: General Header, Test Header, Device Header, Pre-Test, Test Data, and Notes. With few exceptions, each Data File section begins with brackets describing the section; [Test Data] for example. The next line is a delimited list of titles for each field in the section. This line is followed by a line of actual data that corresponds to the section title information. Table 39 describes these sections. © 2011 Fluke Calibration Page 104 5. GFS TOOLS SOFTWARE Table 39. Data File Structure General Header Program Version Describes non test specific settings such as date, user and station id. ASCII value of delimiter. [GENERAL INFORMATION] General header labels Test Header [TEST INFORMATION] Test specific information is stored in this section. In particular, control and data collection settings stored in the Test Definition. Test information labels Device Header [DUT] Device Definition header and output information is stored in this section. There is a separate header for each device used by GFS Tools. Each section is labeled based on the device the section represents. DUT information labels Pre Test [PRE TEST] Leak test settings are listed in this section. Pre test information labels Test information data DUT data labels [Reference] Etc. Pre test data. Test Data [TEST DATA] Test data is segregated by sections specific to each type of cycle. These cycle labels are present even when the specific cycle type was not executed. For data file compatibility with other programs, a Test Temperature section is provided even though it is not specifically supported by GFS Tools. [TEST TEMPERATURE] Test data identifier code used to parse the data file. Test data labels. Delimited unit line corresponding the columns of test data. [TEST FLOW POINT] [TEST ACCUMULATION] Data logged at each test point. A new [TEST ACCUMULATION] section is recorded for each accumulation. A new [TEST FLOW POINT] section and all subsequent [TEST ACCUMULATION] sections are recorded for each test flow point. A new [TEST TEMPERATURE] section and all subsequent [TEST FLOW POINT] and [TEST ACCUMULATION] for each test temperature point. Test Notes [NOTES] Multi line test notes specified by the user at the end of a test. 5.5 [Setup] Menu 5.5.1 Overview The [Setup] menu contains features to manage Test Definitions, Devices Under Test (DUTs), Support Devices, system configuration and GFS calibration. Shortcuts to the editors in this menu are also available on the main toolbar (see 5.1.4.2, Run Display Tools). Page 105 © 2011 Fluke Calibration GFS2102™ OPERATION AND MAINTENANCE MANUAL The editors found in the [Setup] menu have many common functions. Sections 5.5.1.1 to 5.5.1.2 detail the common sections. Sections 5.5.2 to 5.5.7 describe the selections in the [Setup] menu. 5.5.1.1 Setup Selector The Setup Selector is used throughout GFS Tools to select Test Definitions, DUTs, and Support Devices. The Editor Toolbar on all GFS Tools editors provides a link to the Setup Selector. This allows a setup to be identified quickly from a list rather than by scrolling through all individual setups. In the Setup Selector, all setups are listed alphabetically by <Label>. The selector columns include information that should allow easy identification of a specific setup. Click the desired selection and press [OK] or double click the field to make a selection. Figure 64. Setup Selector 5.5.1.2 Editor Toolbar All editors in GFS Tools use the Editor Toolbar. This includes the DUT, Support Device and Test Definition Editors. In the editor, all features not on the tabs are considered part of the Editor Toolbar. The toolbar identifies the definition that is active in the editor, provides tools to create, delete, save, restore and select a definition to edit. Use the scrollbar or the [Select from List] toolbar icon to pick a setup to edit. A label flashes “Editing” when any changes to an existing setup are made or a new setup is created. Use the [Restore] toolbar icon to undo undesired changes. Caution Changing the <Record Label> does not create a new instance of a device setup. The [New] or [Copy] toolbar functions must be used to create a new device setup. © 2011 Fluke Calibration Page 106 5. GFS TOOLS SOFTWARE Figure 65. Editor Toolbar Table 40. Editor Toolbar Features FEATURE DESCRIPTION Record label (required text entry field) This field identifies a unique setup. It is analogous to a file name. The text entered should make the setup easily distinguishable from other setups of the same type. Up to 40 characters can be entered. During Test Initialization, devices are selected and displayed using their <Record Label>. Use a [Tools], [Options], [Initialize Test] preference to list devices by the <Record Label>. Caution Do not use the following characters in this field: \,/, :, *, ?, “, <,>, |, a comma or tab character. These characters will cause problems when importing the Data File or creating the Data File directory based on the data directory naming convention selected using the [Tools], [Options], [Data File] tab. Editing Record The red label flashes when changes to a setup have been made but not saved. (label) New Creates a new setup with default information. (toolbar icon) Save Saves changes to an edited setup. This icon is not active when no edits have been made. If the setup is valid it is saved without further prompting. Setups that are incomplete or contain errors generate error messages. Resolve any errors before saving. (toolbar icon) Copy Copies the contents of the current setup to a new setup. The <Record Label> of the new setup is the copied setup label plus the text <Copy>. This is the only difference between the original setup and the copy. Make sure the new setup is properly edited before saving. (toolbar icon) Restore Restores a setup that is being edited to the last saved state. Use this feature to abandon edits made before saving. If a new setup was created using the [New] icon, the restore button is nonfunctional as the is no previous saved state to restore to. (toolbar icon) Page 107 © 2011 Fluke Calibration GFS2102™ OPERATION AND MAINTENANCE MANUAL FEATURE DESCRIPTION Deletes the setup that is active in the editor. A message prompt for confirmation displays prior to removing the setup. Delete (toolbar icon) Select a specific setup using the [Setup Selector] (see 5.5.1.1, Setup Selector). This is a more efficient way to select a specific setup than scrolling through existing setups. Open/Select (toolbar icon) Scroll Select Scrolls to the next setup in ascending alphabetical order by <Record Label>. (scroll bar) 5.5.2 [Setup], [Test] The [Setup],[Test] menu choice is used to access the Test Definition Editor. Test Definitions are used to define a specific test procedure including the sequence of test points and a large number of operational details. DUT(s) to be tested and a Test Definition are selected during the initialization of a test. A pointer to a default Test Definition for a DUT is included in the DUT Definition, [Calibration] tab. Create, edit and remove Test Definitions using the Test Definition Editor. When the Test Editor is opened, the last accessed Test Definition is displayed. While in the Editor, use the Editor Toolbar options to create, edit, view and delete tests. The Test Definition Editor uses the same editing concepts as the DUT Editor. Only one Test Definition can be edited at a time. The test scroll bar and the Test Selector are available to make new test selections. A flashing indicator displays when a Test Definition is modified or a new definition is created. Refer to the Run Test section for an explanation of the standard GFS Tools algorithm for running tests. Familiarity with the steps of test execution steps is necessary to properly setup a Test Definition. Refer to the following sections for details on the selections in the Test Editor. Note The option to edit a Test Definition is available only when GFS Tools is not in an active run mode. 5.5.2.1 Creating test definitions Open the Test Editor using the [Setup], [Test] menu option. Use the Test Toolbar, [New] icon to create a new Test Definition. Set up the test as desired then press the [Save] icon to store the test information. Any conflicts that exist will cause an error message to display. Resolve the conflicts before re-saving. The [Restore] icon is nonfunctional for new tests. The feature only restores to the last saved state. Since new Test Definitions have not been saved, there is nothing to restore. Note • © 2011 Fluke Calibration Familiarity with test execution sequence is necessary for proper setup of a Test Definition. Review the Run Test Sequence section of this manual. Page 108 5. GFS TOOLS SOFTWARE • 5.5.2.2 If a Test Definition similar to the one to be created exists, use the [Copy] toolbar icon to copy the existing Test Definition into a new Test Definition with the same characteristics. Then make the edits specific to the new test. Don’t forget to change the <Record Label> prior to saving. Editing test definitions Edit test whenever GFS Tools is not in an active run mode. Use the [Setup], [Test] menu option to display the Test Editor if it is not already open. Simply changing information in the Test Editor places the Editor in the edit mode. No specific option need be selected to begin editing a Test Definition. Use the [Save] icon to store the edits or press the [Restore] icon to return the test to its original state. 5.5.2.3 Test Point Sequence The points table displays on the left panel of the point Test Definition Editor. Define up to 10 flow points in a single Test Definition. Use the [Data] tab to customize data collection and accumulation information for each flow point. Define up to 10 accumulations for each flow point. Note • Press the [Insert] button to insert a point in the test point sequence. Double click a point to remove it from the test point sequence. • Accumulation information for a flow point is defined on the [Data] tab. The [Data] tab displays accumulation information for the actively selected flow point. Figure 66. Test Definition Editor, Point Sequence 5.5.2.4 [Pre-Test] Tab The Test Editor, [Pre-Test] tab defines operations that occur before a test begins. The selections are intended to help ensure the validity of the data collected during the test (see Figure 66). Page 109 © 2011 Fluke Calibration GFS2102™ OPERATION AND MAINTENANCE MANUAL Note Familiarity with Run Test Sequence section of this manual is useful when modifying a Test Definition. The leak test, if included, attempts to determine if there is a leak in the system up to the flow isolation valve. Zero flow is set and a short dwell occurs to insure stability before the actual leak test time is invoked. The flow isolation valve, if activated in the [Setup][Configuration], is closed to isolate the flow. A GFS AutoZero occurs before and after the leak test to prevent any balance drift from effecting the leak test results. Note When running a test, use the [Skip Forward] toolbar icon to skip through pre-test operations. The purpose of the [Pre Test] tab’s fields and settings as well as instructions on how to use them are provided in the table below. Table 41. Test Editor, [Pre-Test] Tab, <Leak Test> Fields FIELD Test delayed start time (numeric entry field) Exercise GFS AMH during pre-test delay (check box selection) Run Leak Test (check box selection) Run leak test during test delay time DESCRIPTION Enter the time in minutes to delay before starting a test after test initialization is complete. Use this time to delay a test to allow a reference gas cylinder or a DUT to reach environmental equilibrium before starting at test. Check this option to cycle the AMH for the pre test time delay. If there is no pre-test time delay, this selection is ignored. Cycling the AMH is necessary after a reference gas cylinder is changed. The cycling process allows the reference gas cylinder to reach an equilibrium position. Running an AutoZero before the reference cylinder has reached an equilibrium position will result in faulty corrections. Determines whether a leak test will be run at the beginning of a test or not. If the option is checked, a leak test will be run. Otherwise, a leak test will not be run and the rest of the <Leak Test> operation options are disabled. See Section 4.4.4 for more information. Check this option to run the leak test portion of pre-test operations while the pre test delay is active. If the pre-test delay is longer than the leak test time, the additional pre-test delay is imposed after the leak test is completed. . (check box selection) <Abort Test On Failure (check box selection) Leak Test Time (numeric entry field) Maximum leak test flow (numeric entry field) © 2011 Fluke Calibration The selection determines whether test execution will continue if the leak test fails. If the option is not checked, the test will continue if the leak test fails and the failure will be indicated in the test Data File. Otherwise, the test will abort. This option is sometimes disabled when running fully automated, unattended tests to attempt to complete the test and gather test data even though the leak test failed. Of course, if the leak is too large, the test may yield invalid test data. Defines the amount of time over which the leak test measurements are made. The appropriate amount of time depends on the leak test flow and the test gas. The AutoZero corrected change in balance mass divided by this leak test time determine the leak test flow. See Section 4.4.4 for more information. Defines the leak test pass/fail criterion in the current test flow unit of measure. The value entered represents the maximum acceptable flow rate. If the change in AutoZero corrected mass divided by the leak test time represents a flow that exceeds the value entered, the leak test has failed. See Section 4.4.4 for more information. Page 110 5. GFS TOOLS SOFTWARE 5.5.2.5 [Control] The [Control] tab defines test operations specific to flow control. This includes defining the flow unit of measure, the flow controller and test control criteria. Figure 67. Test Definition Editor [Control] Tab Table 42. Test Definition Editor, Point Sequence Tab, [General] Child Tab Fields FEATURE DESCRIPTION Unit (required list box selection) Calibration Gas (required list box selection) Set (required list box selection) Hold Setting (numeric entry field) Select the unit of measure in which the points on the point sequence table are expressed. The choices include all points. Select the test gas that is actually flowed through the reference and the DUT when the DUT is tested. Select the test flow controller to associate with the test. The flow controller used for testing can be changed during test initialization. Defines how close to the target output the controller must be to yield a ready condition. Enter a 0 value to ignore the hold limit in the GFS ready criterion. The hold limit is always set in the selected Hold/Stability unit of measure. Set the hold setting to a flow deviation that is less than or equal to the overall test uncertainty that is expected. Stability Setting (numeric entry field) Defines how stable the target output of the controller must be to yield a ready condition. Enter a 0 value to ignore the stability limit in the GFS ready criterion. The stability limit is always set in the selected Hold/Stability unit of measure. Set the stability setting to a flow deviation that is less than or equal to the overall test uncertainty that is expected. Ready Hold Time (required numeric entry) Time duration that stability and hold criterion must be met for GFS Tools to consider that the stability test has been met. The ready condition must be present and uninterrupted for the duration of the Ready Hold Time. If a not ready condition occurs, the hold time countdown starts over after the next ready output is received. This process continues until either the stability test is passed or the <Control Timeout> occurs. Depending on the configuration of the test system and the performance of the controller, the output may stabilize within the stability test and a ready condition may occur momentarily before the output has truly stabilized. The ready hold time can be used to assure that the output remains stable for a certain amount of time before the stability test is considered to have been met and test execution to continue. Page 111 © 2011 Fluke Calibration GFS2102™ OPERATION AND MAINTENANCE MANUAL FEATURE DESCRIPTION Control Timeout (numeric entry field) Regulate (list box selection) Defines the amount of time in seconds before a timeout will occur if a Ready condition has not been achieved in response to a set command to an automated controller. If the controller is unable to set the test target and achieve a Ready condition within the timeout period, a <t> is logged in the <Status> column of the data run time test log and in the Data File and test execution proceeds to the dwell step for that point. The control timeout assures that a test will not hang up indefinitely waiting to achieve a Ready condition at a test point, however data taken after a control time-out is likely to be invalid. Set the control timeout to a value greater than the worst-case flow setting time of the controller. If flow control is <Manual> the control timeout is ignored. This feature is used to specify to what device’s reading the target should be adjusted when an automated controller is used in the test. The <Regulate> feature is ignored when the controller is manual.. The choices are: None GFS Tools calculates and sends the command for the target output to the controller and makes no further adjustments. In this case, how close the final value of a point is to the target value depends on the calibration of the controlling device. To DUT1 At each point in the test, GFS Tools continuously readjusts the set point command to the controller to adjust the output to the target value as indicated by the first DUT. To DUT2 At each point in the test, GFS Tools continuously readjusts the set point command to the controller to adjust the output to the target value as indicated by the second DUT. When only 1 DUT is tested, regulation defaults to DUT1 when DUT2 is selected. The regulation delay entry determines the time, in seconds, between regulation adjustment cycles. This is how often the set point is readjusted to get closer to the target value. Setting this value to a time value that is too short relative to the response time of the system results in unstable control. Dwell (required entry field and drop down list selection) Dwell is a pause that occurs following setting and prior to taking averaged test data at each point. When <Dwell> is set to <Timed>, GFS Tools dwells at each test point for the specified <Dwell Time>, 0 – 9999s. When <Dwell> is set to <Manual>, GFS Tools dwells at each test point until [OK] is clicked on the <Continue Test> pop-up. This feature can be used to synchronize readings or to pause operation when setting a test point. Note Enter a Dwell time of 0s to effectively skip the test dwell. 5.5.2.6 [Data] The [Data] tab is used to determine accumulation sampling, the number of accumulations and how data is logged to the data file. The display on the [Data] tab changes depending on the actively selected test flow point. Each flow point has a unique set of [Data] tab selections. Note The frame surrounding the [Data] tab includes the flow point that the [Data] tab currently represents. Click a different flow point to view [Data] tab selections specific to a new point. © 2011 Fluke Calibration Page 112 5. GFS TOOLS SOFTWARE Figure 68. Test Definition Editor [Data] Tab Note Only two of the three fields: <Starting Sample %Rdg Tolerance>, <Ending Sample %Rdg Tolerance>, and <Mass to Deplete> can be defined at a time. The information from two of the fields is used to calculate the third field. The calculated field displays with a gray background. User defined fields have a white background. Table 43. Test Definition Editor [Data] Tab Fields FEATURE Starting Sample %Rdg Tolerance (required numeric entry field) Ending Sample %Rdg Tolerance (required numeric entry field) Mass to Deplete (conditional numeric entry field) Averaging Time (required numeric entry field) DESCRIPTION Define the GFS tolerance at which flow sampling will begin. GFS Tools will automatically calculate the time to the first sample in the grey field to the right of this entry based upon the flow rate and selected gas. The value entered does not affect the <Mass to Deplete> field. An error value should be entered that results in a time that accounts for at least 10% of the <Ending Sample %Rdg Tolerance> time as data taken before that may have too little time or too little mass for GFS Tools to calculate an acceptable mass flow rate and could falsely bias the data collected. Define the GFS ending sample tolerance. The entry calculates the <Mass to Deplete> and time required to achieve the entered tolerance at the current flow rate. Alternately, the field is automatically calculated when a value is entered in the <Mass to Deplete> field. Define the mass to deplete for the current accumulation and flow rate. The field is automatically calculated when a value is entered in the <Ending Sample %Rdg Tolerance>, or will automatically calculate a new <Ending Sample %Rdg Tolerance> and time if a <Mass to Deplete> is manually entered Enter the averaging time to use for data collection. To take instantaneous data points enter 0 as the averaging time. Page 113 © 2011 Fluke Calibration GFS2102™ OPERATION AND MAINTENANCE MANUAL FEATURE DESCRIPTION Timed Point Interval (required numeric entry field) The time in seconds between collecting data according to the <Averaging time>. Use a timed point interval that is appropriate for the flow rate. A flow point that requires 5 hours should use an interval smaller than a test that will take 5 minutes. The approximate number of points logged in the data file per accumulation displays next to the timed point interval field. Make sure to increase the <Timed Point Interval> for lower flows to avoid having very large and unmanageable data files. The number of points can also be directly entered and this will automatically calculate a Timed Point Interval to achieve approximately that number of points. Note It is good practice to limit the number of points per accumulation regardless of the test flow rate. Approximately 200 points is recommended per accumulation. This helps to limit the overall file size and keeps file processing time to a minimum. Number of Accumulations The number of accumulations for the current flow rate. (required numeric entry field) Approximate Mass (numeric display field) 5.5.2.7 The approximate total mass to use for the current flow rate. The estimated total mass for the complete test displays at the top of the Test Definition Editor. [AutoZero] The [AutoZero] tab defines when an AutoZero or Balance Zero operation will take place. The choices on this tab take precedence over the [Tools][Options][Run Test] AutoZero selections. [AutoZero] tab selections affect all flow points defined in a test. Note Tests that define flow points with relatively short accumulations do not require frequent AutoZero operations. Under typical lab conditions an AutoZero should be performed every 5 minutes. Figure 69. Test Definition Editor [AutoZero] Tab © 2011 Fluke Calibration Page 114 5. GFS TOOLS SOFTWARE Table 44. Test Definition Editor [AutoZero] Tab Fields FEATURE Pre accumulation operation (required list selection) AutoZero at end of accumulation (check box) DESCRIPTION Select the AutoZero operation to perform before an accumulation begins. Determine the frequency to apply the operation by choosing one of the radio button options below the list box. • None - There are no specific zero operations performed when an accumulation begins. • AutoZero - The GFS AutoZero function is run before the accumulation begins. • Zero Balance - The balance is set to zero before the accumulation begins. • Apply to each accumulation – Each accumulation of each flow point will carry out the selected pre accumulation operation. • Apply to each flow point - Only the first accumulation of each flow point will carry out the selected pre accumulation operation. • Apply to first flow point - The first point of the test will carry out the selected pre accumulation operation. After the required accumulation mass is consumed, a final AutoZero is performed when this option is selected. The accumulation is forced to continue until at least one more sample from the GFS is taken. Do not use this option for long accumulations that may require a large correction. The resultant shift in data makes error plots created during the accumulation less useful. It is also makes it more difficult to troubleshoot problems. AutoZero at timed interval (check box) 5.5.2.8 Select this option to run the AutoZero at a timed interval. In typical laboratory environments, an AutoZero should run approximately every 5 minutes. This minimizes the absolute drift correction and provides a more continuous accumulation error plot. [Options] The [Options] tab provides features to further customize a Test Definition. The choices on this tab are not required for good test operation. Figure 70. Test Definition Editor [Options] Tab Page 115 © 2011 Fluke Calibration GFS2102™ OPERATION AND MAINTENANCE MANUAL Table 45. Test Definition Editor [Options] Tab Fields FEATURE DUT molbox Tare Options (optional list selection) Pause Flow Option (optional list selection) DESCRIPTION The selections in this list box apply only when at least one of the DUTs is a DH Instruments molbox1 or molbox RFM connected to a molbloc-L. The choice determines the frequency that a molbox is tared. A molbox tare at different flow points helps to reduce the offset in the differential pressure measurement used to determine flow (refer to the molbox1 operation and maintenance manual for details on taring a molbox). None - There are no specific zero operations performed when an accumulation begins. • Do not tare – No molbox tare operation is performed during the test. • Tare at each accumulation – Tare the DUT molbox1 prior to starting each accumulation of each flow point of the test. • Tare at each flow point - Tare the DUT molbox1 prior to the first accumulation of each flow point of the test. • Tare at the first flow point - Tare the DUT molbox1 at the first point of the test only. Select the Pause Flow Option to perform after an accumulation ends. The choice determines the frequency to apply the Pause Flow operation. • Pause after each accumulation – After each accumulation of each flow point the test will close the isolation valve and Pause the system for the specified time delay. • Pause after each flow point - After all of the accumulations of each flow point complete the test will close the isolation valve and Pause the system to the specified time delay. • Pause after first flow point - After all of the accumulations of the first point of the test will carry out the selected pre accumulation operation. • Never – The option will never activate. Flow Pause Time (min) – Numeric entry for the Pause time in minutes. Default Report Template (optional text entry) The report template to use for report generation immediately following the completion of a test. The template selected is used when the [Generate Report] button is pressed on the After Test dialog. Click the field to select a new report template. Right click the field to clear the selection. 5.5.2.9 [Comment] The [Comment] tab contains a single text box with a 255 character limit. The comment is intended to allow an operator to quickly determine special setup or use characteristics of a Test Definition. Enter any text desired to help to describe test specific requirements or selections. Figure 71. Test Definition Editor, [Comment] Tab © 2011 Fluke Calibration Page 116 5. GFS TOOLS SOFTWARE 5.5.3 [DUT ] Press the [Setup][DUT] menu choice to access the DUT Definition Editor. DUT definitions are used by GFS Tools to define the remote settings, range, tolerance and output relationship of a DUT. DUT definitions are selected during Test Initialization. The DUT Editor provides features to create, edit, view and remove DUT Definitions. When selected, the last accessed DUT Definition displays. To edit an existing DUT, use the Editor Toolbar features to select the desired DUT. Then simply edit the desired fields. Press the Editor Toolbar, [Save] icon to save the changes. Use the following steps to create a DUT Definition. Select [Setup], [DUT] Press the Editor Toolbar, [New] icon (see 5.5.1.2). Enter a <Record Label> that allows users to quickly identify the defined DUT. Begin completing the DUT Definition starting with the [Header] tab. Select a <Device Type> and a <Record Type>. Note DUTs can be defined as <Individual>, <Profile> and <Profile w/Range>. These selections allow an explicit DUT to be created including specific range and serial number information; or, a profile DUT that is identified during the test initialization process. Profile DUTs allow one DUT Definition to represent any number of like <Model> devices from the same <Manufacturer>. Select the <Manufacturer> and <Model> on the [Header] tab. Enter relevant information on the [Calibration] tab. Select the appropriate <Data Acquisition Type> and corresponding settings using the [Communications] tab. If a remote interface is specified for the DUT press the [Edit Commands] button to launch the Remote Command Editor (see 5.5.3.4). Enter the commands required to interface with the device. Select the [Output] tab and enter all relevant output and tolerance information. Press the Editor Toolbar, [Save] icon to save all changes. Any errors in the setup must be remedied before the DUT Definition can be saved. 5.5.3.1 [Header] Tab The information on this tab should be used to easily identify a GFS DUT Definition. Selections made on the [Header] tab can change the options on the remaining tabs of an Editor. For example, selecting <Autodetect Setup> hides the [Output] tab when a DH Instruments DUT is defined. Caution Do not use the following characters in any of the [Header] fields: \,/, :, *, ?, “, <,>, |, a comma or tab character. These characters will cause problems when importing the Data File or creating the Data File directory based on the data directory naming convention (see 5.4). Page 117 © 2011 Fluke Calibration GFS2102™ OPERATION AND MAINTENANCE MANUAL Figure 72. DUT Editor, [Header] Tab Table 46. DUT Editor, [Header] Tab Fields FEATURE Device Type (required drop down list selection; DUT Editor only) Record Type (required drop down list selection; DUT Editor only) Manufacturer (required drop down list selection) DESCRIPTION Determines if the DUT is also available for use as a flow controller. There are two choices: DUT Flow The DUT is used for flow measurement only. DUT Controller The DUT is available for flow measurement and can be selected as a flow controller during Test Initialization. There are three DUT Definition Record Types: Individual Intended for DUTs that are tested as specific, unique items. The DUT serial number, identification or customer ID is included in the DUT definition. This type of DUT does not require new entries during Test Initialization. Profile Intended to define a general DUT type rather than identifying a specific DUT. A common use of this option is for a type of analog output flow meter. Unique serial number, identification and customer ID values are not entered in the DUT Definition. Although range information must be specified, the <Min Final Output> and <Max Final Output> values can be altered during test initialization. This type of DUT Definition requires the DUT to be identified during Test Initialization. Profile w/Range Intended to define a general DUT type, including a specific range, rather than identifying a specific DUT. It is useful when identical DUTs are tested in groups. Instead of creating multiple DUTs all differing only by serial number and/or identification, use a DUT profile w/Range. Unique serial number, identification and customer ID values are not entered in the DUT Definition. This type of DUT Definition requires that the DUT be identified during Test Initialization. Range related information cannot be edited during Test Initialization. Select a manufacturer from the drop down list box or enter a new manufacturer into the field. Note Selecting a manufacturer from the list automatically updates k- factor information when applicable. When entering a new manufacturer make sure that the name is identical to what is entered in the Process Gas Editor. The default Data File directory naming preference can use DUT <Manufacturer> as part of the Data File directory structure. Model (required drop down list selection) © 2011 Fluke Calibration Select the <Model> from the drop down list or enter a <Model> into the field. The drop down list of <Models> is based on the currently selected <Manufacturer>. The default Data File directory naming preference can use DUT <Model> as part of the Data File directory structure. Page 118 5. GFS TOOLS SOFTWARE FEATURE Auto Detect Setup (conditional check box available for device editors only when the <Manufacturer> is Fluke Calibration and the <Model> is a known Fluke Calibration product) DESCRIPTION This feature is available for setups of Fluke Calibration products. Checking this option allows GFS Tools to use built-in device monitoring and control features. Read and Set information is not required. Do not check this box if you wish to manually define the remote setup of a DH Instruments product. Fluke Calibration products that use this feature display their output on Device Output Screens. Features to control, monitor and change the state of the device are provided. Checking this feature allows GFS Tools to send test initialization information to a device when initializing a test. This includes setting channel and range information as well as stability settings and units of measure. Note Check this option to use all of the advanced features of a Fluke Calibration product without the need to specify remote commands. Serial Number (optional text entry field) Type in the device serial number. The field can contain any combination of characters and numbers to represent a specific device. The value entered is included in the Test Data Files and can be included in reports. DUTs whose record type is <Profile> do not include a serial number in the DUT Editor. Instead, the serial number can be entered during test initialization. The default Data File directory naming preference can use the DUT <Serial Number> to create the data directory for date files when running tests. Identification (optional text entry field) Type in the device identification. The field can contain any combination of characters and numbers to represent a specific device. This field is frequently used to store internal tracking information for a specific device. The value entered is included in the Test Data Files and can be included in reports. DUTs whose record type is <Profile> do not include an identification field in the DUT Editor. Instead, the identification can be entered during test initialization. The default Data File directory naming preference can use the DUT <Identification> to create the data directory for data files when running tests. Customer ID (optional text entry field) Type in the device customer identification. The field can contain any combination of characters and numbers to represent a specific device. This field is frequently used to store customer specific product information. The value entered is included in the Test Data Files and can be included in reports. DUTs whose record type is <Profile> do not include a customer ID in the DUT Editor. Instead, the identification is entered during test initialization. The default Data File directory naming preference can use the DUT <Customer ID> to create the data directory for data files when running tests. 5.5.3.2 [Calibration] Tab The fields on the [Calibration] tab are used to include information specific to the device’s calibration in its definition. The information listed on this tab is available on reports. This section describes the [Calibration] tab features. The Feature column notes features that are not available in certain setup types. Note • All features on the [Calibration] tab are optional. The information is provided for calibration tracking. The last edit and the active user for the edit are always provided on this tab in the <Record Last Edited> and <Record Last Edited By> fields. • Use the <Calibration Setting> fields to store calibration settings for an instrument. Not only is this information available for reporting. The user controls the format and use of the data. Page 119 © 2011 Fluke Calibration GFS2102™ OPERATION AND MAINTENANCE MANUAL Figure 73. DUT Editor, [Calibration] Tab Table 47. Device Editor, [Calibration] Tab Fields FEATURE Calibration Date (optional calendar selection) DESCRIPTION Enter the calibration date of the instrument. In most cases, the date of the last calibration should be entered. The date is always formatted according to the host computer’s short date format selected in the Windows™ Control Panel under Regional Settings. Press the down arrow to select the date by using a calendar. Use the horizontal scroll bars to change months. Click the year at the top of the calendar to display a vertical scroll bar. Use this scroll bar to select the year. Figure 74. Date Selection Calibration Due Date Use the calendar selector to specify the next calibration date of the device. If this date is less than the current test date, GFS Tools considers the devices “out of calibration”. (optional calendar selection) Calibration Performed By Identify the user that performed the calibration of the device. (optional text entry) Certification ID (optional text entry) Calibration Setting1 (optional text/numeric entry) Calibration Setting2 Enter any relevant document tracking information associated with the <Calibration Date>. The information entered is available on calibration reports. Enter calibration coefficients or settings specific to the output of an instrument. The data can be text or numeric. There are no specific formatting requirements. The field is frequently used to store adder and multiplier values of a device. See <Calibration Setting1>. (optional text/numeric entry) © 2011 Fluke Calibration Page 120 5. GFS TOOLS SOFTWARE FEATURE Calibration Setting3 DESCRIPTION See <Calibration Setting1>. (optional text/numeric entry) Calibration Setting4 See <Calibration Setting1>. (optional text/numeric entry) Record Last Edited Date The date of the last edit of the device. This field is used for display purposes only. GFS Tools automatically updates this field when changes are saved. (display only) 5.5.3.3 [Communications] Tab Select the desired data acquisition type and enter the settings appropriate for the selection. By default, GFS Tools will perform all communications with the device following the data acquisition type specified. Automated remote interfaces such as IEEE-488 and RS232 require remote commands to be setup for each raw output or raw set of the device. To use GFS Tools features correctly, the [Communications] tab settings should always correspond to the actual output of the device, not of a support device that may be required. For example, for a DUT that outputs a voltage the remote interface of the DMM used to measure voltage should NOT be specified here. Rather, select <Other Device> for <Data Acquisition Type> of the DUT and setup the DMM separately using the Support Device Definition Editor. On the [Communications Tab] of the DMM’s setup, specify the remote interface to the DMM with a Final Output of Voltage. The DUT raw output source must be set to <Voltage Measurement>. When GFS Tools tests this DUT, it will identify it as having a voltage output and use the DMM to read the voltage. This implementation allows the DMM to be used at other times in GFS Tools to read voltage or other signals without redefining the remote interface for each use. It also simplifies changes related to the DMM since it only needs to be changed in its Support Device Definition, not for each DUT that uses it. There are occasions in which a support device is dedicated to a specific measurement or control device. For example, a DUT may be “married to” a specific signal conditioner. In this case, the signal conditioner can be considered part of the DUT included in the DUT Definition. Therefore, the remote commands for the conditioner should be specified with the DUT Definition. Figure 75. DUT Definition Editor [Communications] Tab Page 121 © 2011 Fluke Calibration GFS2102™ OPERATION AND MAINTENANCE MANUAL Table 48. Device Editor, [Communications] Tab Fields FEATURE DESCRIPTION Data Acquisition Type Defines how read and/or set values will be communicated to and/or from the device. Each choice requires unique settings to be entered. The available <Data Acquisition Types> are: (required drop down list selection) Manual Output values are entered manually by the operator and/or set values are executed manually by the operator. No further selections on the [Communications] tab are necessary. RS232 Read and/or set values will be communicated remotely using an RS232 interface. Settings specific to the RS232 interface must be complete on the tab. Remote commands to read and/or set with the device are setup on the [Output] and/or [Set] tabs. IEEE-488 Read and/or set values will be communicated remotely using an IEEE-488 interface. Remote commands to read and/or control with the device are setup on the [Output] and/or [Set] tabs. Remote commands to read and/or set with the device are setup on the [Output] and/or [Set] tabs. The active IEEE-488 interface card manufacturer is selected in [Setup][Configuration][Interface]. TCP/IP Read and/or set values will be communicated remotely using a TCP/IP interface. Remote commands to read and/or set with the device are setup on the [Output] Tab. Other Device A separate support device such as a DMM will be used to obtain the output of the device. No further selections on the [Communications] tab are necessary. Handshaking (conditional listbox selection) RS232 Port (button Option) RS232 Settings (button Option) Binary (conditional checkbox selection) Command Timeout(s) This feature is available for RS232 interfaces only. Select the devices handshaking protocol to use with the interface. Handshaking refers to the internal communications protocol by which data is transferred from the hardware port to the receive buffer. The default selection is <None>. This selection is valid for the majority of remote devices. None There is no RS232 handshaking required. RTS/CTS Request to Send/Clear To Send handshaking. XON/XOFF XON/XOFF Handshaking RTSXON/XOFF Both Request to Send/Clear To Send and XON/XOFF Handshaking RTS ON/OFF The PC RTS output is set to HIGH while sending data and set to low when the data transmission is complete. The RS232 port that the PC will use to communicate with the remote device. Change the selection by pressing the [Ports] button. Do not confuse this port selection with the ports available on a remote device. For example a PPC3 has a COM1 and a COM2 port. This port selection does not refer to either of these ports. It refers only to the port on the HOST PC that will be used to communicate with the PPC3. This option is available only when the <Data Acquisition Type> is RS232. The RS232 settings of the remote device. The value is listed as: Baud Rate, Parity, Data Bits and Stop Bits. The field must be set to the settings defined by the remote device. Refer to the device manual for information on how to obtain the proper RS232 settings. When incorrect settings are used, proper communication is not possible. Change the selection by pressing the [Ports] button. This option is available only when the <Data Acquisition Type> is RS232. This feature is available for RS232 interfaces only. Check this box when the RS232 instrument requires binary communications instead of ASCII based communications. Instruments that use non printable commands sets that include “check sums”, typically require this option to be checked. The maximum length of time for the device to wait for a response from a remote command. If a response is not received within this amount of time, a timeout occurs. (numeric entry; remote interface <Data Acquisition Type> only) © 2011 Fluke Calibration Page 122 5. GFS TOOLS SOFTWARE FEATURE DESCRIPTION Command Terminator (text entry/drop down list selection; remote interface <Data Acquisition Type> only) Response Terminator (text entry/drop down list selection; remote interface <Data Acquisition Type> only) Defines how the device terminates command strings. The selected (or entered) value is automatically appended to the end of every command issued. Make sure that the terminator is not also included in the remote command setup. The selections available from the drop down list are: <CR> Carriage return, ASCII character 13 <LF> Line feed, ASCII character 10 <CR><LF> Carriage return line feed, ASCII characters 13 and 10. This is the most common selection and is selected by default. Defines when GFS Tools will consider an individual response to be complete. This option is not available in IEEE-488 communications. With IEEE-488 there are hardware level assertions that define the end of a command and response. The selections available from the drop down list are: <CR> Carriage return, ASCII character 13 <LF> Line feed, ASCII character 10 <CR><LF> Carriage return line feed, ASCII characters 13 and 10. This is the most common selection and is selected by default. <CR>|<LF> Carriage return OR line feed must be detected in the device response. ASCII characters 13 or 10. ># Read at least “#” characters from the RS232 buffer before assuming the response is complete. No physical buffer limitations are imposed. When # characters are received from the remote device the response data is used by GFS Tools. This type of termination is useful when a final character is not used to mark the end of a response. <# GFS Tools limits the RS232 buffer to # characters. When the buffer is full the response is considered complete and the data in the buffer is used by GFS Tools. This type of termination is useful when the remote response is always a fixed number of characters. “” Delete all text in the field to not use a response terminator. Do not enter empty quotes. GFS Tools assumes that any response is complete when data has been retrieved from the remote device and new data is not received for 300ms. If no data is returned from the device a Timeout error occurs. This is really a safety feature, to prevent false device time-outs in the many devices that do not have a specific <Response Terminator>. 5.5.3.4 Remote Command Editor The remote command editor is used to define commands issued using a remote interface. All GFS Tools device definitions that use a remote interface, use the Remote Command Editor. There are two types of commands defined the Remote Command Editor: Read and Set. The key difference is that Read commands are issued continuously and Set commands are only used to set an output. To create a remote command set press the [Edit Commands] button on the [Communications] tab and use the following procedure: Use the Editor Toolbar, [New] icon to create a new command or select an existing command from the list of commands. Select the <Command Type> Initialization and Read for measurement based outputs or Set for controlling outputs. It is not necessary to use initialization commands. It depends on the requirements of the device Specify a <Command Number> to define the order in which the command will be issued. GFS Tools automatically adjusts the numbering order when the command set is saved. It is not necessary to remove gaps in the numbering sequence. Page 123 © 2011 Fluke Calibration GFS2102™ OPERATION AND MAINTENANCE MANUAL Enter the remote command to send to the instrument in the <Command> field. Use the <Delay After Command(s)> field if necessary to allow the command to complete a physical process prior to continuing with other commands. Check the <Read Response> option for commands that respond. Do not check this box if the instrument does not respond to the remote command. If the <Command> specifies the command to use for manipulation, check the <Process Response> option and select or enter the appropriate <Manipulate Response> field. Only one command can have the <Process Response> field specified in a command set. Save the command using the Editor Toolbar, [Save] icon. Repeat the process as necessary for as many commands as are required to control the device. Note Only one remote command can be edited at a time. Save changes to each command before attempting to edit a new command. Figure 76. Remote Command Editor 5.5.3.4.1 Initialization Commands Initialization commands are used to set a remote device to a known state. This can include setting a specific unit of measure, range information, clearing error buffers, etc. All commands entered are sent just one time during the Test Initialization. Responses to initialization commands are not used in any way. 5.5.3.4.2 Read output Commands Read commands are used to obtain an output from a remote device. When GFS Tools is in a run mode that uses the device, the read commands are constantly sent in order to provide real time updating of the device output. The faster the device responds, the faster the refresh rate on the run screens. For this reason, it is best to use the smallest number of commands possible to obtain the desired device response. Not limit is imposed on the number of commands that can be used in a command set. © 2011 Fluke Calibration Page 124 5. GFS TOOLS SOFTWARE Although, multiple commands can be issued as part of the read process, one command must be specified as the actual read command. This command, when formatted using the <Manipulate Response> criterion should yield an output value in the raw output measurement unit specified for the device. Refer to the device’s Operation and Maintenance Manual for details on remote commands. 5.5.3.4.3 Control Set Commands Set commands are used to stimulate an output in the device. The command set should generate an output in the <Final Output Unit> of the device. A voltage controller should use these commands to set a voltage in the controller’s <Final Output Unit> (typically V). GFS Tools automatically handles unit conversion between the required set unit and the current testing and display unit. As with Read command sets, multiple commands can be used. At least one command requires the <Process Set> selection. This selection combines the current remote command with a test set point to create the actual command to send to the instrument (see 5.5.3.4.4). Set commands typically have a command portion and a target portion. The command portion designates that a specific set point will occur and the target portion is the numerical set point value. The actual command and format are device specific, so refer to the device’s manual for command details. Since the target output will change based on test conditions, the required test command must vary to accommodate the new target. The <Process Set> selection tells GFS Tools how to adjust the command for a given set point. The most common choice is <Replace [x]>. This tells GFS Tools to substitute the current numerical set point in the <Final Output Unit> with the text “[x]”. Commands that require more significant manipulation are not supported by GFS Tools. For example, a molbox1 uses the command “VOUT=5” to set 5 V, assuming the molbox1 is already in voltage mode. The command “VOUT=2” is used to set 2 V. Substitution of the value after the equals sign with the desired target will yield the command necessary to send to the device. In this case create a command “VOUT=[x]” in the <Command> field and choose the <Replace [x]> option as the <Process Set> selection. Note All numeric targets are formatted for set commands according to the specified <Final Output Unit> and <Resolution>. The range of targets is limited to 10 % of the specified <Min Output> and <Max Output> values. 5.5.3.4.4 Editor Options The tables below describe the options available in the Remote Command Editor. Not all options are available in both Read and Set command sets. Note Options on the [Command] tab apply to the selected command in the <Commands> list only and not the entire command set and not just the selected command. Page 125 © 2011 Fluke Calibration GFS2102™ OPERATION AND MAINTENANCE MANUAL Table 49. Remote Command Editor, [Command] Tab Fields FRAME LABEL Commands (display list) Command Type (drop down list selection) DESCRIPTION List of all commands that are currently in the command set. Selecting a command in the list updates the editor for the current command selected. Only one command can be edited at a time. Use the [Save] toolbar option to save command changes. Determines the type of command to setup. A device that is used for measurement supports: Initialization and Read commands. A device that is used to control supports Initialization and Set commands. Initialization commands Sent one time during test initialization according to the <Command Number> value. Read commands Sent continuously so long as the device is active in a test. Set commands Command Number (drop down list selection) Command (text entry/drop down list) Sent only when a new target is requested by a Test Definition or via user interaction on the <Device Output> run screen (see 5.1.5.7). The numerical order in which commands are sent. Commands of the same type are sent according to their ascending <Command Number> order. All Initialization commands are issued followed by all Read or Set commands, depending on the Output Type. Enter the command text to use to send a command. Do not include a command terminator for the remote command if a <Command Terminator> value is specified in the remote interface setup of the device (see 5.5.3.3). A mechanism is provided to send specific data bytes to a device. Enter the text “BYTE:=” followed by a series a data bytes (0 – 255) separated by spaces. The numeric values are converted to a sequence of characters and sent to the remote device. Make sure that decimal values are entered and not hex (255 not FF). For example, enter the command “BYTE:= 2 27” to send the characters 2 and 27 (Hex 02, 1B). Most devices that require specific byte data in this way do not use command or response terminators. Delay After Command (numeric entry) Enter the length of time to suspend remote interaction with the device after the COMMAND is issued. A delay is typically used to allow a physical process to complete between commands. The delay can also be used to allow an internal device average to complete prior to requesting an output. For example a DMM may use 3 commands to read a specific output: “INIT:VOLTAGE:DC 0.001”, “TRIGGER”, “FETCH?”. The “TRIGGER” command initiates an internal averaging cycle that is setup on the DMM front panel. If the average were 5s, the “FETCH?” command will take 5s to respond. Opposed to polling the IEEE bus for 5s, a delay of 5s after the “TRIGGER” command will allow a more response DUT remote interface. Read Response (check box) Check this box to poll the remote interface until the response of the device is returned. If the device does not respond or the device will continue to function properly when the response is not read, do not check this option. When checked, a response is considered complete when the <Response Terminator> character(s) is returned. If a response is not complete within the <Command Timeout> interval, the response is considered to have “Timed Out”. Process Response (check box used for Read Command Sets only) This option is valid for Read commands that have the <Read Response> option checked. Check this value when a formatted response to this <Command> will yield device <Raw Output> value in the <Raw Output Unit>. This output is manipulated according to the range setup to yield a <Final Output>. Only one command in a Read Command Set can use this option. Process Set (check box used for Set Command Sets only) © 2011 Fluke Calibration This option is valid for Set commands only. Check this value when the command in edit should be combined with the current target output to form the final command. The <Apply Set> option determines how this manipulation is handle . Page 126 5. GFS TOOLS SOFTWARE FRAME LABEL DESCRIPTION Manipulate Response (text entry/drop down list. Read Command Sets only) Applies only to commands with <Process Response> checked. Text entered is used to allow GFS Tools to properly interpret the output when the response does not start with the output value. This field can include any combination of delimiters and numerical space values. For example, a device might return the string, “Pressure:4.343 psi”. The actual output value for this example appears at position 10. Therefore, 9 leading characters need to be stripped prior to processing the string. Alternatively, if the colon following “Pressure” will always appear prior to the pressure value, “:” could be entered as the leading character to strip. In some cases both a delimiter and a number of characters to strip may be required. For example, if a remote device returns “Range 1, 4.34 volts, NR 4.431 psi”, the number of characters in the volts output can change making it impossible to use a fixed length value for the number of spaces to remove to access the pressure value. To avoid this problem enter the text <,,4>. This tells GFS Tools to move to the second comma, then increment four spaces to read the pressure output value. Note Only non-numeric text can be used as a delimiter in the leading characters to strip field. All numerical entries are assumed to represent the corresponding numerical value. Apply Set (drop down list selection Set Command Sets only) Determines how a set command with the <Process Set> option checked will be combined with the current target output to yield the final set command. There are 2 choices: Automatic GFS Tools takes no special action on the command. The exact value specified in the <Command> field is sent to the remote device regardless of the set point. Use this choice with controlling devices that have a pre-programmed sequence of targets that correspond to Test Definition targets. No regulation option is valid when this selection. The <Command> should move to the next step in the pre-programmed sequence of steps. Replace[x] GFS Tools replaces the text [x] with the numeric target output in the <Final Set Unit> of the device. Note Options on the [Global Settings] tab apply to the entire command set and not just the selected command. Table 50. Remote Command Editor, [Global Settings] Tab Options FRAME LABEL Use Multiplexer (dropdown list) DESCRIPTION Determines the association of a remote command set to the state of a multiplexer. This feature is commonly used for DMMs that will be multiplexed to read several DUTs at the same time. The choices are: Always During test initialization, the device must specify a multiplexer to use and corresponding multiplexer channel Sometimes An option to use a multiplexer is provided during test initialization. The selection is not necessary. Never There is no choice to use a multiplexer during test initialization. If a multiplexer is used, GFS Tools sends the remote commands to activate the desired channel on the multiplexer, then issues the appropriate read command on all devices that use that channel. This process is repeated for all channels specified for use during test initialization. Poll Frequency (ms) (numeric entry) Specifies the delay interval between sending consecutive command sets. Typically this value is 0. This allows GFS Tools to send commands in a loop to the remote device as fast as possible. In some cases this is not desired. Particularly, when an interface is shared. Shared interfaces use the same remote resources. If a faster refresh rate on one output is more desirable relative to another one, increase the delay interval to slow down the less desirable command. Page 127 © 2011 Fluke Calibration GFS2102™ OPERATION AND MAINTENANCE MANUAL 5.5.3.5 [Output] Tab The [Output] tab is used to define the relationship between the raw output of a device and the final output. The tab is contains 3 frames: Raw Output, Final Output, and Tolerance. A selection is required on each frame. The caption on the Final Output frame changes based on the <Device Type> selection on the [Header] tab. The <Unit> list also adapts to include units of measure relative to the selected <Device Type>. Note The [Output] tab is not available or required when a DH Instruments device is setup with the <Auto detect Setup> option checked on the [Header] tab. Figure 77. DUT Device Edit [Output] Tab A linear relationship is assumed between the raw output and the final output. To determine a final output from a given raw output, the raw output is converted to a percentage of the raw output span. This percentage is applied to the final output span to obtain the final output. Many mass flow instruments that have an analog output (V, mA) use this type of linear scaling. For example, 0 – 5V raw output corresponds to 0 to 100 [email protected] final output. O − Omin FFinal = FSpan Raw O Span VARIABLE + Fmin DESCRIPTION FFiinal Calculated final output in the <Final Output> unit. FSpan Final output span in the final output unit. ORaw Un-manipulated raw output as entered or measured remotely. Omin The minimum raw output in the raw output unit. OSpan The raw output span in the raw output unit. Fmin The minimum final output in the final output unit. Starting with the Raw Output frame, select the <Output Type> and corresponding unit of measure. The <Output Type> is a broad classification of outputs that determines the fundamental output of the device. The selection specifies the <Raw Output> as a flow, current, voltage, etc. The unit of measure specified is the unit in which the <Raw Output> must be acquired by the © 2011 Fluke Calibration Page 128 5. GFS TOOLS SOFTWARE selected <Data Acquisition Type> on the [Communications] tab. This is the <Raw Output Unit>. If the desired raw output unit is not available, directly type in the output unit. Note When the selected <Output Type> is the same as the <Device Type> on the [Header] tab, the entries on the Final Output Frame are disabled. In this case, GFS Tools assumes that no scaling is required between the raw output and final output. If necessary, GFS Tools will automatically perform a unit conversion when running a test definition. Enter the <Minimum> and <Maximum> output values. This determines the raw output span. Depending on the <Raw Output to Final Output Relationship>, the values entered may be used to determine the final output. In some cases, the actual <Minimum> and <Maximum> entries are not relevant. For example, when setting up a resistance output of a DMM, the raw output and final output typically have a relationship of <Same>. Therefore, no manipulation between raw output and final output occurs. As a result, there is no need to enter a specific resistance range. The only restriction is that the entries are not the same to avoid a span of 0. Select the <Resolution> to use when displaying, logging and reporting the raw output. Use a resolution appropriate for the device and its tolerance. On the Final Output frame, select the <Unit> in which the final output is defined. GFS Tools automatically converts from this output unit of measure to any required display or test unit of measure. The unit must be selected from the list of available choices. If a flow unit is not in the list select the [Tool][Unit of Measure Converter] menu choice to activate the Unit of Measure Converter. This tool provides features to create custom flow units. Enter the <Minimum> and <Maximum> output values. These determine the span and full scale of the final output. Select the <Resolution> to apply to the Final Output. The selection determines the resolution with which the final output is displayed and logged in the test Data File. Use a resolution appropriate for the device and its tolerance. Select a Tolerance frame tolerance option that represents the uncertainty of the device. Table 51. DUT Editor, [Output] Tab Fields FEATURE Output Type (required drop down list selection) Raw Output Unit (required text entry/list selection) Minimum (conditional numeric entry) DESCRIPTION Select the output type of the numeric output of the raw output. This selection describes the general type of the output. The choice updates the available units of measure and <Output Source> selections for the raw output. Select or enter the unit of measure in which the raw output will be obtained. When manually entering the raw output, or using remote commands to read the raw output, the values must be acquired in the unit specified in this field. Enter the minimum raw output or final output value. The value entered must correspond to the output unit selected. Page 129 © 2011 Fluke Calibration GFS2102™ OPERATION AND MAINTENANCE MANUAL FEATURE DESCRIPTION Maximum (conditional numeric entry) Resolution (required list box selection) Final Output Unit (required text entry/list selection) Tolerance Enter the maximum raw output or final output value. The value entered must correspond to the output unit selected. Set the resolution with which the <Minimum> and <Maximum> output entries display. This selection also determines the default resolution used in the run screens, logged to data files and reports. Select the unit of measure in which the Final Output is defined. GFS Tools automatically converts this unit to the required test or display unit when running a test. Select a tolerance definition that best represents the uncertainty of the device. Refer to Table 52 for details on the tolerance selections. Maximum Enter the maximum final output in the specified <Final Output Unit>. (conditional numeric entry) Resolution (required list box selection) Set the resolution with which the <Minimum> and <Maximum> output entries display. This selection also determines the default resolution with which this final output is displayed and logged. Table 52. Tolerance Type Choices TOLERANCE TYPE %Reading DESCRIPTION The tolerance is calculated as the current reading of the output times the tolerance value. This tolerance is not defined at zero. Never use a %Reading tolerance when the output will reach 0. In this case, use a compound tolerance such as %Span + %Reading. Figure 78. %Reading Tolerance %Span The tolerance is a constant value calculated as the final output span times the tolerance value. Figure 79. %Span Tolerance %FS © 2011 Fluke Calibration The tolerance is a constant value calculated as the <Maximum> final output times the tolerance value. This tolerance is graphically equivalent to %Span. Const in Final Unit The tolerance is a constant value entered in terms of the final output unit of measure. This tolerance is graphically equivalent to %Span. Const in Raw Unit The tolerance is a constant value entered in terms of the raw output unit of measure. This tolerance is graphically equivalent to %Span. Page 130 5. GFS TOOLS SOFTWARE TOLERANCE TYPE %Span or %Reading (greater of) DESCRIPTION The tolerance is calculated at each point as both %Span and %Reading. The tolerance used is the greater of the two. Figure 80. %Span or %Reading (Greater of) %FS or %Reading (greater of) The tolerance is calculated at each point as both %FS and %Reading. The tolerance used is the greater of the two. This tolerance is graphically equivalent to %Span or %Reading (greater of). Const in Final Unit or %Reading (greater of) The %Reading tolerance is calculated at each point and compared to the const tolerance value. The tolerance used is the greater of the two. This tolerance is graphically equivalent to %Span or %Reading (greater of). %Span + %Reading The tolerance is calculated at each point as both %Span and %Reading. The tolerance used is the sum of the two. Figure 81. %Span + %Reading %FS + %Reading The tolerance is calculated at each point as both %FS and %Reading. Tolerance used is the sum of the two. This tolerance is graphically equivalent to %Span + %Reading. Const in Final Unit + %Reading The %Reading tolerance is calculated at each point and compared to the constant tolerance value. The tolerance used is the greater of the two. This tolerance is graphically equivalent to %Span + %Reading. Const in Raw Unit + %Reading The %Reading tolerance is calculated at each point and added to the const tolerance value. This tolerance is graphically equivalent to %Span + %Reading. No Tolerance Specification 5.5.3.6 There is no tolerance specification. [Comment] Tab The [Comment] tab contains a single text box with a 255 character limit. The comment is intended to allow an operator to quickly determine special setup or use characteristics of a Device Definition. Enter any text desired to help to describe test specific requirements or selections. Page 131 © 2011 Fluke Calibration GFS2102™ OPERATION AND MAINTENANCE MANUAL Figure 82. DUT Device Edit [Comment] Tab 5.5.4 [Support Hardware] The [Support Hardware] menu choice accesses the Support Device Editor. All devices that are not specifically DUTs are considered support devices. Support devices are typically flow controllers and analog power/control instruments. These instruments are the Output Source of DUTs that have a voltage output or MFCs that require an analog set point. The Support Device Editor provides features to create, edit, view and remove Support Device Definitions. When selected, the last accessed Support Device Definition displays. To edit an existing Support Device Definition, use the Editor Toolbar icons to select the desired definition. Then simply edit the desired fields. Press the Editor Toolbar, [Save] icon to save the changes. Note Support Device Definitions are defined and maintained in the same manner as DUT Definitions (see 5.5.3). This editor is functionally identical to the DUT Definition Editor accessed using the [Setup][DUT] menu choice. The only difference is that the list of <Device Type> options is different. Table 53. Device Type Options DEVICE TYPE Current Measurement Current Control Voltage Measurement Voltage Control Flow 5.5.5 USE The device is used to measure current (Amperes) for a DUT. The device is used to control current for a flow controller. The device is used to measure voltage for a DUT. The device is used to control voltage for a flow controller. The device is used to control flow for a test. [Reference Gas Cylinder] Reference gas cylinders are added and removed by using the [Setup][Reference Gas Cylinder] menu choice. This menu evokes the Reference Cylinder Editor. The basic editing process is similar to other editors in GFS Tools. The actual cylinder to use during a test is selected during Test Initialization. Refer to section 5.7.5 for details on the math associate with buoyancy corrections applied to the reference gas cylinder. © 2011 Fluke Calibration Page 132 5. GFS TOOLS SOFTWARE Figure 83. Reference Cylinder Editor Table 54. Reference Cylinder Editor Fields FEATURE DESCRIPTION Record Label Name by which the cylinder is associated. Manufacturer The reference cylinder manufacturer. (required text entry) Model The reference gas cylinder model number. (required text entry) Serial Number The reference gas cylinder serial number. (optional text entry field) Identification The reference gas cylinder identification. (optional text entry field) Record Last Edited The date and time of the last saved change associated with the active reference gas cylinder. Mass of evacuated cylinder assembly The mass of the vacuum evacuated cylinder with all fixed regulators removed. The value is used to determine the amount of a given gas that is in the cylinder when running. (required numeric entry) Internal volume of cylinder The volume internal to the cylinder. The value is used to determine the pressure of the gas within the cylinder. (required numeric entry) External volume of cylinder The external volume of the reference gas cylinder excluding the volume of fixed regulators and accessories. (required numeric entry) Page 133 © 2011 Fluke Calibration GFS2102™ OPERATION AND MAINTENANCE MANUAL FEATURE External volume of cylinder accessories DESCRIPTION The external volume of the accessories connected to the reference gas cylinder. (required numeric entry) Linear thermal expansion coefficient Temperature distortion coefficient per degree Celsius. A fixed exponent of 1E-6 is applied to the value entered. (required numeric entry) Volumetric Pressure expansion coefficient Pressure distortion coefficient of the cylinder in m3 per MPa (required numeric entry) λ (/MPa) 5.5.6 [Configuration] The [Setup][Configuration] menu choice activates the GFS Configuration dialog. This form is used to configure internal GFS functions and communications settings. Typically options on this form are changed when the system is idle and not running a test. However many options changed when running a test take place immediately. Note Press [Default] on any of the tabs to return to the active tab to the default condition. 5.5.6.1 [System] The [System] tab defines options related to GFS operation and sampling. Figure 84. GFS Configuration [System] Tab © 2011 Fluke Calibration Page 134 5. GFS TOOLS SOFTWARE Table 55. GFS Configuration Editor [System] Tab Fields FEATURE Output display refresh rate (ms) DESCRIPTION The time in milliseconds between screen updates on the GFS run display. Using a time gap between display updates helps to minimize system flicker at higher flow rates. (required numeric entry) Balance RS232 poll interval (ms) The time in milliseconds between LCM balance samples. The LCM sends commands to read the balance at the time interval regardless of the flow rate or other sampling criteria. (required numeric entry) 100ms is the recommended setting. Do not enter a value below 100ms, the LCM is not capable of sampling faster than this. Minimum mass change per GFS sample Indicates the minimum change in the balance indication at a given flow rate required for a GFS sample. The limit allows GFS Tools to automatically limit the number of samples as the flow rate changes. At very low flow it is not possible to distinguish between short term drift of the balance and an actual mass change as a result of flow. For this reason it is important to take samples only when a change in mass should have occurred as a result in change in flow. (required numeric entry) Since all samples are logged in the SDF file, the value entered determines the approximate number of samples logged in the file. For example a flow rate of 10 [email protected] requires 5s to deplete 0.001g of N2. A minimum mass change entry of 0.002 results in a GFS sample every 10s. A value of 0.001g causes a flow rate of 1 slm to result in a GFS sample every 0.005s, but with the <Balance RS232 poll interval> set to 100ms would limit this to a sample every 0.1s. If the sample time is less than the <Balance RS232 poll interval> a sample is taken with every balance update. (see section 5.7.11, Sample Rate) Number of rolling average flow samples The number of flow samples to include in the rolling average flow of the GFS. The samples are added to the rolling average at the rate determined by the <Minimum mass change per GFS sample> entry. (required numeric entry) Enter 1 to disable the rolling average flow. In this case the <Flow> and the <Rolling Avg Flow> on the GFS Diagnostics run screen are the same. Number of GFS samples per rolling mass best fit The number of GFS samples to include in the rolling mass best fit of the GFS. After the defined number of samples are taken, each new balance sample causes the end balance sample to be removed from the fit. (required numeric entry) Enter 1 to disable the rolling average (not recommended). In this case the software will use instantaneous mass values instead of predicted values. Maximum number of balance samples in rolling mass fit This is a legacy setting that is no longer used by the system, it has been superseded by the "Number of GFS samples per rolling mass best fit" setting. (entry not needed) Automate external isolation valve (required check box selection) Select this option to use the LCM driver 4 to automate the flow isolation valve. The isolation valve is located in the GFS sidewall column between the GFS Reference Gas Cylinder and the connection to the DUT. GFS Tools activates this valve to force zero flow for leak test and when a test is complete. Page 135 © 2011 Fluke Calibration GFS2102™ OPERATION AND MAINTENANCE MANUAL 5.5.6.2 GFS AMH The [GFS AMH] tab defines criteria related to changing AMH states. Figure 85. GFS Configuration [GFS AMH] Tab Table 56. GFS Configuration Editor [GFS AMH] Tab Fields FEATURE Mass averaging time (s) (required numeric entry) Mass stability limit(g) (required numeric entry) Rotation interval (s) DESCRIPTION The time in seconds used to average the balance when performing a balance zero or when running AutoZero. Indicates the maximum allowable change in the balance during the stability test. The balance stability test requires that the change in 5 consecutive balance measurements is less than the value entered. The minimum time in seconds required for cam rotation to change states on the AMH. (required numeric entry) Reference gas cylinder stability time(s) (required numeric entry) Maximum change in flow after AMH change (%Rdg) (required numeric entry) Maximum change in indicated mass after AMH change(g) (required numeric entry) © 2011 Fluke Calibration The delay time imposed after the reference gas cylinder is loaded onto the balance after a Balance Zero or AutoZero operation. When a flow rate is set, no stability criteria can be applied to the reference cylinder state of the AMH as it is constantly changing mass. As a result a fixed delay is used to wait for system stability. Enter the %reading error that constitutes the maximum acceptable change in perceived GFS flow before and after an AutoZero. If the change in flow exceeds this limit the AMH is cycled and the reference gas cylinder is lowered again. This protection is provided for the occasions in which the AMH is out of alignment and a stable value cannot be read from the balance. Enter the maximum acceptable change in mass before and after an AutoZero. If the change in mass exceeds this limit the AMH is cycled and the reference gas cylinder is lowered again. This limit is imposed when running an AutoZero while not flowing. This protection is provided for the occasions in which the AMH is out of alignment and a stable value cannot be read from the balance. Page 136 5. GFS TOOLS SOFTWARE 5.5.6.3 [limits] Figure 86. GFS Configuration [Limits] Tab Table 57. GFS Configuration Editor [Limits] Tab Fields FEATURE Balance PRT Auto Zero Limit (C) (required numeric entry) DESCRIPTION The maximum change in temperature since the last Auto Zero. If the change in temperature exceeds the limit, a warning message displays on the status bar and a “Z” displays in the ready indicator on the GFS Run Screen. Caution Change in temperature has a significant impact on zero drift. A significant change the balance PRT temperature over the course of one accumulation can result in faulty GFS flow values. Higher flow rates (greater than 3 slm) are not impacted as much as lower flow rates. Maximum balance PRT temperature rate(C/m) (required numeric entry) Maximum cylinder probe temperature offset (C) (required numeric entry) Dew Point temperature offset (C) (required numeric entry) Indicates the maximum allowable change in the balance PRT in °C per minute. The balance is sensitive to rapid changes in temperature. If the temperature rate of change exceeds the limit, a warning message displays on the status bar and a “C” displays in the ready indicator on the GFS Run Screen (see 5.1.5.2.1, GFS Control Panel). System operation should be suspended until the rate of change limit is met. Define the maximum acceptable difference between the temperature measurements of TH Probe 3 and TH Probe 2. If the temperatures difference is more than the defined value, a “P” displays in the ready indicator on the GFS Run Screen. A significant difference between the probes represents a calibration offset or a significant temperature fluctuation. Both issues can effect the GFS flow determination. The dew point displayed on the GFS Diagnostics Run Screen is an estimate of the temperature at which water vapor will form on the reference gas cylinder. Since the dew point is only an estimate it is important to mark data collected starting at a safe distance above the calculated value to avoid or filter erroneous data. Enter a temperature value that represents how close to the dew point temperature that the reference gas cylinder can approach. When the reference gas cylinder temperature decreases beyond this limit relative to the dew point temperature, a “D” displays in the ready indicator on the GFS Run Screen and is logged to the status column in the data file. Page 137 © 2011 Fluke Calibration GFS2102™ OPERATION AND MAINTENANCE MANUAL FEATURE Maximum balance sample correction (g) (required numeric entry) DESCRIPTION Based upon the Number of GFS samples per rolling mass best fit from the Configuration [System] tab, the GFS program will use a rolling mass best fit to correct what each consecutive mass value should be and will use that mass value for the mass flow calculation. If the difference between the corrected mass value and the instantaneous mass value is greater than the maximum balance sample correction, the corrected mass value will be ignored and the instantaneous mass value will be used. A value of 0.006g is recommended to accommodate both low and high flow corrections. Abort accumulation pressure limit (MPa) (required numeric entry) 5.5.6.4 If during an accumulation the calculated cylinder pressure drops below this value the system will automatically stop the current accumulation/test and return to idle mode to prevent the reference gas cylinder from running out of sample gas. For most gases a 0.7 MPa limit is recommended, but if a lower pressure gas such as Sulfur Hexafluoride is used a lower limit can be entered. [LCM] Figure 87. GFS Configuration [LCM] Tab Table 58. GFS Configuration Editor [LCM] Tab Fields FEATURE DESCRIPTION Manufacturer (fixed value) Model The LCM is an integrated piece of GFS equipment manufactured by DH Instruments. The Manufacturer is fixed as “DH Instruments”. The laboratory conditions monitor model, LCM. (Optional alphanumeric entry) Serial Number The LCM serial number. (Optional alphanumeric entry) Identification Other identification of the LCM, such as customer equipment numbers. (Optional alphanumeric entry) © 2011 Fluke Calibration Page 138 5. GFS TOOLS SOFTWARE FEATURE Tolerance [Time (s)] DESCRIPTION The expected fixed time uncertainty in seconds, typical default value 0.002 seconds. The value is used to determine the starting and ending GFS tolerance values (see section 5.7.10, %Reading GFS Tolerance). (Required numeric entry) Caution Tolerance values are not intended to represent the final GFS uncertainty. The calculated value provides an estimate of uncertainty improvement over time. The values are used as a convenient scaling mechanism for starting and stopping GFS accumulation sampling. Tolerance (PPM Rdg) (Required numeric entry) RS232 Interface (Required interface setting) The expected time uncertainty in PPM of the current elapsed time value. The value is used to determine the starting and ending GFS tolerance values. Typical LCM time measurement uncertainty is 32ppm as shown on an LCM calibration report. The RS232 interface setting between the LCM and the System Controller. The default RS232 settings for the LCM is 19200, N, 8, 1. It is recommended to use COM1 of the System Controller for the LCM. Double-clicking this field brings up the interface settings window (Figure 88). Figure 88. Remote interface settings window 5.5.6.5 [Balance] Figure 89. GFS Configuration [Balance] Tab Page 139 © 2011 Fluke Calibration GFS2102™ OPERATION AND MAINTENANCE MANUAL Table 59. GFS Configuration Editor [Balance] Tab FEATURE DESCRIPTION Manufacturer Model At this time the only supported balance manufacturer is Mettler. The balance model number, i.e. “XP2004S” (Optional alphanumeric entry) Serial Number The balance serial number. (Optional alphanumeric entry) Identification Other identification of the Balance, such as customer equipment numbers. (Optional alphanumeric entry) Mass Tolerance (g) (Required numeric entry) The expected fixed mass uncertainty in grams, typical default value 0.003g based upon the GFS uncertainty analysis. The value is used to determine the starting and ending GFS tolerance values (see section 5.7.10, %Reading GFS Tolerance). Caution Tolerance values are not intended to represent the final GFS uncertainty. The calculated value provides an estimate of uncertainty improvement over time. The values are used as a convenient scaling mechanism for starting and stopping GFS accumulation sampling. Tolerance (PPM Rdg) (Required numeric entry) RS232 Interface (Required interface setting) 5.5.6.6 The expected mass uncertainty in PPM of the current mass reading. The value is used to determine the starting and ending GFS tolerance values. Typical default value is 10 PPM. The RS232 setting of the balance. It is required to use the LCM COM2 port to interface with the balance. The LCM COM2 selection provides consistent time stamped mass readings. The default RS232 settings for the balance are 19200,N,8,1. Double-clicking this field brings up the interface settings window (Figure 88). [Interface] Figure 90. GFS Configuration [Interface] Tab © 2011 Fluke Calibration Page 140 5. GFS TOOLS SOFTWARE Table 60. GFS Configuration Editor [Interface] Tab Fields FEATURE IEEE-488 Card (required drop down list selection) IEEE-488 Card Address (Required alphanumeric entry) Only support detected RS232 ports (required check box selection) 5.5.7 DESCRIPTION Select the manufacturer of the IEEE-488 card that COMPASS will use for IEEE-488 communications. If IEEE-488 communications will not be used, no selection is required. COMPASS supports National Instruments and CEC Capitol Equipment Corp IEEE488 interfaces. This field represents the address of the IEEE-488 card itself and not any specific device. Refer to the card manufacturer documentation to determine how to change the address in the card when necessary. By default, National Instruments cards used "GPIB0" and CEC cards use "21". GFS Tools automatically detects the RS232 ports on a host PC. However, some third party extended RS232 port cards may not be properly detected. As a result, the expected RS232 port will not be available in the RS232 setup. If this is the case uncheck this option to list serial ports 1-255 when selecting available com ports. [Calibration] 5.5.7.1 [TIME/MASS] Figure 91. Calibration [Time/Mass] Tab Page 141 © 2011 Fluke Calibration GFS2102™ OPERATION AND MAINTENANCE MANUAL Table 61. Calibration Editor [Time/Mass] Tab Fields FEATURE DESCRIPTION Reference Mass (g) The calibrated true mass value of the Reference Mass in grams. (Required numeric entry field) Reference Mass density (Required numeric entry field) Mass span multiplier (Required numeric entry field) The Reference Mass material density used in the calibration to determine the buoyancy corrected true mass value. The mass balance span correction multiplier to correct for a variation in the slope of the balance readings. Although this number can be manually calculated and entered, it is recommended to run the Balance Zero and Span function in Section 7.8.2 to automatically calculate and apply the multiplier. This multiplier has a default value of 1 for no correction. If the internal balance calibration is run this number must be reset back to 1 or the Balance Zero and Span function must be rerun or errors in the mass reading will occur, degrading the overall accuracy of the GFS system. PC clock time span multiplier (Required numeric entry field) The PC clock time span correction multiplier to correct for the variation of time of the System Controller (PC) from the calibrated LCM time. Although this number can be manually calculated and entered, it is recommended to run the PC Timer Calibration function in Section 7.2 to automatically calculate and apply the multiplier. This multiplier has a default value of 1 for no correction. LCM timer pre-scale coefficient (Required numeric entry field) The pre-scale coefficient used by the LCM to adjust the internal 15.359 MHz crystal frequency to calibrate the 1000 Hz counter used for GFS time functions. The default value of this coefficient is 15359. In the unlikely event that this value ever needs adjustment, adjustments greater than one count should be regarded with skepticism. See Section 7.5.3.3 for instruction on adjusting this value. 5.5.7.2 [AMBIENT] Figure 92. Calibration [Ambient] Tab © 2011 Fluke Calibration Page 142 5. GFS TOOLS SOFTWARE Table 62. Calibration Editor [Ambient] Tab Fields FEATURE DESCRIPTION Ambient Pressure Calibration Adder – The Ambient Pressure calibration offset correction adder in Pascal. The Default value is 0. (Required numeric entry fields) Multiplier – The Ambient Pressure calibration slope correction multiplier (no unit). The Default value is 1. Calibration Date – Automatically updates to the date a new adder or multiplier are entered in the above fields and written to the LCM. See Section 7.5.4.2 for instructions on LCM Ambient Pressure calibration PRT/Humidity Serial Number [LCM version dependent] This field will not display if the LCM version does not contain this sensor. The serial number of the internal Ambient Temperature/Humidity board for information purposes only, not user adjustable. (Fixed numeric field) PRT Temperature Calibration [LCM version dependent] This field will not display if the LCM version does not contain this sensor. (Required numeric entry fields) Slope – The Ambient Temperature PRT slope correction in Ohms per degree Celsius. Resistance at 0°C (ohms) – The Ambient Temperature PRT resistance in Ohms at zero degrees Celsius. Calibration Date – Automatically updates to the date a new Resistance or Slope are entered in the above fields and written to the LCM. See Section 7.5.4.3 for instructions on LCM Ambient Temperature calibration. Humidity Calibration [LCM version dependent] This field will not display if the LCM version does not contain this sensor. Adder – The Ambient Humidity calibration offset correction adder in %RH. The Default value is 0. Multiplier – The Ambient Humidity calibration slope correction multiplier (no unit). The Default value is 1. (Required numeric entry fields) Calibration Date – Automatically updates to the date a new adder or multiplier are entered in the above fields and written to the LCM. See Section 7.5.4.4 for instructions on LCM Humidity calibration. Note Certain LCMs do not contain an ambient Temperature/Humidity board as these are not used by the GFS system. Page 143 © 2011 Fluke Calibration GFS2102™ OPERATION AND MAINTENANCE MANUAL 5.5.7.3 [TH PROBE #2] Figure 93. Calibration [TH Probe #2] Tab Table 63. Calibration Editor [TH Probe #2] and [TH Probe #3] Tab Fields FEATURE Probe Serial Number DESCRIPTION The serial number of the specific TH probe for information purposes only, not user adjustable. (Fixed numeric field) Temperature Calibration (Required numeric entry field) Adder – The TH probe temperature calibration offset correction adder in degrees Celsius. The Default value is 0. Multiplier – The TH probe temperature calibration slope correction multiplier (no unit). The Default value is 1. Calibration Date – Automatically updates to the date a new adder or multiplier are entered in the above fields and written to the LCM. See Section 7.5.5.1 for instructions on TH probe temperature calibration. Humidity Calibration (Required numeric entry field) Adder – The TH probe Humidity calibration offset correction adder in %RH. The Default value is 0. Multiplier – The TH probe Humidity calibration slope correction multiplier (no unit). The Default value is 1. Calibration Date – Automatically updates to the date a new adder or multiplier are entered in the above fields and written to the LCM. See Section 7.5.5.2 for instructions on TH probe Humidity calibration. © 2011 Fluke Calibration Page 144 5. GFS TOOLS SOFTWARE 5.5.7.4 [TH PROBE #3] Figure 94. Calibration [TH Probe #3] Tab 5.5.7.5 [EXTERNAL PRT] Figure 95. Calibration [External PRT] Tab Page 145 © 2011 Fluke Calibration GFS2102™ OPERATION AND MAINTENANCE MANUAL Table 64. Calibration Editor [External PRT] Tab Fields FEATURE DESCRIPTION External PRT Calibration (Required numeric entry field) Resistance at 0°C (ohms) – The External PRT resistance in Ohms at zero degrees Celsius. Slope – The External PRT slope correction in Ohms per degree Celsius. Calibration Date – Automatically updates to the date a new Resistance or Slope are entered in the above fields and written to the LCM. See Section 7.5.6 for instructions on External PRT Temperature calibration. 5.5.7.6 [IR PROBE] Figure 96. Calibration [IR Probe T5] Tab Table 65. Calibration Editor [IR Probe T5] Tab Fields FEATURE DESCRIPTION Cylinder Surface Probe Adder – The IR Probe temperature calibration offset correction adder in degrees Celsius. The Default value is 0. (Required numeric entry field) Multiplier – The IR Probe temperature calibration slope correction multiplier (no unit). The Default value is 1. Calibration Date – Automatically updates to the date a new adder or multiplier are entered in the above fields and written to the LCM. See Section 7.5.7 for instructions on IR Probe temperature calibration. 5.6 [RUN] Modes All run modes are accessed from the [RUN] menu. There are three run modes; [RUN TEST], [RUN MANUAL TEST], and [RUN DIAGNOSTIC TEST]. © 2011 Fluke Calibration Page 146 5. GFS TOOLS SOFTWARE 5.6.1 RUN TEST The [RUN] [RUN TEST] selection in GFS Tools is used for running automated test scripts as setup by the Test Definition Editor (see Section 5.5.2). Automated test scripts are intended to operate without operator interaction once the test has been initiated. In GFS Tools, select [RUN] [RUN TEST] which will bring up the <Setup Test Definition> <GFS Setup> window (see Figure 97). Select the Reference Gas Cylinder to be used from the Gas Cylinder drop-down selection. If new hardware is in use since the previous test, i.e. a different DUT molbloc, or a different test is to be run than previous, then click the “Clear Previous Selections” button to remove all settings and selections from the previous test. If re-running a previous test then after selecting/verifying the Gas Cylinder click “Finish”, otherwise click “Next”. Caution Selecting a Reference Gas Cylinder other than the actual Cylinder in use will not harm the system, but can drastically affect the accuracy and uncertainty of the readings due to incorrect buoyancy and mass corrections. Figure 97. Run Test - Setup Test Definition window Page 147 © 2011 Fluke Calibration GFS2102™ OPERATION AND MAINTENANCE MANUAL Locate and select the Test Definition to be run (see Figure 98), then select “Next”. If necessary, the “View Editor” button can be used to view details of the test and verify it is the correct one intended to be run. Figure 98. Run Test - Select Test Definition Window Select the DUT(s) to be run (see Figure 99). Typically with a molbloc the molbox is the defined DUT, and the molbloc range and information are read into GFS Tools through the molbox interface. Select “Next”. Figure 99. Run Test - Select DUTs window © 2011 Fluke Calibration Page 148 5. GFS TOOLS SOFTWARE Verify the communications setting and load the DUT information on the “Configure Device” window (see Figure 100). Verify the DUT information and select “Next”. Repeat for additional DUT(s). Figure 100. Run Test - Configure DUT Device window Figure 101. Run Test – Configure DUT Device window, legacy molbloc Note For a legacy molbloc the gas selection is automatically set to the Test Gas and cannot be changed. The molbloc Channel list will show the molbox channel A and/or B and the nominal molbloc identification. Page 149 © 2011 Fluke Calibration GFS2102™ OPERATION AND MAINTENANCE MANUAL Figure 102. Run Test – Configure DUT Device window, enhanced molbloc Note For an enhanced molbloc the gas selection is automatically set to the Test Gas and default calibration for that gas, but if a “named” calibration is selected it will override the default selection. The molbloc Channel list will show the molbox channel A and/or B, the nominal molbloc identification, and a list of the available “named” calibrations. Figure 103. Run Test – Configure DUT Device window, Tare Pressure Note For a molbloc intended to operate downstream venting to atmosphere, the “Downstream” Tare Pressure should be selected; for Full MOD LoP or HiP the “Upstream” Tare Pressure should be selected. This setting is used if a DUT molbox Tare Option is set in a Test Definition. © 2011 Fluke Calibration Page 150 5. GFS TOOLS SOFTWARE Verify or select the mass flow controller on the “Setup Flow Controller” window (see Figure 104). This selection is predefined in the test but can be changed at this step to another flow controller, i.e. manual control. Select “Next”. Figure 104. Run Test - Setup Flow Controller window A “Configure Device” window will appear for the selected mass flow controller (see Figure 105). Select the output voltage source for the mass flow controller, such as a molbox or MFC-CB. Select “Next”. Figure 105. Run Test - Configure MFC Device window Page 151 © 2011 Fluke Calibration GFS2102™ OPERATION AND MAINTENANCE MANUAL The “Initializing Test Instruments” window will appear (see Figure 106). Select “Finish” and GFS Tools will initialize all components needed for the test, including the balance, LCM, and all components selected in the previous steps. Once initialization is complete all options and points of the test definition will execute in pre-defined order with no further user intervention required. Note As part of the initialization process, the GFS checks the mass of gas in the Reference Gas Cylinder against the Minimum Required Test Mass. If there is insufficient mass to complete the test a message will warn of this condition and ask if the user wishes to continue anyway. Until this condition is acknowledged by the user all further test execution is halted. Figure 106. Run Test - Initializing Test Instruments window 5.6.2 Run Manual Test The [RUN] [RUN MANUAL TEST] selection in GFS Tools is used for running manual tests without predefined requirements. Manual tests require operator interaction every time an accumulation is initiated or completes. The initial startup of a manual test is almost identical to the startup of an automated test with the exception that no test definition is selected. Once the manual run mode is initialized however, every option including flow rates, flow regulation, mass to deplete, averaging times, etc. must be decided by the operator per accumulation. A manual test will execute per the selected functions under [TOOLS][OPTIONS] (see Section 5.2.2). In GFS Tools, select [RUN] [RUN MANUAL TEST] which will bring up the <Setup Manual Test> <GFS Setup> window (see Figure 107). From the drop-down selections, select the Reference Gas Cylinder, the Test Gas, and the Flow Unit to be used during the test. If new hardware is in use since the a previous test, i.e. a different DUT molbloc, then click the “Clear Previous Selections” button to remove all settings and selections from the previous test. If re-running a previous test then after selecting/verifying the drop-down selections click “Finish”, otherwise click “Next”. © 2011 Fluke Calibration Page 152 5. GFS TOOLS SOFTWARE Caution Selecting a Reference Gas Cylinder other than the actual cylinder in use will not harm the system, but will drastically affect the accuracy and uncertainty of the readings due to incorrect buoyancy and mass corrections. Figure 107. Run Manual Test - Setup Manual Test window Select the DUT(s) to be run (see Figure 99). Typically with a molbloc the molbox is the defined DUT, and the molbloc range and information are read into GFS Tools through the molbox interface. Select “Next”. Verify the communications setting and load the DUT information on the “Configure Device” window (see Figure 100 to 103). Verify the DUT information and select “Next”. Repeat for additional DUT(s). Verify or select the mass flow controller on the “Setup Flow Controller” window (see Figure 104). Select “Next”. A “Configure Device” window will appear for the selected mass flow controller (see Figure 105). Select the output voltage source for the mass flow controller, such as a Referent/DUT molbox or MFC-CB. Select “Next”. The “Initializing Test Instruments” window will appear (see Figure 106). Select “Finish” and GFS Tools will initialize all components needed for the test, including the balance, LCM, and all components selected in the previous steps. Once initialization is complete the system will be ready but idle. All run-time options and functions will now need user input to continue. Note As part of the initialization process, the GFS checks the mass of gas in the Reference Gas Cylinder against the Minimum Required Test Mass. If there is insufficient mass to complete the test a message will warn of this condition and ask if the user wishes to continue anyway. Until this condition is acknowledged by the user all further test execution is halted. Page 153 © 2011 Fluke Calibration GFS2102™ OPERATION AND MAINTENANCE MANUAL Open a data file: see Section 5.4.2 for information on Data File creation. A data file must be open to successfully collect data from an accumulation. Set a flow rate and select flow regulation options: see Section 5.1.5.2.1 for information on setting a target flow and regulating flow. Allow flow to stabilize before starting an accumulation. Start an accumulation: see Section 5.1.5.2.3 for information on using the “Traffic Light” icon on the GFS Control Toolbar within the GFS Control Panel for starting an accumulation. Once the icon has been selected, the “Accumulation Sample Setup” window (see Figure 108) will appear. The flow rate from the previous step will already be present. Enter a starting and ending sample tolerance as described in Table 43 and select “OK”. Figure 108. Accumulation Sample Setup window Define “Take Point” Options: see Section 5.1.4.3 for point and averaging options for data acquisition. Depending on the selections under [TOOLS][OPTIONS], once the accumulation has completed the flow control with either continue indefinitely or will shut down with the accumulation. The data file will remain open until a new data file is requested or the “Stop” icon is used to halt the run mode. 5.6.3 Run Diagnostic Test The [RUN] [RUN DIAGNOSTIC TEST] selection in GFS Tools is used for obtaining real-time balance or LCM output almost instantly by bypassing other equipment configuration and operational steps not required in this mode. This mode is used most commonly for initial balance/AMH setup, viewing all of the LCM ambient conditions outputs, viewing the real-time output of the balance, and performing maintenance/calibration operations on the balance or LCM. There are no additional setup steps to run a diagnostic test, simply select this option and the mode will be active is seconds. 5.7 Calculations 5.7.1 Overview This section details the various calculations used by GFS Tools. © 2011 Fluke Calibration Page 154 5. GFS TOOLS SOFTWARE 5.7.2 Errors The DUT error expresses the difference between the DUT reading and the reference reading at a particular point in a test. Errors are calculated in four different ways: %Reading, %DUTFS, %Reading Set Point, and %DUTFS Set point. %Reading and %DUTFS errors express the difference between the DUT output and the reference output or the DUT span. The %Reading Set Point and %DUTFS Set Point options express the difference between the reference output and the set point or the DUT span. Note • %Reading errors are undefined near 0 (zero) reference outputs. • Set point errors are determined using the measured DUT set point whenever possible. If a measured value is not available, the nominal value is used as the set point. E % DUTFS = E % Rdg = QDUT − Q Re f × 100 QDUTspan QDUT − Q Re f × 100 Q Re f E % DUTFS _ Set = Qref − QSet × 100 QDUTspan E % Rdg _ Set = Qref − Qset × 100 Qset VARIABLE DESCRIPTION QDUT Current DUT final output. Q Re f Current reference final output. QDUTspan DUT span as determined by the difference between the maximum and minimum final output values in the DUT Definition. E % DUTFS DUT percent of full scale error. E % Rdg DUT percent of reading error. QSe Test target in DUT final output unit. E % DUTFS _ Set DUT percent of full scale set point error. E % Rdg _ Set DUT percent of reading set point error. Page 155 © 2011 Fluke Calibration GFS2102™ OPERATION AND MAINTENANCE MANUAL 5.7.3 Tolerance The determination of whether a point is in or out of tolerance depends on the type of tolerance selected, and the DUT and reference flow. Tolerance values may be specified in multiple units (see 5.5.3.5). GFS Tools first determines the tolerance value in DUT final output unit and then compares the value to the current DUT error to determine if the error is smaller (in) or larger (out) than the tolerance. When the DUT tolerance selection is (%DUTspan + %Reading) the tolerance is the sum of the two values. If the selection is %DUTspan or %Reading, the tolerance used is the greater of the two values. Tolerances that are defined in DUT final output, set, or output units are also compared directly in the test unit of measure. QT % DUTspan = T % DUTspan × QDUTspan 100 QT % reading = T % reading × Q Re f 100 VARIABLE 5.7.4 DESCRIPTION T % DUTspan %DUTFS tolerance value defined in the DUT definition. QDUTspan DUT span as determined by the difference between the maximum and minimum final output values in the DUT Definition. QT % DUTspan Maximum allowable( DUT – reference) deviation based on a %DUTFS tolerance. Q Re f Current reference final output. T % reading %Reading tolerance value defined in the DUT definition. QT % reading Maximum allowable (DUT – reference) deviation based on a %Reading tolerance. AutoZero Correction AutoZero is used to correct the balance for drift over time. The procedure is to first measure the reference mass in the AMH-GFS2102 just after zeroing the balance and before starting a flow accumulation. This value and all ambient conditions are stored. At a later time during or after accumulation, the AMH is used to lower the reference mass again. The offset from the initial measured mass and all ambient conditions are again stored. If the balance has not drifted and ambient conditions have not changed (and the AutoZero system repeated perfectly), the balance output would be 0. However, this is never the case. The bulk of the resultant mass change is the result of the change in buoyancy and the drift of the balance. Any error associated with the AutoZero system cannot be compensated for. In general, this error can be experimentally proven to be small relative to drift and buoyancy change. Therefore, neglecting its effect is valid. Since the cylinder is buoyancy corrected real time when taking measurements, the buoyancy correction of the reference mass should not be part of the AutoZero correction used to determine the instantaneous cylinder mass. To remove the buoyancy mass from the AutoZero correction, the difference in the calculated true mass is used. The actual true mass of the reference mass is not used because any error in the balance will result in an offset that is normally “tared” out. Span error of the balance is not an issue since only a small portion of the balance span is used. Using the true mass of the reference mass would complicate the issue by requiring a correction factor for the balance. © 2011 Fluke Calibration Page 156 5. GFS TOOLS SOFTWARE ρ ρ m∆ = mT 1 + 1 − mT 1 + 2 + md ρm ρm re-arrange and simplify… m d = m ∆ − mT ρ1 − ρ 2 ρm Note that if the balance did not drift, an increase in density should result in a negative mass change relative to the original reference mass measurement and a decrease should result in a positive mass change. The above equation holds true. VARIABLE 5.7.5 DEFINITION md The calculated mass drift of the balance in grams. This is the AutoZero correction value used to determine the instantaneous mass measured by the balance. The value will change only when an AutoZero occurs. Between AutoZeros, the value remains constant. When the balance is first zeroed, the value is 0. mT The true mass value for the reference mass stored in GFS Tools in grams. This should equal the calibrated value of the reference mass within the uncertainty of the balance. m∆ The averaged output of the balance when the reference mass is lowered for AutoZero. The balance must have been originally checked with the reference mass lowered. ρ2 Air density at the time of the AutoZero (kg/m3). ρ1 Air density at the time of the original reference mass check (kg/m3). ρm Reference mass density at the time of the original check (kg/m3). Reference Cylinder Buoyancy If a cylinder is activated in the configuration, the cylinder pressure and buoyancy mass are determined based on the instantaneous mass, AutoZero correction, cylinder parameters and ambient conditions. The cylinder buoyancy mass is used to correct the instantaneous mass of the balance by removing the buoyancy changes of the cylinder. GFS Tools calculates the total buoyancy mass of the cylinder with each new mass update. This total buoyancy is added back to the instantaneous mass to determine the final corrected mass. The cylinder pressure is calculated using the indicated mass of the cylinder and ambient conditions in an iteration. The balance output is not the cylinder mass when the cylinder is on the scale. In general use, the mass output on the balance must be added to the AutoZero and corrected by the AutoZero correction to determine the indicated cylinder mass. The cylinder pressure is used to determine the expanded external volume of the cylinder. Since buoyancy mass of an object is equivalent to the mass of the buoyancy fluid displaced by the object; The density of air times the external volume of the cylinder yields, the buoyancy mass of the cylinder. The new buoyancy mass of the cylinder must be added to the instantaneous mass to determine the cylinder true mass. The cylinders true mass is then used in the same equations to determine the buoyancy mass of the cylinder. This process is repeated until the buoyancy mass of the cylinder does not change by more than 0.01 mg or 10 iterations. Note that the cylinder buoyancy mass (mbc) is 0 for the first iteration. In all following iterations, the cylinder buoyancy mass is the calculated value. In the equations, the factor of 1000 is used to convert to and from kg and g. Page 157 © 2011 Fluke Calibration GFS2102™ OPERATION AND MAINTENANCE MANUAL mbc = 0 mbtl = mi + mbc − m d Pb = z ( Pb ' , TIR )TIR PN (mbtl − mbC − mb 0 ) 1000TN Vint ρ g ( PN , TN ) z N ( PN , TN ) VCR = Vext (1 + λPb )(1 + 3α (TIR − TN )) mbc = 1000[VCR ρ air ( P, TC , H ) + Vacc ρ air ( P, TP , H )] VARIABLE DEFINITION Pb Calculated pressure of the test gas inside the cylinder in Pascal. Pb’ Calculated pressure of the test gas from the previous iteration. The value is used to determine the gas compressibility at pressure. mbtl The instantaneous cylinder mass (g). mbc The instantaneous cylinder buoyancy mass (g). mi Instantaneous unmodified mass output of the balance (g). md The calculated mass drift of the balance in grams (see Section 5.7.4). mb0 Pb Calculated pressure of the test gas inside the cylinder in Pascal. TIR Temperature of the cylinder in Kelvin as indicated by the IR probe. TP Temperature output of TH Probe #2 in Kelvin. TH Probe #2 is located next to the regulator assembly on the top of the reference gas cylinder. TC The temperature output of TH Probe #3 in Kelvin. TH Probe #3 is located next to the reference gas cylinder. P © 2011 Fluke Calibration The evacuated mass of the cylinder in grams. This value is obtained from the active cylinder selected during Test Initialization. Ambient pressure around the cylinder in Pascal. PN Nominal gas pressure = 101325 Pa. TN Nominal gas temperature = 273.15K. Vint Internal volume of the cylinder in m3. The value is obtained from the active cylinder selected during Test Initialization. Vext External volume of the cylinder in m3. The value is obtained from the active cylinder selected during Test Initialization. VCR Calculated Pressure and temperature expanded external volume of the cylinder in m3. Vacc Volume of the external cylinder accessories in m3. This volume is not subject to pressure or thermal deformation when determining the buoyancy correction. ρg(PN ,TN ) Density of the test gas at the nominal gas pressure and temperature (kg/ m3). ρair(P,T, H) Density of the air at the current ambient pressure, temperature and humidity (kg/ m3). λ Pressure distortion coefficient of the cylinder (/Pa). The value is obtained from the active cylinder selected during Test Initialization. α Temperature distortion coefficient of the cylinder (/C). The value is obtained from the active cylinder selected during Test Initialization. zN (PN ,TN ) Nominal compressibility of the calibration gas. The 20MPa pressure model is used to determine this compressibility factor. z (Pb’ ,TIR ) Calibration gas compressibility based on the previously known reference cylinder pressure and the current reference cylinder temperature. The 20MPa pressure model is used to determine this compressibility factor. Page 158 5. GFS TOOLS SOFTWARE 5.7.6 Fully Compensated Mass Following the discussion of the previous sections, the fully compensated instantaneous mass is the instantaneous output of the balance times the mass span multiplier plus the buoyancy mass of the cylinder minus the AutoZero correction. When the AutoZero system is not used, this value is zero. When a mass span multiplier has not been established this number is 1. However, all other calculations are the same. m f = mi (m span ) + mbc − m d mcorr = m f − mi When the start option on the <Balance Display> toolbar is pressed to take a point, the current time and fully compensated mass are stored. With each new balance output, the absolute value of the difference in the starting fully compensated mass and the instantaneous fully compensated mass are used to determine the mass depleted. The mass depleted divided by the instantaneous time and starting time difference is the mass flow. This flow is converted to the active test unit of measure for display. [ mU = abs m f (n) − m f (0) ] t d = t (n) − t (0) qm = mU t VARIABLE DEFINITION mf mspan Mass Span Multiplier. This is a user adjustable span correction of the balance. Default value is 1 for no correction. See section 5.1.5.2.3 or section 7.8 for instructions. mcorr Mass Correction as stored in the data file (g). This is the difference between the fully compensated instantaneous mass and the instantaneous unmodified mass output of the balance. mU t The instantaneous depleted mass of the gravimetric calibrator (g). td The absolute measured time difference at any instant in time (s). qm 5.7.7 Fully compensated instantaneous mass. The parameter in parenthesis represents time. Time 0 is when the flow timer is turned on. Time n is at any instant in time. The absolute measured time at any instant in time (s). The parameter in parenthesis represents the instant in time. Time 0 is when the flow timer is turned on. Time n is at any instant in time Fully compensated gravimetric flow. Average Flow This is a simple average of discrete flow values at the defined sample interval. Each individual sample is summed and divided by the total number of samples summed. The value updates for each new sample when accumulating. n q= Page 159 ∑q 1 n © 2011 Fluke Calibration GFS2102™ OPERATION AND MAINTENANCE MANUAL VARIABLE DEFINITION q n q 5.7.8 Average flow. The number of samples in Instantaneous flow Best Fit Flow The best fit flow is determined by calculating a real time best fit at the defined sample rate. Unlike a standard best fit, GFS Tools forces the fit though zero. It is equivalent to plotting mass on the Y axis and time on the X axis. Each individual mass update has a specific time and thus corresponds to a discrete point on the plot. Points are added to the calculation based on the defined sample rate of the GFS. n q= ∑m t i =1 n ∑t i =1 i i 2 i VARIABLE DEFINITION q mi ti Best Fit flow. Mass used at the time of sample i. Elapsed time at the time of sample i. Best Fit Flow © 2011 Fluke Calibration Page 160 5. GFS TOOLS SOFTWARE 5.7.9 Integrated Mass The mass used by the GFS is the difference between the starting corrected mass and the current corrected mass. The mass used by a DUT is determined by integration. DUT integration starts as soon as the starting mass of the GFS is determined (there may be a delay if an AutoZero is defined at the beginning of the accumulation). The value is also updated with each new sample from the DUT. The defined sample rate criterion is not used for mass integration of a DUT. n m=∑ i =1 ∆t i (qi −1 + qi ) 2 VARIABLE DEFINITION mf ∆t i qi 5.7.10 Integrated mass used in g. Change in time between sample i and sample i-1 in seconds. A discrete flow value converted to g/s (grams per second). %Reading GFS Tolerance, Starting and Ending The Starting Sample % Rdg Tolerance and Ending Sample % Rdg Tolerance are calculated from the %Reading tolerance flow value as derived from independent mass and time tolerance values. The [Setup][Configuration] menu choice contains features to allow the entry of a fixed and span related mass tolerances on the [Balance] tab and time tolerances on the [LCM] tab; grams + PPM mass Reading and seconds + PPM time Reading. These values are used to determine the maximum flow, including error at any given mass and time at a specified flow rate. This maximum flow less the target flow is the flow tolerance value. The flow tolerance divided by the actual flow value is the %Reading Tolerance flow. The more mass and time are used the lower the tolerance. • Determine the instantaneous mass and time errors. ∆ m = εm + ν mm ∆ t = εt + ν t t • Determine the instantaneous flow tolerance relative to the target flow. q∆ = m + ∆m t + ∆t ∆ q = q∆ − q • Determine the mass required to obtain a %Reading flow error E. Eq +q 100 − (Φε t + ε m ) mt = Φ Φν t +ν m 1− + q q Φ= Page 161 © 2011 Fluke Calibration GFS2102™ OPERATION AND MAINTENANCE MANUAL VARIABLE DEFINITION m mt Φ E t ∆m ∆t q εm νm εt νt © 2011 Fluke Calibration Instantaneous mass depleted from the balance (g). Required mass to deplete to obtain a %Reading uncertainty E Error factor used to simplify the required mass equation. Requested %Reading error value. This is either the error at which to start sampling or the error at which to end sampling. Time elapsed since the beginning of accumulation (s). Mass uncertainty at any given mass value. For simplicity other sources of uncertainty that are related to mass must be combined to determine this value. Time uncertainty at any given mass value. For simplicity other sources of uncertainty that are related to mass must be combined to determine this value. Nominal flow target (g/s). This is not the instantaneous flow value. Fixed mass uncertainty. All fixed components of mass based uncertainty should be combined to determine this fixed value. (Drift, buoyancy correction ect) Span based mass uncertainty. All span based components of mass uncertainty should be combined to determine this span based value. Fixed time uncertainty. All fixed components of time based uncertainty should be combined to determine this fixed value. (data acquisition latency, clock drift, ect). Span based time uncertainty. All span based components of mass uncertainty should be combined to determine this span based value. Page 162 5. GFS TOOLS SOFTWARE 5.7.11 Sample Rate Several setup factors and the active flow rate determine the GFS sample rate. The sample rate is the rate at which mass, time points are used to determine a new GFS flow, and the rate at which the DUT flow is averaged. The mechanism used to determine the sample rate automatically provides longer times for low flows and faster times for higher flows. The equation and table below define how the sample rate is calculated. When sampling starts and stops is based on the starting and ending %rdg tolerances and the target depleted mass entry. tr = VARIABLE ms q DEFINITION tr The time interval between consecutive GFS samples. The GFS is capable of taking a maximum of approximately 12 samples per second. The number of samples actually used is defined by the [Setup] [Configuration] [System] <Balance RS232 Poll Interval>. The actual number of readings taken from the balance governs the true minimum time between samples. ms q The [Setup][Configuration]<Min mass change per GFS sample> value. Nominal flow target (g/s). This is not the instantaneous flow value. Page 163 © 2011 Fluke Calibration GFS2102™ OPERATION AND MAINTENANCE MANUAL Notes © 2011 Fluke Calibration Page 164 6. General Maintenance, Adjustments, and Storage 6.1 Summary GFS2102 was designed for very low maintenance operation. However, certain regular maintenance functions are required to assure reliability and the best performance over time. These are summarized in Table 66, including cross-references to sections of this manual detailing each procedure. Table 66. Mechanical maintenance procedures SYSTEM PROCEDURE DESCRIPTION FREQUENCY SEE SECTION AMHGFS2102 Lubricate the AMH plate positioning posts Check or adjust Reference Gas Cylinder Alignment Every 6 months or if the AMH plates appear to be binding on the posts. Monthly or on indication of misalignment. 6.2 Reference Gas Cylinder Reference Gas Cylinder Disassemble to Reference Gas Cylinder for shipment or storage. Remove the cylinder, cylinder plate, and reference mass plate from the AMH, clean & lubricate the posts, reinstall the plates. Ensure the cylinder is properly upright and aligned in its carrier for ease of use and maximum interchangeability of multiple cylinders. Drain and vent the cylinder before removing the Regulator Assembly to prepare the cylinder for shipment or long term storage. 6.4 Reference Gas Cylinder Have the cylinder hydrostatically tested Depending on location, send the cylinder to a DOT or EU approved testing facility for hydrostatic testing. Reference Gas Cylinder Removing or replacing the cylinder in the carrier Heat Exchanger Check/Change fluid in heat exchanger If the cylinder is removed from the carrier either by accident or on purpose it must be correctly replaced in the carrier for proper use. Weigh or open the heat exchanger to check the fluid level. Add or replaced the fluid. Whenever the cylinder is to be shipped for alignment or testing, or placed in long term storage. Every 3-5 years from the manufacture date on the cylinder depending on local regulatory requirements, only valid for 15 years from the date of manufacture. Removed before and replaced after every hydrostatic test or replaced after every accidental removal. Yearly or if fluid level is suspect. Granite Table, AMH-2102, Balance Check or Re-level surfaces Re-level items for best, most trouble free operation. Yearly or if suspect. GFS2102 Leak Check Check system for flow path leaks. After any major physical setup change. 6.2 AMH-GFS2102 Plate Positioning Posts Lubrication 6.3 6.5 6.6 6.7 6.8 4.4.4 The plate positioning posts should be lubricated periodically with Krytox grease to maintain good working order of the AMH. If unusual noise is heard during operation of the AMH or it is observed that either of the plates are binding on the positioning posts it is recommended to immediately stop operations and lubricate the posts. A small tube of Krytox grease is delivered with each GFS system. Page 165 © 2011 Fluke Calibration GFS2102™ OPERATION AND MAINTENANCE MANUAL Remove the Reference Gas Cylinder from the AMH. Operate the AMH to lower the Reference Mass plate. This will raise the Reference Cylinder plate to its highest point. Carefully remove the Reference Cylinder plate from the AMH, trying not to disturb the positioning of the AMH. A slight left-right-left rocking motion on the plate can assist in freeing a plate that is binding. Operate the AMH to raise the Reference Mass plate. Carefully remove the Reference Mass plate from the AMH, trying not to disturb the positioning of the AMH. Using a soft cloth or cotton swabs, clean the positioning posts on the AMH and the positioning holes on the plates. Apply a small amount or Krytox grease to the positioning posts and positioning holes. Use a cotton swab to spread the grease evenly over the surfaces. Reassemble the Reference Mass plate and then the Reference Cylinder plate back on to the AMH. Operate the AMH to check for smooth and easy movement of the plates. Repeat as needed. Place the Reference Gas Cylinder back into position and reconnect the catenary connection. The AMH is ready for use. 6.3 Reference Gas Cylinder Alignment 6.3.1 Check Reference Gas Cylinder Alignment Place the reference gas cylinder on the custom mass tray so that the quick connector on the regulator assembly is on the right side. Using a rule or measuring tape, adjust the balance position so that the distance from the back wall of the GFS Enclosure to the center of the screws and lock nuts that are in line with the regulator assembly are equal distance (approximately 11” or 27.94cm). © 2011 Fluke Calibration Page 166 6. GENERAL MAINTENANCE, ADJUSTMENTS, and STORAGE Measure the distance from the back wall of the GFS to the center of the 1/8” tubing directly before and after the regulators. The both measurements should match the distance established in step 1 within ±¼” or the cylinder may need alignment per Section 6.4.2. Measure the distance from the 1/8” tubing directly before and after the regulators to the top of the enclosure (approximately 5” or 12.7cm). Both measurements should match each other within ±¼” or the cylinder may need alignment per Section 6.4.2. If the measurements match then the cylinder is properly aligned and ready for use, otherwise proceed to Section 6.3.2 to align the cylinder. 6.3.2 Alignment of the Reference Gas Cylinder Alignment should be performed without loosening the set screws or lock nuts holding the carrier to the reference gas cylinder. If the lock nuts and set screws are backed off, the placement of the pads that protect the cylinder surface from the set screws should be noted and maintained. If difficulties in alignment are encountered, the cylinder can be sent back to Fluke Calibration for alignment. Page 167 © 2011 Fluke Calibration GFS2102™ OPERATION AND MAINTENANCE MANUAL Caution Great care should be taken so that the alignment process does not result in completely removing the cylinder carrier from the bottle. Should this occur, Section 6.6 details the reassembly of the carrier to the cylinder. If the measurements from step 2 or 3 of section 6.4.1 are: • Left positive, right negative – the cylinder needs to be rotated clockwise in the carrier. • Left negative, right positive – the cylinder needs to be rotated counter-clockwise in the carrier. • Left and right negative – the top of the cylinder needs to be pulled forward in the carrier. • Left and right positive – the top of the cylinder needs to be pushed backward in the carrier. In some cases there might be a combination of rotation and front/back alignment. recommended to deal with the rotation first. It is If the cylinder needs to be rotated, grasp the carrier firmly and directly in one hand (not by the legs) and use the other hand to slowly but firmly rotate the cylinder in the direction desired. After each adjustment check progress by repeating the steps of section 6.4.1. If the cylinder needs to be pulled forward or pushed back, grasp the carrier firmly and directly in one hand (not by the legs) and use the other hand to slowly but firmly push or pull the cylinder in the direction desired. After each adjustment check progress by repeating the steps of section 6.3.1. Several attempts may be required to fully correct the alignment or to correct back from overcompensation. Repeat the steps as necessary. 6.4 Preparing the Reference Gas Cylinder Assembly for Shipment or Long Term Storage The regulator assembly must be removed from the reference gas cylinder before shipping the assembly, or the regulator assembly stem and/or exit tube are likely to be bent during shipment. Use the following steps to prepare the reference gas cylinder for shipment or long-term storage. Using proper precautions for safely bleeding the pressurized gas and venting or disposing of any potentially hazardous, toxic, or flammable gases, drain the gas from inside the reference gas cylinder. The easiest and safest way to drain the cylinder is to allow it to flow out through a connected flow path as if a test were to be run, for example starting a manual test and setting 100% flow of the connected DUT molbloc. The gas can also be drained slowly from the cylinder through the fill port, loosening and leaving the fill port plug in place to assist in controlling the drain rate, and slowly opening the fill valve to start the flow of gas. Place the reference gas cylinder into the fill/carry case and loosen the DH200 gland from the reference cylinder connector. DO NOT use any type of pipe wrench or vise to hold the assembly by the carbon fiber body of the cylinder. If an open end or adjustable wrench is used to hold the reference cylinder connector instead of the fill/carry case cradle, you may want to use a cloth or other material to protect the finish of the connector from scratches. Unthread the DH200 gland by hand and remove the regulator assembly from the cylinder connector. Remove the collar from the regulator stem so that the DH200 gland can also be removed. Use the DH200 gland and the originally supplied DH200 plug to seal the regulator stem port of the reference gas cylinder connector so that it remains clean during shipment. Re-thread the DH200 collar back on to the regulator stem or otherwise package it with the cylinder assembly for shipment. © 2011 Fluke Calibration Page 168 6. GENERAL MAINTENANCE, ADJUSTMENTS, and STORAGE Locate the custom foam cut-out for shipping the regulator assembly within the reference cylinder assembly fill/carry case. Place the regulator assembly in the foam cut-out and insert into the fill/carry case so that the regulator stem points up and the open side of the foam cut-out faces away from the reference gas cylinder in the case. Place the reference gas cylinder (with connector and support still attached) into the case so that the cylinder connector is supported with the fill port and valve facing up. Close the case lid and latch the latches. The cylinder is now ready for shipment or storage. When shipping, it is recommended to place the case in a corrugated shipping container to keep the case in good condition and prevent easy access to the latches. 6.5 Reference Gas Cylinder Hydrostatic Testing US-DOT and European regulations require that the composite Reference Gas Cylinders be hydrostatically tested at a required interval and have a maximum service life of 15 years from the date of manufacture of the cylinder (See Figure 109). At that time, the cylinders should be replaced. The hydrostatic testing should be performed on the cylinders to ensure safe operation, by default every 5 years from the date of manufacture of the cylinder unless otherwise required by local jurisdiction authorities. Note that in some European countries, the 5 year period is shortened to 3 years. The US-DOT label shows the month and year of manufacture (indicated in the Figure by an arrow) and the statement that “Hydrostatic testing must be performed every 5 years”. The cylinder serial number is directly above the month and year. The European label shows the year and month of manufacture, the year and month of the cylinders final service date, and locations to list the dates of the periodic inspections (all indicated in the Figure by arrows). The cylinder serial number is in the upper right corner of the label. Figure 109. US-DOT and European Reference Gas Cylinder labels To locate a local hydrostatic testing facility, contact a local paintball equipment supplier, scuba shop, or compressed gas supplier and inquire as to whom they have hydrostatically test their cylinders. Prepare the cylinder for shipment by following the instructions in Section 6.4. During the testing process it is almost certain that the testing facility will require that the cylinder be removed from the carrier. For this reason and due to the fragile nature of the cylinder carrier in untrained hands, Fluke Calibration recommends the removal of the carrier prior to sending the cylinder out for hydrostatic testing. The instructions in Section 6.6 detail the removal and reassembly of the carrier. For a fee, Fluke Calibration can sub-contract the US-DOT hydrostatic testing of the Reference Gas Cylinder, and ensure that the cylinder is properly aligned in the cylinder support assembly before return shipment to the customer. When sending the cylinder assembly to Fluke Calibration for this purpose, it is only necessary to prepare the cylinder for shipment by following the instructions in Section 6.4, and removal of the carrier is not required. Page 169 © 2011 Fluke Calibration GFS2102™ OPERATION AND MAINTENANCE MANUAL 6.6 Removing or Reassembling the Cylinder Carrier If the cylinder carrier has been removed from the Reference Gas Cylinder, either intentionally or by accident, it must be correctly reassembled and aligned to safely and properly continue to use the Reference Gas Cylinder. It is recommended to perform these steps over a flat, cleared work surface free of unnecessary parts and materials. 6.6.1 Removing the Cylinder Carrier Follow the instructions in Section 6.4 to prepare the cylinder for shipment. Loosen all six of the 5.5mm lock nuts around the edge of the cylinder carrier. Use a 0.9mm Hex driver to back-out (but don’t remove) the six spring loaded screws. Some cylinders are protected from the screws by adhesive plastic strips on the cylinder, others are protected by black rubber pads. If the cylinder was protected by the black rubber pads, keep careful track of them as some of the rubber pads may stay in place on the cylinder, on the screws, or fall to the work surface during carrier removal. Firmly grasp the cylinder in one had and the carrier in the other and slowly pull them apart. If the six black rubber pads were present, carefully account for them and store them with the carrier until ready to reassemble the Reference Gas Cylinder assembly. Caution Never attempt any work on a Reference Gas Cylinder while it is pressurized. Follow the instructions in Section 6.4 for preparing the cylinder for shipment. Figure 110. Reference gas cylinder carrier Spring loaded screw 6.6.2 5.5mm Lock Nut Rubber pad Reassembling the Carrier to the Cylinder Place the carrier oriented with the “flat” leg to the left and closest to the operator and a spherical leg to the right. If the cylinder connector has been removed, reinstall it now. Also assemble the regulator assembly to the cylinder connecter so that it is visually perpendicular to the cylinder connector (See Section 3.3.7). Set the cylinder in the carrier with the fill valve facing the operator. © 2011 Fluke Calibration Page 170 6. GENERAL MAINTENANCE, ADJUSTMENTS, and STORAGE If the cylinder was protected from the screws by six black rubber pads, place a rubber pad in front of a spring loaded screw and engage the screw using a 0.9mm Hex driver just until the pad is held in place by the screw. While engaging the screw it may be necessary to support the rubber pad(s) in place from below with a small flat-bladed screwdriver. Repeat for the other five screws. Visually align the cylinder in the carrier, then perform an alignment per the instructions in Section 6.3, keeping in mind that the carrier is not yet fully secured to the cylinder. Fully engage the spring loaded screws in a cross pattern such as 1-3-5-2-4-6 until the carrier is firmly attached to the cylinder. Use the 0.9mm Hex driver to prevent the screws from further engaging while using a 5.5mm wrench to lock the screws in place with the lock nuts. Re-check the alignment per Section 6.3 and adjust as necessary. The carrier can be further secured to the cylinder by using small amounts of a clear latex or silicone caulk, keeping in mind that the carrier will need to be removed eventually for the next hydrostatic test or cylinder replacement. The cylinder assembly is now ready to return to use. 6.7 Check/Change Fluid in Heat Exchanger Over time the fluid in the Heat Exchanger may evaporate or become stagnant. exchanger may lose some of its effectiveness. If this occurs the If the Heat Exchanger was weighed previously and the mass recorded, weigh the Exchanger again and compare the current mass to the original prepared mass. If the masses agree within 10% no action need be taken. If the fluid needs to be checked or replaced, then remove the lid and add fluid or discard the fluid appropriately and refill the Exchanger as in Section 3.3.14. 6.8 Relevel System Surfaces Generally if the bubble level on the AMH-GFS2102 still indicates level and there are no issues with system performance then no actions need be performed. Starting with the granite vibration isolation table, check/adjust the level of the surface as described in Section 3.3.1. Check/adjust the custom mass tray level as described in Section 3.3.10. Check/adjust the level of the AMH-GFS2102 as described in Section 3.3.12. 6.9 Leak Check the Flow Path Perform leak tests as described in Section 4.4.4. Page 171 © 2011 Fluke Calibration GFS2102™ OPERATION AND MAINTENANCE MANUAL Notes © 2011 Fluke Calibration Page 172 7. Maintenance of Traceability and Recalibration 7.1 Principles of GFS2102 Traceability Maintenance The GFS2102 system is designed to provide state of the art measurement uncertainty specifications with a very high degree of confidence over time while minimizing maintenance requirements. The maintenance of traceability and associated recalibration of the GFS2102 system requires metrological maintenance procedures that are performed locally at regular intervals (see Sections 7.2 and 7.3) and the regular recalibration of certain system elements (see Sections 7.4 and above). 7.2 [PC Timer Calibration] The GFS Tools [Tools][PC Timer Calibration] menu choice is provided to adjust and/or compare the internal clock of the host PC to the calibrated clock of the LCM (see Figure 111). The internal clock of the host PC is used to integrate flow from a DUT to obtain a mass. For this reason, it is important for the PC clock and LCM clock to agree. However, perfect agreement is not critical. Flow is inherently an average quantity. Integrating a flow that updates ever second with a time that has error off ±5 ms will not yield a significant flow integration error. Use the displayed Time Calibration form to perform the comparison. Press [Start] to begin the process. The LCM and PC clock comparison information displays on the screen while the test is active. Allow the clocks to run for at least one hour then press [Stop]. A predicted span correction is provided. Press [Apply] to use this new span correction to adjust the PC clock. Repeat the process as many times as desired then close the form to return to the main program. 7.3 molbox AutoZ and Tare Operations Although not sold directly as part of the GFS system, the molbox is considered a necessary and integral piece of the system. In order to maintain the best performance of the GFS over time when used with a molbloc/molbox, the molbox must have its AutoZ and Tare functions utilized periodically. Refer to the molbox Operation and Maintenance Manual for the proper operation of the AutoZ and Tare functions. Any molbloc-L low flow (< 500 sccm) test definition in GFS Tools should include a molbox Tare before each flow point, and any test higher than that should include a molbox Tare before the first flow point. If molbloc-S is in regular use with the GFS, the AutoZ function should be manually performed monthly. 7.4 Reference Mass Recalibration The reference mass is recalibrated by re-determining the true mass value. It is recommended that the reference mass be recalibrated at the end of the first and second years of operation. Then, based on the observed stability, a longer calibration interval may be assigned. Though other organizations may be able to perform these calibrations, it is recommended that a Fluke Calibration Service be used, if possible. The reference mass, all three mounting legs, and all three leg screws MUST be calibrated as one mass. Any replacement parts will require the recalibration of the assembly as one mass. Note When installing or uninstalling the reference mass, always keep careful track of the Page 173 © 2011 Fluke Calibration GFS2102™ OPERATION AND MAINTENANCE MANUAL screws and mounting legs as these are an integral part of the calibrated true mass value of the reference mass. When recalibrating, all of these parts (main mass, three legs, three screws) must be calibrated as one mass. If a screw is ever lost or misplaced the entire assembly needs to be recalibrated with the replacement screw. To remove the reference mass for calibration, first remove the Reference Gas Cylinder and top plate from the AMH-GFS2102, then remove the Reference Mass plate with the attached Reference Mass. Reverse the steps in Section 3.3.9 to remove the Reference Mass from the plate. The recalibration process may find a mass value that is different from the previous value. The GFS Tools software must be changed to reflect the new calibrated value (see Section 5.5.7.1). 7.5 Laboratory Conditions Monitor (LCM) Recalibration 7.5.1 Overview LCM calibration consists of: • Section 7.5.2: • Section 7.5.3: LCM TIME VERIFICATION OR ADJUSTMENT: Verification of the time used to time-stamp GFS2102 balance mass readings. One year calibration interval recommended. • Section 7.5.4: AMBIENT P, T, H SENSOR ADJUSTMENT: Verification of the enclosure pressure, ambient temperature, and ambient humidity sensors. One year calibration interval recommended. Newer LCM versions may not have the ambient temperature or ambient humidity sensors. • Section 7.5.5: TH PROBE ADJUSTMENT: Verification of the TH probe temperature and humidity sensors. One year calibration interval recommended. • Section 7.5.6: EXTERNAL PRT (REFERENCE MASS PRT) ADJUSTMENT: Verification of the external (reference mass) PRT temperature. One year calibration interval recommended. • Section 7.5.7: INFRARED CYLINDER TEMPERATURE ADJUSTMENT: Verification of the infrared cylinder temperature. One year calibration interval recommended. • Section 7.5.8: STANDARD RESISTOR ADJUSTMENTS: Verification of the internal standard resistors, needed only if the reference mass PRT is to be calibrated separately from the LCM. 100 Ohm and 110 Ohm resistors, ± 0.01%. One year calibration interval recommended. • Section 7.5.9: LCM REMOTE COMMAND FOR AUTOMATION: Parsing the “ALLR” command for automating data collection with Sections 7.5.3 to 7.5.7. • Section 7.5.10: LCM Front Panel Display modification: To change the information displayed by default on the LCM. AS RECEIVED DATA REVIEW. Caution • See Section 1.1.3 for specific sensor specifications. • LCM is covered by a limited 1 year warranty. Unauthorized service or repair during the warranty period is undertaken at the owner's risk and may cause damage that is NOT covered under product warranty and/or may void the product warranty. © 2011 Fluke Calibration Page 174 7. MAINTENANCE of TRACEABILITYU and RECALIBRATION Note Calibration, maintenance and repair services for LCM are offered by Fluke Calibration Authorized Service Providers. 7.5.2 As Received Data Review Open GFS Tools software and establish communications with the LCM. Use [Setup], [Configuration] and select the LCM tab. Set up the RS232 Interface on this tab to match the LCM COM1 settings (default 19200, N, 8, 1) and click <OK>. Use [Setup], [Calibration] to read all of the user level calibration coefficients from the LCM. Verify that the displayed values on each tab match those from the previous calibration. 7.5.3 LCM Time Verification or Adjustment 7.5.3.1 Principle LCM is used to read the GFS balance mass indication for use in GFS2102 mass flow measurements. For GFS flow measurement, it is critical that not only the mass measurement, but also the measurement of the time of each mass measurement, is made with a well defined uncertainty. Reading the mass balance directly with a computer and accurately establishing the time of each mass reading within a Windows OS environment can be problematic and subject to lag. Instead, a precision timer in LCM is used to time stamp each mass reading from the balance before it is passed on to GFS Tools software. To verify the internal timer it can be compared to another calibrated time source. To calibrate the LCM timer, a reference frequency counter is connected to the LCM and the frequency used by the LCM to calculate time is compared to the frequency counter. If a significant discrepancy is found, the LCM timer can be adjusting using the pre-scale coefficient. 7.5.3.2 LCM Time Verification In order to perform this step it is assumed that the personal computer (PC) clock has adequate uncertainty. The [PC Timer Calibration] function is normally intended to make a correction to the PC time, but in this case is used to verify the LCM time measurement. In GFS Tools select [Tools], [PC Timer Calibration] (see Figure 111). In the Timer Calibration window, click the Start button. Allow at least three hours to elapse, and then click the Stop button. The Predicted Span Correction should be between 0.999900 and 1.000100. If it is not within these limits the LCM frequency can be more accurately checked or adjusted by the instructions in Section 7.5.3.3. Page 175 © 2011 Fluke Calibration GFS2102™ OPERATION AND MAINTENANCE MANUAL Figure 111. Time Calibration window 7.5.3.3 LCM Time Adjustment 7.5.3.4 Equipment Required • Reference Frequency Counter. Almost any calibrated frequency counter available will meet the uncertainty requirements. • Test cable to connect Frequency Counter to LCM test points. 7.5.3.5 Operation Remove the LCM top cover. Connect the test cable to the frequency counter. Connect the ground/shield test clip to the loop marked TP5 (GND) on the LCM driver board and connect the signal test clip to the loop marked TP1 (CNTR). Set the input impedance on the frequency counter to 50 ohms. Note the frequency being read by the counter. It should be 1000 Hz, ± 0.02 Hz. If the frequency counter is having a difficult time locking on to the frequency, in GFS Tools use [Tools], [Remote Communications] to set up communications with the LCM and send the command CNTR:TEST=1 to the LCM. The LCM will now output a square wave at 500 Hz, ± 0.016 Hz that the counter should have no trouble locking on to. Once the power on the LCM is cycled the frequency will return to its default state. If the frequency is not within the ± 0.035 Hz limit, it can be changed in 0.02 Hz (or 0.016 @ 500 Hz) increments by changing the LCM timer pre-scale coefficient in steps of 1: an increase of 1 lowers the frequency by 0.02 Hz (0.016 Hz), and a decrease raises the frequency by the same amount. In GFS Tools software, use [Setup], [Calibration] to read all of the user level coefficients from the LCM. Change the value of the LCM timer pre-scale coefficient on the Time/Mass tab (see Figure 112) to bring the frequency within the limits and select OK. Cycle the power on the LCM so the coefficient takes effect and/or to reset the LCM frequency to its default state. Repeat steps 2 thru 4 if necessary. Replace the top cover of the LCM. © 2011 Fluke Calibration Page 176 7. MAINTENANCE of TRACEABILITYU and RECALIBRATION Figure 112. Calibration Time/Mass tab 7.5.4 Ambient P, T, H Sensor Adjustment 7.5.4.1 Principle Every LCM includes an ambient barometric pressure sensor (enclosure pressure sensor) which is connected by clear tubing to the inside of the GFS enclosure, and the measured pressure is used as part of the calculation of ambient air density which is used to make the air buoyancy correction to the force applied by either the GFS cylinder/regulator assembly or the Reference Mass. Certain LCM versions may or may not be equipped with ambient temperature and relative humidity sensors, as these sensors are not used by the GFS system. Note Certain LCMs do not contain an ambient Temperature/Humidity board as these are not used by the GFS system for any calculations. The on-board measurement sensors maybe: • Enclosure pressure sensor (AMB) • Relative humidity sensor • Ambient temperature PRT. The ambient conditions sensors are verified and adjusted relative to a reference without being removed from the LCM. If equipped, the relatively wide measurement uncertainty specification of the onboard temperature and humidity sensors and lack of use by the GFS system should be taken into consideration when selecting a reference relative to which to adjust them. They do not require a high level reference. The pressure sensor is an important measurement for the GFS system and has a relatively large effect on the uncertainty analysis. Calibration of this sensor should be done to a high-level reference. Page 177 © 2011 Fluke Calibration GFS2102™ OPERATION AND MAINTENANCE MANUAL For the enclosure pressure sensor and relative humidity sensor, the GFS Tools [Calibration] function reads and writes user defined Adders and Multipliers that are used to offset and, if necessary, adjust the slope of the sensors. The Adders and Multipliers adjust sensor output as follows: Corrected Output = (Measured Output X Multiplier) + Adder Where: • Corrected output and measured output are in the current unit of measure of the sensor • Adder is in the base unit of measure: Pascal (Pa) for pressure, %RH for humidity. • Multiplier is dimensionless For the ambient PRT temperature, the GFS Tools [Calibration] function reads and writes the resistance at 0 ºC (Rzero) and slope values of the PRT. The Rzero and slope adjust the PRT as follows: Corrected Output = (Measured Output – Rzero) / slope Where: • Corrected output is in °C. • Measured output and Rzero are in ohms. • Slope is in ohms per °C, and is fixed at 0.3896 in its operating temperature range (DIN Norm 43760). It is recommended that slope not be adjusted. • The calculation of a new Rzero is described in Section 7.5.4.3. Within GFS Tools, the [Setup], [Calibration], <Ambient> tab provides capabilities to edit the Adders and Multipliers of the ambient sensors and Rzero and slope of the PRT. To calibrate or adjust the on-board sensors, compare their outputs on the LCM front panel display to a reference and adjust the corresponding Adder and/or Multiplier as needed to arrive at acceptable agreement. Normally, only the Adder is used since a one point calibration is being performed. See Section 7.5.4.2 for information on calibration of the enclosure pressure sensor. See Section 7.5.4.3 for information on calibration of the ambient temperature sensor if present. See Section 7.5.4.4 for information on calibration of the ambient relative humidity sensor if present. 1. Current reading of the enclosure pressure sensor in current pressure unit of measure. 2. Current reading of the ambient relative humidity sensor in %RH. 3. Current reading of the ambient temperature PRT in °C. 4. Current reading of the Reference Mass external PRT in °C. 97.003 kPa a 31.00% 22.032°C 23.536°C Figure 113. LCM default front panel display © 2011 Fluke Calibration Page 178 7. MAINTENANCE of TRACEABILITYU and RECALIBRATION 7.5.4.2 Enclosure Pressure Sensor PURPOSE To view and adjust the output of the enclosure pressure sensor. OPERATION The LCM default front panel display shows the output of the enclosure pressure sensor in its upper left corner on power up (see Figure 113). A one point verification against an atmospheric reference is all that is needed. If a full adjustment is desired, at least two points should be selected within the range of the sensor and encompass the range of measurements the sensor may encounter during normal operation. To adjust the values of the Adder and/or the Multiplier use GFS Tools and select the [Setup], [Calibration], <Ambient> tab (see Figure 114) to access a screen in which the values of the Adder and Multiplier can be edited. For a one point verification only the Adder should be adjusted. From here, press OK and wait while the coefficients are uploaded to the LCM. When the upload is complete, cycle the power on the LCM, and the LCM enclosure sensor reading should reflect the newly applied calibration coefficients. Note • See Section 7.5.4 for an explanation of Adders and Multipliers and their use in adjusting internal sensors. • See Section 1.1 specifications. for enclosure pressure sensor Figure 114. Ambient sensors adjustment tab 7.5.4.3 Ambient Temperature Sensor (If Present) PURPOSE To view and adjust the output of the ambient temperature PRT. Page 179 © 2011 Fluke Calibration GFS2102™ OPERATION AND MAINTENANCE MANUAL Note The ambient temperature sensor and External PRT temperature sensor are of the same technology and read in the same manner. However, their recommended calibration procedures differ reflecting the different measurement uncertainty specifications of the two measurements. See Section 7.5.6 for recommended calibration procedure on the External PRT temperature sensor, which is used to measure temperature with much lower uncertainty. Certain LCMs do not contain an ambient Temperature sensor as it is not used by the GFS system for any calculations. The LCM default front panel display shows the output of the ambient temperature PRT in its lower right corner on power up (see Figure 113). A one point verification against an ambient temperature reference is all that is needed. If a full adjustment is desired, at least two points should be selected within the range of the sensor and encompass the range of measurements the sensor may encounter during normal operation. To adjust the value of Rzero use GFS Tools and select the [Setup], [Calibration], <Ambient> tab (see Figure 114) to access a screen in which the Rzero value can be edited. Normally, only Rzero is adjusted. Calculate a new Rzero using the following formula: Rzero(new) = Rzero(current) + ((Tdisplay – Tref)*0.3896) Where: Rzero(new) is the new resistance at 0°C in ohms. Rzero(current) is the current resistance at 0°C in ohms from the <Ambient> tab. Tdisplay is the observed temperature in °C from the LCM display. Tref is the reference temperature reading in °C. From here, press OK and wait while the coefficients are uploaded to the LCM. When the upload is complete, cycle the power on the LCM, and the LCM reading should reflect the newly applied calibration coefficients. Note See Section 1.1 for ambient temperature sensor specifications. 7.5.4.4 Relative Humidity Sensor (If Present) Note Certain LCMs do not contain an ambient Humidity sensor as it is not used by the GFS system for any calculations. PURPOSE To view and adjust the output of the ambient relative humidity sensor. OPERATION The LCM default front panel display shows the output of the ambient relative humidity sensor in its upper right corner on powerup (see Figure 113). © 2011 Fluke Calibration Page 180 7. MAINTENANCE of TRACEABILITYU and RECALIBRATION A one point verification against an ambient humidity reference is all that is needed. If a full adjustment is desired, at least two points should be selected within the range of the sensor and encompass the range of measurements the sensor may encounter during normal operation. To adjust the values of the Adder and/or Multiplier use GFS Tools and select the [Setup], [Calibration], <Ambient> tab (see Figure 114) to access a screen in which the values of the Adder and Multiplier can be edited. Normally, only the Adder is adjusted. From here, press OK and wait while the coefficients are uploaded to the LCM. When the upload is complete, cycle the power on the LCM, and the LCM enclosure sensor reading should reflect the newly applied calibration coefficients. Note 7.5.5 • Novasina salt solutions are an idea reference for the calibration of the TH probe(s) humidity sensor. • See Section 7.5.4 for an explanation of Adders and Multipliers and their use in adjusting internal sensors. • See Section 1.1 for ambient relative humidity sensor specifications. TH Probe Adjustment 7.5.5.1 TH Probe Temperature Sensor PURPOSE To view and adjust the output of the TH probe(s) temperature sensor. OPERATION In GFS Tools use [Tools], [Remote Communications] to set up communications with the LCM and send the command “!KEY=15”. The LCM display will change to show the output of the two TH probes (see Figure 115). Note that the output of TH2 is indicated by “p1” on the LCM display, and TH 3 is indicated by “p2”. A one point verification against a temperature reference is all that is needed. If a full adjustment is desired, at least two points should be selected within the range of the sensor and encompass the range of measurements the sensor may encounter during normal operation. To adjust the values of the Adder and/or the Multiplier use GFS Tools and select the [Setup], [Calibration], <TH Probe #2> or <TH Probe #3> tab (see Figure 116) to access a screen in which the values of the Adder and Multiplier can be edited. Normally, only the Adder is adjusted. From here, press OK and wait while the coefficients are uploaded to the LCM. When the upload is complete, cycle the power on the LCM, and the LCM enclosure sensor reading should reflect the newly applied calibration coefficients. Note • See Section 7.5.4 for an explanation of Adders and Multipliers and their use in adjusting internal sensors. • See Section 1.1 for TH probe sensor specifications. Page 181 © 2011 Fluke Calibration GFS2102™ OPERATION AND MAINTENANCE MANUAL 1. Current relative humidity reading of the first probe, TH Probe #2. 2. Current temperature reading of the first probe, TH Probe #2. 3. Current relative humidity reading of the second probe, TH Probe #3. 4. Current temperature reading of the second probe, TH Probe #3. 39.47% 38.99% 22.41°C 22.53°C p1 p2 Figure 115. LCM TH probe front panel display Figure 116. TH Probe #2 adjustment tab 7.5.5.2 TH Probe Relative Humidity Sensor PURPOSE To view and adjust the output of the TH probe(s) relative humidity sensor. OPERATION If the LCM display is not already displaying the output of the two TH probes (see Figure 115), then in GFS Tools use [Tools], [Remote Communications] to set up communications with the LCM and send the command “!KEY=15”. The LCM display will change to show the output of the two TH probes as shown in Figure 115. Note that the output of TH2 is indicated by “p1” on the LCM display, and TH 3 is indicated by “p2”. A one point verification against a humidity reference is all that is needed. If a full adjustment is desired, at least two points should be selected within the range of the sensor and encompass the range of measurements the sensor may encounter during normal operation. To adjust the values of the Adder and/or the Multiplier use GFS Tools and select the [Setup], [Calibration], <TH #2> or <TH #3> tab (see Figure 116) to access a screen in which the values of the Adder and Multiplier can be edited. Normally, only the Adder is adjusted. From here, press OK and wait while the coefficients are uploaded to the LCM. When the upload is complete, cycle the power on the © 2011 Fluke Calibration Page 182 7. MAINTENANCE of TRACEABILITYU and RECALIBRATION LCM, and the LCM enclosure sensor reading should reflect the newly applied calibration coefficients. Note 7.5.6 • See Section 7.5.4 for an explanation of Adders and Multipliers and their use in adjusting internal sensors. • See Section 1.1 for TH probe sensor specifications. External PRT Temperature Adjustment PURPOSE To view and adjust the output of the external (Reference Mass) PRT. Note The ambient temperature sensor and External PRT temperature sensor are of the same technology and read in the same manner. However, their recommended calibration procedures differ reflecting the different measurement uncertainty specifications of the two measurements. The LCM default front panel display shows the output of the External PRT in its lower left corner on powerup (see Figure 115). It is recommended to calibrate the external PRT with the PRT connected to the LCM. A one point verification against a temperature reference is all that is needed. If a full adjustment is desired, at least two points should be selected within the range of the sensor and encompass the range of measurements the sensor may encounter during normal operation. To adjust the value of Rzero use GFS Tools and select the [Setup], [Calibration], <External PRT> tab (see Figure 117) to access a screen in which the Rzero value can be edited. Normally, only Rzero is adjusted. Calculate a new Rzero using the following formula: Rzero(new) = Rzero(current) + ((Tdisplay – Tref)*0.3896) Where: Rzero(new) is the new Resistance at 0°C in ohms. Rzero(current) is the current resistance at 0°C in ohms from the <External PRT> tab (see Figure 117). Tdisplay is the observed temperature in °C from the LCM display. Tref is the reference temperature reading in °C. From here, press OK and wait while the coefficients are uploaded to the LCM. When the upload is complete, cycle the power on the LCM, and the front display reading should reflect the newly applied calibration coefficients. Note See Section 1.1 for External PRT specifications. Page 183 © 2011 Fluke Calibration GFS2102™ OPERATION AND MAINTENANCE MANUAL Figure 117. External PRT adjustment tab. 7.5.7 Infrared (T5) Cylinder Temperature Adjustment PURPOSE To view and adjust the output of the infrared (T5) Cylinder temperature sensor. OPERATION If the LCM is displaying the main default screen, in GFS Tools use [TOOLS], [REMOTE COMMUNICATIONS] to set up communications with the LCM and send the command “!KEY=15” twice, but if the LCM is displaying the TH probe screen send the command only once. The LCM display will change to show a single temperature that is the output of the IR cylinder temperature sensor. (see Figure 118). When using the IR sensor, it is very important that the sensor be directed at the surface of the GFS Reference Gas Cylinder as the infrared emissivity of the cylinder surface is what the sensor is measuring. Other surfaces or materials will result in an invalid or inaccurate measurement. The IR sensor is NOT a high accuracy device and is only used to measure the cylinder surface temperature to calculate the air buoyancy or to determine when moisture may be condensing on the surface, which will have detrimental effects on system accuracy. A one point verification against a temperature reference is all that is needed. If a full adjustment is desired, at least two points should be selected within the range of the sensor and encompass the range of measurements the sensor may encounter during normal operation. This requires the use of an environmental chamber or oven capable of temperatures above and below ambient, and unless this chamber can be place extremely close to the GFS enclosure, the GFS sidewall column must be disassembled to remove the IR sending unit mounted inside. The depressurized and vented GFS cylinder is then placed in the chamber with the IR sensor pointed at the body of the cylinder and the reference probe on or near the cylinder. When changing temperatures, a minimum of two hours of temperature stabilization after reaching the temperature setting should be allowed before taking a reading. To adjust the values of the Adder and/or the Multiplier use GFS Tools and select the [Setup], [Calibration], <IR Probe T5> tab (see Figure 119) to access a screen in which the values of © 2011 Fluke Calibration Page 184 7. MAINTENANCE of TRACEABILITYU and RECALIBRATION the Adder and Multiplier can be edited. Normally, only the Adder is adjusted. From here, press OK and wait while the coefficients are uploaded to the LCM. When the upload is complete, cycle the power on the LCM, and the LCM enclosure sensor reading should reflect the newly applied calibration coefficients. Note 1. • See Section 7.5.4 for an explanation of Adders and Multipliers and their use in adjusting internal sensors. • See Section 1.1 for Infrared Cylinder sensor specifications. Current Infrared Cylinder temperature reading in °C. 23.3123 Figure 118. LCM IR probe front panel display Figure 119. IR Probe adjustment tab 7.5.8 Standard Resistor Measurement and Adjustment PURPOSE To verify the LCM internal 100 Ohm and 110 Ohm Standard Resistors. Note The measurement and adjustment of the Standard Resistors is only necessary if a problem is suspected with the resistance measurement of the PRT's. Page 185 © 2011 Fluke Calibration GFS2102™ OPERATION AND MAINTENANCE MANUAL PRINCIPAL LCM has an on-board ohmic measurement system for reading the resistance across the two PRTs connected to it, one inside and one external to the LCM. Recommended calibration/verification of the temperature measurement made with these PRT’s is a two-part process. The first part is to test the PRT itself to determine the Rzero and slope of the PRT. This can be done by conventional PRT calibration means. To use the new calibration values, follow Section 7.5.4.3 for the internal PRT, and Section 7.5.6 for the External PRT. The measurement and adjustment of the Standard Resistors is only necessary if a problem is suspected with the resistance measurement of the PRT's. EQUIPMENT REQUIRED Reference multimeter capable of four-wire resistance measurements. LCM Standard Resistor calibration cable included in the GFS2101 accessories. OPERATION Remove the top cover of the LCM Connect the LCM Standard Resistor calibration cable to the LCM main board socket J19. The calibration cable and main board socket are indexed, make sure that they are aligned and connected correctly. Connect the four wires of the Standard Resistor calibration cable to a reference multimeter as outlined in Figure 120, pins 1 thru 4 for the 100 Ohm resistor and pins 5 thru 8 for the 110 Ohm resistor. Record the measured resistance for each second resistor. Use GFS Tools [Tools], [Remote Communications] to set up communications with the LCM and send the command “!STDRES” and the current values for the 100 and 110 Ohm standard resistors will be returned. The two additional comma delimited values returned beyond the resistances should remain unchanged during all of these steps. If the returned values disagree with the current measured values by more than ± 0.01%, use the [Remote Communications] to send the command “!STDRES=xxx.xxx, yyy.yyy” where: xxx.xxx = new value for 100 Ohm resistor yyy.yyy = new value for 110 Ohm resistor Remove the calibration cable, replace the top of the LCM and cycle the power. 1. 100 Ohm Hi Measure 2. 100 Ohm Hi Sense 3. 100 Ohm Lo Measure. 4. 100 Ohm Lo Sense. 5. 110 Ohm Hi Measure 6. 110 Ohm Hi Sense 7. 110 Ohm Lo Measure. 8. 110 Ohm Lo Sense. 9. No Connection. 9 7 5 3 1 Index Arrow 10 8 6 4 2 10. No Connection. Figure 120. View of main board socket J19 or top view of calibration cable © 2011 Fluke Calibration Page 186 7. MAINTENANCE of TRACEABILITYU and RECALIBRATION 7.5.9 LCM Remote Command for Automation The “ALLR” command can be used and parsed to obtain the LCM reading for most outputs needed for the LCM calibration if partial automation is desired. Once sent, a typical response from this command returns: “96965.59, NONE, 24.54, 23.534, 22.231, 29.56, 21.83, 28.51, 21.89, 21.090, NONE, 76290443.977” 1 2 3 4 5 6 7 8 9 10 11 12 Where: 1) 2) 3) 4) 5) 6) 7) 8) 9) 10) 11) 12) Barometric (Enclosure) pressure in Pascal Secondary pressure sensor (NONE = not installed) Ambient % relative humidity (NONE = not installed) Ambient PRT temperature in °C (NONE = not installed) External (Reference Mass) PRT temperature in °C TH Probe #2 percent relative humidity TH Probe #2 temperature in °C TH Probe #3 percent relative humidity TH Probe #3 temperature in °C Infrared cylinder temperature in °C Proximity sensor (NONE = not installed) Elapsed time in milliseconds since last powerup, restart, or rollover. This command can be used in conjunction with data collection software such as COMPASS® to help in automating the calibration of the LCM. For example, if the relative humidity for TH Probe #2 is being measured, all data before the first 5 commas can be stripped. For time calibration or verification, the time does not need to be reset to be used effectively. Simply use: Elapsed Time (seconds) = Time reading (End) – Time reading (Start) / 1000 7.5.10 LCM Front Panel Display modification The main default information on the front panel display of the LCM can be rearranged using the !OPTDISP remote command without impacting its interaction with the GFS system or GFS Tools. !OPTDISP(=n,n,n,n,n,n,n,n,n,n,n,n) Description: Specify a custom run screen The run screen can be setup to specify up to 12 sensor measurements. Up to four sensor measurements can be displayed on the screen at a time, with up to 3 screens for a total of 12 measurements. Arguments: n: Sensor type (12 arguments). Up to 11 types can be specified in up to 12 locations. The first one determines what sensor will be displayed at the first display location, the second argument for the 2nd etc. If they are ALL ‘0’, then the normal LCM display will be used: ‘0’ No sensor displayed ‘1’ TH Probe#2 RH ‘2’ TH Probe#2 Temperature ‘3’ TH Probe#3 RH ‘4’ TH Probe#3 Temperature ‘5’ Tunnel sensor RH ‘6’ Tunnel sensor Temperature (PRT) ‘7’ External PRT Temperature ‘8’ IR sensor Temperature ‘9’ Unused Sensor ‘10’ RPT #1 (Paros or utility/Barometer) ‘11’ RPT #2 (Paros or utility/Barometer) Example: Reply: !OPTDISP=10,8,7,6,0,0,0,0,0,0,0,0 n,n,n,n n,n,n,n,n,n,n,n Page 187 © 2011 Fluke Calibration GFS2102™ OPERATION AND MAINTENANCE MANUAL 7.6 molbox Recalibration The molbox1 is recalibrated per the molbox Operation and Maintenance Manual, Maintenance, Adjustments and Calibration section. One year calibration interval recommended. 7.7 MFC-CB Recalibration The MFC-CB is recalibrated per the MFC-CB™ Operation and Maintenance Manual, Maintenance, Adjustments and Calibration section. 7.8 Balance Recalibration Three options are available for balance recalibration: internal balance calibration, balance zero and span through GFS Tools, or manual span verification using the GFS mass carrier MS-2102-CAR and calibrated weights. The internal balance calibration is performed using the internal calibration weight which is not user adjustable. The balance zero and span is performed semi-automatically by GFS Tools using the AMH-GFS2102 zero load and Reference Mass load positions, then calculates and applies a mass span multiplier seen on the [TIME/MASS] tab in Section 5.5.7.1. Manual span verification with the GFS mass carrier MS-2102-CAR is performed by replacing the Reference Gas Cylinder with the mass carrier and operating the AMH to raise and lower the carrier while adding or removing calibrated weights. While the first two options are only available by running one of the three test options in GFS Tools, the [Run Diagnostic Test] option is easiest as it bypasses many unnecessary steps not required for the balance. The [Run Test Definition] option is not recommended as all manual operations would have to occur around all of the automated functions in this type of test. 7.8.1 Internal Balance Calibration Run one of the [Run][Run Test] options in GFS Tools to activate the communications interface to the balance and AMH (Run Diagnostic Test is recommended). Operate the AMH from the GFS Run Screen window using the Control Toolbar to removed all mass from the balance (see Section 5.1.5.2.3). Display the balance interface by using the drop-down arrow next the GFS Run Screen icon on the Main Toolbar and selecting [Balance Interface] (see Section 5.1.4.2). Activate the internal calibration by selecting the Balance Calibration icon on the Balance Interface (see Section 5.1.5.4). The internal calibration may take several minutes. Wait until the interface indicates the calibration is complete. After using this option, the user must re-set the [Setup][Calibration][Mass/Time]<Mass Span Multiplier> back to 1 or rerun the GFS Tools Zero and Span function. Failure to do so will result in an erroneous correction being applied to the balance output leading to erroneous data. 7.8.2 GFS Tools Zero and Span Calibration Run one of the [Run][Run Test] options in GFS Tools to activate the communications interface to the balance. Select the “Zero and Span” option on the GFS main run screen Control Toolbar (see Section 5.1.5.2.3). © 2011 Fluke Calibration Page 188 7. MAINTENANCE of TRACEABILITYU and RECALIBRATION The GFS Tools software will automatically operate the AMH to perform a zero and span test of the balance, then calculate and apply a new Mass Span Multiplier under the [Setup][Calibration][Mass/Time] tab. 7.8.3 Verification by Mass Carrier This section can be used to verify the repeatability and linearity of the balance over the range of actual use (approximately 1.6kg to 2.3kg) for customer purposes such as an independent uncertainty analysis of the GFS system. No internal or external adjustments are made to the balance output by this operation, and only linearity over the above stated range should be considered as no compensation is made for air buoyancy. This section requires the supplied MS-2102-0.7 mass set, which includes a mass carrier, three 200g weights, and one 100g weight. Run one of the [Run][Run Test] options in GFS Tools to activate the communications interface to the balance and AMH. Display the balance interface by using the drop-down arrow next the GFS Run Screen icon on the Main Toolbar and selecting [Balance Interface] (see Section 5.1.4.2). Operate the AMH from the GFS Run Screen window using the Control Toolbar to removed all mass from the balance (see Section 5.1.5.2.3). Disconnect the catenary tube and remove the Reference Gas Cylinder from the AMH. Install the mass carrier in the AMH with the legs in the same orientation as the Reference Gas Cylinder would be. Due to differences in manufacturing between the Reference Gas Cylinder carrier and the mass carrier some fine adjustment of the AMH may be required for proper operation. Operate the AMH from the GFS Run Screen window using the Control Toolbar to lower the mass carrier onto the balance (see Section 5.1.5.2.3). If a Balance Output window displays a mass value near 1600g and stable within ±1mg then no alignment is necessary. Otherwise refer to Section 3.3.12 for fine adjustment of the AMH position. Using different combinations of the 100g and 200g weights, the span and repeatability of the balance can be checked in 100g increments between approximately 1.6kg and 2.3kg as desired for the purpose of the verification, and the balance output can be observed from the Balance Interface window. When switching back to the Reference Gas Cylinder from the mass carrier, refer to the sections noted in step if re-alignment of the AMH is required for proper operation with the Reference Gas Cylinder. Page 189 © 2011 Fluke Calibration GFS2102™ OPERATION AND MAINTENANCE MANUAL Notes © 2011 Fluke Calibration Page 190 8. Troubleshooting 8.1 Overview GFS2102 is a sophisticated mass flow measuring instrument with software and components that have advanced features and functions. Before assuming that unexpected behavior is caused by a system defect or breakdown, the operator should use this manual and other training facilities to become thoroughly familiar with GFS2102 operation. This troubleshooting guide is intended as an aid in identifying the cause of unexpected GFS2102 behavior and determining whether the behavior is due to normal operation or an internal or external problem. Identify the symptom or unexpected behavior you are observing from the SYMPTOM list below. A PROBABLE CAUSE is provided and a SOLUTION is proposed including references to manual sections that provide information that may be of assistance. Table 67. Troubleshooting checklist SYMPTOM PROBABLE CAUSE SOLUTION MFC-CB or molbox1 front panel display is dim. Screen saver option has been activated. Press any key to resume full screen power, adjust screen saver activation time if desired. Product Operation and Maintenance Manual Communication with an GFS component cannot be established. Computer and/or component interface not correctly configured; incorrect or bad interface cable. Check and correct interface configurations and cables if necessary. Check interface configuration in GFS Tools, [Setup], [Configuration]. Run product COM port test. Product Operation and Maintenance Manual. GFS component displays <FATAL ERROR> or <FATAL FAULT>. Component encountered unresolved internal software conflict. Cycle component power to clear. Record conditions leading up to the event, including the numbers displayed when enter is pressed and report the information to a Fluke Calibration Authorized Service Provider. GFS component displays <******> or <OVERFLOW> where a numerical value should be. Number to be displayed is too large for allocated space. Usually due to an erroneous setting or measurement causing an out of limit high value to be calculated. Check settings that may be causing an out of limit high measurement and adjust if necessary. Product Operation and Maintenance Manual The LCM run screen is not the normal MAIN run screen. The TH PROBE or IR PROBE run screen is being displayed, or the !OPTDISP command was used to rearrange displayed outputs. Operation is normal. Use [Tools],[Remote Communications] to send the command “!KEY=15” until the normal run screen is displayed. Excessive negative DUT offset that is more pronounced at lower flows. There is a leak in the flow path or the device under test itself. Locate and correct leak. Page 191 © 2011 Fluke Calibration GFS2102™ OPERATION AND MAINTENANCE MANUAL SYMPTOM Unable to set flow for DUT and GFS. PROBABLE CAUSE MFC-CB cable to MFC loose or disconnected. Isolation valve not automated. SOLUTION Abort test, flow control, or power down MFCCB prior to reconnecting cable to avoid sudden spike in flow. In GFS Tools [Setup], [Configuration], [System] tab, “Automate external isolation valve” needs to be checked. Calculated setpoint to MFC-CB greater than 6 volts DC or 20mA or less than 0.2 volts or 4mA. Check MFC range in current gas. Setpoints higher than indicated limits will be rejected by MFC-CB, setpoints below lower limits may be insufficient to activate the MFC valve. Manual valve in flow path is closed. Check to ensure all valves in the flow path are open. Automated flow regulation is not increasing or decreasing flow as expected. Flow regulation not selected. Select flow regulation option and allow sufficient regulation delay time between regulation adjustments. GFS Tools displays <LCM remote command error> or <MFC-CB> remote command error. GFS Tools, MFC-CB, or LCM has incorrect COM settings which do not match. Check and correct interface configurations and cables if necessary. Check LCM interface configuration in GFS Tools, [Setup], [Configuration]. Check MFC-CB interface configuration under [Setup], [Support Device]. Run product COM port test. Product Operation and Maintenance Manual. Indicated GFS Flow is varying dramatically with a relatively stable DUT flow. One or more legs of the GFS Reference Gas Cylinder carrier assembly are touching the brass inserts of the AMH. Check alignment and correct if necessary. See Section 3.3.12. One or more of the LCM probes has lost communication with the LCM. Abort the test. Check all LCM probe connections and cycle power on the LCM. © 2011 Fluke Calibration Page 192 9. Appendix 9.1 Glossary Absolute As in absolute pressure. Pressure expressed relative to vacuum. Accumulation A single GFS flow measurement that is accomplished by measuring the change in mass and time at one flow rate. GFS Tools PC-based software program used as the interface to the GFS2102 system. Sample A depending upon the flow rate and a setting that requires a fixed amount of mass to change to get meaningful data, of all the measurements read from the balance and time stamped by the LCM during and accumulation, less frequent updates or samples of these measurements of mass and time are selected for use by GFS Tools. Average Flow A simple average of discrete flow values at the defined sample interval since the beginning of an accumulation. Best Fit Flow The best fit flow as determined by calculating a real time best fit at the defined sample rate since the beginning of an accumulation, with the fit forced through zero. AMH (AMH-GFS2102) Automated mass handler; specialized platform for vertical actuation of the reference gas cylinder and reference mass on and off the custom mass tray, especially for AutoZero function. DUT Device under test; the item being tested or calibrated by GFS, often a molbloc. FS (Full Scale) The full scale value is the maximum value or the span of a measurement range. Limits and specifications are often expressed as % FS. Condensation Drops of water that form on a surface (like the reference gas cylinder while flowing) when the surface temperature drops below the dew point of the surrounding air. Gauge As in gauge pressure. Pressure expressed relative to atmospheric pressure. Dew point The temperature at which air cannot hold all of the moisture in it and condensation begins to form. Reference Mass The nominally 2.0 kg calibrated mass ring supported by a plate of the AMH-GFS2102 that is used for the AutoZero and balance span functions. Enhanced molbloc molblocs produced or upgraded since September 2010 with increased storage, flow calculations made with gas properties based upon NIST Reference Properties 7, "named" gas calibrations, and options for tighter uncertainties. Legacy molbloc The original molbloc type and uncertainty produced prior to September 2010 with less memory storage and flow calculations made with Air Liquid gas properties. LCM Laboratory conditions monitor. LCM is a stand-alone device that is the central data collection component of GFS2102. MFC-CB MFC control box. MFC-CB is a GFS system component used for sending analog flow set point signals to mass flow controllers, and possibly for reading DUT analog output. MFC Mass flow controller. Used for setting stable flows in the GFS system. Gravimetric Relating to or using the measurement of weight. The principle used for GFS flow measurements. Reference Gas Cylinder The cylinder that is weighed by the GFS balance as gas in flowing out of it through the other system components. TH probe Temperature and humidity probes used to measure the conditions of the air surrounding the reference gas cylinder assembly. Catenary The natural curve adopted by a length of cable, rope, or chain of uniform density, hanging between two points; the shape used for the flow conveyance loop between the reference gas cylinder and the GFS draft enclosure. IR (Infrared) Radiation of wavelength just longer than visible light. IR sensors can be used to measure a surface temperature. PRT Platinum Resistance Thermometer. The element used to measure temperature inside the AMHGFS2102 platform near the balance. Air buoyancy The upward force on a body which much be compensated for in mass measurements, related to the density and volume of air displaced by the body. Page 193 © 2011 Fluke Calibration GFS2102™ OPERATION AND MAINTENANCE MANUAL 9.2 Typical Test Setups © 2011 Fluke Calibration Page 194 9. APPENDIX 9.3 Typical Test Definition Timeline Page 195 © 2011 Fluke Calibration GFS2102™ OPERATION AND MAINTENANCE MANUAL 9.4 GFS Electrical Schematic © 2011 Fluke Calibration Page 196 8. TROUBLESHOOTING 9.5 GFS Pneumatic Schematic Page 197 © 2011 Fluke Calibration GFS2102™ OPERATION AND MAINTENANCE MANUAL 9.6 Limited Warranty and Limitation of Liability Each Fluke product is warranted to be free from defects in material and workmanship under normal use and service. The warranty period is one year and begins on the date of shipment. Parts, product repairs and services are warranted for 90 days. This warranty extends only to the original buyer or end-user customer of a Fluke authorized reseller, and does not apply to fuses, disposable batteries or to any product which, in Fluke's opinion, has been misused, altered, neglected, contaminated, or damaged by accident or abnormal conditions of operation or handling. Fluke warrants that software will operate substantially in accordance with its functional specifications for 90 days and that it has been properly recorded on non-defective media. Fluke does not warrant that software will be error free or operate without interruption. Fluke authorized resellers shall extend this warranty on new and unused products to end-user customers only but have no authority to extend a greater or different warranty on behalf of Fluke. Warranty support is available only if product is purchased through a Fluke authorized sales outlet or Buyer has paid the applicable international price. Fluke reserves the right to invoice Buyer for importation costs of repair/replacement parts when product purchased in one country is submitted for repair in another country. Fluke's warranty obligation is limited, at Fluke's option, to refund of the purchase price, free of charge repair, or replacement of a defective product which is returned to a Fluke authorized service center within the warranty period. To obtain warranty service, contact your nearest Fluke authorized service center to obtain return authorization information, then send the product to that service center, with a description of the difficulty, postage and insurance prepaid (FOB Destination). Fluke assumes no risk for damage in transit. Following warranty repair, the product will be returned to Buyer, transportation prepaid (FOB Destination). If Fluke determines that failure was caused by neglect, misuse, contamination, alteration, accident or abnormal condition of operation or handling, including overvoltage failures caused by use outside the product’s specified rating, or normal wear and tear of mechanical components, Fluke will provide an estimate of repair costs and obtain authorization before commencing the work. Following repair, the product will be returned to the Buyer transportation prepaid and the Buyer will be billed for the repair and return transportation charges (FOB Shipping Point). THIS WARRANTY IS BUYER'S SOLE AND EXCLUSIVE REMEDY AND IS IN LIEU OF ALL OTHER WARRANTIES, EXPRESS OR IMPLIED, INCLUDING BUT NOT LIMITED TO ANY IMPLIED WARRANTY OF MERCHANTABILITY OR FITNESS FOR A PARTICULAR PURPOSE. FLUKE SHALL NOT BE LIABLE FOR ANY SPECIAL, INDIRECT, INCIDENTAL OR CONSEQUENTIAL DAMAGES OR LOSSES, INCLUDING LOSS OF DATA, ARISING FROM ANY CAUSE OR THEORY. Since some countries or states do not allow limitation of the term of an implied warranty, or exclusion or limitation of incidental or consequential damages, the limitations and exclusions of this warranty may not apply to every buyer. If any provision of this Warranty is held invalid or unenforceable by a court or other decision-maker of competent jurisdiction, such holding will not affect the validity or enforceability of any other provision. Fluke Corporation P.O. Box 9090 Everett, WA 98206-9090 U.S.A. © 2011 Fluke Calibration Fluke Europe B.V. P.O. Box 1186 5602 BD Eindhoven The Netherlands Page 198 8. TROUBLESHOOTING Table 68. Fluke Calibration Authorized Service Providers Fluke Calibration Authorized Service Providers www.flukecal.com COMPANY TELEPHONE, FAX AND EMAIL Fluke Calibration US Customer Service (Regional) Tel: 1-877-355-3225 Fluke Do Brazil (Brazil) Tel: (11) 3759-7600 Fax: (11) 3759-7630 NORMAL SUPPORT REGION North America [email protected] South America [email protected] Minerva Meettechniek BV Tel: +31/33.46.22.000 [email protected] Europe, Middle East, Africa europascal GmbH Tel: +49 61 81 42 309 0 Fax: +49 61 81 42 309 22 Germany, Austria, and Switzerland [email protected] Ohte Giken Inc. Technology Center Tel: 81/29.840.9111 Fluke South East Asia PTE LTD Tel: 65 6799-5588 Fax: 65 6799-5589 Japan Fax: 81/29.840.9100 [email protected] Southeast Asia [email protected] Fluke Int'l Corporation Tel: +86-10-400-810-3435, Ext 2 Peoples Republic of China [email protected] Fluke Australia Pty LTD Tel: +61-2-9771-9300 Pacific Rim [email protected] Page 199 © 2011 Fluke Calibration GFS2102™ OPERATION AND MAINTENANCE MANUAL Notes © 2011 Fluke Calibration Page 200