1
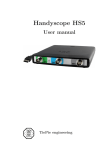
Handyprobe HP3
User manual
TiePie engineering
ATTENTION!
Measuring directly on the line voltage can be very dangerous.
c
Copyright 2015
TiePie engineering.
All rights reserved.
Revision 2.13, September 2015
Despite the care taken for the compilation of this
user manual, TiePie engineering can not be held
responsible for any damage resulting from errors
that may appear in this manual.
Contents
1 Safety
1
2 Declaration of conformity
3
3 Introduction
3.1 Differential input . . .
3.1.1 Differential test
3.2 Sampling . . . . . . .
3.3 Sample frequency . . .
3.3.1 Aliasing . . . .
3.4 Digitizing . . . . . . .
3.5 Signal coupling . . . .
. . .
lead
. . .
. . .
. . .
. . .
. . .
.
.
.
.
.
.
.
.
.
.
.
.
.
.
.
.
.
.
.
.
.
.
.
.
.
.
.
.
.
.
.
.
.
.
.
.
.
.
.
.
.
.
.
.
.
.
.
.
.
.
.
.
.
.
.
.
.
.
.
.
.
.
.
.
.
.
.
.
.
.
.
.
.
.
.
.
.
.
.
.
.
.
.
.
.
.
.
.
.
.
.
5
. 5
. 7
. 7
. 8
. 9
. 11
. 11
4 Driver installation
13
4.1 Introduction . . . . . . . . . . . . . . . . . . . . . . . 13
4.2 Where to find the driver setup . . . . . . . . . . . . 13
4.3 Executing the installation utility . . . . . . . . . . . 13
5 Hardware installation
5.1 Power the instrument . . . . . . . . . .
5.2 Connect the instrument to the computer
5.2.1 Found New Hardware Wizard . .
5.3 Plug into a different USB port . . . . .
.
.
.
.
.
.
.
.
.
.
.
.
.
.
.
.
.
.
.
.
.
.
.
.
.
.
.
.
19
19
19
20
22
6 Specifications
6.1 Acquisition system . . . . . . .
6.2 Banana input CH1 . . . . . . .
6.3 Trigger system . . . . . . . . .
6.4 Interface . . . . . . . . . . . . .
6.5 Power . . . . . . . . . . . . . .
6.6 Physical . . . . . . . . . . . . .
6.7 I/O connectors . . . . . . . . .
6.8 System requirements . . . . . .
6.9 Environmental conditions . . .
6.10 Certifications and Compliances
6.11 Measure lead . . . . . . . . . .
6.12 Package contents . . . . . . . .
.
.
.
.
.
.
.
.
.
.
.
.
.
.
.
.
.
.
.
.
.
.
.
.
.
.
.
.
.
.
.
.
.
.
.
.
.
.
.
.
.
.
.
.
.
.
.
.
.
.
.
.
.
.
.
.
.
.
.
.
.
.
.
.
.
.
.
.
.
.
.
.
.
.
.
.
.
.
.
.
.
.
.
.
23
23
23
23
24
24
24
24
24
24
25
25
25
.
.
.
.
.
.
.
.
.
.
.
.
.
.
.
.
.
.
.
.
.
.
.
.
.
.
.
.
.
.
.
.
.
.
.
.
.
.
.
.
.
.
.
.
.
.
.
.
.
.
.
.
.
.
.
.
.
.
.
.
Contents
I
II
Safety
1
When working with electricity, no instrument can guarantee complete safety. It is the responsibility of the person
who works with the instrument to operate it in a safe way.
Maximum security is achieved by selecting the proper instruments and following safe working procedures. Safe
working tips are given below:
• Always work according (local) regulations.
• Work on installations with voltages higher than 25 VAC or
60 VDC should only be performed by qualified personnel.
• Avoid working alone.
• Observe all indications on the Handyprobe HP3 before connecting any wiring
• The Handyprobe HP3 is designed for CAT II measurement
category: Maximum working voltage 600 VRMS or 800 VDC .
Do not exceed the rated voltage.
• Check the probes/test leads for damages. Do not use them
if they are damaged
• Take care when measuring at voltages higher than 25 VAC or
60 VDC .
• Do not operate the equipment in an explosive atmosphere or
in the presence of flammable gases or fumes.
• Do not use the equipment if it does not operate properly.
Have the equipment inspected by qualified service personal.
If necessary, return the equipment to TiePie engineering for
service and repair to ensure that safety features are maintained.
Safety
1
2
Chapter 1
Declaration of conformity
2
TiePie engineering
Koperslagersstraat 37
8601 WL Sneek
The Netherlands
EC Declaration of conformity
We declare, on our own responsibility, that the product
Handyprobe HP3-5
Handyprobe HP3-20
Handyprobe HP3-100
for which this declaration is valid, is in compliance with
EN 55011:2009/A1:2010
EN 55022:2006/A1:2007
IEC 61000-6-1/EN 61000-6-1:2007
IEC 61000-6-3/EN 61000-6-3:2007
according the conditions of the EMC standard 2004/108/EC
and also with
Canada: ICES-001:2004
Australia/New Zealand: AS/NZS
Sneek, 1-11-2010
ir. A.P.W.M. Poelsma
Declaration of conformity
3
Environmental considerations
This section provides information about the environmental impact
of the Handyprobe HP3.
Handyprobe HP3 end-of-life handling
Production of the Handyprobe HP3 required the extraction and use
of natural resources. The equipment may contain substances that
could be harmful to the environment or human health if improperly
handled at the Handyprobe HP3’s end of life.
In order to avoid release of such substances into the environment
and to reduce the use of natural resources, recycle the Handyprobe
HP3 in an appropriate system that will ensure that most of the
materials are reused or recycled appropriately.
The symbol shown below indicates that the Handyprobe HP3
complies with the European Union’s requirements according to Directive 2002/96/EC on waste electrical and electronic equipment
(WEEE).
Restriction of Hazardous Substances
The Handyprobe HP3 has been classified as Monitoring and Control equipment, and is outside the scope of the 2002/95/EC RoHS
Directive.
4
Chapter 2
Introduction
3
Before using the Handyprobe HP3 first read chapter 1 about
safety.
Many technicians investigate electrical signals. Though the
measurement may not be electrical, the physical variable is often converted to an electrical signal, with a special transducer.
Common transducers are accelerometers, pressure probes, current
clamps and temperature probes. The advantages of converting the
physical parameters to electrical signals are large, since many instruments for examining electrical signals are available.
The Handyprobe HP3 is a single channel, 10 bits, 100 MSamples/s measuring instrument with differential input with high input
range.
With the accompanying software the Handyprobe HP3 can be
used as an oscilloscope, a spectrum analyzer, a true RMS voltmeter
or a transient recorder. All instruments measure by sampling the
input signals, digitizing the values, process them, save them and
display them.
3.1 Differential input
Most oscilloscopes are equipped with standard, single ended inputs,
which are referenced to ground. This means that one side of the
input is always connected to ground and the other side to the point
of interest in the circuit under test.
Introduction
5
Figure 3.1: Single ended input
Therefore the voltage that is measured with an oscilloscope with
standard, single ended inputs is always measured between that
specific point and ground.
When the voltage is not referenced to ground, connecting a
standard single ended oscilloscope input to the two points would
create a short circuit between one of the points and ground, possibly damaging the circuit and the oscilloscope.
A safe way would be to measure the voltage at one of the two
points, in reference to ground and at the other point, in reference to
ground and then calculate the voltage difference between the two
points. On most oscilloscopes this can be done by connecting one
of the channels to one point and another channel to the other point
and then use the math function CH1 - CH2 in the oscilloscope to
display the actual voltage difference.
There are some disadvantages to this method:
• a short circuit to ground can be created when an input is
wrongly connected
• to measure one signal, two channels are occupied
• by using two channels, the measurement error is increased,
the errors made on each channel will be combined, resulting
in a larger total measurement error
• The Common Mode Rejection Ratio (CMRR) of this method
is relatively low. If both points have a relative high voltage,
but the voltage difference between the two points is small,
the voltage difference can only be measured in a high input
range, resulting in a low resolution
A much better way is to use an oscilloscope with a differential
input.
6
Chapter 3
Figure 3.2: Differential input
A differential input is not referenced to ground, but both sides
of the input are ”floating”. It is therefore possible to connect one
side of the input to one point in the circuit and the other side of
the input to the other point in the circuit and measure the voltage
difference directly.
Advantages of a differential input:
• No risk of creating a short circuit to ground
• Only one channel is required to measure the signal
• More accurate measurements, since only one channel introduces a measurement error
• The CMRR of a differential input is high. If both points have
a relative high voltage, but the voltage difference between the
two points is small, the voltage difference can be measured
in a low input range, resulting in a high resolution
3.1.1
Differential test lead
The Handyprobe HP3 comes with a special differential test lead.
This test lead is specially designed to ensure a good CMRR.
The special heat resistant differential test lead provided with
the Handyprobe HP3 is designed to be immune for noise from the
surrounding environment.
3.2 Sampling
When sampling the input signal, samples are taken at fixed intervals. At these intervals, the size of the input signal is converted to a
number. The accuracy of this number depends on the resolution of
the instrument. The higher the resolution, the smaller the voltage
Introduction
7
steps in which the input range of the instrument is divided. The
acquired numbers can be used for various purposes, e.g. to create
a graph.
Figure 3.3: Sampling
The sine wave in figure 3.3 is sampled at the dot positions. By
connecting the adjacent samples, the original signal can be reconstructed from the samples. You can see the result in figure 3.4.
Figure 3.4: ”connecting” the samples
3.3 Sample frequency
The rate at which the samples are taken is called the sampling
frequency, the number of samples per second. A higher sampling
frequency corresponds to a shorter interval between the samples.
As is visible in figure 3.5, with a higher sampling frequency, the
8
Chapter 3
original signal can be reconstructed much better from the measured
samples.
Figure 3.5: The effect of the sampling frequency
The sampling frequency must be higher than 2 times the highest frequency in the input signal. This is called the Nyquist frequency. Theoretically it is possible to reconstruct the input signal
with more than 2 samples per period. In practice, 10 to 20 samples per period are recommended to be able to examine the signal
thoroughly.
3.3.1
Aliasing
When sampling an analog signal with a certain sampling frequency,
signals appear in the output with frequencies equal to the sum and
difference of the signal frequency and multiples of the sampling
frequency. For example, when the sampling frequency is 1000 Hz
and the signal frequency is 1250 Hz, the following signal frequencies
will be present in the output data:
Multiple of sampling frequency
1250 Hz signal
-1250 Hz signal
-1000
-1000 + 1250 = 250
-1000 - 1250 = -2250
0
0 + 1250 = 1250
1000
1000 + 1250 = 2250
1000 - 1250 =
-250
2000
2000 + 1250 = 3250
2000 - 1250 =
750
...
0 - 1250 = -1250
...
Table 3.1: Aliasing
Introduction
9
As stated before, when sampling a signal, only frequencies lower
than half the sampling frequency can be reconstructed. In this
case the sampling frequency is 1000 Hz, so we can we only observe
signals with a frequency ranging from 0 to 500 Hz. This means
that from the resulting frequencies in the table, we can only see
the 250 Hz signal in the sampled data. This signal is called an
alias of the original signal.
If the sampling frequency is lower than twice the frequency of
the input signal, aliasing will occur. The following illustration
shows what happens.
Figure 3.6: Aliasing
In figure 3.6, the green input signal (top) is a triangular signal
with a frequency of 1.25 kHz. The signal is sampled with a frequency of 1 kHz. The corresponding sampling interval is 1/1000Hz
= 1ms. The positions at which the signal is sampled are depicted
with the blue dots. The red dotted signal (bottom) is the result
of the reconstruction. The period time of this triangular signal
appears to be 4 ms, which corresponds to an apparent frequency
(alias) of 250 Hz (1.25 kHz - 1 kHz).
To avoid aliasing, always start measuring at the highest sampling frequency and lower the sampling frequency if required.
10
Chapter 3
3.4 Digitizing
When digitizing the samples, the voltage at each sample time is
converted to a number. This is done by comparing the voltage
with a number of levels. The resulting number is the number corresponding to the level that is closest to the voltage. The number
of levels is determined by the resolution, according to the following
relation: LevelCount = 2Resolution .
The higher the resolution, the more levels are available and
the more accurate the input signal can be reconstructed. In figure
3.7, the same signal is digitized, using two different amounts of
levels: 16 (4-bit) and 64 (6-bit).
Figure 3.7: The effect of the resolution
The Handyprobe HP3 measures at 10 bit resolution (210 =1024
levels). The smallest detectable voltage step depends on the input
range. This voltage can be calculated as:
V oltageStep = F ullInputRange/LevelCount
For example, the 200 mV range ranges from -200 mV to +200
mV, therefore the full range is 400 mV. This results in a smallest
detectable voltage step of 0.400V/1024 = 0.3906mV.
3.5 Signal coupling
The Handyprobe HP3 has two different settings for the signal coupling: AC and DC. In the setting DC, the signal is directly coupled
Introduction
11
to the input circuit. All signal components available in the input
signal will arrive at the input circuit and will be measured.
In the setting AC, a capacitor will be placed between the input
connector and the input circuit. This capacitor will block all DC
components of the input signal and let all AC components pass
through. This can be used to remove a large DC component of the
input signal, to be able to measure a small AC component at high
resolution.
When measuring DC signals, make sure to set the signal
coupling of the input to DC.
12
Chapter 3
4
Driver installation
Before connecting the Handyprobe HP3 to the computer,
the drivers need to be installed.
4.1 Introduction
To operate a Handyprobe HP3, a driver is required to interface
between the measurement software and the instrument. This driver
takes care of the low level communication between the computer
and the instrument, through USB. When the driver is not installed,
or an old, no longer compatible version of the driver is installed, the
software will not be able to operate the Handyprobe HP3 properly
or even detect it at all.
The installation of the USB driver is done in a few steps. Firstly,
the driver has to be pre-installed by the driver setup program. This
makes sure that all required files are located where Windows can
find them. When the instrument is plugged in, Windows will detect
new hardware and install the required drivers.
4.2 Where to find the driver setup
The driver setup program and measurement software can be found
in the download section on TiePie engineering’s website and on the
CD-ROM that came with the instrument. It is recommended to
install the latest version of the software and USB driver from the
website. This will guarantee the latest features are included.
4.3 Executing the installation utility
To start the driver installation, execute the downloaded driver
setup program, or the one on the CD-ROM that came with the
instrument. The driver install utility can be used for a first time
Driver installation
13
installation of a driver on a system and also to update an existing
driver.
The screen shots in this description may differ from the ones
displayed on your computer, depending on the Windows version.
Figure 4.1: Driver install: step 1
When drivers were already installed, the install utility will remove them before installing the new driver. To remove the old
driver successfully, it is essential that the Handyprobe HP3 is
disconnected from the computer prior to starting the driver install
utility.
14
Chapter 4
Figure 4.2: Driver install: step 2
When the instrument is still connected, the driver install utility
will recognize it and report this. You will be asked to continue
anyway.
Figure 4.3: Driver install: Instrument is still connected
Clicking ”No” will bring back the previous screen. The instrument should now be disconnected. Then the removal of the existing
driver can be continued by clicking ”Next”.
Clicking ”Yes” will ignore the fact that the instrument is still
connected and continue removal of the old driver. This option is
not recommended, as removal may fail, after which installation of
the new driver may fail as well.
When no existing driver was found or the existing driver is
removed, the location for the pre-installation of the new driver can
be selected.
Driver installation
15
Figure 4.4: Driver install: step 3
On Windows XP and newer, the installation may inform about
the drivers not being ”Windows Logo Tested”. The driver is not
causing any danger for your system and can be safely installed.
Please ignore this warning and continue the installation.
Figure 4.5: Driver install: step 4
The driver install utility now has enough information and can
install the drivers. Clicking ”Install” will remove existing drivers
and install the new driver. A remove entry for the new driver is
added to the software applet in the Windows control panel.
16
Chapter 4
Figure 4.6: Driver install: step 5
As mentioned, Windows XP SP2 and newer may warn for the
USB drivers not being Windows Logo tested. Please ignore this
warning and continue anyway.
Figure 4.7: Driver install: Ignore warning and continue
Driver installation
17
Figure 4.8: Driver install: Finished
18
Chapter 4
Hardware installation
5
Drivers have to be installed before the Handyprobe HP3 is
connected to the computer for the first time. See chapter 4
for more information.
5.1 Power the instrument
The Handyprobe HP3 is powered by the USB, no external power
supply is required. Only connect the Handyprobe HP3 to a bus
powered USB port, otherwise it may not get enough power to operate properly.
5.2 Connect the instrument to the computer
After the new driver has been pre-installed (see chapter 4), the
Handyprobe HP3 can be connected to the computer. When the
Handyprobe HP3 is connected to a USB port of the computer,
Windows will report new hardware. The Found New Hardware
Wizard will appear.
Depending on the Windows version, the New Hardware Wizard
will show a number of screens in which it will ask for information
regarding the drivers of the newly found hardware. The appearance
of the dialogs will differ for each Windows version and might be
different on the computer where the Handyprobe HP3 is installed.
The driver consists of two parts which are installed separately.
Once the first part is installed, the installation of the second
part will start automatically. Installation of the second part is
identical to the first part, therefore they are not described individually here.
Hardware installation
19
5.2.1
Found New Hardware Wizard
Figure 5.1: Hardware install: step 1
This window will only be shown in Windows XP SP2 or newer.
No drivers for the Handyprobe HP3 can be found on the Windows
Update Web site, so select ”No, not this time” and click ”Next”.
Figure 5.2: Hardware install: step 2
20
Chapter 5
Since the drivers are already pre-installed on the computer,
Windows will be able to find them automatically. Select ”Install
the software automatically” and click ”Next”.
Figure 5.3: Hardware install: step 3
The New Hardware wizard will now copy the required files to
their destination.
Figure 5.4: Hardware install: step 4
Hardware installation
21
The first part of the new driver is now installed. Click ”Finish”
to close the wizard and start installation of the second part, which
follows identical steps.
Once the second part of the driver is installed. measurement
software can be installed and the Handyprobe HP3 can be used.
5.3 Plug into a different USB port
When the Handyprobe HP3 is plugged into a different USB port,
some Windows versions will treat the Handyprobe HP3 as different
hardware and will ask to install the drivers again. This is controlled
by Microsoft Windows and is not caused by TiePie engineering.
22
Chapter 5
6
Specifications
6.1 Acquisition system
Number of input channels
Maximum sampling rate
Sampling source
Accuracy
Stability
Memory
1 analog
100 MS/s real time, 10 ns
internal, quartz
±0.01%
±100 ppm over -40◦ C to +85◦ C
1 MSamples
6.2 Banana input CH1
Connector
Type
Resolution
Amplitude Accuracy
Ranges
Coupling
Impedance
Protection
Isolated 4mm banana sockets
Differential
10 bit
0.3% of full scale
200 mV to 800 V full scale
AC/DC
2.1 MΩ / 15 pF
600 VRMS CAT II;
derated at 3 dB/decade above 20 kHz to
25 Vpk-pk at 50 MHz
Maximum Common Mode voltage
200 mV to 8 V range: 12 V
20 V to 80 V range: 120 V
200 V to 800 V range : 800 V
Common Mode Rejection Ratio
60 dB
Bandwidth (-3dB)
50 MHz
AC coupling cut off frequency (-3dB) ±1.5 Hz
Rise time
10 ns
Overshoot
1%
6.3 Trigger system
System
Source
Trigger modes
Level adjustment
Hysteresis adjustment
Resolution
Pre trigger
Post trigger
Trigger hold-off
digital, 2 levels
CH1
rising slope, falling slope
0 to 100% of full scale
0 to 100% of full scale
0.39% (8 bits)
0 to 1 MSamples (0 to 100%, one sample resolution)
0 to 1 MSamples (0 to 100%, one sample resolution)
0 to 4 MSamples, 1 sample resolution
Specifications
23
6.4 Interface
Interface
USB 2.0 High Speed (480 Mbit/s)
(USB 1.1 Full Speed (12 Mbit/s) compatible)
6.5 Power
Power
Consumption
from USB port
5 VDC , 400 mA max
6.6 Physical
Instrument height
Instrument length
Instrument width
Weight
USB cord length
Test lead length
25 mm / 1.0”
177 mm / 6.9”
68 mm / 2.7”
290 gram / 10.2 ounce
1.8 m / 71”
1.9 m / 75”
6.7 I/O connectors
CH1
USB
isolated banana sockets
fixed cable with type A plug
6.8 System requirements
PC I/O connection
Operating System
USB 2.0 High Speed (480 Mbit/s)
(USB 1.1 Full Speed (12 Mbit/s) and
USB 3.0 compatible)
Windows XP/Vista/7/8/10
6.9 Environmental conditions
Operating
Ambient temperature
Relative humidity
Storage
Ambient temperature
Relative humidity
24
Chapter 6
0◦ C to 55◦ C
10 to 90% non condensing
-20◦ C to 70◦ C
5 to 95% non condensing
6.10 Certifications and Compliances
CE mark compliance
RoHS
Yes
Yes
6.11 Measure lead
Model
Type
Connectors
Instrument side
Test point side
Bandwidth
Safety
Dimensions
Total length
Length to split
Length individual ends
Weight
Color
Heat resistant
Certification and compliances
CE conformity
RoHS
Accessories
Color coding rings
Suitable instrument
TP-C812A
differential
dual 4 mm red and black shrouded banana jacks, 19
mm apart
red and black 4 mm shrouded banana jacks
8 MHz
CAT III, 1000 V, double isolated
2000 mm
800 mm
1200 mm
75 g
black
yes
yes
yes
5 x 3 rings, various colors
Handyprobe HP3
6.12 Package contents
Instrument
Test lead
Accessories
Software
Drivers
Manual
Handyprobe HP3
low noise differential with 4 mm banana jacks
2 test probes with 4 mm banana socket
2 crocodile clips with 4 mm banana socket
Wrist strap
Color coding rings
Hard carry case
Windows XP/Vista/7/8/10
Windows XP/Vista/7/8/10
Instrument manual and software user’s manual
Specifications
25
26
Chapter 6
If you have any suggestions and/or remarks regarding this manual, please
contact:
@
TiePie engineering
P.O. Box 290
8600 AG SNEEK
The Netherlands
@ TiePie engineering
Koperslagersstraaat 37
8601 WL SNEEK
The Netherlands
Tel.:
Fax:
E-mail:
Site:
+31 515 415 416
+31 515 418 819
[email protected]
www.tiepie.com