1
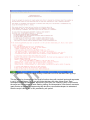
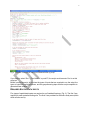
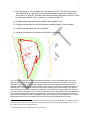
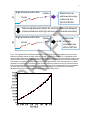
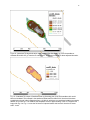
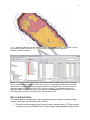
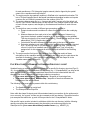
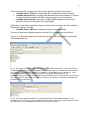
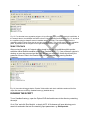
1
A Python script for preparing
TernCOLONY habitat inputs
September 2011
Suggested citation: Lott, C.A. and M.J. Rubino. 2011. A python script for preparing TernCOLONY habitat
inputs: TernCOLONY model documentation. Unpublished report. http://leasttern.org.
2
What is a “Python script”?
This document is a user’s manual for a Python Script called “SandbarCreator.py”.
Scripting is the process of using a programming language to extend the functionality of a
software application. It allows a user, for instance, to automate repetitive actions such as
pointing and clicking through a program’s interface to accomplish the same task many times.
Processing Geographic Information System (GIS) data is a computing intensive endeavor.
Scripting with the programming language Python saves time by taking some of this processing
out of the user’s direct interaction and reduces errors by bringing standardization to
methodology.
Python is an object-oriented programming language that is routinely used in ArcGIS (ESRI
2007) to automate complex geo-processing tasks (e.g., measuring distances between features,
creating digital elevation models) that would take an inordinate amount of time to complete
manually. Python is an open source product and a particularly robust language with developers
around the world. The program and all documentation are freely and abundantly available on
the web.
Document objectives
The SandbarCreator.py script was developed specifically to:
•
Calculate a number of different habitat covariates that are important for Least Tern
colony and nest site selection on riverine sandbars (Lott et al. 2011a);
•
Export habitat data as shape files to display sandbar nesting habitat quality in ArcGIS;
and
•
Export habitat data as text files formatted to provide site-based habitat inputs for the
individual-based model of Least Tern reproduction called TernCOLONY (Lott et al.
2011).
User requirements:
This manual assumes users have basic computer skills for navigating in the Windows
environment and basic skills in GIS. Users should be familiar with ArcGIS software itself
and be able to manipulate data within ArcGIS. It is important that the user have the ability
to properly display and attribute data within the software so that script inputs can be
formatted correctly, allowing the script to run error-free and so that the results that are
generated by the script can be viewed, proofed, and properly interpreted.
Computer Requirements:
•
Windows XP or Vista.
•
ArcGIS 9.2 or higher with Spatial Analyst and 3D Analyst extensions. The
SandbarCreation.py script will not work without these extensions.
3
•
Python 2.5 or higher. ESRI products include Python with their installation.
However, it is recommended that the user install the latest version for the
Windows operating system from: http://www.python.org/.
•
PythonWin for applicable Python version. PythonWin is an add-on for Windows also
included with ArcGIS. Updates are available at: http://sourceforge.net/projects/pywin32/.
VIEWING AND RUNNING PYTHON SCRIPTS
Scripts are simply text files containing a list of commands. They can be opened and edited
using any number of text editors such as Microsoft Notepad or Wordpad. However, Python
comes with its own editor called IDLE. This editor will be listed in the Start/All Programs/Python
menu as “IDLE (Python GUI)” once you install Python. IDLE provides a more user-friendly
editing environment than the programs listed above and it can also be used to run the scripts. In
fact, the user must open and run SandbarCreator.py from a Python interpreter such as
IDLE. This script will work in other Python interpreters such as Wingware IDE
(http://wingide.com/).
For this manual, we illustrate all Python processing using IDLE.
>>Start by opening the program IDLE:
The window that opens is called a shell. You can type Python commands directly at the
command prompt (the >>> symbol in the window). There is also a menu bar along the top.
>>Click ‘File’ > ‘Open’ from this menu:
This will bring up a file browser to find existing Python scripts. Use this function to browse to the
directory where you placed the Python file “SandbarCreator.py”.
>>Open the “SandbarCreator.py” file.
The code for this script will show up in a new window (Fig. 1):
4
Figure 1. Illustration of the Python Shell showing commented text from the SandbarCreator.py script.
This text starts by documenting of the script’s function along with required inputs and arguments
in red. If you scroll down (Fig. 2) you will notice that there are other colors of text. They
correspond to different commands, arguments, input types, etc. used by Python. IDLE formats
the script text in this manner to ease reading, editing, and interpretation. Note that all comments
(parts that do not perform a programming task but allow users and developers to understand
what the script is doing) are in red, preceded by a # symbol.
5
Fig. 2. Illustration of the actual code of the SandbarCreator.py script.
If you were to select ‘Run’ > ‘Run Module’ or push F5, the script would execute. Don’t run this
script yet.
Before running the script, let’s review the types of inputs that are required to run the script, the
types of outputs the script produces, and the geoprocessing steps that the script completes to
generate these outputs.
REQUIRED SPATIAL DATA INPUTS
Five types of spatial data inputs are required to run SandbarCreator.py (Fig. 3). The first 3 are
required for each potential nesting site. The final 2 are provided for the entire study area (within
which all sites occur):
6
1) Point elevations on river sandbars from topographic surveys.1 This file must include a
field called ELEV for each record, with measured elevations reported in 100ths of US
survey feet (e.g., 608.45). This field must have the following properties in ArcGIS: it must
be of the type: “double”, with a “precision” of 11 and a “scale” of 3.
2) Polygons delimiting portions of the sandbar with vegetation cover.
3) Polygons that delineate the outer boundaries of sampling areas for each sandbar.
4) Line files indicating large trees near sandbars.
5) Line files delineating the boundaries of the active river channel.
Fig. 3. Image that illustrates the required spatial data inputs for running the SandbarCreator.py script.
Red plus signs indicate points where field crews collected high-accuracy elevation data (see Lott and
Wiley 2011 for protocols). The dark green polygon at the top of the image represents a patch of low
vegetation that was originally delineated as a line in the field and later closed to complete a polygon (Lott
and Wiley 2011). The light green frame around elevation sampling points represents the “clip” file that
was created in ArcGIS after field sampling to define the outer boundaries of the sampling site. The dark
green line indicates large trees (or lines of trees) within 500 meters of the sandbar, which were delineated
from aerial photography near the time of field sampling. The brown line indicates the edge of the active
channel, also delineated from aerial photography. See Lott and Wiley (2011) and Appendix K2 for a more
detailed discussion of how these spatial inputs may be collected or prepared prior to analysis.
1
If continuous elevation surfaces (e.g., digital elevation models prepared from LIDAR data) are available, the script
can be modified so that these are used as inputs instead of point elevations from field topographic surveys. To do
this, contact Casey Lott at [email protected].
2
Lettered appendices refer to appendices in Lott et al. (2011)
7
REQUIRED TEXT FILE INPUTS
When the script runs, Python will request a text input file (example below). This file includes 4
required inputs, which must be provided for each site. For example, the text below includes text
file inputs for 2 different sites. Each of the 4 required inputs is separated by a comma. Note, text
file inputs must be formatted EXACTLY as below for the script to function properly (see section
on responding to common run-time errors).
ARM497_0,5.99,Exp(-142465.9345 + 44756.97054 * Log (elev) + -3514.908154 * Log (elev)^2),13000
ARM489_8,52.63,Exp(-130536.9407 + 41196.98188 * Log (elev) + -3250.10571 * Log (elev)^2),13000
1) The first required input is an 8 character site name. This MUST follow the standard
naming convention of three letters, followed by three numbers, followed by the
underscore sign, followed by a single number. The first three letters may be used to
specify the dataset or area that the site belongs in (e.g., ARM stands for “Arkansas River
Measurements”). The numbers refer to a site’s location in river miles (e.g., 489_8 is
equivalent to “river mile 489.8”). Deviations from this naming convention will result in
errors while the script runs. The three letter code for each site must correspond exactly
to the three letter code at the beginning of other required inputs for the study area (e.g.,
data for the site called “ARM497_0” will be linked to the Forest Edge file called
“ARM_ForestEdge”).
2) The second required input is a number (with up to two decimal places) that specifies the
vertical offset between the field-assigned elevation of the total station (or any other
instrument for collecting local elevations) and the real-world elevation for this same
point, obtained with reference to a highly accurate vertical survey datum (e.g.,
NGVD1929). This difference is used to adjust all locally-collected elevations to a realworld datum. If datum-adjustment has occurred prior to running the script, this value can
be set to 0. The problem of datum-adjustment is illustrated in Fig. 4.
3) The third required input is a sandbar-specific log-quadratic equation to predict flow (in
cfs) from elevation (Fig. 5). Methods for constructing these equations are available in
Lott and Wiley (2011).
4) The final input, with a value of “13000” in this example, is the lowest cfs value for which
habitat information is desired. For example, a site may have been surveyed at 2000 cfs;
however, on this river, due to regular high flows during the breeding season, all flows
<13,000cfs are not considered suitable nesting habitat (Lott and Wiley 2011). With this
input, all habitat cells that are inundated at flows <13,000cfs will be deleted before final
shape files and text files have been output from the script. This step restricts habitat
tables to only suitable cells, which increases performance in TernCOLONY by limiting
the number of habitat cells upon which calculations must be made at each daily timestep.
8
High accuracy within box
A)
Station
Points
?
Whole box has unknown accuracy relative to the LOCAL DATUM
Datum‐adjustment (adjust for vertical difference between station elevation and high‐accuracy benchmark elevation)
High accuracy within box
B)
Points
Station
Points now +5.99 accurate relative to the LOCAL DATUM
Flow
Fig. 4. Conceptual model of the datum adjustment process. During field topographic surveys, a survey
instrument typically collects elevation points from a high location on a sandbar (a). Topographic points
can be measured with high vertical accuracy relative to the elevation of a survey instrument. However, the
exact elevation of the survey instrument itself is poorly known (or inaccurate) until it has been adjusted to
a local datum in reference to highly accurate local survey benchmarks. In the example above, a vertical
adjustment of 5.99 feet (b), accounting for the elevation difference between the survey instrument and a
local survey benchmark, is necessary for all elevations at a site to be accurate relative to the local datum
(to which other high-accuracy elevation measurements will apply). For a discussion of methods for
adjusting field survey elevations to a local datum see Lott and Wiley (2011).
9
Fig. 5. Example of a site-specific log-quadratic relationship that is used to predict flow (in cfs) from
elevation measurements (in hundredths of US Survey feet) for a sandbar at Arkansas River Mile 489.8.
For methods of developing these relationships see Lott and Wiley (2011). The equation for this line forms
the third input in the text file referenced above that is required to run SandbarCreator.py.
PRIMARY OUTPUT FILES
Note: the TernCOLONY model characterizes within-site variation in habitat quality by
representing each sandbar as a collection of 6’x6’ square “cells” where each cell has a unique
value for a number of habitat quality covariates. More details on how TernCOLONY represents
Least Tern nesting habitat quality can be found in Appendix A. The primary outputs of
SandbarCreator.py (described below) list values for habitat covariates for each habitat cell on
each sandbar.
Users are asked if they would like to change the default cell size for SandbarCreator outputs
each time the script is run. For large sandbars (e.g., >100 acres) the default cell size of
ternCOLONY will generate habitat input text files with >100,000 records. While the performance
of TernCOLONY has been optimized, large management areas with many large sandbars may
take longer to load with cell sizes this small. We recommend first using the default cell size
(e.g., typing in an input of 6 at the prompt shown in Fig. 6) and then re-running the
SandbarCreator script with larger cell sizes if processing speeds are too slow.
Fig. 6. Users may specify a different default “cell size” for script outputs by typing a number other than 6
at the initial prompt that appears when SandbarCreator.py is run. For example, entering 10 would result in
10’ x 10’ square habitat cells (100ft2 each).
The two primary outputs of “SandbarCreator” are: 1) a shape file called <sandbar
name>ClippedDataPts.shp and, 2) a text file that is exported from this shape file, which is called
<sandbar name>data1.csv. These outputs are stored in the “Results” folder. These two files are
identical in content; however, the shape file is formatted for display in ArcGIS and the text file is
formatted to be directly imported into to the TernCOLONY model (Appendix K).
For each record, the text file (or attribute table for the shape file) includes:
1) A unique identifier.
10
2) xy coordinates (in whatever coordinate system is specified for all input datasets).
3) Values for 8 habitat variables (listed in Table 1 below) for each of the square habitat
cells on a sandbar. Depending on the size of the sandbar, and the default size that is set
for each habitat “cell”, this file may range from a few hundred to >100,000 records.
Table 1. List and description of the 8 habitat variables for which SandbarCreator.py calculates values for
each of the square habitat cells at each site.
Variable
Description
CFSATPOINT
Discharge (CFS) required for the river’s water to intersect the point on the
sandbar
DIST2FE
Distance to the nearest large tree from point on the sandbar
DIST2BANK
Distance to river bank from point on the sandbar
ELEV
Datum-adjusted elevation of point on the sandbar
MXELEVDIFF
Elevation difference between each point and the highest point on the
sandbar
DIST2MXELEV
Distance of each point to the highest point on the sandbar
VEGPT
Sandbar point is vegetated? 1 = yes, 0 = no
DIST2VEG
Distance of each point to vegetated portions of the sandbar, if any
An example of the <sandbar name>data1.csv text file (which has identical information as the
attribute table of the <sandbar name>ClippedDataPts.shp file) is shown in Fig. 7 below. Figure 8
illustrates how habitat covariate data may be displayed using the <sandbar
name>ClippedDataPts.shp file in ArcGIS.
Fig. 7. Attribute table for a <sandbarname>ClippedDataPts.shp file for a sandbar at Arkansas River mile.
This attribute table is exported as a text file called <sandbar name>data1.csv.
11
Fig. 8. ArcGIS display of the <sandbarname>ClippedDataPts.shp file. This image illustrates the distance
from the point at the center of each habitat cell to the boundary of the active channel (brown line) in 5
distance bins. Any of the habitat covariates calculated by SandbarCreator.py can be displayed using the
full suite of symbology options in ArcGIS.
SECONDARY OUTPUT FILES
Four additional outputs are generated by SandbarCreator.py and stored in the “Results” folder.
These include:
1) A datum-adjusted digital elevation model (of the type: triangular irregular network, or
TIN) for each sandbar, which is called “<sandbar name>tinadj” (e.g., ARM484_4tinadj)
(Fig. 9).
2) A TIN for each sandbar that displays the flow at which each point on the sandbar will
become inundated, which is called “<sandbar name>tincfs” (e.g., ARM484_4tincfs) (Fig.
10).
3) A contour file based on the cfs tin, that displays inundation flows at 2,500 cfs contours,
called “TinContour.shp” (Fig. 11).
4) A point file that displays the datum-adjusted elevations of all survey points, called
“<sandbar name>pts.shp”. This file is very similar to the “<sandbar name>_PTS.shp” file
that is one of the required spatial data inputs; however, each elevation point has been
adjusted to the local datum (Fig. 12).
12
Figure 9. A standard TIN digital elevation model output of SandbarCreator.py, from the sandbar at
Arkansas River Mile 523_4. Note the file name suffix…tinadj, which stands for datum-adjusted elevation.
Fig. 10. A standard TIN output of SandbarCreator.py illustrating the cfs at which sandbar cells would
become inundated. This example is the sandbar at Arkansas River Mile 523.4. Note that it has been
symbolized so that all cells inundated at flows <13,000 cfs, which are not considered suitable tern nesting
habitat, do not show up. This sandbar was sampled at a flow of approximately 3,623 cfs. Compare this
image with Fig. 9 or Fig. 11 to see the full extent of exposed sand at this low flow. Note the file name
suffix…tincfs.
13
Fig. 11. Standard 2,500 cfs increment contour file output from SandbarCreator.py, shown here on top of
the inundation model TIN from Fig. 10. This file would be labeled TINContour.shp in the
ARM523_4/Results subfolder.
Fig. 12. The attribute table from the datum-adjusted point shapefile ARM482_4pts (note the lowercase
“pts” in comparison with the uppercase PTS of the input file). Previewing this shapefile in ArcCatalog
reveals that it is a series of GPS points along the sandbar. Previewing the table, we can see that two
fields were added from the input PTS file: “Elev_Adj” and “CalcCFS.” The adjusted elevation was
calculated using the datum adjustment amount supplied in the SiteInputs text file, and the CFS was
calculated using the elevation to CFS formula in the SiteInputs text file.
WHAT THE SCRIPT DOES
The script completes a large number of geo-processing steps for each site to produce model
outputs. These steps can be summarized as follows.
1) The script uses the elevation point file input (named <sandbar name>_PTS.shp) and the
second input from the SiteData.txt file to create a datum-adjusted digital elevation model
14
2)
3)
4)
5)
for each sandbar as a TIN (triangular irregular network) that is clipped by the spatial
extent of the <sandbar name>clip.shp file.
The script uses the log-quadratic equation in SiteData.txt to translate this elevation TIN
into a TIN that illustrates the cfs that would inundate each sandbar location and exports
a contour file (at 2,500cfs increments) from the surface of this TIN.
The script creates a raster file (e.g., a square grid) with 6’ square cells (the default cell
size for TernCOLONY habitat inputs) on top of these TINs, creates a point at the center
of each of these squares, and assigns xy coordinates and identifiers to each of these
points.
The script then runs a number of different geo-processing routines to:
a. Extract elevations and inundation cfs values for each point from the underlying
TINS.
b. Measure distances from each point to four different features of interest (e.g.,
large trees, the bank, sandbar vegetation, or the highest point on the sandbar).
This step requires the [river name abbreviation]_ForestEdge.shp and [river name
abbreviation]_POC2_bankline.shp inputs.
c. Calculate the elevation difference from each point to the top of the sandbar.
d. Determine whether or not each point is within a cell that has vegetation (denoted
by a 1 in the Veg field) or not (denoted by a 0 in the Veg field). This step only
occurs if a site has a <sandbar name>_VEG.shp input. If not, all cells are
assigned a 0 for this value and all cells are assigned a 9999 for the Dist2Veg
field.
The script uses the final input in SiteInputs.txt file to output the results of these
calculations to the <sandbar name>ClippedDataPts.shp file for only the cells above the
specified cfs threshold. It then exports the attribute data from this shape file to the
<sandbar name>data1.csv text file.
FILE STRUCTURE FOR RUNNING THE SANDBARCREATOR.PY SCRIPT
SandbarCreator.py requires that data be organized in a specific file directory structure (Figs 1315). A root directory may be established with any name (e.g., C:\SampleDataSC) as long as this
name has no spaces. Two required spatial data input files must be located within this root
directory, and must be named with the following naming conventions:
• [river name abbreviation]_ForestEdge.shp = shapefile of forest edge lines
• [river name abbreviation]_Bankline.shp = shapefile of lines that delineate the
boundaries of the active channel
The following 2 files must also be present within this root directory:
•
•
The SandbarCreator.py script itself
The SiteInputs.txt text input file
Note: while the shape file inputs must follow standard naming conventions for the python script
to run correctly, the .py and .txt files may be re-named as the user desires. The names here are
just examples that match the .py and .txt files provided in the C:\SampleDataSC folder.
Site-specific inputs must be included in subfolders (within the root directory) with the following
naming convention that matches exactly the site naming convention employed in the
SitesInput.txt file: [river name abbreviation]<sandbar name> (e.g., ARM479_0).
15
Three required spatial data inputs must be included within the subfolder for each site:
• <sandbar name>_PTS.shp = original point file of unadjusted sandbar elevations
• <sandbar name>clip.shp = a polygon that delineates the outer boundaries of a site as
a hollow area within a larger outer frame. clipping polygon for a given sandbar
• <sandbar name>h2o.shp = a polygon of slightly greater spatial extent as the clip
polygon (used in the construction of the clip polygon).
Additionally, if a site has a vegetation polygon, this file must be included in the site’s subfolder
following the naming convention:
• <sandbar name>_VEG.shp = vegetation polygon for a given sandbar
Since not all sites have vegetation polygons, this last file is not required to run the script.
Figures 13-15 illustrate the directory structure and input files that are required to successfully
run SandbarCreator.py.
Fig. 13. This screen capture illustrates each of the files (and folders) that must be in the root directory to
run SandbarCreator.py (viewed in ArcCatalog). In this example there are 2 sandbar directories within the
root directory C:\SampleDataSC: ARM523_4, ARM489_8. Also located in the root directory is: 1) the
forest edge shapefile ARM_ForestEdge; 3) the bank line shapefile ARM_Bankline; 3) the
SandbarCreator.py script; and 4) the required text input file SiteInputs.txt. The script will not run properly if
any of the required 4 inputs in the root directory are missing. Any number of site-specific subfolders can
be added to this root directory.
Fig. 14. This screen capture illustrates the 3 required input files for each sandbar subfolder: 1) the
<sandbar name>_PTS.shp file, 2) the <sandbar name>clip.shp file, and 3) the <sandbar name>h2o.shp.
The script will not run for sandbars that lack any of these 3 required inputs.
16
Fig. 15. For sites that have vegetation polygons, 4 input files should be present in each site’s subfolder. In
the example above, the subfolder includes the same 3 input shape files as illustrated in Fig. 13, as well as
the vegetation polygon shapefile named <sandbar name>_VEG.shp. The script will run without the
vegetation polygon (since some sites do not have any vegetation). If a site has more than one vegetation
patch, all patches must be merged into a single shape file with the naming convention shown here.
SCRIPT OUTPUTS
After running the script, all 6 outputs will be stored in site-specific subfolders within another
subfolder named Results<sandbar name> (e.g. ResultsARM475_7). If any of these 6 outputs is
missing, an error has occurred and the script has not run completely. Users should verify the
presence of these 6 files in the Results folder for every sandbar after running Sandbar
Creator.py.
Fig. 16. Users should expect that the “Results” folder within each site’s subfolder contains all 6 of the
output files that are created by SandbarCreator.py (detailed above).
RUNNING THE SCRIPT
To run SandbarCreator.py, open the Python IDLE shell and browse to the directory containing
the script.
Go to ‘Run’ and click ‘Run Module’, or simply hit F5. A file browser will open allowing you to
search for and select the text file containing input parameters e.g. SiteInputs.txt.
17
The Python shell window will be activated and the script should begin printing messages to the
shell. The first message will be a date and time of the script’s initiation. Next the script will
inform you which sandbar it is currently processing as it loops through the list of sandbars you
provided in the input text file. When it completes, the script should send a message that it has
completed all geoprocessing steps. Finally, it lets you know the end time and total elapsed time
of script processing.
NOTE: The script performs numerous geoprocessing tasks to produce the desired output
datasets. Run time will depend on a number of factors including your computer’s power (RAM,
storage space, hard drive speed, etc...) and the number of sandbars you are processing.
RESPONDING TO COMMON RUN-TIME ERRORS
It is not uncommon, when running the SandbarCreator.py script on a new batch of sandbars for
the first time, to encounter a run time error.
While the python shell displays a large variety of error types, many errors can be resolved
without focusing on the exact content of these error messages.
Additionally, once a single error occurs, it is also not uncommon for a cascade of errors to occur
as the script runs. Subsequent error messages often disappear once the first error has been
addressed. Therefore, users should not be discouraged by a barrage of error messages the first
time through.
In our experience, most errors are due to 1 of 2 simple causes, both of which are relatively easy
to find and fix. For this reason, we recommend ignoring the exact text of the error statement in
the Python shell and checking for the most common two potential error sources first. This
process will often results in a very small edit to one of the input datasets. After making this edit,
the script commonly runs error free.
If you suspect that a single input file may be causing an error, re-run the script without this site
included. If all other sites run without errors, you have identified a site with an input problem.
The most common source of run time errors is when required input files do not follow naming
conventions EXACTLY or when one input file for a site does not match EXACTLY all other input
files for a site (including the subfolder name). It is often easiest to find this sort of error in
ArcCatalog. For example, the following set of input files has an error. Can you find it?
18
Fig. 17. The file ARM489_8PTS was missing an underscore and should have been named
ARM489_8_PTS. This error can be fixed by simply renaming the file in ArcCatalog and rerunning the script. If you suspect a naming error, you can always check the exact names of
input files for sites where the script IS working to see if you can find any naming differences with
inputs for sites that are not working.
Another common error is when site names in the SiteInputs.txt input file do not match all other
site inputs exactly (e.g., all the spatial data inputs in ArcCatalog have the name: ARM482_4 and
the SiteData.txt file has the site listed as ARM482_5). These types of naming errors are easily
found and fixed.
Similarly, the syntax for the log-quadratic equation in the SiteInputs.txt file must be followed
EXACTLY. Can you spot the error below?
ARM497_0,5.99,Exp(-142465.9345 + 44756.97054 *Log (elev) + -3514.908154 * Log (elev)^2),13000
The text above is missing a single SPACE between the first multiplication sign and the first use
of the “Log” expression. The corrected line is below.
ARM497_0,5.99,Exp(-142465.9345 + 44756.97054 * Log (elev) + -3514.908154 * Log (elev)^2),13000
These types of errors can be frustrating, but once you have run the script a few times and found
each of the errors like this, you will tend not to be bothered with them again. You should expect
a bit of a learning curve/bug catching period when you run these scripts for the first time.
If you are still uncertain, after reading this document, exactly how script inputs should be set up,
explore the input datasets provided in the SampleDataSC folder that came with the
SandbarCreator.py script download. These inputs have been proofed and tested extensively.
You can check the formatting of your own input data versus this source material.
Another error that we have encountered fairly regularly is caused by a mismatch in coordinate
systems between two different spatial input datasets (e.g., one of us created a forest line shape
file in Oklahoma State Plane North and this did not match all other spatial datasets that were
projected in Oklahoma State Plane South). ArcGIS’s “project on the fly” routine can make this
19
error difficult to track down some times, and usually requires exploring shape file metadata
properties in ArcCatalog.
The script WILL NOT run successfully if ANY of the spatial data inputs is in a coordinate system
that differs from ANY of the other spatial data inputs. To fix this problem, you must identify
which of the input files is in the incorrect coordinate system and either re-define or re-project the
coordinate system for this file.
SandbarCreator.py was originally developed for the Red River in Oklahoma and thus, the
default coordinate system is set to Oklahoma State Plane South. If your spatial data are in a
different coordinate system, please contact the script’s developers (see below), who will modify
the script for your own coordinate system for free.
SUPPORT
This script was created by Matt Rubino and has been extensively proofed by both Matt and
Casey Lott, who have found and fixed many of the types of errors that come up during common
applications of the script. However, application in new contexts is bound to result in some new
hang-ups. If this manual does not provide answers to your questions about runtime errors,
contact Casey Lott at (208) 629-8705 or [email protected]. Casey will attempt to resolve your
error and will contact Matt Rubino directly if he cannot. Most errors can be resolved relatively
simply with effective testing and clear communication of where and when the problem is
occurring.
REFERENCES
ESRI 2007. Environmental Systems Research Institute, Inc. (ESRI), ArcGIS. (Version 9.2).
Redlands, CA.
Lott, C.A. and R.L. Wiley. 2011. Effects of dam operations on Least Tern nesting habitat and
reproductive success below Keystone Dam on the Arkansas River. ERDC TR DOTS-EXX.
Vicksburg, MS: U.S. Army Engineer Research and Development Center.
Lott, C.A., S.F. Railsback, and C.J.R. Sheppard. 2011. TernCOLONY 1.0 model description.
ERDC TR DOTS-EXX. Vicksburg, MS: U.S. Army Engineer Research and Development Center.