1
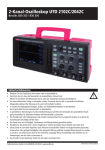
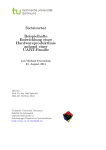
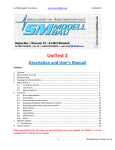
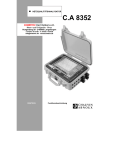
Concepts of transient recorder development for acoustic emission analysis
CONCEPTS OF TRANSIENT RECORDER DEVELOPMENT FOR
ACOUSTIC EMISSION ANALYSIS
KONZEPTE DER TRANSIENTENREKORDER ENTWICKLUNG FÜR
DIE SCHALLEMISSIONSANALYSE
DES CONCEPTES DU DEVELOPMENT D’UN LECTEUR POUR ANALYSER DES EMISSIONS ACOUSTIQUES
J.H. Kurz, V. Wolter, G. Bahr und M. Motz
SUMMARY
The large number of acoustic emissions occurring during an experiment require a fast and high resolution transient recorder system. A standard personal
computer with a RAID system and two data acquisition cards, each has got 4 input channels, 5 MHz sampling rate and 12 bit amplitude resolution, build the
hardware platform. Using this hardware two transient recorder software concepts were realized. The first one is an event controlled system where each event
is triggered and stored immediately with a rate of up to 50 events per second.
The second one is a continuously recording system where the data flow is recorded and stored continuously and the events are extracted afterwards. The advantage here is that really all events are recorded but really large datasets need
to be handled.
ZUSAMMENFASSUNG
Die große Anzahl während eines Versuches auftretenden Schallemissionen
bedarf eines schnellen und hochauflösenden Transientenrekorders. Ein Standard
PC mit einem RAID System und zwei Messkarten, jede mit 4 Kanälen, 5 MHz
Sampling Rate und 12-Bit Amplitudenauflösung, bildet die Hardware Plattform.
Auf Basis dieses Equipments wurden zwei Transientenrekorder Systeme umgesetzt. Das eine System zeichnet kontinuierlich den Datenfluss auf, aus dem hinterher die einzelnen Schallemissionsereignisse extrahiert werden. Der Vorteil
dieses Prinzips ist, dass wirklich alle Schallemissionen erfasst werden. Aller115
Otto-Graf-Journal Vol. 14, 2003
KURZ, WOLTER, BAHR, MOTZ
dings müssen hier teilweise sehr große Datensätze bearbeitet werden. Das andere System arbeitet Ereignis basiert, d.h. wird ein Ereignis durch die Triggerbedingung als solches erkannt, so wird es sofort abgespeichert. Mit diesem System
wird dabei eine Speicherrate von 50 Schallemissionen pro Sekunde erzielt.
RESUME
Le grand numero des emissions acoustiques qui se manifestent pendant une
experience a besoin d'un lecteur pour des emissions acoustiques qui est vite et
qui est en haute definition. Un ordinateur normal avec un system RAID et deux
cartes de mesure, chaque avec 4 canals, 5 MHz quote-part de balayer et 12 bit
resolution des amplitudes forment la base de hardware. Deux systemes differentes pour enregistrer des emissions acoustiques etait realiser a la base de ce
hardware. La premiere systeme enregistre chaque emission acoustique juste
apres le determination. Avec ce system un quote-part de accumulation de 50
emissions acoustiques par seconde aura gagne. La deuxieme systeme enregistre
les carateristiques continu et chaque emission acoustique aura extrai apres l'experience. L'avantage de ce system est que vraiment tous emissions acoustiques
auraient enregistent. A l'otre cote on gagne des ensembles de donnees tres grand.
KEYWORDS: Transient recorder, acoustic emissions, data acquision
INTRODUCTION
Acoustic emissions are defined as the spontaneous release of localised
strain energy in stressed material. Due to micro cracking in the material, this energy release can be recorded by transducers on the material's surface [Große,
2002]. Acoustic emission analysis is capable of revealing damage processes in
material during the entire load history. It is obvious that the recording of damage
processes from the microscopic to the macroscopic scale produces a large number of events during relative short time spans. The number of events can be
about several thousands during one test. Due to the large number of occurring
acoustic emissions within short periods, it is obvious that a fast recording system
is needed. Furthermore, the events' frequencies are in the ultrasonic frequency
range. Therefore, the transient recorder needs a high sampling rate, too. The
kernel of such a system is the data acquisition part. Here, a fast and high resolution A/D converter in form of a measurement card is generally used. In the case
of that more than one card is used, they need to be synchronised. The data then
116
Concepts of transient recorder development for acoustic emission analysis
is stored by a computer system which must be fast during the process of data
storage and which must have sufficient disk space. All these processes are controlled by the corresponding software.
The rate of acoustic emissions during experiments especially in concrete
can be about 30 or more events per second. Commercial data acquisition systems including the software detect between 2 and more than 100 events per second depending on the time delay of the system during the process of storage.
The sampling rate for concrete specimens should be greater than 1 MHz with a
high amplitude resolution. The required disk space should be about several
gigabyte. The more sensors are used the better the data analysis works. Therefore, in general more than one data acquisition card is needed. The cards then
need to be synchronised. These are the benchmarks a good system for acoustic
emission analysis on concrete should achieve.
REALISATION OF THE REQUIRED HARDWARE STANDARDS
The most limiting factor concerning the chosen hardware and not mentioned yet, is the constricted budget. With an infinite budget it would be possible
to go far beyond the required hardware standards. But with the chosen concept a
relatively cheap solution was found which fulfils all mentioned benchmarks.
The chosen hardware is a standard personal computer with an AMD Athlon
1800 processor and a raid controller onboard. The system has got 1 GB RAM
and 3 hard disks, each with about 60 GB memory. The first hard disk contains
the operating system while the two other hard disks are the memory for the transient recorder. They are configured as a RAID 0. RAID means Redundand Arrays of Inexpensive Disks. That means a compound of hard disks which complement each other. RAID 0 especially also called striping arranges the data
equally on both disks. The data transfer rate is so twice as high as with one disk.
With respect to fast data processing on a second system the two RAID disks
were set into two carrier bodies.
+
Data acquisition is realised with two measurement cards of type PCI-6110
from National Instruments implemented in the personal computer. The connection between sensors and data acquisition system is realised via a self designed
panel. Each measurement card contains 4 analog inputs, 2 analog outputs and 8
digital in-/outputs as well as two 24 bit counter/timer. Concerning the transient
recorder only the analog inputs are needed. Each analog input has got an own
ADC with a resolution of 12 bit, differential input mode, input coupling
117
Otto-Graf-Journal Vol. 14, 2003
KURZ, WOLTER, BAHR, MOTZ
switchable between DC/AC and 8 bipolar ranges from +/- 0.2 V to +/- 42 V.
The sampling rate can be chosen between 1 kS/s and 5 MS/s.
The onboard trigger is a bit limited. It is only possible to trigger on one
channel and logical connections between different channels are not possible. A
slewrate trigger is not realised, too. Using the analog trigger mode one input
channel or an external signal is the trigger source. The trigger level has got a
resolution of 8 bit. Within the digital trigger mode an external TTL signal is
used. Furthermore, triggering by a software signal is also possible and pre- and
posttrigger are supplied, too.
A flexible interface which can be used for generating a timing signal is also
implemented on the measuring card. This interface can be used for routing the
timing signal to other data acquisition systems or to an external output. The
routing possibility is essential for a transient recorder system with two or more
cards because there is a need of sending the clock pulse as well as the trigger
pulse from the trigger channel to the other measurement cards. This is realised
via the RTSI (Real Time System Integration) bus which is a simple connection
between the data acquisition cards [PCI-6110/6111, 2000].
The up to now short description of the chosen hardware will be completed
by a brief description of the two software systems in the following which control
the whole recording implemented on the data acquisition unit. The first one is an
event controlled program while the second one is a continuous recording system.
DEVELOPMENT OF AN EVENT CONTROLLED TRANSIENT RECORDER SOFTWARE
The event controlled transient recorder software was developed with LabVIEW 6.1 using the Programming language G which is widespread in the field
of data acquisition and measurement systems (LabVIEW, 2002). Using LabVIEW the coding is realised in a graphical way which is different to e.g. Fortran
or C# but easy to learn. Furthermore, the program flow in LabVIEW is not sequential but related to the data flow. This simplificates process parallelization.
Other programming features like loops and sequences are also available as well
as subroutines called SubVI (VI: virtual instrument).
Each LabVIEW program is called a VI and consists of a front panel and a
diagram. In the following a simle example shell demonstrate the programming
procedures within LabVIEW (Fig. 1).
118
Concepts of transient recorder development for acoustic emission analysis
Fig. 1: Example for the structure of a LabVIEW program, left front panel, right diagram.
Two numbers shell be entered on a user interface, then multiplied with each
other and finally the result displayed on a moving coil instrument (Fig. 1, left).
Pressing the stop button the program is terminated. The buttons, instruments and
controls can be placed on the front panel which is the user interface by drag and
drop operations. The example shows two controls (factor 1 and 2), a boolean
control button (STOP) and a numerical display in form of a moving coil instrument. Each control element or display creates automatically a terminal on the
diagram surface (Fig. 1, right). Within the diagram functions, operators and
structures are used which can also be placed by drag and drop operations. The
diagram's elements are then connected by virtual wires. Fig. 1 (right) shows a
while loop (grey border line) and within the loop the two input elements factor 1
and factor 2 and the multiplication operator (cross sign). The multiplication operator is connected to the two input elements and the output display (product)
and the stop terminal is connected to the conditional terminal of the while loop.
After starting the program two number can be multiplied with each other until
the STOP button is pressed which cancels the while loop.
This relative simple example shows the general procedure of programming
in G. The transient recorder software is a much more complex problem but it is
in principal the same basic system. The software's front panel (Fig. 2) has got a
menu bar including the menus File, Settings, Measure, Display and Help.
The menu Settings contains dialogs for the data acquisition settings and for
the definition of the auto-sequence. The menu Measure is for starting and stopping the measurement as well as the auto-sequence. The menu Display contains
the possible display settings and the Help menu calls the help functions.
119
Otto-Graf-Journal Vol. 14, 2003
KURZ, WOLTER, BAHR, MOTZ
Fig. 2: Front panel of the new transient recorder software
Below the menu bar is the symbol bar situated containing the most important functions from the menu bar. The screen's largest part is acquired for displaying the signals of each channel. The display settings of each channel can be
chosen by using the change button on the left side of each channel or via the
Display menu in the menu bar. At the bottom of the front panel a table for chosen parameters is situated.
The control panel of the data acquisition card is shown in Fig. 3. All essential interfaces and displays can be found in the four index cards Timebase, Input
Amplifier, Trigger and Physical Unit. The auto-sequence panel is shown in Fig.
4. The available functions can be chosen from the corresponding interface and
are copied into the auto-sequence list. The commands listed in there define the
current auto-sequence which is started by pressing the Auto Record button in the
symbol bar.
The front panel's diagram structure is the code behind the above shown
graphical user interface (Fig. 2). Its architecture will be shown in the following:
The VI “Main Panel” is the top level VI (Fig. 5). It consists of 2 while loops
120
Concepts of transient recorder development for acoustic emission analysis
which are executed parallel. The upper loop shows the event control. The user
activates an event e.g. by pressing a button on the front panel or choosing a
menu entry from the menu bar. The programmer defines which control elements
are activated by a certain event using the so called event structure (inner frame
in the upper loop of Fig. 5). Each event has got an own case in the event structure whose subdiagram will executed if the corresponding event occurs. As long
as no event appears the event structure is in a sleeping mode which saves processor capacity.
Fig. 3: Control panel of the data acquisition card
Fig. 4: Auto sequence panel
121
Otto-Graf-Journal Vol. 14, 2003
KURZ, WOLTER, BAHR, MOTZ
Fig. 5: Diagram of the front panel showing 2 parallel while loops
Fig. 5 shows the event case which will be executed if the record button on
the front panel (Fig. 2) is pressed. Then an array consisting of symbolic constants with the elements “Config and Route”, “Start and Read Data”, “Unroute”
and “Display Data” will be created. This array leaves the events structure using
a so called tube with destination to the “First Notifier” (lower loop in Fig. 5). A
“Notifier” enables the communication between 2 independent parts of a block
diagram. Its principal is comparable to a mailbox which also sends and receives
data. The “Notifier's” data output is connected to the input tube of a for loop
whose auto-indexing is activated. The tube's output is connected to the selector
of a case structure which is situated in the for loop. The auto-indexing affects
that the elements of an array which is connected to the input tube of the for loop
are passed one after the other to the loop. The loop counter (n-terminal) which
normally controls the number of loop executions, does not need to be connected
to the loop. The loop is executed with respect to the dimension of the array. The
mode of operation works as follows: If the user initiates an event, an array consisting of symbolic constants is situated at the input tube of the for loop. During
each execution of the for loop one symbolic constant of the array is read, i.e.
During the firts loop execution the “Config and Route” constant which is passed
to the selector of the case structure that executes the corresponding “Config and
122
Concepts of transient recorder development for acoustic emission analysis
Route” subdiagram (Fig. 5, lower loop). Having read all constants the “Notifier”
lapses into a sleeping mode until a new event is initiated. Other events create arrays consisting of different symbolic constants which call certain case structures.
Such a programming architecture is called state machine.
The data transfer of subdiagrams of the state machine is realised by so
called shift registers. A shift register is a pair of connections which are situated
on the vertical sides of the loop frame (triangle signs in the lower loop of Fig. 5).
The connection on the right hand side (triangle upwards) stores the data at the
end of one loop execution, that it can be used in the next run as input by the
other connection (triangle downwards). A shift register can be used with different data types. The advantage of such an architecture is the simple way of extending the program. If further functions are needed the corresponding case
structures are implemented in the state machine and if needed also in the event
control.
Until now the used programming environment (LabVIEW) was introduced
and the main features of the graphical user interface of the transient recorder
software were shown. In the following a few important details of the coding are
presented.
Using 8 sensors two data acquisition cards are needed. Herefore, the synchronisation of the cards is important. Each card can be used separately for signal recording with up to 4 sensors. But for an acoustic emission analysis it is
important that the cards have got the same timebase, i.e. they need to be synchronised. Therefore, the SubVI “Config & Route” was developed (Fig. 6).
Further SubVIs are implemented in this routine and connected by the “Daisy
Chain Procedure” [ObjectVIEW, 2002]. That means the output parameters of
one VI represent the input parameters for another one. This leads to a sequential
data flow which is useful here.
The left side of Fig. 6 contains the controls “Master device” and “Slave device” which represent the two data acquisition cards. The decision which trigger
channel is chosen in the control panel determines which card will be master and
which slave. The parameters “Master device”, “Master channel scan list” (list of
channels used for measurement), “coupling & input config” (input configuration
and input coupling) and “Blocklength” are set in the control panel and passed to
the SubVI “AI Config” which is executed first. The sampling rate is set in the
123
Otto-Graf-Journal Vol. 14, 2003
KURZ, WOLTER, BAHR, MOTZ
SubVI “Clock config”. Trigger channel, trigger slope, trigger level and hysteresis are set in the SubVI “Trigger config”.
Fig. 6: SubVI “Config & Route” for configuration and routing
The trigger procedure is very important for the whole process of data acquisition. Therefore, a more detailed description will be given. If the trigger
condition is fulfilled the analog trigger on the data acquisition card generates an
internal trigger signal. This internal digital trigger signal is send by the SubVI
“Route signal” to the RTSI bus (connection RTSI 0) where it can be received by
the second data acquisition card. Within the post-trigger mode or if the pretrigger samples are set to zero, this internal signal is the starting point for the
data acquisition. During the pre-trigger mode the internal signal stops the acquisition because the data acquisition has already started and the pre-trigger samples must be seized, before the trigger condition is fulfilled.
Each data acquisition card has got a 20 MHz time base from where the
needed timing signals are send e.g. to the A/D converter. The board clock can
also be routed by the RTSI bus, though other data acquisition cards can use the
same time base. This is performed by the second call of the SubVI “Route signal” where the signal “Board clock” is send to the “RTSI bus” (Fig. 6). The next
two SubVIs configure the slave device in the same manner as described for the
master device. Configuring the trigger of the slave device is different from the
master device trigger configuration. Herefore, a digital trigger is used and the
trigger channel is not an analog external signal but the RTSI 0 connection which
uses the master device trigger signal. Though the both cards are triggered si124
Concepts of transient recorder development for acoustic emission analysis
multaneously. Finally the board clock of the slave device is set to the RTSI
clock, that the sampling is synchronised in phase and frequency.
A further important point is the error trapping. Most of the SubVIs of the
diagram shown in Fig. 6 contain an error input and an error output which is connected to the error input of the following VI. Error in- and output are in form of
a cluster which is comparable to a dataset or a structure in text based programming languages. This cluster contains a boolean, a numerical and a string control
or indicator. If an error occurs the boolean element is set true, the numerical
element contains the error number and the string the error message. The next
SubVI which receives the error cluster has then the possibility to decide how to
handle the further proceeding. Fig. 7 shows an example for such an error handling in the SubVI “Clock config”. If this SubVI receives an error cluster the
case “Fehler” is selected from which the task ID and the error cluster are passed
to the following VI (Fig. 7, right). If no error occurs the subdiagram of this case
called “Kein Fehler” is executed. If an error occurs during the execution of this
case the error cluster is set to error and the error number and the error message
“AI Clock Config” is passed to the error output (Fig. 7, left).
The described part of the program containing configuration and routing
must only be executed once if the configuration is not changed. The next parts
of the software which control the start of the data acquisition or the recording of
the data can be repeated without re-configuring and re-routing.
Fig. 7: Error handling within the SubVI “Clock config”
After configuration and start of the recording system, the data acquisition
cards wait for a trigger condition for data storage. All available VIs concerning
125
Otto-Graf-Journal Vol. 14, 2003
KURZ, WOLTER, BAHR, MOTZ
the idle running time before an event occurs blocked the program, i.e. no precast
VI could be used. Using a timeout function to stop the data acquisition if no
event occurs, did not produce satisfying results, too. Therefore, the SubVI “Read
Data” was developed (Fig. 8, left).
Fig. 8: SubVI “Read Data” (left) and Subdiagram “Waiting” (right)which corresponds to the
Subdiagram “Data Available” on the left side for idle running time handling
The SubVi “Read Data” (Fig. 8, left) imports zero datapoints from the
master device in a while loop by using the SubVI “AI Read”, i.e. the loop cannot
be blocked. The parameter “Scan Backlog” which is returned by this VI says
how many datapoints are staying in the buffer after the SubVI's execution. As
long as no trigger condition is fulfilled the “Scan Backlog” value is zero and the
subdiagramm “Waiting” (Fig. 8, right) of the following case structure is passing
only the master and slave IDs and the error cluster to the following loop execution where again “Scan Backlog” is read out. The break switch within the subdiagramm which can be used via the VI-server function by other VIs enables to
stop the data acquisition if the corresponding control button is used on the main
panel. If the trigger condition is fulfilled and all data is in the buffer the “Scan
Backlog” value is the value of the blocklength. Then the subdiagram “Data
Available” is executed where the data readout of the master and the slave device
from the buffer is realised. Activating the termination condition of the whileloop within this subdiagramm the SubVI “Read Data” is ceased. The data is now
available in the terminals master device data and slave device data for storage or
display.
126
Concepts of transient recorder development for acoustic emission analysis
DEVELOPMENT OF A CONTINUOUSLY RECORDING TRANSIENT
RECORDER SOFTWARE
The continuously recording transient recorder system is based on the same
hardware platform as the event controlled one. The software DevTRec is written
in Visual C++. The data acquisition cards are approached by the C-libraries of
National Instruments (NI-DAQ) [LabVIEW, 2002].
The data acquisition is organised via a ringbuffer which enables measurements
with up to 8 channels and 2 megasamples continuously (Fig. 9).
Fig. 9: Ring buffer organisation
Though, the experiment is recorded completely. The data analysis is performed afterwards. Due to the buffer arrangement the data is organised block by
block in a binary file and needs to be sorted afterwards. Therefore, the optimal
performance is guaranteed for data acquisition.
The data acquisition cards write the data block by block into the ringbuffer.
That means at first card number 1 writes a block of data into the ringbuffer, then
card number 2, then number 1 again and so on. Within each block the data of
each channel is lined up in succession. Due to the knowledge of the blocklength
it is then possible to put the data in the correct order. This ordered data is written
to the so called “Basefile”. The data is still in a binary 12-bit format. The format
conversion uses the following formula:
measured value*10/(2048*gain) = real value
127
Otto-Graf-Journal Vol. 14, 2003
KURZ, WOLTER, BAHR, MOTZ
Finally each event is extracted from the continuous data file. Herefore, a
simple trigger level can be chosen which defines the occurring of an event (Fig.
10).
The measured values are compared in succession to the trigger level value.
It is possible to decide if a definite number of samples is extracted after the trigger level is reached or if the extraction of the event is finished if the values sink
again below the trigger level. The events are written separately to a file whereas
an information file is also created for every event which contains the relative
trigger time. Due to the fact that the “Basefile” is not erased, the extraction can
be repeated with different trigger values.
Fig. 10: Screenshot of DevTRec
The data visualisation is performed using the above shown conversion formula. Using the menu bar it is possible to decide how many values are shown
and how many values per redrawing will be shown. That means it is possible to
view even huge signal in a kind of film.
PERFORMANCE OF THE DEVELOPED SOFTWARE AND CONCEPTS FOR THE DATA ANALYSIS
The two described transient recorder systems on one hardware platform
were developed to be able to store as much events per second as possible. The
128
Concepts of transient recorder development for acoustic emission analysis
continuous recording system records all occurring acoustic emissions. But they
need to be extracted from the continuous data stream. That means the user has to
deal with large data sets. The point of concern using this system is not the storing rate but the effective handling of the data.
Each data acquisition card is able to use a sampling rate of 5 MHz. If the
two cards are used coupled and synchronised the sampling rate for the event
controlled system is reduced to 2,5 MHz. The reason herefore seems to be that
the onboard FIFO (First In First Out) memory which has got a capacity of 8 kB,
is not able to pass the data fast enough via the PCI bus. However, the continuously recording system is only able to sample with 2 MHz using all 8 channels.
The reason is not completely clear. If it is a software error the problem may be
searched within the National Instruments software (NI-DAQ), i.e. within the Clibraries. The problem might also be based within the buffer organisation and
monitoring routine. It is also possible that the data flow is around the limit of
what the system bus of a standard personal computer is able to pass to the hard
disk, i.e. the problem is a hardware problem.
The disc space of 120 GB makes recording times of more than 30 minutes
possible but the user has to take into consideration that for the acoustic emission
extraction further disc space is needed. The extraction is performed by a thresholding algorithm. The event extraction works automatically but however it is
relatively slow. Therefore, removable hard discs are used in the transient recorder, so the data analysis can be realised on another computer. A further possibility would be to divide the raw data file, containing the continuous data, into
several pieces and apply the extraction procedure on them. Until now there is
not much experience in handling the huge data sets gained with the continuous
recording system.
The event controlled recording system is not able to record all acoustic
emissions occurring during one experiment. But is has got a much better performance than the until now used event controlled system which was only able
to record 1 event per second with 5 MHz sampling rate (amplitude resolution 12
bit). A performance test revealed that the new transient recorder system is able
to trigger and store about 50 events per second with a sampling rate of 2.5 MHz
and 12 bit amplitude resolution. This transient recorder system produces large
data sets, too, but much less disc space is needed than with the continuously recording system. The larger data sets enable a better analysis e.g. an automatic
onset detection algorithm with a rate of success of about 40 % leads generally to
129
Otto-Graf-Journal Vol. 14, 2003
KURZ, WOLTER, BAHR, MOTZ
more significant results with 3000 recorded events than having only recorded
300. Concerning the system's hardware performance better data acquisition
cards are available (16 bit amplitude resolution, 12 channels, 10 MHz sampling
rate, 6 GB onboard memory) but the price of one of the best systems available
now is factor 10 higher than of the one we developed.
ACKNOWLEDGEMENTS
These investigations are part of our work in the collaborative research center SFB 381 at the University of Stuttgart which is financially supported by the
Deutsche Forschungsgemeinschaft (DFG). We gratefully acknowledge this support.
REFERENCES
[1]
GROSSE, C. U.: BASICS OF ACOUSTIC EMISSION MEASUREMENT TECHNIQUES, KLUWER ACADEMIC PUBLISHERS, HINGHAM MA, USA, CH. 9, P.
45, 2002 .
[2]
LABVIEW BENUTZERHANDBUCH, NATIONAL INSTRUMENTS, EDITION
JANUAR 2002, 2002.
[3]
OBJECTVIEW BENUTZERHANDBUCH, VOGEL AUTOMATISIERUNGSTECHNIK
GMBH, 1. AUFLAGE, 2002.
[4]
PCI-6110/6111 USER MANUAL, NATIONAL INSTRUMENTS, EDITION
NOVEMBER 2000, 2000
130