1
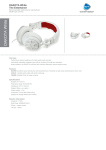
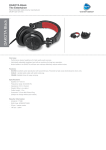
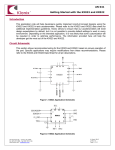
1 Lab MIAMI UNIVERSITY Mechanical Engineering Vibrations Laboratory Introduction to Small Scale Road Vibration Experimentation MIAMI UNIVERSITY VIBRATIONS LABORATORY Introduction to Small Scale Road Vibration Experimentation Miami University School of Engineering and Applied Science Department of Mechanical and Manufacturing Engineering 144 Kreger Hall Oxford, OH 45056 I N T R O D U C T I O N T O S M A L L E X P E R I M E N T A T I O N S C A L E R O A D V I B R A T I O N 1 Lab Introduction to Small Scale Road Vibration Experimentation Objective This laboratory, Introduction to Small Scale Road Vibration Experimentation, is an introduction to experimental vibrations. The objective of this laboratory is to introduce the user to several important fundamentals of experimental vibrations: accelerometer use, actuator use, force response graphs, and transfer functions. Also, this laboratory will introduce the student user to the functions and use of the small scale road vibration experimental setup. Background Information Before the student begins this experiment there are several important topics that must be understood by the user. Importance of Road Vibration Experimentation The goal of this experiment is to test road vibrations felt by a car during normal operation. It is important to test vehicles for their reactions to road vibrations for several reasons. In design, vibrations affect safety, ergonomics, and style. Safety is important because not making sure a vehicle is designed to withstand the vibrations it will encounter in use may lead to harm of the user. As far as ergonomics are concerned, it is important to consider the vibration effects felt by the driver and 1 I N T R O D U C T I O N T O S M A L L E X P E R I M E N T A T I O N S C A L E R O A D V I B R A T I O N passengers of a vehicle. If a human is under the effect of too much vibration, they may become fatigued and fall asleep at the wheel. Finally, when designing a vehicle the engineer may consider vibrations as it related to style. An example of this would be the Harley Davidson Motorcycle company who has patented their sound because the vibrations that cause this sound are important to the style of the motorcycle. Electrodynamic Shakers The hardware used in this experiment to actuate the vibrations felt by the vehicle is an electrodynamic shaker. The inside of the electrodynamic shaker can be seen in Figure 1. Figure 1: Inside an Electrodynamic Shaker Figure 2: Mass-Spring-Damper Diagram and Courtesy of www.dataphysics.com Corresponding Electric Circuit Diagram for an Electrodynamic Shaker Courtesy of www.dataphysics.com At the center of the shaker is a coil of wire, suspended in a fixed, radial magnetic field. The armature (which consists of coil, coil form, and stinger) is centered within the shaker using support flexures or rollers, depending on the size. This 2 Comments: I N T R O D U C T I O N T O S M A L L E X P E R I M E N T A T I O N S C A L E R O A D V I B R A T I O N allows the armature to move axially, while being restrained from motion in all other directions. The force provided by the shaker is proportional to the magnetic flux passing through the coil, the current flowing through the coil, and the length of wire within the flux field. This force is transmitted to the object that is being tested (in this case, the vehicle) by means of a stinger that extends from the vehicle and is attached to the car. The electrodynamic shaker contains both electrical and mechanical parts. The electrical and mechanical model diagrams for the inside of the shaker can be seen in Figure 2. The mechanical and electrical parts of a shaker are cross-coupled. A force proportional to the electrical current excites the mechanical system, while the electrical circuit is excited by an internal voltage (back-emf) proportional to the mechanical velocity of the system. The amplifier drives the electrical circuit, providing an external voltage and current. Accelerometers The hardware used in this experiment to measure the vibrations sent to the shaker, as well as those felt by the vehicle, are accelerometers. The accelerometers used in this laboratory are piezo electric crystal accelerometers. The piezo molecules in the accelerometer accelerate opposite the point of vibration, accurately measuring the acceleration felt by the vehicle and converting it from voltage reading. There are four accelerometers in the Vibrations Laboratory. When using the experimental setup, one accelerometer must always to measure the input force generated by the shaker. One or all of the remaining accelerometers can be used to measure the output forces felt by the car. 3 Comments: I N T R O D U C T I O N T O S M A L L E X P E R I M E N T A T I O N S C A L E R O A D V I B R A T I O N Data Acquisition System Data acquisition systems provide a physical connection between software and hardware of an experimental setup, allowing the user to acquire the data relevant to the analysis of the experiment. For this laboratory, the data acquisition system consists of: • Data acquisition hardware • Sensors and actuators • Signal conditioning hardware • Computer • Software Figure 3 shows the flow of information between the pieces of the data acquisition system. Accelerometers: Analog NI Signal Conditioning Box: Analog AnalogÆDigital Converting Card in Computer DAQ: Digital MATLAB Code To Analyze Data (GUI is used to initialize): Digital Figure 3: Flow of Information for Data Acquisition System The computer needs to read and analyze the data gathered by the accelerometers. The accelerometers read data in analog form. This data is then sent to a signalconditioning box, which also reads in analog, to improve the accuracy, perform filtering operations, and allow for simultaneous sampling. Figure 4: Signal Conditioning Box 4 Comments: I N T R O D U C T I O N T O S M A L L E X P E R I M E N T A T I O N S C A L E R O A D V I B R A T I O N From the signal-conditioning box, the data is sent to the computer. In the computer, there is a card that converts analog data to digital data so it can be processed. The data acquisition software talks to this computer card and Matlab code is written that allows this data to be used within the program. The related GUI and corresponding files allow the user to analyze and display the experimental results. Graphical User Interface In the experiment, the user will be collecting and analyzing data using a graphical user interface (GUI). A GUI is a program interface that takes advantage of the computer’s graphics capabilities to make the program easier to use. Use of a graphical user interface allows the complex code involved in performing calculations to be done behind the scenes so that every user who wants to conduct an experiment does not have to be experienced in knowing how to write the code. GUIs are typically comprised of such components as windows, graphs, and pull down menus. In using a GUI, the user can enter the necessary experimental parameters, start a process of data collection and analysis, and view the corresponding results that are displayed. Analysis behind GUI code The most important measurement for vibrations modal analysis is the frequency response transfer function plot. This is the ratio of the output response of the car to the input excitation from the shaker. In this experiment, accelerometers are used for both the input and output responses. First, an accelerometer placed directly above the shaker is used to measure the input force felt sent to the car. Second, another accelerometer measures the movement of the car’s response to the shaker. Both accelerometers use a calibration constant to convert the reading to a voltage measurement. 5 Comments: I N T R O D U C T I O N T O S M A L L E X P E R I M E N T A T I O N S C A L E R O A D V I B R A T I O N The data required for this analysis is obtained via the data acquisition system; however, certain calculations need to be performed on the data in order to obtain the appropriate results relevant for analysis. A Matlab file ‘fftmspec’ is used to convert the transfer function input and output data from time domain into frequency domain. This is done by taking the Fourier transfer of the time domain data. The transfer function graph on the GUI plots the magnitude of the input voltage over the magnitude of the output voltage. Any peaks in the transfer function graph represent a ‘resonant frequency’ of the system that will yield a large output response from the car, based on its material characteristics. From an automotive design standpoint, in order to have the lowest possible vibration response at a certain point (i.e. in a passenger seat), the optimal design would have no peaks in the transfer function over the range of frequency values that a car normally operates, thus giving the passenger a smooth ride. Equipment List • MB Dynamics Modal 50A electrodynamic shaker • Amplifier • Amplifier connection cord • Shaker Accessories o Tool kit o Cooling system o Stinger • Alro Racing TKTjunior 1/5th scale car • Support Structure 6 Comments: I N T R O D U C T I O N T O S M A L L E X P E R I M E N T A T I O N S C A L E R O A D V I B R A T I O N o 4 bungee cords • 2 Accelerometers (varying sizes) • 2 Accelerometer connecting cords (black for small accelerometers, white for larger accelerometers) • Glue gun and sticks • Computer running GUI • Laptop running Signal Calc Ace • DAQ software • Signal conditioning board Setup Please see User Manual for experimental setup procedure. Contact facilitator with questions. Procedure 1. Setup the preliminary experimental setup as outlined in the User Manual section entitled ‘Experimental Setup’. Make sure to follow safety considerations. 2. Attach accelerometer to the labeled “A1.” For instructions on how to attach the accelerometer see the “Experimental Setup’ portion of the User Manual. Make sure that the accelerometer is attached to channel 1 of the Signal Conditioning Box. Note: Make sure the accelerometer is attached with wax in a perpendicular Open 3. Matlab 6.5 located on the desktop of the vibrations laboratory computer. The corresponding GUI will popup automatically. It is called “working with hardware” GUI 7 Comments: I N T R O D U C T I O N T O S M A L L E X P E R I M E N T A T I O N S C A L E R O A D V I B R A T I O N 4. On the laptop, double click the ‘SignalCalcAce’ icon located on the desktop. 5. Choose: fileÆopen new. 6. Choose ‘auto power spectra.’ A new window will open. 7. On the bottom left corner of the window, click the ‘generator’ tab. 8. Click ‘active’ box on the first line of information. 9. Choose ‘random’ waveform from the ‘waveform’ pulldown menu. 10. On the left side of the screen, make sure the F-span value is 1000. This sets the frequency range for the data. 11. On the left side of the screen, make sure the ‘lines’ value is the highest it can be. (i.e. move the sliding bar all the way to the right.) 8 Comments: I N T R O D U C T I O N T O S M A L L E X P E R I M E N T A T I O N S C A L E R O A D V I B R A T I O N 12. Click the dark green ‘Init’ button on the top left part of the screen. This initializes the program. 13. The program will ask you to save your data. Do so at this point. The name of the file you choose and where you choose to save the data does not matter. 14. Click the light green ‘start’ button on the top left part of the screen. This generates the signal which will be used to start the shaker. Note: The signal will be generated the entire time during the experiment, however, if it needs to be stopped, click the yellow ‘stop’ button located in the upper left area of the screen. 15. Turn on the amplifier. Begin to slowly and carefully turn the knob on the amplifier. This will start the shaker in motion. Make sure not to turn the amplifier up too quickly or too far. To begin, turn it till two bars can be seen on the amplifier. Before going any higher, consult with the instructor. Note: If you hear a rattling sound while turning up the amplifier this probably means the stinger has broken out of the hot glue on the chassis and will need to be reglued. 16. On the GUI highlight the ‘Enter duration here’ text in the sample duration text box and enter sample duration (2-5 seconds) for the experiment. This is the time that the Data Acquisition System is taking data for. 17. Click the ‘push me’ button on the GUI to begin data acquisition and analysis. 18. Wait a few moments (time equivalent to the sample duration entered) and the graphs related to the data acquisition and analysis will appear on the GUI. 19. Make sure to print these graphs. If needed, use the zoom capability being sure to follow the instructions found in the User Manual. Note: Use Alt+PrintScreen to copy the screen, then open a Word document and paste the graph, then save to desktop. Since you 9 Comments: I N T R O D U C T I O N T O S M A L L E X P E R I M E N T A T I O N S C A L E R O A D V I B R A T I O N cannot access your M drive from this computer you will need to email this file to yourself to print later. 20. Use the “Dismantling Experiment” instructions found in the user manual. Lab Report Write up a lab report following the outline listed below: 1. Title Page: Include name, title of lab, date, semester information 2. Objectives: A brief explanation of the purpose of the experiment 3. Data: If graphs are produced, use a screenshot as a printout. If needed, use the zoom capability being sure to follow the instructions found in the User Manual. Note: Use Alt+PrintScreen to copy the screen, then open a Word document and paste the graph, then save to desktop. Since you cannot access your M drive from this computer you will need to email this file to yourself to print later. 4. Conclusions: Answer the Post Lab Questions Post Lab Questions 1. Describe what is being displayed in each of the three response functions shown on the GUI. 2. What are the first five resonant frequencies for the car? 3. What change in system properties could be made that would have a positive effect in lowering the resonant frequencies of the car? 4. What possible experimental parameters could be altered to improve the accuracy of the experiment/experimental data? 10 Comments: 11